GLOBAL EQUITY CAPITAL MARKETS
26
GLOBAL EQUITY CAPITAL MARKETS LEAGUE TABLES First 3Q 2018 Preliminary as of 20 September 2018
Transcript of GLOBAL EQUITY CAPITAL MARKETS

GLOBAL EQUITY CAPITAL MARKETS LEAGUE TABLES First 3Q 2018 Preliminary as of 20 September 2018
CONTENTS
1. Global market review2. US market review3. Canada market review4. Latin America market review5. EMEA market review6. Asia market review7. Table criteria
DATA SUBMISSIONS AND QUERIES
Bloomberg’s global equity offerings database consists of nearly 87,000 deals (with approximately 43,000 IPOs and over 43,000 additional offerings), and coverage of more than 500 financial advisors and 500 legal advisors.
LEAG<GO> for a full range of league tables
IPO<GO> for Bloomberg’s equity offerings product
Due to the dynamic nature of the Professional Service product, league table rankings may vary between this release and data found on the Bloomberg Professional Service.
GLOBAL EQUITY, EQUITY LINKED & RIGHTS
North America
EMEA
Asia-Pacific
Contact Email Phone
FIRST 3Q 2018 PRELIMINARY AS OF 20 SEPTEMBER 2018
MANAGER RANKINGS
© 2018 Bloomberg Finance L.P. All rights reserved.
+1 646 324 4663 [email protected]
+44 20 3525 0253 [email protected]
Irina Arefyeva
Davide Ruggiero
Zhen Hao Toh +65 6499 2931 [email protected]
Bloomberg PreliminaryGlobalEquity|1st3Q2018
BloombergLeagueTableReports Page1
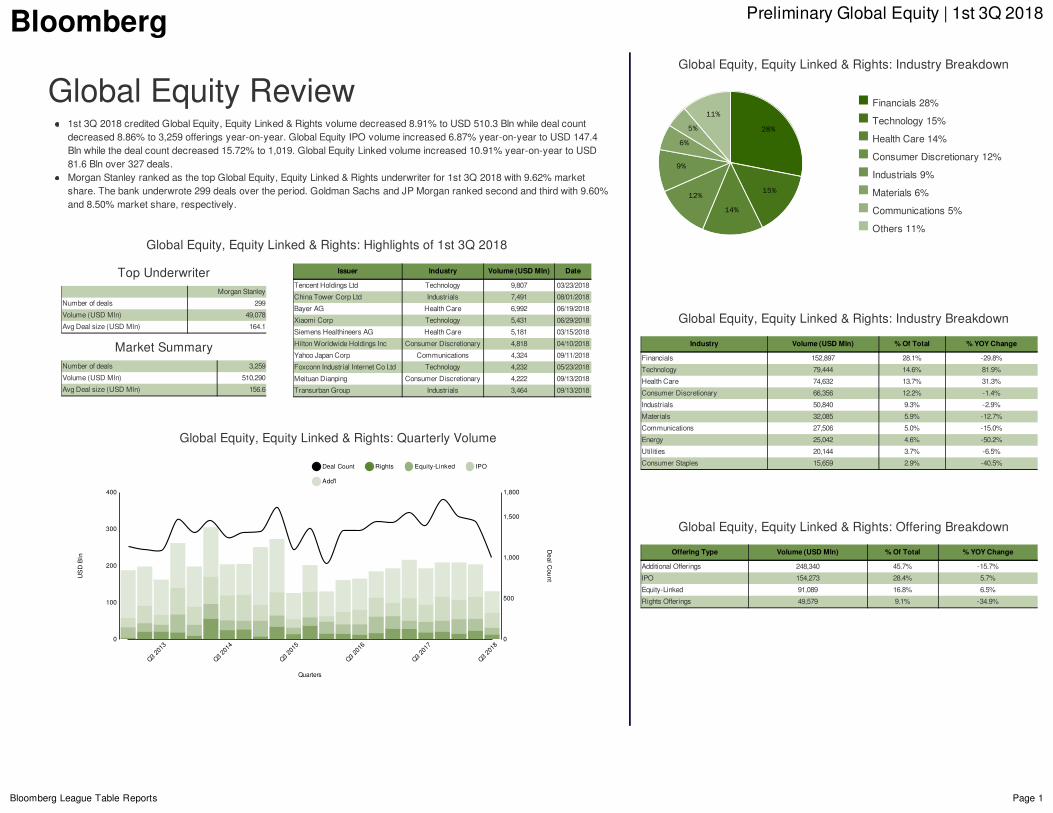
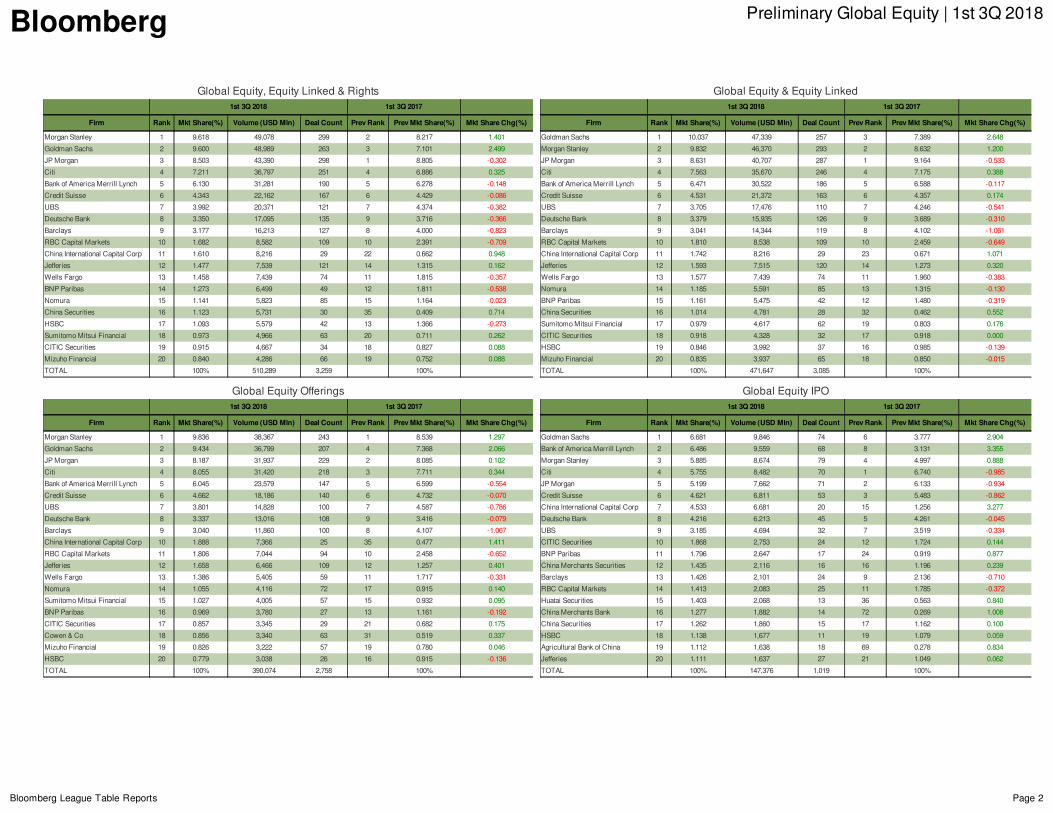
GlobalEquityReview1st3Q2018creditedGlobalEquity,EquityLinked&Rightsvolumedecreased8.91%toUSD510.3Blnwhiledealcountdecreased8.86%to3,259offeringsyear-on-year.GlobalEquityIPOvolumeincreased6.87%year-on-yeartoUSD147.4Blnwhilethedealcountdecreased15.72%to1,019.GlobalEquityLinkedvolumeincreased10.91%year-on-yeartoUSD81.6Blnover327deals.MorganStanleyrankedasthetopGlobalEquity,EquityLinked&Rightsunderwriterfor1st3Q2018with9.62%marketshare.Thebankunderwrote299dealsovertheperiod.GoldmanSachsandJPMorganrankedsecondandthirdwith9.60%and8.50%marketshare,respectively.
GlobalEquity,EquityLinked&Rights:Highlightsof1st3Q2018
GlobalEquity,EquityLinked&Rights:QuarterlyVolume
Q32013
Q32013
Q32014
Q32014
Q32015
Q32015
Q32016
Q32016
Q32017
Q32017
QuartersQuarters
Q32018
Q32018
100100
200200
300300
USDB
lnUSDB
ln
00
400400
500500
1,0001,000
1,5001,500
DealC
ountDealC
ount
00
1,8001,800
DealCount Rights Equity-Linked IPO
Add'l
TopUnderwriterMorganStanley
Numberofdeals 299
Volume(USDMln) 49,078
AvgDealsize(USDMln) 164.1
MarketSummaryNumberofdeals 3,259
Volume(USDMln) 510,290
AvgDealsize(USDMln) 156.6
Issuer Industry Volume(USDMln) Date
TencentHoldingsLtd Technology 9,807 03/23/2018
ChinaTowerCorpLtd Industrials 7,491 08/01/2018
BayerAG HealthCare 6,992 06/19/2018
XiaomiCorp Technology 5,431 06/29/2018
SiemensHealthineersAG HealthCare 5,181 03/15/2018
HiltonWorldwideHoldingsInc ConsumerDiscretionary 4,818 04/10/2018
YahooJapanCorp Communications 4,324 09/11/2018
FoxconnIndustrialInternetCoLtd Technology 4,232 05/23/2018
MeituanDianping ConsumerDiscretionary 4,222 09/13/2018
TransurbanGroup Industrials 3,464 09/13/2018
Financials28%
Technology15%
HealthCare14%
ConsumerDiscretionary12%
Industrials9%
Materials6%
Communications5%
Others11%
GlobalEquity,EquityLinked&Rights:IndustryBreakdown
GlobalEquity,EquityLinked&Rights:IndustryBreakdown
Industry Volume(USDMln) %OfTotal %YOYChange
Financials 152,897 28.1% -29.8%
Technology 79,444 14.6% 81.9%
HealthCare 74,632 13.7% 31.3%
ConsumerDiscretionary 66,356 12.2% -1.4%
Industrials 50,840 9.3% -2.9%
Materials 32,085 5.9% -12.7%
Communications 27,506 5.0% -15.0%
Energy 25,042 4.6% -50.2%
Utilities 20,144 3.7% -6.5%
ConsumerStaples 15,659 2.9% -40.5%
GlobalEquity,EquityLinked&Rights:OfferingBreakdown
OfferingType Volume(USDMln) %OfTotal %YOYChange
AdditionalOfferings 248,340 45.7% -15.7%
IPO 154,273 28.4% 5.7%
Equity-Linked 91,089 16.8% 6.5%
RightsOfferings 49,579 9.1% -34.9%
28%
15%
14%
12%
9%
6%
5%
11%
Bloomberg PreliminaryGlobalEquity|1st3Q2018
BloombergLeagueTableReports Page2
GlobalEquity,EquityLinked&Rights1st3Q2018 1st3Q2017
Firm Rank MktShare(%) Volume(USDMln) DealCount PrevRank PrevMktShare(%) MktShareChg(%)
MorganStanley 1 9.618 49,078 299 2 8.217 1.401
GoldmanSachs 2 9.600 48,989 263 3 7.101 2.499
JPMorgan 3 8.503 43,390 298 1 8.805 -0.302
Citi 4 7.211 36,797 251 4 6.886 0.325
BankofAmericaMerrillLynch 5 6.130 31,281 190 5 6.278 -0.148
CreditSuisse 6 4.343 22,162 167 6 4.429 -0.086
UBS 7 3.992 20,371 121 7 4.374 -0.382
DeutscheBank 8 3.350 17,095 135 9 3.716 -0.366
Barclays 9 3.177 16,213 127 8 4.000 -0.823
RBCCapitalMarkets 10 1.682 8,582 109 10 2.391 -0.709
ChinaInternationalCapitalCorp 11 1.610 8,216 29 22 0.662 0.948
Jefferies 12 1.477 7,539 121 14 1.315 0.162
WellsFargo 13 1.458 7,439 74 11 1.815 -0.357
BNPParibas 14 1.273 6,499 49 12 1.811 -0.538
Nomura 15 1.141 5,823 85 15 1.164 -0.023
ChinaSecurities 16 1.123 5,731 30 35 0.409 0.714
HSBC 17 1.093 5,579 42 13 1.366 -0.273
SumitomoMitsuiFinancial 18 0.973 4,966 63 20 0.711 0.262
CITICSecurities 19 0.915 4,667 34 18 0.827 0.088
MizuhoFinancial 20 0.840 4,286 66 19 0.752 0.088
TOTAL 100% 510,289 3,259 100%
GlobalEquity&EquityLinked1st3Q2018 1st3Q2017
Firm Rank MktShare(%) Volume(USDMln) DealCount PrevRank PrevMktShare(%) MktShareChg(%)
GoldmanSachs 1 10.037 47,339 257 3 7.389 2.648
MorganStanley 2 9.832 46,370 293 2 8.632 1.200
JPMorgan 3 8.631 40,707 287 1 9.164 -0.533
Citi 4 7.563 35,670 246 4 7.175 0.388
BankofAmericaMerrillLynch 5 6.471 30,522 186 5 6.588 -0.117
CreditSuisse 6 4.531 21,372 163 6 4.357 0.174
UBS 7 3.705 17,476 110 7 4.246 -0.541
DeutscheBank 8 3.379 15,935 126 9 3.689 -0.310
Barclays 9 3.041 14,344 119 8 4.102 -1.061
RBCCapitalMarkets 10 1.810 8,538 109 10 2.459 -0.649
ChinaInternationalCapitalCorp 11 1.742 8,216 29 23 0.671 1.071
Jefferies 12 1.593 7,515 120 14 1.273 0.320
WellsFargo 13 1.577 7,439 74 11 1.960 -0.383
Nomura 14 1.185 5,591 85 13 1.315 -0.130
BNPParibas 15 1.161 5,475 42 12 1.480 -0.319
ChinaSecurities 16 1.014 4,781 28 32 0.462 0.552
SumitomoMitsuiFinancial 17 0.979 4,617 62 19 0.803 0.176
CITICSecurities 18 0.918 4,328 32 17 0.918 0.000
HSBC 19 0.846 3,992 37 16 0.985 -0.139
MizuhoFinancial 20 0.835 3,937 65 18 0.850 -0.015
TOTAL 100% 471,647 3,085 100%
GlobalEquityOfferings1st3Q2018 1st3Q2017
Firm Rank MktShare(%) Volume(USDMln) DealCount PrevRank PrevMktShare(%) MktShareChg(%)
MorganStanley 1 9.836 38,367 243 1 8.539 1.297
GoldmanSachs 2 9.434 36,799 207 4 7.368 2.066
JPMorgan 3 8.187 31,937 229 2 8.085 0.102
Citi 4 8.055 31,420 218 3 7.711 0.344
BankofAmericaMerrillLynch 5 6.045 23,579 147 5 6.599 -0.554
CreditSuisse 6 4.662 18,186 140 6 4.732 -0.070
UBS 7 3.801 14,828 100 7 4.587 -0.786
DeutscheBank 8 3.337 13,016 108 9 3.416 -0.079
Barclays 9 3.040 11,860 100 8 4.107 -1.067
ChinaInternationalCapitalCorp 10 1.888 7,366 25 35 0.477 1.411
RBCCapitalMarkets 11 1.806 7,044 94 10 2.458 -0.652
Jefferies 12 1.658 6,466 109 12 1.257 0.401
WellsFargo 13 1.386 5,405 59 11 1.717 -0.331
Nomura 14 1.055 4,116 72 17 0.915 0.140
SumitomoMitsuiFinancial 15 1.027 4,005 57 15 0.932 0.095
BNPParibas 16 0.969 3,780 27 13 1.161 -0.192
CITICSecurities 17 0.857 3,345 29 21 0.682 0.175
Cowen&Co 18 0.856 3,340 63 31 0.519 0.337
MizuhoFinancial 19 0.826 3,222 57 19 0.780 0.046
HSBC 20 0.779 3,038 26 16 0.915 -0.136
TOTAL 100% 390,074 2,758 100%
GlobalEquityIPO1st3Q2018 1st3Q2017
Firm Rank MktShare(%) Volume(USDMln) DealCount PrevRank PrevMktShare(%) MktShareChg(%)
GoldmanSachs 1 6.681 9,846 74 6 3.777 2.904
BankofAmericaMerrillLynch 2 6.486 9,559 68 8 3.131 3.355
MorganStanley 3 5.885 8,674 79 4 4.997 0.888
Citi 4 5.755 8,482 70 1 6.740 -0.985
JPMorgan 5 5.199 7,662 71 2 6.133 -0.934
CreditSuisse 6 4.621 6,811 53 3 5.483 -0.862
ChinaInternationalCapitalCorp 7 4.533 6,681 20 15 1.256 3.277
DeutscheBank 8 4.216 6,213 45 5 4.261 -0.045
UBS 9 3.185 4,694 32 7 3.519 -0.334
CITICSecurities 10 1.868 2,753 24 12 1.724 0.144
BNPParibas 11 1.796 2,647 17 24 0.919 0.877
ChinaMerchantsSecurities 12 1.435 2,116 16 16 1.196 0.239
Barclays 13 1.426 2,101 24 9 2.136 -0.710
RBCCapitalMarkets 14 1.413 2,083 25 11 1.785 -0.372
HuataiSecurities 15 1.403 2,068 13 36 0.563 0.840
ChinaMerchantsBank 16 1.277 1,882 14 72 0.269 1.008
ChinaSecurities 17 1.262 1,860 15 17 1.162 0.100
HSBC 18 1.138 1,677 11 19 1.079 0.059
AgriculturalBankofChina 19 1.112 1,638 18 69 0.278 0.834
Jefferies 20 1.111 1,637 27 21 1.049 0.062
TOTAL 100% 147,376 1,019 100%
Bloomberg PreliminaryGlobalEquity|1st3Q2018
BloombergLeagueTableReports Page3
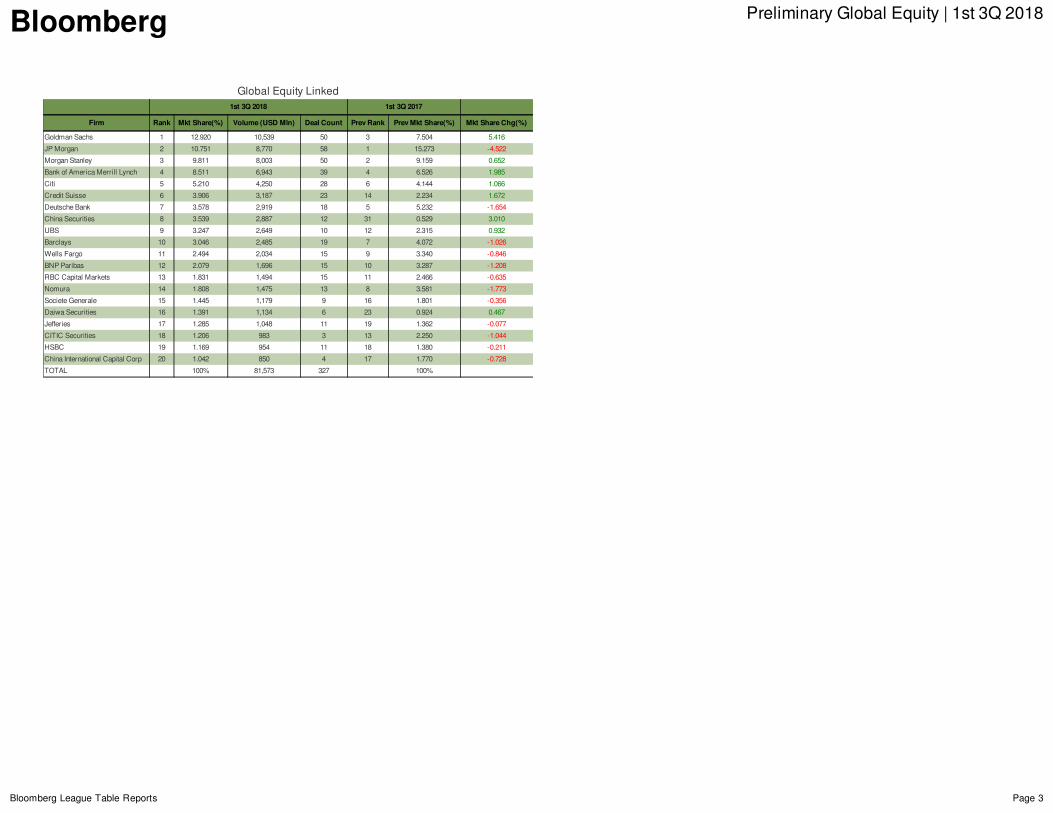
GlobalEquityLinked1st3Q2018 1st3Q2017
Firm Rank MktShare(%) Volume(USDMln) DealCount PrevRank PrevMktShare(%) MktShareChg(%)
GoldmanSachs 1 12.920 10,539 50 3 7.504 5.416
JPMorgan 2 10.751 8,770 58 1 15.273 -4.522
MorganStanley 3 9.811 8,003 50 2 9.159 0.652
BankofAmericaMerrillLynch 4 8.511 6,943 39 4 6.526 1.985
Citi 5 5.210 4,250 28 6 4.144 1.066
CreditSuisse 6 3.906 3,187 23 14 2.234 1.672
DeutscheBank 7 3.578 2,919 18 5 5.232 -1.654
ChinaSecurities 8 3.539 2,887 12 31 0.529 3.010
UBS 9 3.247 2,649 10 12 2.315 0.932
Barclays 10 3.046 2,485 19 7 4.072 -1.026
WellsFargo 11 2.494 2,034 15 9 3.340 -0.846
BNPParibas 12 2.079 1,696 15 10 3.287 -1.208
RBCCapitalMarkets 13 1.831 1,494 15 11 2.466 -0.635
Nomura 14 1.808 1,475 13 8 3.581 -1.773
SocieteGenerale 15 1.445 1,179 9 16 1.801 -0.356
DaiwaSecurities 16 1.391 1,134 6 23 0.924 0.467
Jefferies 17 1.285 1,048 11 19 1.362 -0.077
CITICSecurities 18 1.206 983 3 13 2.250 -1.044
HSBC 19 1.169 954 11 18 1.380 -0.211
ChinaInternationalCapitalCorp 20 1.042 850 4 17 1.770 -0.728
TOTAL 100% 81,573 327 100%
Bloomberg PreliminaryGlobalEquity|1st3Q2018
BloombergLeagueTableReports Page4
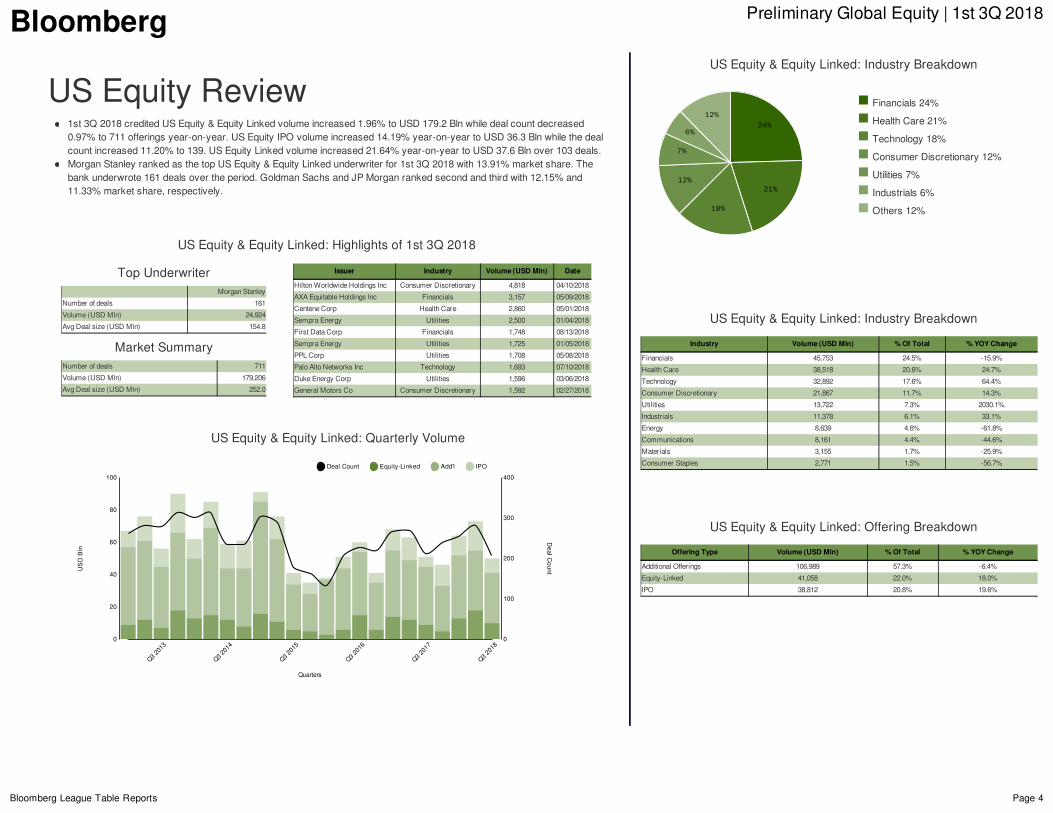
USEquityReview1st3Q2018creditedUSEquity&EquityLinkedvolumeincreased1.96%toUSD179.2Blnwhiledealcountdecreased0.97%to711offeringsyear-on-year.USEquityIPOvolumeincreased14.19%year-on-yeartoUSD36.3Blnwhilethedealcountincreased11.20%to139.USEquityLinkedvolumeincreased21.64%year-on-yeartoUSD37.6Blnover103deals.MorganStanleyrankedasthetopUSEquity&EquityLinkedunderwriterfor1st3Q2018with13.91%marketshare.Thebankunderwrote161dealsovertheperiod.GoldmanSachsandJPMorganrankedsecondandthirdwith12.15%and11.33%marketshare,respectively.
USEquity&EquityLinked:Highlightsof1st3Q2018
USEquity&EquityLinked:QuarterlyVolume
Q32013
Q32013
Q32014
Q32014
Q32015
Q32015
Q32016
Q32016
Q32017
Q32017
QuartersQuarters
Q32018
Q32018
2020
4040
6060
8080
USDB
lnUSDB
ln
00
100100
100100
200200
300300
DealC
ountDealC
ount
00
400400
DealCount Equity-Linked Add'l IPO
TopUnderwriterMorganStanley
Numberofdeals 161
Volume(USDMln) 24,924
AvgDealsize(USDMln) 154.8
MarketSummaryNumberofdeals 711
Volume(USDMln) 179,206
AvgDealsize(USDMln) 252.0
Issuer Industry Volume(USDMln) Date
HiltonWorldwideHoldingsInc ConsumerDiscretionary 4,818 04/10/2018
AXAEquitableHoldingsInc Financials 3,157 05/09/2018
CenteneCorp HealthCare 2,860 05/01/2018
SempraEnergy Utilities 2,500 01/04/2018
FirstDataCorp Financials 1,748 08/13/2018
SempraEnergy Utilities 1,725 01/05/2018
PPLCorp Utilities 1,708 05/08/2018
PaloAltoNetworksInc Technology 1,693 07/10/2018
DukeEnergyCorp Utilities 1,596 03/06/2018
GeneralMotorsCo ConsumerDiscretionary 1,592 02/27/2018
Financials24%
HealthCare21%
Technology18%
ConsumerDiscretionary12%
Utilities7%
Industrials6%
Others12%
USEquity&EquityLinked:IndustryBreakdown
USEquity&EquityLinked:IndustryBreakdown
Industry Volume(USDMln) %OfTotal %YOYChange
Financials 45,753 24.5% -15.9%
HealthCare 38,518 20.6% 24.7%
Technology 32,892 17.6% 64.4%
ConsumerDiscretionary 21,867 11.7% 14.3%
Utilities 13,722 7.3% 2030.1%
Industrials 11,378 6.1% 33.1%
Energy 8,639 4.6% -61.8%
Communications 8,161 4.4% -44.6%
Materials 3,155 1.7% -25.9%
ConsumerStaples 2,771 1.5% -56.7%
USEquity&EquityLinked:OfferingBreakdown
OfferingType Volume(USDMln) %OfTotal %YOYChange
AdditionalOfferings 106,989 57.3% -6.4%
Equity-Linked 41,058 22.0% 18.0%
IPO 38,812 20.8% 19.6%
24%
21%
18%
12%
7%
6%
12%
Bloomberg PreliminaryGlobalEquity|1st3Q2018
BloombergLeagueTableReports Page5
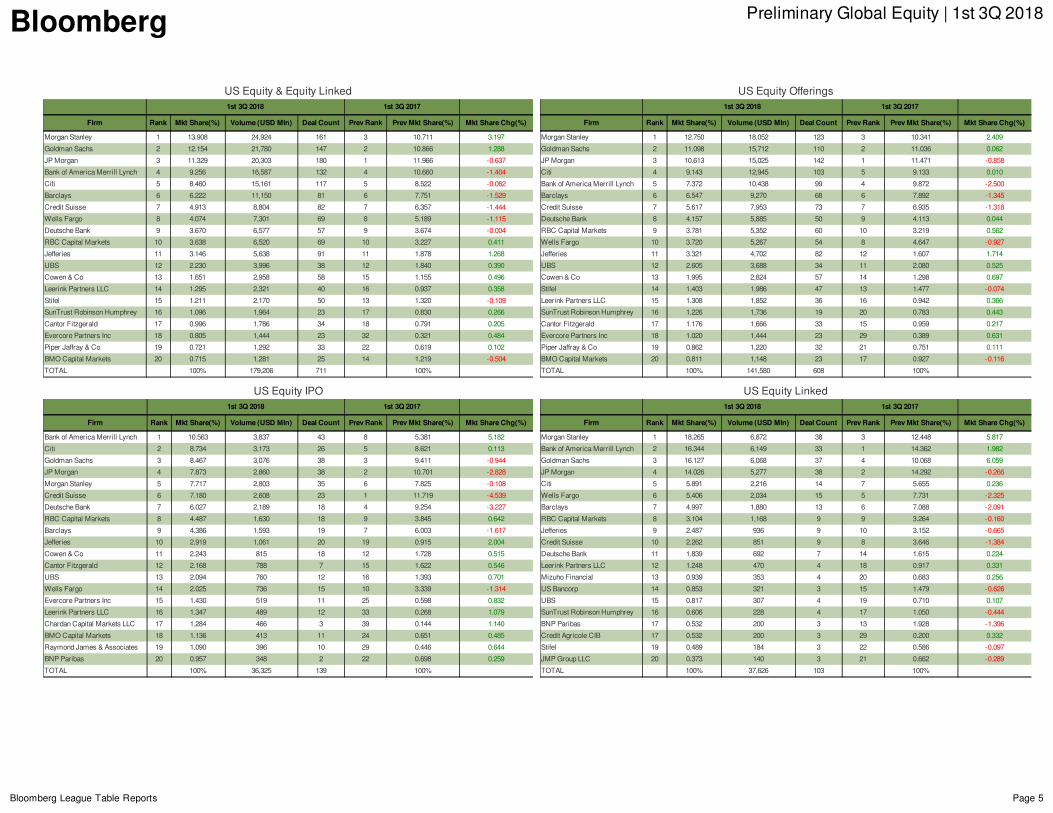
USEquity&EquityLinked1st3Q2018 1st3Q2017
Firm Rank MktShare(%) Volume(USDMln) DealCount PrevRank PrevMktShare(%) MktShareChg(%)
MorganStanley 1 13.908 24,924 161 3 10.711 3.197
GoldmanSachs 2 12.154 21,780 147 2 10.866 1.288
JPMorgan 3 11.329 20,303 180 1 11.966 -0.637
BankofAmericaMerrillLynch 4 9.256 16,587 132 4 10.660 -1.404
Citi 5 8.460 15,161 117 5 8.522 -0.062
Barclays 6 6.222 11,150 81 6 7.751 -1.529
CreditSuisse 7 4.913 8,804 82 7 6.357 -1.444
WellsFargo 8 4.074 7,301 69 8 5.189 -1.115
DeutscheBank 9 3.670 6,577 57 9 3.674 -0.004
RBCCapitalMarkets 10 3.638 6,520 69 10 3.227 0.411
Jefferies 11 3.146 5,638 91 11 1.878 1.268
UBS 12 2.230 3,996 38 12 1.840 0.390
Cowen&Co 13 1.651 2,958 58 15 1.155 0.496
LeerinkPartnersLLC 14 1.295 2,321 40 16 0.937 0.358
Stifel 15 1.211 2,170 50 13 1.320 -0.109
SunTrustRobinsonHumphrey 16 1.096 1,964 23 17 0.830 0.266
CantorFitzgerald 17 0.996 1,786 34 18 0.791 0.205
EvercorePartnersInc 18 0.805 1,444 23 32 0.321 0.484
PiperJaffray&Co 19 0.721 1,292 33 22 0.619 0.102
BMOCapitalMarkets 20 0.715 1,281 25 14 1.219 -0.504
TOTAL 100% 179,206 711 100%
USEquityOfferings1st3Q2018 1st3Q2017
Firm Rank MktShare(%) Volume(USDMln) DealCount PrevRank PrevMktShare(%) MktShareChg(%)
MorganStanley 1 12.750 18,052 123 3 10.341 2.409
GoldmanSachs 2 11.098 15,712 110 2 11.036 0.062
JPMorgan 3 10.613 15,025 142 1 11.471 -0.858
Citi 4 9.143 12,945 103 5 9.133 0.010
BankofAmericaMerrillLynch 5 7.372 10,438 99 4 9.872 -2.500
Barclays 6 6.547 9,270 68 6 7.892 -1.345
CreditSuisse 7 5.617 7,953 73 7 6.935 -1.318
DeutscheBank 8 4.157 5,885 50 9 4.113 0.044
RBCCapitalMarkets 9 3.781 5,352 60 10 3.219 0.562
WellsFargo 10 3.720 5,267 54 8 4.647 -0.927
Jefferies 11 3.321 4,702 82 12 1.607 1.714
UBS 12 2.605 3,688 34 11 2.080 0.525
Cowen&Co 13 1.995 2,824 57 14 1.298 0.697
Stifel 14 1.403 1,986 47 13 1.477 -0.074
LeerinkPartnersLLC 15 1.308 1,852 36 16 0.942 0.366
SunTrustRobinsonHumphrey 16 1.226 1,736 19 20 0.783 0.443
CantorFitzgerald 17 1.176 1,666 33 15 0.959 0.217
EvercorePartnersInc 18 1.020 1,444 23 29 0.389 0.631
PiperJaffray&Co 19 0.862 1,220 32 21 0.751 0.111
BMOCapitalMarkets 20 0.811 1,148 23 17 0.927 -0.116
TOTAL 100% 141,580 608 100%
USEquityIPO1st3Q2018 1st3Q2017
Firm Rank MktShare(%) Volume(USDMln) DealCount PrevRank PrevMktShare(%) MktShareChg(%)
BankofAmericaMerrillLynch 1 10.563 3,837 43 8 5.381 5.182
Citi 2 8.734 3,173 26 5 8.621 0.113
GoldmanSachs 3 8.467 3,076 38 3 9.411 -0.944
JPMorgan 4 7.873 2,860 38 2 10.701 -2.828
MorganStanley 5 7.717 2,803 35 6 7.825 -0.108
CreditSuisse 6 7.180 2,608 23 1 11.719 -4.539
DeutscheBank 7 6.027 2,189 18 4 9.254 -3.227
RBCCapitalMarkets 8 4.487 1,630 18 9 3.845 0.642
Barclays 9 4.386 1,593 19 7 6.003 -1.617
Jefferies 10 2.919 1,061 20 19 0.915 2.004
Cowen&Co 11 2.243 815 18 12 1.728 0.515
CantorFitzgerald 12 2.168 788 7 15 1.622 0.546
UBS 13 2.094 760 12 16 1.393 0.701
WellsFargo 14 2.025 736 15 10 3.339 -1.314
EvercorePartnersInc 15 1.430 519 11 25 0.598 0.832
LeerinkPartnersLLC 16 1.347 489 12 33 0.268 1.079
ChardanCapitalMarketsLLC 17 1.284 466 3 39 0.144 1.140
BMOCapitalMarkets 18 1.136 413 11 24 0.651 0.485
RaymondJames&Associates 19 1.090 396 10 29 0.446 0.644
BNPParibas 20 0.957 348 2 22 0.698 0.259
TOTAL 100% 36,325 139 100%
USEquityLinked1st3Q2018 1st3Q2017
Firm Rank MktShare(%) Volume(USDMln) DealCount PrevRank PrevMktShare(%) MktShareChg(%)
MorganStanley 1 18.265 6,872 38 3 12.448 5.817
BankofAmericaMerrillLynch 2 16.344 6,149 33 1 14.362 1.982
GoldmanSachs 3 16.127 6,068 37 4 10.068 6.059
JPMorgan 4 14.026 5,277 38 2 14.292 -0.266
Citi 5 5.891 2,216 14 7 5.655 0.236
WellsFargo 6 5.406 2,034 15 5 7.731 -2.325
Barclays 7 4.997 1,880 13 6 7.088 -2.091
RBCCapitalMarkets 8 3.104 1,168 9 9 3.264 -0.160
Jefferies 9 2.487 936 9 10 3.152 -0.665
CreditSuisse 10 2.262 851 9 8 3.646 -1.384
DeutscheBank 11 1.839 692 7 14 1.615 0.224
LeerinkPartnersLLC 12 1.248 470 4 18 0.917 0.331
MizuhoFinancial 13 0.939 353 4 20 0.683 0.256
USBancorp 14 0.853 321 3 15 1.479 -0.626
UBS 15 0.817 307 4 19 0.710 0.107
SunTrustRobinsonHumphrey 16 0.606 228 4 17 1.050 -0.444
BNPParibas 17 0.532 200 3 13 1.928 -1.396
CreditAgricoleCIB 17 0.532 200 3 29 0.200 0.332
Stifel 19 0.489 184 3 22 0.586 -0.097
JMPGroupLLC 20 0.373 140 3 21 0.662 -0.289
TOTAL 100% 37,626 103 100%
Bloomberg PreliminaryGlobalEquity|1st3Q2018
BloombergLeagueTableReports Page6
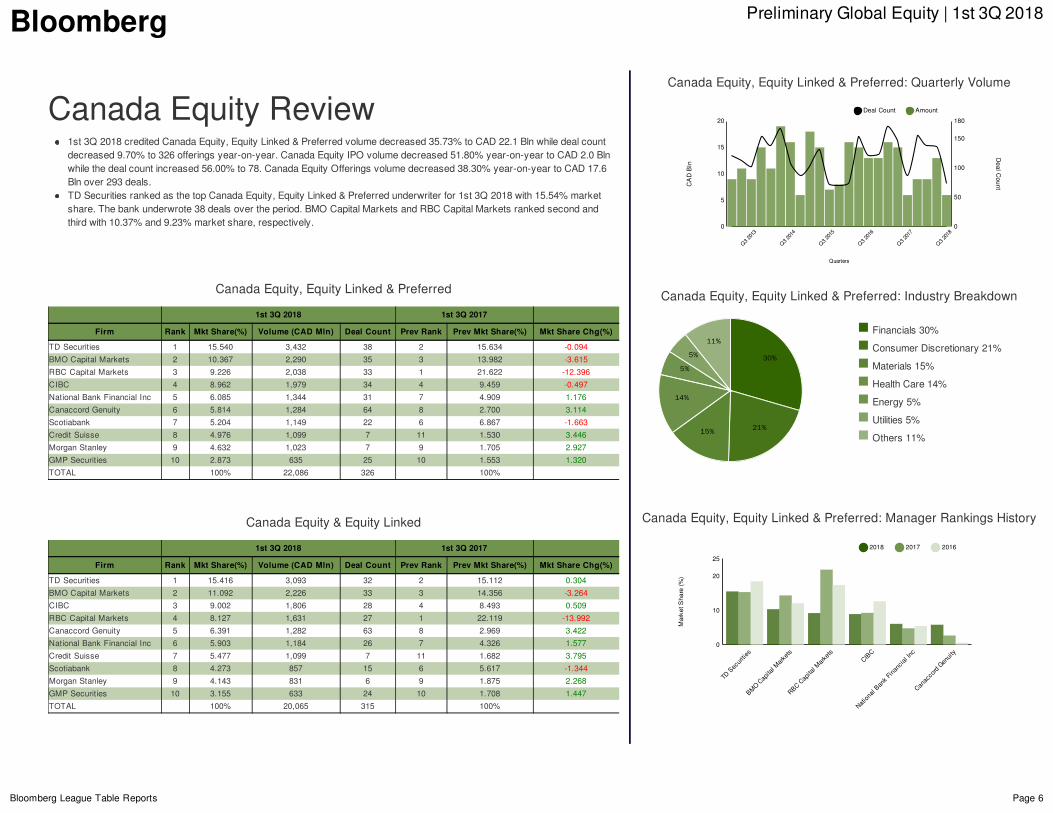
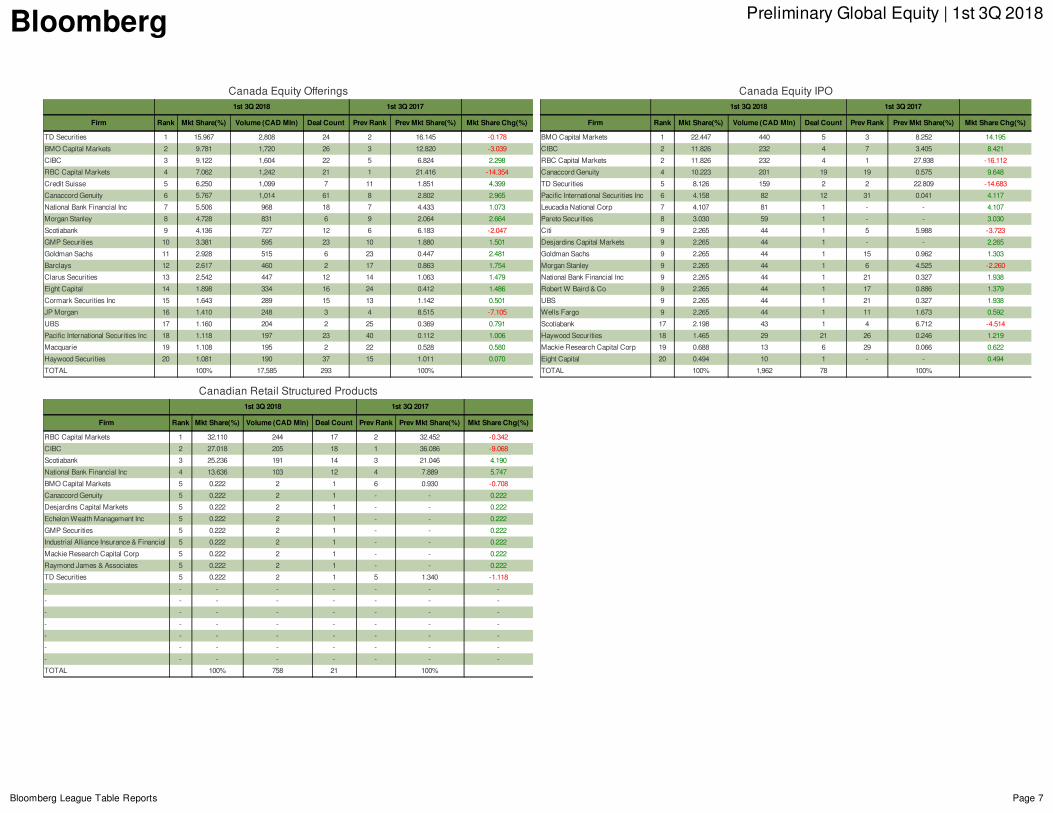
CanadaEquityReview1st3Q2018creditedCanadaEquity,EquityLinked&Preferredvolumedecreased35.73%toCAD22.1Blnwhiledealcountdecreased9.70%to326offeringsyear-on-year.CanadaEquityIPOvolumedecreased51.80%year-on-yeartoCAD2.0Blnwhilethedealcountincreased56.00%to78.CanadaEquityOfferingsvolumedecreased38.30%year-on-yeartoCAD17.6Blnover293deals.TDSecuritiesrankedasthetopCanadaEquity,EquityLinked&Preferredunderwriterfor1st3Q2018with15.54%marketshare.Thebankunderwrote38dealsovertheperiod.BMOCapitalMarketsandRBCCapitalMarketsrankedsecondandthirdwith10.37%and9.23%marketshare,respectively.
CanadaEquity,EquityLinked&Preferred
1st3Q2018 1st3Q2017
Firm Rank MktShare(%) Volume(CADMln) DealCount PrevRank PrevMktShare(%) MktShareChg(%)
TDSecurities 1 15.540 3,432 38 2 15.634 -0.094
BMOCapitalMarkets 2 10.367 2,290 35 3 13.982 -3.615
RBCCapitalMarkets 3 9.226 2,038 33 1 21.622 -12.396
CIBC 4 8.962 1,979 34 4 9.459 -0.497
NationalBankFinancialInc 5 6.085 1,344 31 7 4.909 1.176
CanaccordGenuity 6 5.814 1,284 64 8 2.700 3.114
Scotiabank 7 5.204 1,149 22 6 6.867 -1.663
CreditSuisse 8 4.976 1,099 7 11 1.530 3.446
MorganStanley 9 4.632 1,023 7 9 1.705 2.927
GMPSecurities 10 2.873 635 25 10 1.553 1.320
TOTAL 100% 22,086 326 100%
CanadaEquity&EquityLinked
1st3Q2018 1st3Q2017
Firm Rank MktShare(%) Volume(CADMln) DealCount PrevRank PrevMktShare(%) MktShareChg(%)
TDSecurities 1 15.416 3,093 32 2 15.112 0.304
BMOCapitalMarkets 2 11.092 2,226 33 3 14.356 -3.264
CIBC 3 9.002 1,806 28 4 8.493 0.509
RBCCapitalMarkets 4 8.127 1,631 27 1 22.119 -13.992
CanaccordGenuity 5 6.391 1,282 63 8 2.969 3.422
NationalBankFinancialInc 6 5.903 1,184 26 7 4.326 1.577
CreditSuisse 7 5.477 1,099 7 11 1.682 3.795
Scotiabank 8 4.273 857 15 6 5.617 -1.344
MorganStanley 9 4.143 831 6 9 1.875 2.268
GMPSecurities 10 3.155 633 24 10 1.708 1.447
TOTAL 100% 20,065 315 100%
Financials30%
ConsumerDiscretionary21%
Materials15%
HealthCare14%
Energy5%
Utilities5%
Others11%
CanadaEquity,EquityLinked&Preferred:QuarterlyVolume
Q32013
Q32013
Q32014
Q32014
Q32015
Q32015
Q32016
Q32016
Q32017
Q32017
QuartersQuarters
Q32018
Q32018
55
1010
1515
CADB
lnCADB
ln
00
2020
5050
100100
150150
DealC
ountDealC
ount
00
180180
DealCount Amount
CanadaEquity,EquityLinked&Preferred:IndustryBreakdown
30%
21%15%
14%
5%
5%
11%
CanadaEquity,EquityLinked&Preferred:ManagerRankingsHistory
TDSecurities
BMOCapitalMa
rkets
RBCCapitalMa
rkets
CIBC
NationalBankF
inancialInc
Canaccord
Genuity
10
20
Marke
tSha
re(%
)
0
25
2018 2017 2016
Bloomberg PreliminaryGlobalEquity|1st3Q2018
BloombergLeagueTableReports Page7
CanadaEquityOfferings1st3Q2018 1st3Q2017
Firm Rank MktShare(%) Volume(CADMln) DealCount PrevRank PrevMktShare(%) MktShareChg(%)
TDSecurities 1 15.967 2,808 24 2 16.145 -0.178
BMOCapitalMarkets 2 9.781 1,720 26 3 12.820 -3.039
CIBC 3 9.122 1,604 22 5 6.824 2.298
RBCCapitalMarkets 4 7.062 1,242 21 1 21.416 -14.354
CreditSuisse 5 6.250 1,099 7 11 1.851 4.399
CanaccordGenuity 6 5.767 1,014 61 8 2.802 2.965
NationalBankFinancialInc 7 5.506 968 18 7 4.433 1.073
MorganStanley 8 4.728 831 6 9 2.064 2.664
Scotiabank 9 4.136 727 12 6 6.183 -2.047
GMPSecurities 10 3.381 595 23 10 1.880 1.501
GoldmanSachs 11 2.928 515 6 23 0.447 2.481
Barclays 12 2.617 460 2 17 0.863 1.754
ClarusSecurities 13 2.542 447 12 14 1.063 1.479
EightCapital 14 1.898 334 16 24 0.412 1.486
CormarkSecuritiesInc 15 1.643 289 15 13 1.142 0.501
JPMorgan 16 1.410 248 3 4 8.515 -7.105
UBS 17 1.160 204 2 25 0.369 0.791
PacificInternationalSecuritiesInc 18 1.118 197 23 40 0.112 1.006
Macquarie 19 1.108 195 2 22 0.528 0.580
HaywoodSecurities 20 1.081 190 37 15 1.011 0.070
TOTAL 100% 17,585 293 100%
CanadaEquityIPO1st3Q2018 1st3Q2017
Firm Rank MktShare(%) Volume(CADMln) DealCount PrevRank PrevMktShare(%) MktShareChg(%)
BMOCapitalMarkets 1 22.447 440 5 3 8.252 14.195
CIBC 2 11.826 232 4 7 3.405 8.421
RBCCapitalMarkets 2 11.826 232 4 1 27.938 -16.112
CanaccordGenuity 4 10.223 201 19 19 0.575 9.648
TDSecurities 5 8.126 159 2 2 22.809 -14.683
PacificInternationalSecuritiesInc 6 4.158 82 12 31 0.041 4.117
LeucadiaNationalCorp 7 4.107 81 1 - - 4.107
ParetoSecurities 8 3.030 59 1 - - 3.030
Citi 9 2.265 44 1 5 5.988 -3.723
DesjardinsCapitalMarkets 9 2.265 44 1 - - 2.265
GoldmanSachs 9 2.265 44 1 15 0.962 1.303
MorganStanley 9 2.265 44 1 6 4.525 -2.260
NationalBankFinancialInc 9 2.265 44 1 21 0.327 1.938
RobertWBaird&Co 9 2.265 44 1 17 0.886 1.379
UBS 9 2.265 44 1 21 0.327 1.938
WellsFargo 9 2.265 44 1 11 1.673 0.592
Scotiabank 17 2.198 43 1 4 6.712 -4.514
HaywoodSecurities 18 1.465 29 21 26 0.246 1.219
MackieResearchCapitalCorp 19 0.688 13 6 29 0.066 0.622
EightCapital 20 0.494 10 1 - - 0.494
TOTAL 100% 1,962 78 100%
CanadianRetailStructuredProducts1st3Q2018 1st3Q2017
Firm Rank MktShare(%) Volume(CADMln) DealCount PrevRank PrevMktShare(%) MktShareChg(%)
RBCCapitalMarkets 1 32.110 244 17 2 32.452 -0.342
CIBC 2 27.018 205 18 1 36.086 -9.068
Scotiabank 3 25.236 191 14 3 21.046 4.190
NationalBankFinancialInc 4 13.636 103 12 4 7.889 5.747
BMOCapitalMarkets 5 0.222 2 1 6 0.930 -0.708
CanaccordGenuity 5 0.222 2 1 - - 0.222
DesjardinsCapitalMarkets 5 0.222 2 1 - - 0.222
EchelonWealthManagementInc 5 0.222 2 1 - - 0.222
GMPSecurities 5 0.222 2 1 - - 0.222
IndustrialAllianceInsurance&Financial 5 0.222 2 1 - - 0.222
MackieResearchCapitalCorp 5 0.222 2 1 - - 0.222
RaymondJames&Associates 5 0.222 2 1 - - 0.222
TDSecurities 5 0.222 2 1 5 1.340 -1.118
- - - - - - - -
- - - - - - - -
- - - - - - - -
- - - - - - - -
- - - - - - - -
- - - - - - - -
- - - - - - - -
TOTAL 100% 758 21 100%
Bloomberg PreliminaryGlobalEquity|1st3Q2018
BloombergLeagueTableReports Page8
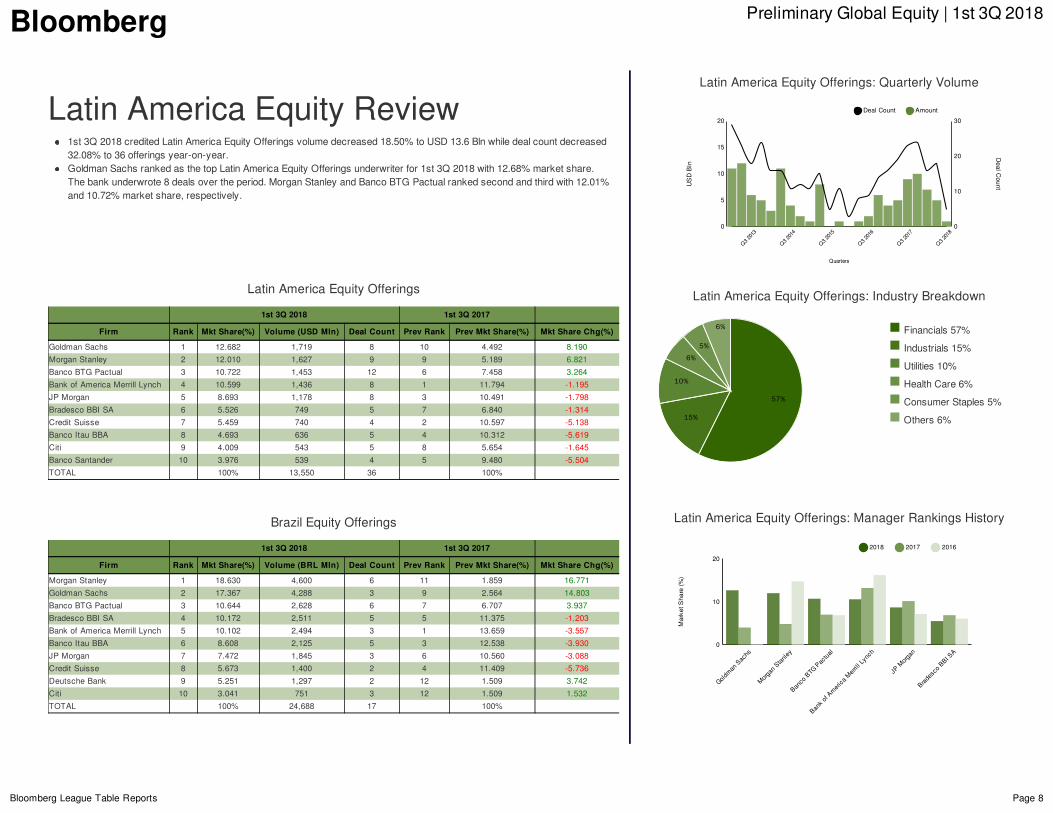
LatinAmericaEquityReview1st3Q2018creditedLatinAmericaEquityOfferingsvolumedecreased18.50%toUSD13.6Blnwhiledealcountdecreased32.08%to36offeringsyear-on-year.GoldmanSachsrankedasthetopLatinAmericaEquityOfferingsunderwriterfor1st3Q2018with12.68%marketshare.Thebankunderwrote8dealsovertheperiod.MorganStanleyandBancoBTGPactualrankedsecondandthirdwith12.01%and10.72%marketshare,respectively.
LatinAmericaEquityOfferings
1st3Q2018 1st3Q2017
Firm Rank MktShare(%) Volume(USDMln) DealCount PrevRank PrevMktShare(%) MktShareChg(%)
GoldmanSachs 1 12.682 1,719 8 10 4.492 8.190
MorganStanley 2 12.010 1,627 9 9 5.189 6.821
BancoBTGPactual 3 10.722 1,453 12 6 7.458 3.264
BankofAmericaMerrillLynch 4 10.599 1,436 8 1 11.794 -1.195
JPMorgan 5 8.693 1,178 8 3 10.491 -1.798
BradescoBBISA 6 5.526 749 5 7 6.840 -1.314
CreditSuisse 7 5.459 740 4 2 10.597 -5.138
BancoItauBBA 8 4.693 636 5 4 10.312 -5.619
Citi 9 4.009 543 5 8 5.654 -1.645
BancoSantander 10 3.976 539 4 5 9.480 -5.504
TOTAL 100% 13,550 36 100%
BrazilEquityOfferings
1st3Q2018 1st3Q2017
Firm Rank MktShare(%) Volume(BRLMln) DealCount PrevRank PrevMktShare(%) MktShareChg(%)
MorganStanley 1 18.630 4,600 6 11 1.859 16.771
GoldmanSachs 2 17.367 4,288 3 9 2.564 14.803
BancoBTGPactual 3 10.644 2,628 6 7 6.707 3.937
BradescoBBISA 4 10.172 2,511 5 5 11.375 -1.203
BankofAmericaMerrillLynch 5 10.102 2,494 3 1 13.659 -3.557
BancoItauBBA 6 8.608 2,125 5 3 12.538 -3.930
JPMorgan 7 7.472 1,845 3 6 10.560 -3.088
CreditSuisse 8 5.673 1,400 2 4 11.409 -5.736
DeutscheBank 9 5.251 1,297 2 12 1.509 3.742
Citi 10 3.041 751 3 12 1.509 1.532
TOTAL 100% 24,688 17 100%
Financials57%
Industrials15%
Utilities10%
HealthCare6%
ConsumerStaples5%
Others6%
LatinAmericaEquityOfferings:QuarterlyVolume
Q32013
Q32013
Q32014
Q32014
Q32015
Q32015
Q32016
Q32016
Q32017
Q32017
QuartersQuarters
Q32018
Q32018
55
1010
1515
USDB
lnUSDB
ln
00
2020
1010
2020 DealC
ountDealC
ount
00
3030
DealCount Amount
LatinAmericaEquityOfferings:IndustryBreakdown
57%
15%
10%
6%
5%
6%
LatinAmericaEquityOfferings:ManagerRankingsHistory
Goldm
anSachs
Morga
nStan
ley
BancoB
TGPactua
l
BankofAme
ricaM
errillLynch
JPMorg
an
BradescoBBISA
10
Marke
tSha
re(%
)
0
20
2018 2017 2016
Bloomberg PreliminaryGlobalEquity|1st3Q2018
BloombergLeagueTableReports Page9
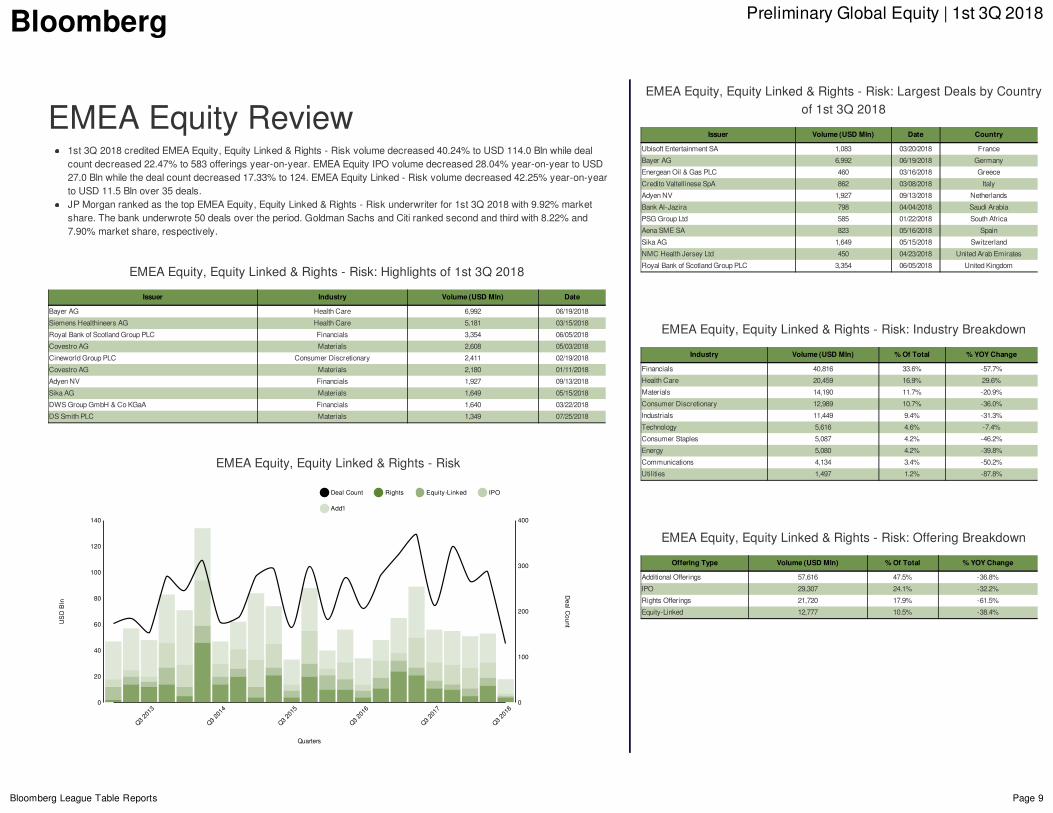
EMEAEquityReview1st3Q2018creditedEMEAEquity,EquityLinked&Rights-Riskvolumedecreased40.24%toUSD114.0Blnwhiledealcountdecreased22.47%to583offeringsyear-on-year.EMEAEquityIPOvolumedecreased28.04%year-on-yeartoUSD27.0Blnwhilethedealcountdecreased17.33%to124.EMEAEquityLinked-Riskvolumedecreased42.25%year-on-yeartoUSD11.5Blnover35deals.JPMorganrankedasthetopEMEAEquity,EquityLinked&Rights-Riskunderwriterfor1st3Q2018with9.92%marketshare.Thebankunderwrote50dealsovertheperiod.GoldmanSachsandCitirankedsecondandthirdwith8.22%and7.90%marketshare,respectively.
EMEAEquity,EquityLinked&Rights-Risk:Highlightsof1st3Q2018
Issuer Industry Volume(USDMln) Date
BayerAG HealthCare 6,992 06/19/2018
SiemensHealthineersAG HealthCare 5,181 03/15/2018
RoyalBankofScotlandGroupPLC Financials 3,354 06/05/2018
CovestroAG Materials 2,608 05/03/2018
CineworldGroupPLC ConsumerDiscretionary 2,411 02/19/2018
CovestroAG Materials 2,180 01/11/2018
AdyenNV Financials 1,927 09/13/2018
SikaAG Materials 1,649 05/15/2018
DWSGroupGmbH&CoKGaA Financials 1,640 03/22/2018
DSSmithPLC Materials 1,349 07/25/2018
EMEAEquity,EquityLinked&Rights-Risk
Q32013
Q32013
Q32014
Q32014
Q32015
Q32015
Q32016
Q32016
Q32017
Q32017
QuartersQuarters
Q32018
Q32018
2020
4040
6060
8080
100100
120120
USDB
lnUSDB
ln
00
140140
100100
200200
300300
DealC
ountDealC
ount
00
400400
DealCount Rights Equity-Linked IPO
Add'l
EMEAEquity,EquityLinked&Rights-Risk:LargestDealsbyCountryof1st3Q2018
Issuer Volume(USDMln) Date Country
UbisoftEntertainmentSA 1,083 03/20/2018 France
BayerAG 6,992 06/19/2018 Germany
EnergeanOil&GasPLC 460 03/16/2018 Greece
CreditoValtellineseSpA 862 03/08/2018 Italy
AdyenNV 1,927 09/13/2018 Netherlands
BankAl-Jazira 798 04/04/2018 SaudiArabia
PSGGroupLtd 585 01/22/2018 SouthAfrica
AenaSMESA 823 05/16/2018 Spain
SikaAG 1,649 05/15/2018 Switzerland
NMCHealthJerseyLtd 450 04/23/2018 UnitedArabEmirates
RoyalBankofScotlandGroupPLC 3,354 06/05/2018 UnitedKingdom
EMEAEquity,EquityLinked&Rights-Risk:IndustryBreakdown
Industry Volume(USDMln) %OfTotal %YOYChange
Financials 40,816 33.6% -57.7%
HealthCare 20,459 16.9% 29.6%
Materials 14,190 11.7% -20.9%
ConsumerDiscretionary 12,989 10.7% -36.0%
Industrials 11,449 9.4% -31.3%
Technology 5,616 4.6% -7.4%
ConsumerStaples 5,087 4.2% -46.2%
Energy 5,080 4.2% -39.8%
Communications 4,134 3.4% -50.2%
Utilities 1,497 1.2% -87.8%
EMEAEquity,EquityLinked&Rights-Risk:OfferingBreakdown
OfferingType Volume(USDMln) %OfTotal %YOYChange
AdditionalOfferings 57,616 47.5% -36.8%
IPO 29,307 24.1% -32.2%
RightsOfferings 21,720 17.9% -61.5%
Equity-Linked 12,777 10.5% -38.4%
Bloomberg PreliminaryGlobalEquity|1st3Q2018
BloombergLeagueTableReports Page10
EMEAEquity,EquityLinked&Rights-Risk1st3Q2018 1st3Q2017
Firm Rank MktShare(%) Volume(USDMln) DealCount PrevRank PrevMktShare(%) MktShareChg(%)
JPMorgan 1 9.924 11,318 50 1 9.560 0.364
GoldmanSachs 2 8.216 9,371 46 5 5.696 2.520
Citi 3 7.898 9,007 51 4 7.501 0.397
MorganStanley 4 5.699 6,500 45 2 8.364 -2.665
UBS 5 5.399 6,158 23 3 7.688 -2.289
DeutscheBank 6 4.959 5,656 40 6 5.359 -0.400
CreditSuisse 7 4.680 5,337 30 10 4.022 0.658
BankofAmericaMerrillLynch 8 4.497 5,128 26 7 5.112 -0.615
Barclays 9 3.968 4,525 41 9 4.038 -0.070
SocieteGenerale 10 3.200 3,649 31 11 3.237 -0.037
BNPParibas 11 2.791 3,184 29 8 4.050 -1.259
HSBC 12 2.237 2,551 19 12 2.670 -0.433
JohBerenbergGossler&CoKG 13 2.104 2,400 26 15 1.443 0.661
Investec 14 1.959 2,234 17 39 0.397 1.562
Carnegie 15 1.509 1,721 35 21 1.107 0.402
Jefferies 16 1.491 1,700 24 13 1.724 -0.233
CreditAgricoleCIB 17 1.376 1,569 10 14 1.585 -0.209
Nordea 18 1.169 1,333 18 26 1.004 0.165
UniCredit 19 1.131 1,290 9 24 1.041 0.090
Numis 20 1.020 1,163 20 19 1.168 -0.148
TOTAL 100% 114,047 583 100%
EMEAEquity,EquityLinked&Rights-Syndication1st3Q2018 1st3Q2017
Firm Rank MktShare(%) Volume(USDMln) DealCount PrevRank PrevMktShare(%) MktShareChg(%)
JPMorgan 1 10.167 11,549 51 1 9.878 0.289
GoldmanSachs 2 8.132 9,238 44 5 5.873 2.259
Citi 3 7.341 8,340 44 4 7.354 -0.013
MorganStanley 4 5.619 6,383 42 2 7.772 -2.153
UBS 5 5.391 6,124 22 3 7.640 -2.249
DeutscheBank 6 5.133 5,831 39 6 5.369 -0.236
BankofAmericaMerrillLynch 7 4.576 5,198 25 7 5.114 -0.538
CreditSuisse 8 4.568 5,189 27 9 3.735 0.833
Barclays 9 3.640 4,135 36 10 3.611 0.029
SocieteGenerale 10 3.149 3,577 30 11 3.229 -0.080
BNPParibas 11 2.739 3,112 28 8 4.040 -1.301
HSBC 12 2.205 2,505 19 12 2.663 -0.458
JohBerenbergGossler&CoKG 13 2.185 2,482 27 15 1.439 0.746
Investec 14 1.989 2,260 18 39 0.396 1.593
Carnegie 15 1.515 1,721 35 21 1.105 0.410
CreditAgricoleCIB 16 1.318 1,497 9 14 1.582 -0.264
Jefferies 17 1.295 1,471 18 13 1.659 -0.364
Nordea 18 1.205 1,369 19 27 1.001 0.204
Numis 19 1.119 1,271 22 20 1.166 -0.047
UniCredit 20 1.072 1,218 8 25 1.038 0.034
TOTAL 100% 113,595 567 100%
EMEAEquity&EquityLinked-Risk1st3Q2018 1st3Q2017
Firm Rank MktShare(%) Volume(USDMln) DealCount PrevRank PrevMktShare(%) MktShareChg(%)
JPMorgan 1 10.140 9,608 45 1 10.857 -0.717
GoldmanSachs 2 8.535 8,087 42 5 5.734 2.801
Citi 3 8.356 7,917 47 4 8.570 -0.214
UBS 4 6.477 6,137 22 3 9.056 -2.579
MorganStanley 5 6.364 6,030 42 2 9.366 -3.002
DeutscheBank 6 5.546 5,254 37 6 5.568 -0.022
CreditSuisse 7 5.118 4,849 27 10 3.514 1.604
BankofAmericaMerrillLynch 8 4.651 4,407 23 7 5.190 -0.539
SocieteGenerale 9 3.367 3,190 27 11 2.704 0.663
Barclays 10 2.803 2,656 33 8 4.036 -1.233
BNPParibas 11 2.602 2,465 24 9 3.702 -1.100
JohBerenbergGossler&CoKG 12 2.508 2,376 25 12 1.900 0.608
Carnegie 13 1.805 1,711 31 16 1.499 0.306
Jefferies 14 1.769 1,676 23 14 1.602 0.167
Investec 15 1.419 1,344 15 31 0.537 0.882
Nordea 16 1.400 1,327 17 18 1.298 0.102
HSBC 17 1.018 964 14 13 1.858 -0.840
StandardBankofSouthAfrica 18 1.007 954 6 79 0.079 0.928
CreditAgricoleCIB 19 0.999 946 8 23 0.705 0.294
Numis 20 0.998 945 15 17 1.466 -0.468
TOTAL 100% 94,745 518 100%
EMEAEquity&EquityLinked-Syndication1st3Q2018 1st3Q2017
Firm Rank MktShare(%) Volume(USDMln) DealCount PrevRank PrevMktShare(%) MktShareChg(%)
JPMorgan 1 10.425 9,839 46 1 11.280 -0.855
GoldmanSachs 2 8.428 7,954 40 5 5.971 2.457
Citi 3 7.682 7,250 40 4 8.364 -0.682
UBS 4 6.467 6,103 21 2 8.983 -2.516
MorganStanley 5 6.265 5,913 39 3 8.557 -2.292
DeutscheBank 6 5.753 5,429 36 6 5.578 0.175
CreditSuisse 7 4.980 4,700 24 10 3.126 1.854
BankofAmericaMerrillLynch 8 4.743 4,477 22 7 5.192 -0.449
SocieteGenerale 9 3.304 3,118 26 11 2.695 0.609
JohBerenbergGossler&CoKG 10 2.605 2,458 26 12 1.893 0.712
BNPParibas 11 2.536 2,393 23 8 3.689 -1.153
Barclays 12 2.401 2,266 28 9 3.456 -1.055
Carnegie 13 1.812 1,711 31 17 1.493 0.319
Jefferies 14 1.533 1,447 17 15 1.514 0.019
Investec 15 1.451 1,369 16 31 0.535 0.916
Nordea 16 1.444 1,363 18 19 1.293 0.151
Nomura 17 1.131 1,067 9 14 1.815 -0.684
Numis 18 1.116 1,053 17 18 1.461 -0.345
ParetoSecurities 19 1.015 958 20 41 0.306 0.709
StandardBankofSouthAfrica 20 1.011 954 6 80 0.078 0.933
TOTAL 100% 94,377 505 100%
Bloomberg PreliminaryGlobalEquity|1st3Q2018
BloombergLeagueTableReports Page11
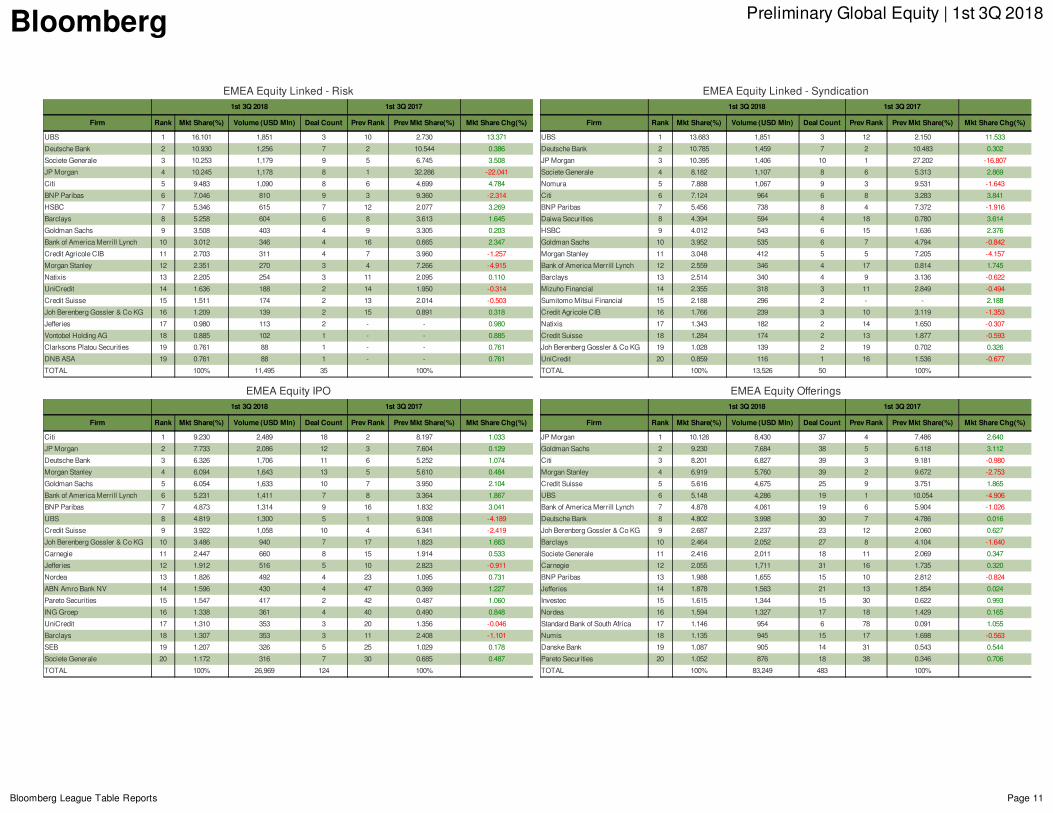
EMEAEquityLinked-Risk1st3Q2018 1st3Q2017
Firm Rank MktShare(%) Volume(USDMln) DealCount PrevRank PrevMktShare(%) MktShareChg(%)
UBS 1 16.101 1,851 3 10 2.730 13.371
DeutscheBank 2 10.930 1,256 7 2 10.544 0.386
SocieteGenerale 3 10.253 1,179 9 5 6.745 3.508
JPMorgan 4 10.245 1,178 8 1 32.286 -22.041
Citi 5 9.483 1,090 8 6 4.699 4.784
BNPParibas 6 7.046 810 9 3 9.360 -2.314
HSBC 7 5.346 615 7 12 2.077 3.269
Barclays 8 5.258 604 6 8 3.613 1.645
GoldmanSachs 9 3.508 403 4 9 3.305 0.203
BankofAmericaMerrillLynch 10 3.012 346 4 16 0.665 2.347
CreditAgricoleCIB 11 2.703 311 4 7 3.960 -1.257
MorganStanley 12 2.351 270 3 4 7.266 -4.915
Natixis 13 2.205 254 3 11 2.095 0.110
UniCredit 14 1.636 188 2 14 1.950 -0.314
CreditSuisse 15 1.511 174 2 13 2.014 -0.503
JohBerenbergGossler&CoKG 16 1.209 139 2 15 0.891 0.318
Jefferies 17 0.980 113 2 - - 0.980
VontobelHoldingAG 18 0.885 102 1 - - 0.885
ClarksonsPlatouSecurities 19 0.761 88 1 - - 0.761
DNBASA 19 0.761 88 1 - - 0.761
TOTAL 100% 11,495 35 100%
EMEAEquityLinked-Syndication1st3Q2018 1st3Q2017
Firm Rank MktShare(%) Volume(USDMln) DealCount PrevRank PrevMktShare(%) MktShareChg(%)
UBS 1 13.683 1,851 3 12 2.150 11.533
DeutscheBank 2 10.785 1,459 7 2 10.483 0.302
JPMorgan 3 10.395 1,406 10 1 27.202 -16.807
SocieteGenerale 4 8.182 1,107 8 6 5.313 2.869
Nomura 5 7.888 1,067 9 3 9.531 -1.643
Citi 6 7.124 964 6 8 3.283 3.841
BNPParibas 7 5.456 738 8 4 7.372 -1.916
DaiwaSecurities 8 4.394 594 4 18 0.780 3.614
HSBC 9 4.012 543 6 15 1.636 2.376
GoldmanSachs 10 3.952 535 6 7 4.794 -0.842
MorganStanley 11 3.048 412 5 5 7.205 -4.157
BankofAmericaMerrillLynch 12 2.559 346 4 17 0.814 1.745
Barclays 13 2.514 340 4 9 3.136 -0.622
MizuhoFinancial 14 2.355 318 3 11 2.849 -0.494
SumitomoMitsuiFinancial 15 2.188 296 2 - - 2.188
CreditAgricoleCIB 16 1.766 239 3 10 3.119 -1.353
Natixis 17 1.343 182 2 14 1.650 -0.307
CreditSuisse 18 1.284 174 2 13 1.877 -0.593
JohBerenbergGossler&CoKG 19 1.028 139 2 19 0.702 0.326
UniCredit 20 0.859 116 1 16 1.536 -0.677
TOTAL 100% 13,526 50 100%
EMEAEquityIPO1st3Q2018 1st3Q2017
Firm Rank MktShare(%) Volume(USDMln) DealCount PrevRank PrevMktShare(%) MktShareChg(%)
Citi 1 9.230 2,489 18 2 8.197 1.033
JPMorgan 2 7.733 2,086 12 3 7.604 0.129
DeutscheBank 3 6.326 1,706 11 6 5.252 1.074
MorganStanley 4 6.094 1,643 13 5 5.610 0.484
GoldmanSachs 5 6.054 1,633 10 7 3.950 2.104
BankofAmericaMerrillLynch 6 5.231 1,411 7 8 3.364 1.867
BNPParibas 7 4.873 1,314 9 16 1.832 3.041
UBS 8 4.819 1,300 5 1 9.008 -4.189
CreditSuisse 9 3.922 1,058 10 4 6.341 -2.419
JohBerenbergGossler&CoKG 10 3.486 940 7 17 1.823 1.663
Carnegie 11 2.447 660 8 15 1.914 0.533
Jefferies 12 1.912 516 5 10 2.823 -0.911
Nordea 13 1.826 492 4 23 1.095 0.731
ABNAmroBankNV 14 1.596 430 4 47 0.369 1.227
ParetoSecurities 15 1.547 417 2 42 0.487 1.060
INGGroep 16 1.338 361 4 40 0.490 0.848
UniCredit 17 1.310 353 3 20 1.356 -0.046
Barclays 18 1.307 353 3 11 2.408 -1.101
SEB 19 1.207 326 5 25 1.029 0.178
SocieteGenerale 20 1.172 316 7 30 0.685 0.487
TOTAL 100% 26,969 124 100%
EMEAEquityOfferings1st3Q2018 1st3Q2017
Firm Rank MktShare(%) Volume(USDMln) DealCount PrevRank PrevMktShare(%) MktShareChg(%)
JPMorgan 1 10.126 8,430 37 4 7.486 2.640
GoldmanSachs 2 9.230 7,684 38 5 6.118 3.112
Citi 3 8.201 6,827 39 3 9.181 -0.980
MorganStanley 4 6.919 5,760 39 2 9.672 -2.753
CreditSuisse 5 5.616 4,675 25 9 3.751 1.865
UBS 6 5.148 4,286 19 1 10.054 -4.906
BankofAmericaMerrillLynch 7 4.878 4,061 19 6 5.904 -1.026
DeutscheBank 8 4.802 3,998 30 7 4.786 0.016
JohBerenbergGossler&CoKG 9 2.687 2,237 23 12 2.060 0.627
Barclays 10 2.464 2,052 27 8 4.104 -1.640
SocieteGenerale 11 2.416 2,011 18 11 2.069 0.347
Carnegie 12 2.055 1,711 31 16 1.735 0.320
BNPParibas 13 1.988 1,655 15 10 2.812 -0.824
Jefferies 14 1.878 1,563 21 13 1.854 0.024
Investec 15 1.615 1,344 15 30 0.622 0.993
Nordea 16 1.594 1,327 17 18 1.429 0.165
StandardBankofSouthAfrica 17 1.146 954 6 78 0.091 1.055
Numis 18 1.135 945 15 17 1.698 -0.563
DanskeBank 19 1.087 905 14 31 0.543 0.544
ParetoSecurities 20 1.052 876 18 38 0.346 0.706
TOTAL 100% 83,249 483 100%
Bloomberg PreliminaryGlobalEquity|1st3Q2018
BloombergLeagueTableReports Page12
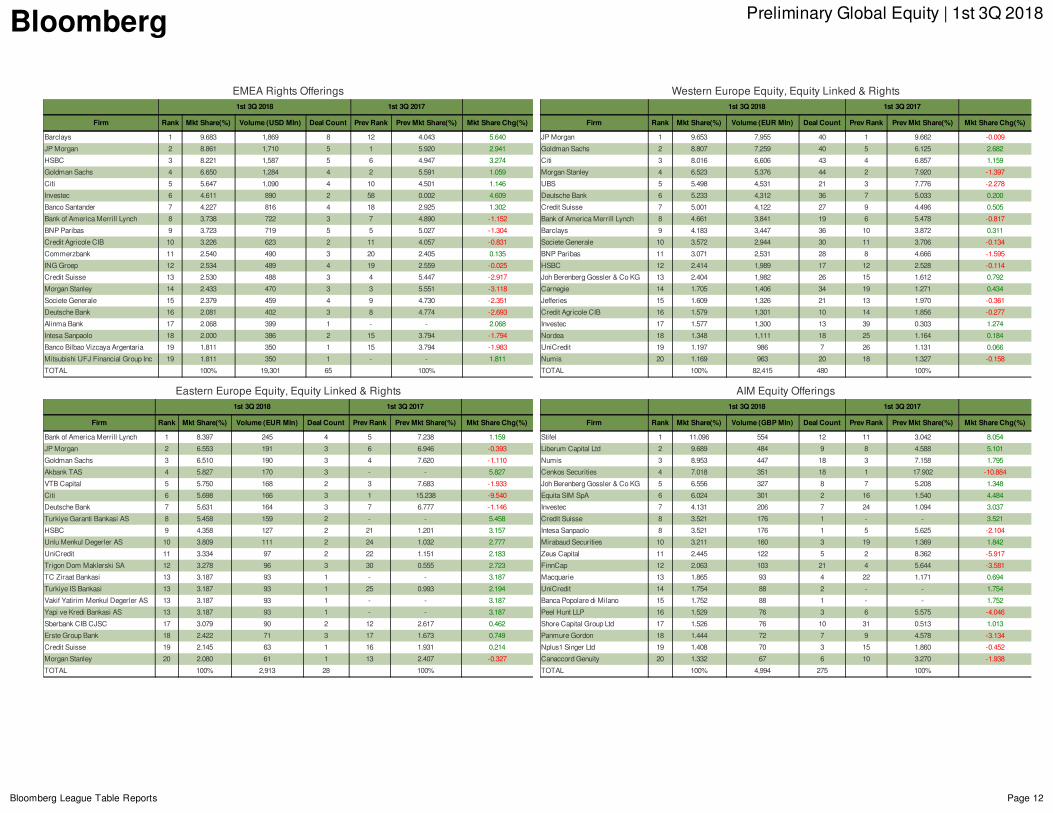
EMEARightsOfferings1st3Q2018 1st3Q2017
Firm Rank MktShare(%) Volume(USDMln) DealCount PrevRank PrevMktShare(%) MktShareChg(%)
Barclays 1 9.683 1,869 8 12 4.043 5.640
JPMorgan 2 8.861 1,710 5 1 5.920 2.941
HSBC 3 8.221 1,587 5 6 4.947 3.274
GoldmanSachs 4 6.650 1,284 4 2 5.591 1.059
Citi 5 5.647 1,090 4 10 4.501 1.146
Investec 6 4.611 890 2 58 0.002 4.609
BancoSantander 7 4.227 816 4 18 2.925 1.302
BankofAmericaMerrillLynch 8 3.738 722 3 7 4.890 -1.152
BNPParibas 9 3.723 719 5 5 5.027 -1.304
CreditAgricoleCIB 10 3.226 623 2 11 4.057 -0.831
Commerzbank 11 2.540 490 3 20 2.405 0.135
INGGroep 12 2.534 489 4 19 2.559 -0.025
CreditSuisse 13 2.530 488 3 4 5.447 -2.917
MorganStanley 14 2.433 470 3 3 5.551 -3.118
SocieteGenerale 15 2.379 459 4 9 4.730 -2.351
DeutscheBank 16 2.081 402 3 8 4.774 -2.693
AlinmaBank 17 2.068 399 1 - - 2.068
IntesaSanpaolo 18 2.000 386 2 15 3.794 -1.794
BancoBilbaoVizcayaArgentaria 19 1.811 350 1 15 3.794 -1.983
MitsubishiUFJFinancialGroupInc 19 1.811 350 1 - - 1.811
TOTAL 100% 19,301 65 100%
WesternEuropeEquity,EquityLinked&Rights1st3Q2018 1st3Q2017
Firm Rank MktShare(%) Volume(EURMln) DealCount PrevRank PrevMktShare(%) MktShareChg(%)
JPMorgan 1 9.653 7,955 40 1 9.662 -0.009
GoldmanSachs 2 8.807 7,259 40 5 6.125 2.682
Citi 3 8.016 6,606 43 4 6.857 1.159
MorganStanley 4 6.523 5,376 44 2 7.920 -1.397
UBS 5 5.498 4,531 21 3 7.776 -2.278
DeutscheBank 6 5.233 4,312 36 7 5.033 0.200
CreditSuisse 7 5.001 4,122 27 9 4.496 0.505
BankofAmericaMerrillLynch 8 4.661 3,841 19 6 5.478 -0.817
Barclays 9 4.183 3,447 36 10 3.872 0.311
SocieteGenerale 10 3.572 2,944 30 11 3.706 -0.134
BNPParibas 11 3.071 2,531 28 8 4.666 -1.595
HSBC 12 2.414 1,989 17 12 2.528 -0.114
JohBerenbergGossler&CoKG 13 2.404 1,982 26 15 1.612 0.792
Carnegie 14 1.705 1,406 34 19 1.271 0.434
Jefferies 15 1.609 1,326 21 13 1.970 -0.361
CreditAgricoleCIB 16 1.579 1,301 10 14 1.856 -0.277
Investec 17 1.577 1,300 13 39 0.303 1.274
Nordea 18 1.348 1,111 18 25 1.164 0.184
UniCredit 19 1.197 986 7 26 1.131 0.066
Numis 20 1.169 963 20 18 1.327 -0.158
TOTAL 100% 82,415 480 100%
EasternEuropeEquity,EquityLinked&Rights1st3Q2018 1st3Q2017
Firm Rank MktShare(%) Volume(EURMln) DealCount PrevRank PrevMktShare(%) MktShareChg(%)
BankofAmericaMerrillLynch 1 8.397 245 4 5 7.238 1.159
JPMorgan 2 6.553 191 3 6 6.946 -0.393
GoldmanSachs 3 6.510 190 3 4 7.620 -1.110
AkbankTAS 4 5.827 170 3 - - 5.827
VTBCapital 5 5.750 168 2 3 7.683 -1.933
Citi 6 5.698 166 3 1 15.238 -9.540
DeutscheBank 7 5.631 164 3 7 6.777 -1.146
TurkiyeGarantiBankasiAS 8 5.458 159 2 - - 5.458
HSBC 9 4.358 127 2 21 1.201 3.157
UnluMenkulDegerlerAS 10 3.809 111 2 24 1.032 2.777
UniCredit 11 3.334 97 2 22 1.151 2.183
TrigonDomMaklerskiSA 12 3.278 96 3 30 0.555 2.723
TCZiraatBankasi 13 3.187 93 1 - - 3.187
TurkiyeISBankasi 13 3.187 93 1 25 0.993 2.194
VakifYatirimMenkulDegerlerAS 13 3.187 93 1 - - 3.187
YapiveKrediBankasiAS 13 3.187 93 1 - - 3.187
SberbankCIBCJSC 17 3.079 90 2 12 2.617 0.462
ErsteGroupBank 18 2.422 71 3 17 1.673 0.749
CreditSuisse 19 2.145 63 1 16 1.931 0.214
MorganStanley 20 2.080 61 1 13 2.407 -0.327
TOTAL 100% 2,913 28 100%
AIMEquityOfferings1st3Q2018 1st3Q2017
Firm Rank MktShare(%) Volume(GBPMln) DealCount PrevRank PrevMktShare(%) MktShareChg(%)
Stifel 1 11.096 554 12 11 3.042 8.054
LiberumCapitalLtd 2 9.689 484 9 8 4.588 5.101
Numis 3 8.953 447 18 3 7.158 1.795
CenkosSecurities 4 7.018 351 18 1 17.902 -10.884
JohBerenbergGossler&CoKG 5 6.556 327 8 7 5.208 1.348
EquitaSIMSpA 6 6.024 301 2 16 1.540 4.484
Investec 7 4.131 206 7 24 1.094 3.037
CreditSuisse 8 3.521 176 1 - - 3.521
IntesaSanpaolo 8 3.521 176 1 5 5.625 -2.104
MirabaudSecurities 10 3.211 160 3 19 1.369 1.842
ZeusCapital 11 2.445 122 5 2 8.362 -5.917
FinnCap 12 2.063 103 21 4 5.644 -3.581
Macquarie 13 1.865 93 4 22 1.171 0.694
UniCredit 14 1.754 88 2 - - 1.754
BancaPopolarediMilano 15 1.752 88 1 - - 1.752
PeelHuntLLP 16 1.529 76 3 6 5.575 -4.046
ShoreCapitalGroupLtd 17 1.526 76 10 31 0.513 1.013
PanmureGordon 18 1.444 72 7 9 4.578 -3.134
Nplus1SingerLtd 19 1.408 70 3 15 1.860 -0.452
CanaccordGenuity 20 1.332 67 6 10 3.270 -1.938
TOTAL 100% 4,994 275 100%

Bloomberg PreliminaryGlobalEquity|1st3Q2018
BloombergLeagueTableReports Page13
AfricaEquity,EquityLinked&Rights1st3Q2018 1st3Q2017
Firm Rank MktShare(%) Volume(USDMln) DealCount PrevRank PrevMktShare(%) MktShareChg(%)
StandardBankofSouthAfrica 1 19.616 954 6 17 0.984 18.632
Investec 2 13.441 654 4 12 1.953 11.488
JPMorgan 3 10.719 521 4 2 10.554 0.165
PSGGroupLtd 4 6.888 335 3 22 0.293 6.595
JavaCapital 5 5.605 273 5 5 9.026 -3.421
Citi 6 5.061 246 2 3 10.090 -5.029
ICSecuritiesGhanaLtd 7 5.047 246 1 - - 5.047
DeutscheBank 8 4.981 242 1 8 5.985 -1.004
BankofAmericaMerrillLynch 9 4.460 217 2 - - 4.460
Barclays 10 3.441 167 3 7 7.964 -4.523
BNPParibas 11 2.799 136 1 - - 2.799
CreditSuisse 11 2.799 136 1 - - 2.799
FirstRandLtd 11 2.799 136 1 6 8.011 -5.212
SocieteGenerale 14 2.261 110 1 - - 2.261
GoldmanSachs 15 2.084 101 1 - - 2.084
BMOCapitalMarkets 16 1.542 75 3 14 1.305 0.237
RBCCapitalMarkets 17 1.180 57 2 18 0.847 0.333
Jefferies 18 1.084 53 1 - - 1.084
Exotix 19 0.679 33 1 - - 0.679
FinnCap 19 0.679 33 1 - - 0.679
TOTAL 100% 4,864 27 100%
Sub-SaharaEquity,EquityLinked&Rights1st3Q2018 1st3Q2017
Firm Rank MktShare(%) Volume(USDMln) DealCount PrevRank PrevMktShare(%) MktShareChg(%)
StandardBankofSouthAfrica 1 20.700 818 5 16 1.011 19.689
Investec 2 16.545 654 4 12 2.008 14.537
JPMorgan 3 9.748 385 3 2 10.848 -1.100
PSGGroupLtd 4 8.478 335 3 20 0.301 8.177
JavaCapital 5 6.899 273 5 4 9.278 -2.379
ICSecuritiesGhanaLtd 6 6.213 246 1 - - 6.213
DeutscheBank 7 6.132 242 1 8 6.152 -0.020
BankofAmericaMerrillLynch 8 5.490 217 2 - - 5.490
Barclays 9 4.236 167 3 7 8.186 -3.950
Citi 10 2.784 110 1 5 9.193 -6.409
SocieteGenerale 10 2.784 110 1 - - 2.784
GoldmanSachs 12 2.565 101 1 - - 2.565
BMOCapitalMarkets 13 1.898 75 3 14 1.341 0.557
RBCCapitalMarkets 14 1.452 57 2 17 0.871 0.581
Exotix 15 0.836 33 1 - - 0.836
FinnCap 15 0.836 33 1 - - 0.836
NorthlandCapitalPartnersLtd 15 0.836 33 1 - - 0.836
BarclaysAfricaGroupLtd 18 0.523 21 1 18 0.445 0.078
NedbankLtd 18 0.523 21 1 - - 0.523
UBS 18 0.523 21 1 3 9.350 -8.827
TOTAL 100% 3,951 24 100%
MENAEquity,EquityLinked&Rights1st3Q2018 1st3Q2017
Firm Rank MktShare(%) Volume(USDMln) DealCount PrevRank PrevMktShare(%) MktShareChg(%)
JPMorgan 1 19.470 985 3 - - 19.470
EFG-Hermes 2 15.268 773 2 5 10.763 4.505
AlinmaBank 3 7.888 399 1 - - 7.888
GoldmanSachs 4 6.026 305 2 - - 6.026
EmiratesNBDPJSC 5 5.676 287 2 10 2.383 3.293
DNBASA 6 5.052 256 5 1 18.077 -13.025
Citi 7 4.932 250 3 6 8.253 -3.321
ClarksonsPlatouSecurities 8 4.615 234 3 3 12.962 -8.347
NBKCapital 9 4.191 212 1 - - 4.191
NationalCommercialBank 10 3.425 173 1 - - 3.425
BNPParibas 11 2.690 136 1 - - 2.690
CreditSuisse 11 2.690 136 1 - - 2.690
FirstRandLtd 11 2.690 136 1 - - 2.690
StandardBankofSouthAfrica 11 2.690 136 1 - - 2.690
ParetoSecurities 15 1.904 96 2 - - 1.904
BankAlbilad 16 1.865 94 1 - - 1.865
UbharCapitalSAOC 17 1.326 67 1 18 0.472 0.854
GrantThorntonInternationalLtd 18 1.179 60 1 - - 1.179
BankMuscat 19 1.119 57 2 - - 1.119
ABGSundalCollierAsa 20 1.087 55 3 11 1.795 -0.708
TOTAL 100% 5,060 25 100%
Bloomberg PreliminaryGlobalEquity|1st3Q2018
BloombergLeagueTableReports Page14
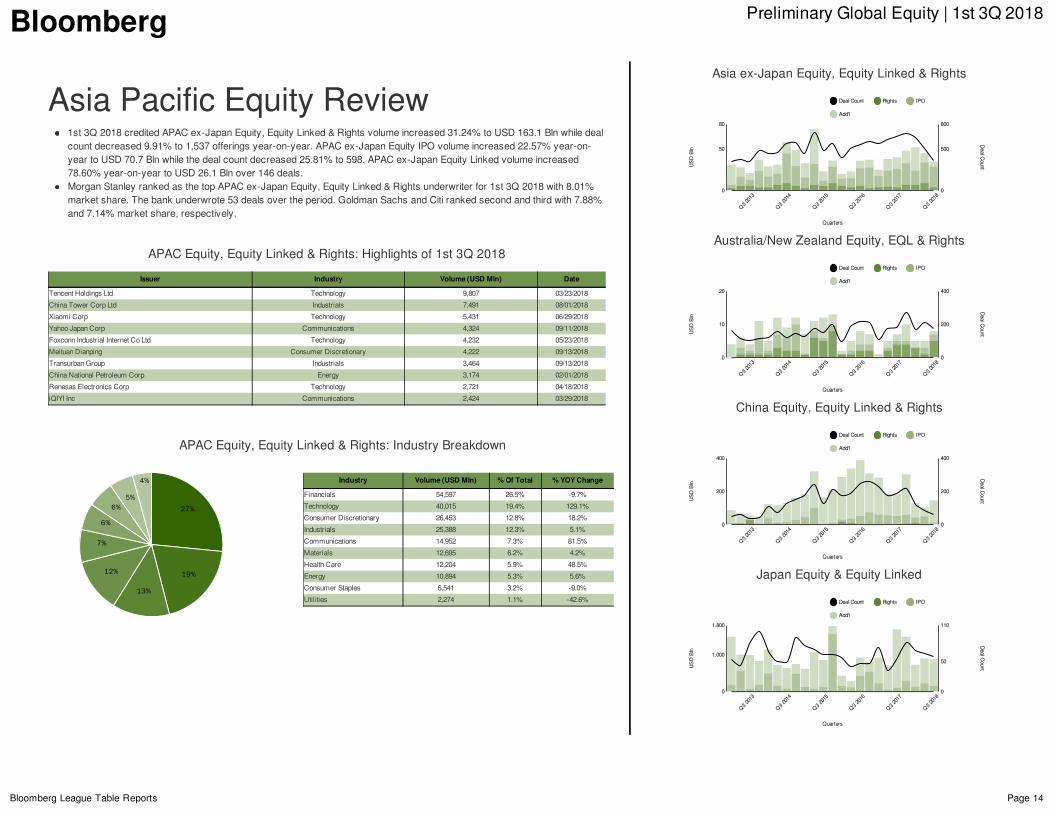
AsiaPacificEquityReview1st3Q2018creditedAPACex-JapanEquity,EquityLinked&Rightsvolumeincreased31.24%toUSD163.1Blnwhiledealcountdecreased9.91%to1,537offeringsyear-on-year.APACex-JapanEquityIPOvolumeincreased22.57%year-on-yeartoUSD70.7Blnwhilethedealcountdecreased25.81%to598.APACex-JapanEquityLinkedvolumeincreased78.60%year-on-yeartoUSD26.1Blnover146deals.MorganStanleyrankedasthetopAPACex-JapanEquity,EquityLinked&Rightsunderwriterfor1st3Q2018with8.01%marketshare.Thebankunderwrote53dealsovertheperiod.GoldmanSachsandCitirankedsecondandthirdwith7.88%and7.14%marketshare,respectively.
APACEquity,EquityLinked&Rights:Highlightsof1st3Q2018
Issuer Industry Volume(USDMln) Date
TencentHoldingsLtd Technology 9,807 03/23/2018
ChinaTowerCorpLtd Industrials 7,491 08/01/2018
XiaomiCorp Technology 5,431 06/29/2018
YahooJapanCorp Communications 4,324 09/11/2018
FoxconnIndustrialInternetCoLtd Technology 4,232 05/23/2018
MeituanDianping ConsumerDiscretionary 4,222 09/13/2018
TransurbanGroup Industrials 3,464 09/13/2018
ChinaNationalPetroleumCorp Energy 3,174 02/01/2018
RenesasElectronicsCorp Technology 2,721 04/18/2018
iQIYIInc Communications 2,424 03/29/2018
APACEquity,EquityLinked&Rights:IndustryBreakdown
27%
19%
13%
12%
7%
6%
6%5%
4% Industry Volume(USDMln) %OfTotal %YOYChange
Financials 54,597 26.5% -9.7%
Technology 40,015 19.4% 129.1%
ConsumerDiscretionary 26,453 12.8% 18.2%
Industrials 25,388 12.3% 5.1%
Communications 14,952 7.3% 81.5%
Materials 12,695 6.2% 4.2%
HealthCare 12,204 5.9% 48.5%
Energy 10,894 5.3% 5.6%
ConsumerStaples 6,541 3.2% -9.0%
Utilities 2,274 1.1% -42.6%
Asiaex-JapanEquity,EquityLinked&Rights
Q32013
Q32013
Q32014
Q32014
Q32015
Q32015
Q32016
Q32016
Q32017
Q32017
QuartersQuarters
Q32018
Q32018
5050
USDB
lnUSDB
ln
00
8080
500500
DealC
ountDealC
ount
00
800800
DealCount Rights IPO
Add'l
Australia/NewZealandEquity,EQL&Rights
Q32013
Q32013
Q32014
Q32014
Q32015
Q32015
Q32016
Q32016
Q32017
Q32017
QuartersQuarters
Q32018
Q32018
1010
USDB
lnUSDB
ln
00
2020
200200
DealC
ountDealC
ount
00
400400
DealCount Rights IPO
Add'l
ChinaEquity,EquityLinked&Rights
Q32013
Q32013
Q32014
Q32014
Q32015
Q32015
Q32016
Q32016
Q32017
Q32017
QuartersQuarters
Q32018
Q32018
200200
USDB
lnUSDB
ln
00
400400
200200
DealC
ountDealC
ount
00
400400
DealCount Rights IPO
Add'l
JapanEquity&EquityLinked
Q32013
Q32013
Q32014
Q32014
Q32015
Q32015
Q32016
Q32016
Q32017
Q32017
QuartersQuarters
Q32018
Q32018
1,0001,000
USDB
lnUSDB
ln00
1,8001,800
5050
DealC
ountDealC
ount
00
110110
DealCount Rights IPO
Add'l
Bloomberg PreliminaryGlobalEquity|1st3Q2018
BloombergLeagueTableReports Page15
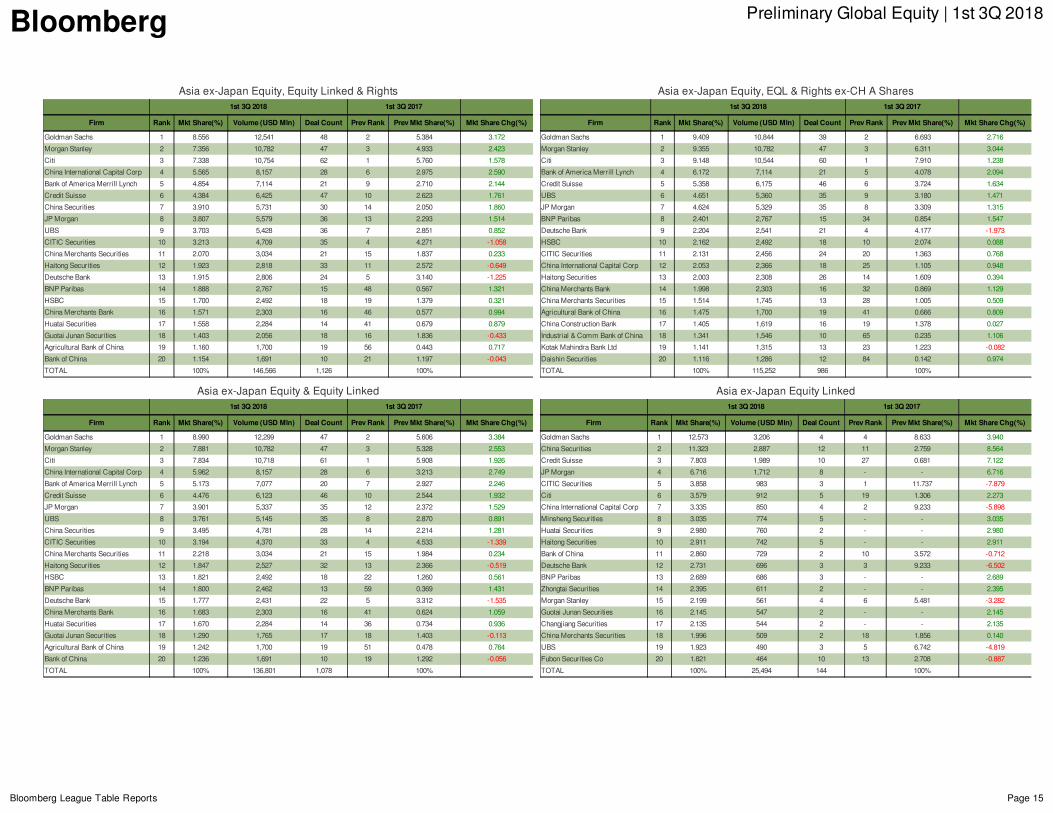
Asiaex-JapanEquity,EquityLinked&Rights1st3Q2018 1st3Q2017
Firm Rank MktShare(%) Volume(USDMln) DealCount PrevRank PrevMktShare(%) MktShareChg(%)
GoldmanSachs 1 8.556 12,541 48 2 5.384 3.172
MorganStanley 2 7.356 10,782 47 3 4.933 2.423
Citi 3 7.338 10,754 62 1 5.760 1.578
ChinaInternationalCapitalCorp 4 5.565 8,157 28 6 2.975 2.590
BankofAmericaMerrillLynch 5 4.854 7,114 21 9 2.710 2.144
CreditSuisse 6 4.384 6,425 47 10 2.623 1.761
ChinaSecurities 7 3.910 5,731 30 14 2.050 1.860
JPMorgan 8 3.807 5,579 36 13 2.293 1.514
UBS 9 3.703 5,428 36 7 2.851 0.852
CITICSecurities 10 3.213 4,709 35 4 4.271 -1.058
ChinaMerchantsSecurities 11 2.070 3,034 21 15 1.837 0.233
HaitongSecurities 12 1.923 2,818 33 11 2.572 -0.649
DeutscheBank 13 1.915 2,806 24 5 3.140 -1.225
BNPParibas 14 1.888 2,767 15 48 0.567 1.321
HSBC 15 1.700 2,492 18 19 1.379 0.321
ChinaMerchantsBank 16 1.571 2,303 16 46 0.577 0.994
HuataiSecurities 17 1.558 2,284 14 41 0.679 0.879
GuotaiJunanSecurities 18 1.403 2,056 18 16 1.836 -0.433
AgriculturalBankofChina 19 1.160 1,700 19 56 0.443 0.717
BankofChina 20 1.154 1,691 10 21 1.197 -0.043
TOTAL 100% 146,566 1,126 100%
Asiaex-JapanEquity,EQL&Rightsex-CHAShares1st3Q2018 1st3Q2017
Firm Rank MktShare(%) Volume(USDMln) DealCount PrevRank PrevMktShare(%) MktShareChg(%)
GoldmanSachs 1 9.409 10,844 39 2 6.693 2.716
MorganStanley 2 9.355 10,782 47 3 6.311 3.044
Citi 3 9.148 10,544 60 1 7.910 1.238
BankofAmericaMerrillLynch 4 6.172 7,114 21 5 4.078 2.094
CreditSuisse 5 5.358 6,175 46 6 3.724 1.634
UBS 6 4.651 5,360 35 9 3.180 1.471
JPMorgan 7 4.624 5,329 35 8 3.309 1.315
BNPParibas 8 2.401 2,767 15 34 0.854 1.547
DeutscheBank 9 2.204 2,541 21 4 4.177 -1.973
HSBC 10 2.162 2,492 18 10 2.074 0.088
CITICSecurities 11 2.131 2,456 24 20 1.363 0.768
ChinaInternationalCapitalCorp 12 2.053 2,366 18 25 1.105 0.948
HaitongSecurities 13 2.003 2,308 26 14 1.609 0.394
ChinaMerchantsBank 14 1.998 2,303 16 32 0.869 1.129
ChinaMerchantsSecurities 15 1.514 1,745 13 28 1.005 0.509
AgriculturalBankofChina 16 1.475 1,700 19 41 0.666 0.809
ChinaConstructionBank 17 1.405 1,619 16 19 1.378 0.027
Industrial&CommBankofChina 18 1.341 1,546 10 65 0.235 1.106
KotakMahindraBankLtd 19 1.141 1,315 13 23 1.223 -0.082
DaishinSecurities 20 1.116 1,286 12 84 0.142 0.974
TOTAL 100% 115,252 986 100%
Asiaex-JapanEquity&EquityLinked1st3Q2018 1st3Q2017
Firm Rank MktShare(%) Volume(USDMln) DealCount PrevRank PrevMktShare(%) MktShareChg(%)
GoldmanSachs 1 8.990 12,299 47 2 5.606 3.384
MorganStanley 2 7.881 10,782 47 3 5.328 2.553
Citi 3 7.834 10,718 61 1 5.908 1.926
ChinaInternationalCapitalCorp 4 5.962 8,157 28 6 3.213 2.749
BankofAmericaMerrillLynch 5 5.173 7,077 20 7 2.927 2.246
CreditSuisse 6 4.476 6,123 46 10 2.544 1.932
JPMorgan 7 3.901 5,337 35 12 2.372 1.529
UBS 8 3.761 5,145 35 8 2.870 0.891
ChinaSecurities 9 3.495 4,781 28 14 2.214 1.281
CITICSecurities 10 3.194 4,370 33 4 4.533 -1.339
ChinaMerchantsSecurities 11 2.218 3,034 21 15 1.984 0.234
HaitongSecurities 12 1.847 2,527 32 13 2.366 -0.519
HSBC 13 1.821 2,492 18 22 1.260 0.561
BNPParibas 14 1.800 2,462 13 59 0.369 1.431
DeutscheBank 15 1.777 2,431 22 5 3.312 -1.535
ChinaMerchantsBank 16 1.683 2,303 16 41 0.624 1.059
HuataiSecurities 17 1.670 2,284 14 36 0.734 0.936
GuotaiJunanSecurities 18 1.290 1,765 17 18 1.403 -0.113
AgriculturalBankofChina 19 1.242 1,700 19 51 0.478 0.764
BankofChina 20 1.236 1,691 10 19 1.292 -0.056
TOTAL 100% 136,801 1,078 100%
Asiaex-JapanEquityLinked1st3Q2018 1st3Q2017
Firm Rank MktShare(%) Volume(USDMln) DealCount PrevRank PrevMktShare(%) MktShareChg(%)
GoldmanSachs 1 12.573 3,206 4 4 8.633 3.940
ChinaSecurities 2 11.323 2,887 12 11 2.759 8.564
CreditSuisse 3 7.803 1,989 10 27 0.681 7.122
JPMorgan 4 6.716 1,712 8 - - 6.716
CITICSecurities 5 3.858 983 3 1 11.737 -7.879
Citi 6 3.579 912 5 19 1.306 2.273
ChinaInternationalCapitalCorp 7 3.335 850 4 2 9.233 -5.898
MinshengSecurities 8 3.035 774 5 - - 3.035
HuataiSecurities 9 2.980 760 2 - - 2.980
HaitongSecurities 10 2.911 742 5 - - 2.911
BankofChina 11 2.860 729 2 10 3.572 -0.712
DeutscheBank 12 2.731 696 3 3 9.233 -6.502
BNPParibas 13 2.689 686 3 - - 2.689
ZhongtaiSecurities 14 2.395 611 2 - - 2.395
MorganStanley 15 2.199 561 4 6 5.481 -3.282
GuotaiJunanSecurities 16 2.145 547 2 - - 2.145
ChangjiangSecurities 17 2.135 544 2 - - 2.135
ChinaMerchantsSecurities 18 1.996 509 2 18 1.856 0.140
UBS 19 1.923 490 3 5 6.742 -4.819
FubonSecuritiesCo 20 1.821 464 10 13 2.708 -0.887
TOTAL 100% 25,494 144 100%
Bloomberg PreliminaryGlobalEquity|1st3Q2018
BloombergLeagueTableReports Page16
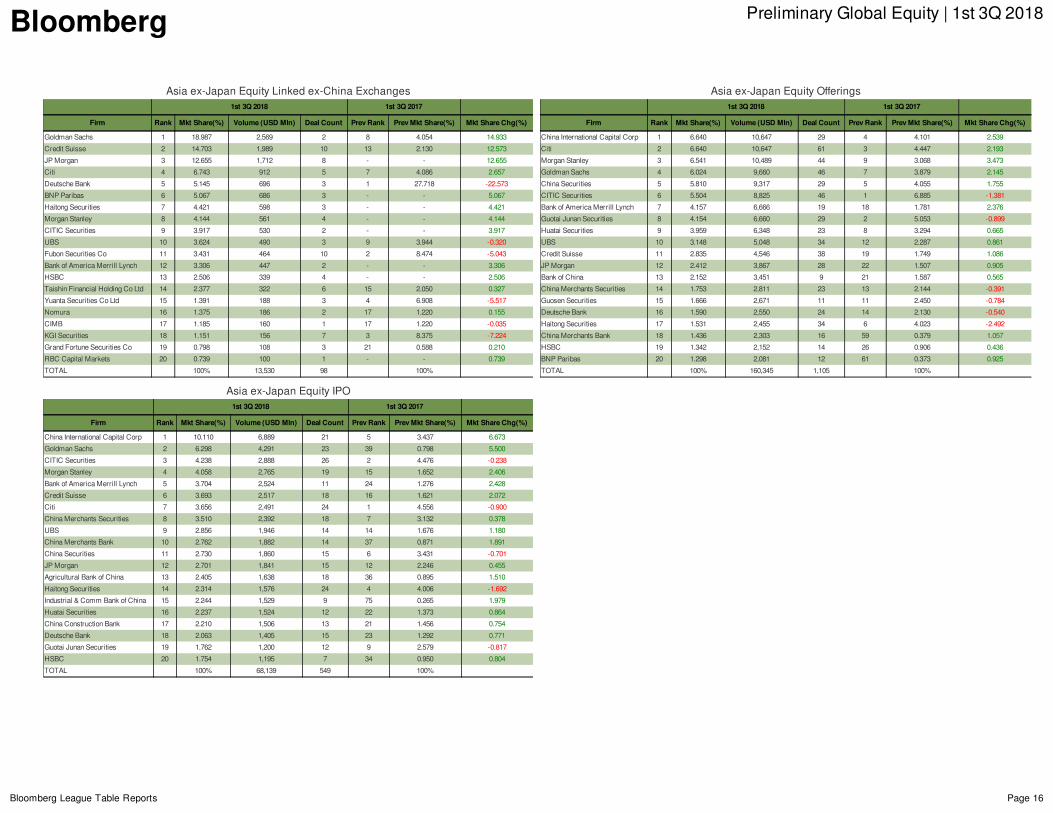
Asiaex-JapanEquityLinkedex-ChinaExchanges1st3Q2018 1st3Q2017
Firm Rank MktShare(%) Volume(USDMln) DealCount PrevRank PrevMktShare(%) MktShareChg(%)
GoldmanSachs 1 18.987 2,569 2 8 4.054 14.933
CreditSuisse 2 14.703 1,989 10 13 2.130 12.573
JPMorgan 3 12.655 1,712 8 - - 12.655
Citi 4 6.743 912 5 7 4.086 2.657
DeutscheBank 5 5.145 696 3 1 27.718 -22.573
BNPParibas 6 5.067 686 3 - - 5.067
HaitongSecurities 7 4.421 598 3 - - 4.421
MorganStanley 8 4.144 561 4 - - 4.144
CITICSecurities 9 3.917 530 2 - - 3.917
UBS 10 3.624 490 3 9 3.944 -0.320
FubonSecuritiesCo 11 3.431 464 10 2 8.474 -5.043
BankofAmericaMerrillLynch 12 3.306 447 2 - - 3.306
HSBC 13 2.506 339 4 - - 2.506
TaishinFinancialHoldingCoLtd 14 2.377 322 6 15 2.050 0.327
YuantaSecuritiesCoLtd 15 1.391 188 3 4 6.908 -5.517
Nomura 16 1.375 186 2 17 1.220 0.155
CIMB 17 1.185 160 1 17 1.220 -0.035
KGISecurities 18 1.151 156 7 3 8.375 -7.224
GrandFortuneSecuritiesCo 19 0.798 108 3 21 0.588 0.210
RBCCapitalMarkets 20 0.739 100 1 - - 0.739
TOTAL 100% 13,530 98 100%
Asiaex-JapanEquityOfferings1st3Q2018 1st3Q2017
Firm Rank MktShare(%) Volume(USDMln) DealCount PrevRank PrevMktShare(%) MktShareChg(%)
ChinaInternationalCapitalCorp 1 6.640 10,647 29 4 4.101 2.539
Citi 2 6.640 10,647 61 3 4.447 2.193
MorganStanley 3 6.541 10,489 44 9 3.068 3.473
GoldmanSachs 4 6.024 9,660 46 7 3.879 2.145
ChinaSecurities 5 5.810 9,317 29 5 4.055 1.755
CITICSecurities 6 5.504 8,825 46 1 6.885 -1.381
BankofAmericaMerrillLynch 7 4.157 6,666 19 18 1.781 2.376
GuotaiJunanSecurities 8 4.154 6,660 29 2 5.053 -0.899
HuataiSecurities 9 3.959 6,348 23 8 3.294 0.665
UBS 10 3.148 5,048 34 12 2.287 0.861
CreditSuisse 11 2.835 4,546 38 19 1.749 1.086
JPMorgan 12 2.412 3,867 28 22 1.507 0.905
BankofChina 13 2.152 3,451 9 21 1.587 0.565
ChinaMerchantsSecurities 14 1.753 2,811 23 13 2.144 -0.391
GuosenSecurities 15 1.666 2,671 11 11 2.450 -0.784
DeutscheBank 16 1.590 2,550 24 14 2.130 -0.540
HaitongSecurities 17 1.531 2,455 34 6 4.023 -2.492
ChinaMerchantsBank 18 1.436 2,303 16 59 0.379 1.057
HSBC 19 1.342 2,152 14 26 0.906 0.436
BNPParibas 20 1.298 2,081 12 61 0.373 0.925
TOTAL 100% 160,345 1,105 100%
Asiaex-JapanEquityIPO1st3Q2018 1st3Q2017
Firm Rank MktShare(%) Volume(USDMln) DealCount PrevRank PrevMktShare(%) MktShareChg(%)
ChinaInternationalCapitalCorp 1 10.110 6,889 21 5 3.437 6.673
GoldmanSachs 2 6.298 4,291 23 39 0.798 5.500
CITICSecurities 3 4.238 2,888 26 2 4.476 -0.238
MorganStanley 4 4.058 2,765 19 15 1.652 2.406
BankofAmericaMerrillLynch 5 3.704 2,524 11 24 1.276 2.428
CreditSuisse 6 3.693 2,517 18 16 1.621 2.072
Citi 7 3.656 2,491 24 1 4.556 -0.900
ChinaMerchantsSecurities 8 3.510 2,392 18 7 3.132 0.378
UBS 9 2.856 1,946 14 14 1.676 1.180
ChinaMerchantsBank 10 2.762 1,882 14 37 0.871 1.891
ChinaSecurities 11 2.730 1,860 15 6 3.431 -0.701
JPMorgan 12 2.701 1,841 15 12 2.246 0.455
AgriculturalBankofChina 13 2.405 1,638 18 36 0.895 1.510
HaitongSecurities 14 2.314 1,576 24 4 4.006 -1.692
Industrial&CommBankofChina 15 2.244 1,529 9 75 0.265 1.979
HuataiSecurities 16 2.237 1,524 12 22 1.373 0.864
ChinaConstructionBank 17 2.210 1,506 13 21 1.456 0.754
DeutscheBank 18 2.063 1,405 15 23 1.292 0.771
GuotaiJunanSecurities 19 1.762 1,200 12 9 2.579 -0.817
HSBC 20 1.754 1,195 7 34 0.950 0.804
TOTAL 100% 68,139 549 100%
Bloomberg PreliminaryGlobalEquity|1st3Q2018
BloombergLeagueTableReports Page17
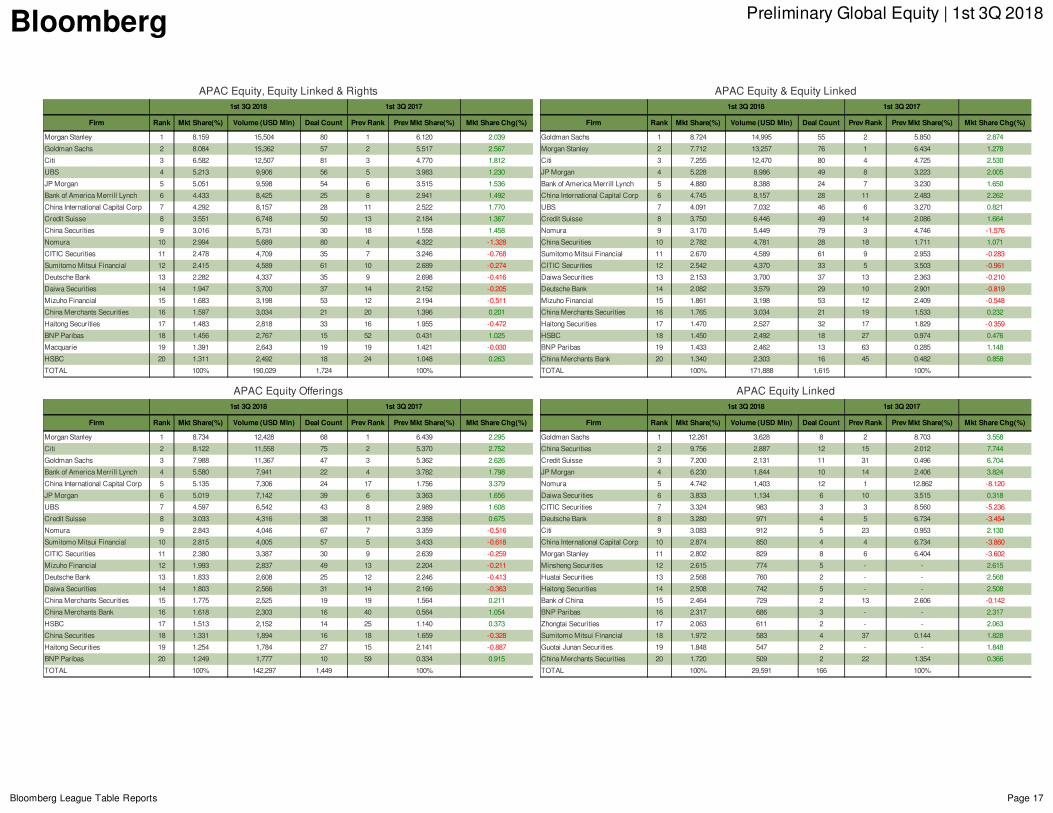
APACEquity,EquityLinked&Rights1st3Q2018 1st3Q2017
Firm Rank MktShare(%) Volume(USDMln) DealCount PrevRank PrevMktShare(%) MktShareChg(%)
MorganStanley 1 8.159 15,504 80 1 6.120 2.039
GoldmanSachs 2 8.084 15,362 57 2 5.517 2.567
Citi 3 6.582 12,507 81 3 4.770 1.812
UBS 4 5.213 9,906 56 5 3.983 1.230
JPMorgan 5 5.051 9,598 54 6 3.515 1.536
BankofAmericaMerrillLynch 6 4.433 8,425 25 8 2.941 1.492
ChinaInternationalCapitalCorp 7 4.292 8,157 28 11 2.522 1.770
CreditSuisse 8 3.551 6,748 50 13 2.184 1.367
ChinaSecurities 9 3.016 5,731 30 18 1.558 1.458
Nomura 10 2.994 5,689 80 4 4.322 -1.328
CITICSecurities 11 2.478 4,709 35 7 3.246 -0.768
SumitomoMitsuiFinancial 12 2.415 4,589 61 10 2.689 -0.274
DeutscheBank 13 2.282 4,337 35 9 2.698 -0.416
DaiwaSecurities 14 1.947 3,700 37 14 2.152 -0.205
MizuhoFinancial 15 1.683 3,198 53 12 2.194 -0.511
ChinaMerchantsSecurities 16 1.597 3,034 21 20 1.396 0.201
HaitongSecurities 17 1.483 2,818 33 16 1.955 -0.472
BNPParibas 18 1.456 2,767 15 52 0.431 1.025
Macquarie 19 1.391 2,643 19 19 1.421 -0.030
HSBC 20 1.311 2,492 18 24 1.048 0.263
TOTAL 100% 190,029 1,724 100%
APACEquity&EquityLinked1st3Q2018 1st3Q2017
Firm Rank MktShare(%) Volume(USDMln) DealCount PrevRank PrevMktShare(%) MktShareChg(%)
GoldmanSachs 1 8.724 14,995 55 2 5.850 2.874
MorganStanley 2 7.712 13,257 76 1 6.434 1.278
Citi 3 7.255 12,470 80 4 4.725 2.530
JPMorgan 4 5.228 8,986 49 8 3.223 2.005
BankofAmericaMerrillLynch 5 4.880 8,388 24 7 3.230 1.650
ChinaInternationalCapitalCorp 6 4.745 8,157 28 11 2.483 2.262
UBS 7 4.091 7,032 46 6 3.270 0.821
CreditSuisse 8 3.750 6,446 49 14 2.086 1.664
Nomura 9 3.170 5,449 79 3 4.746 -1.576
ChinaSecurities 10 2.782 4,781 28 18 1.711 1.071
SumitomoMitsuiFinancial 11 2.670 4,589 61 9 2.953 -0.283
CITICSecurities 12 2.542 4,370 33 5 3.503 -0.961
DaiwaSecurities 13 2.153 3,700 37 13 2.363 -0.210
DeutscheBank 14 2.082 3,579 29 10 2.901 -0.819
MizuhoFinancial 15 1.861 3,198 53 12 2.409 -0.548
ChinaMerchantsSecurities 16 1.765 3,034 21 19 1.533 0.232
HaitongSecurities 17 1.470 2,527 32 17 1.829 -0.359
HSBC 18 1.450 2,492 18 27 0.974 0.476
BNPParibas 19 1.433 2,462 13 63 0.285 1.148
ChinaMerchantsBank 20 1.340 2,303 16 45 0.482 0.858
TOTAL 100% 171,888 1,615 100%
APACEquityOfferings1st3Q2018 1st3Q2017
Firm Rank MktShare(%) Volume(USDMln) DealCount PrevRank PrevMktShare(%) MktShareChg(%)
MorganStanley 1 8.734 12,428 68 1 6.439 2.295
Citi 2 8.122 11,558 75 2 5.370 2.752
GoldmanSachs 3 7.988 11,367 47 3 5.362 2.626
BankofAmericaMerrillLynch 4 5.580 7,941 22 4 3.782 1.798
ChinaInternationalCapitalCorp 5 5.135 7,306 24 17 1.756 3.379
JPMorgan 6 5.019 7,142 39 6 3.363 1.656
UBS 7 4.597 6,542 43 8 2.989 1.608
CreditSuisse 8 3.033 4,316 38 11 2.358 0.675
Nomura 9 2.843 4,046 67 7 3.359 -0.516
SumitomoMitsuiFinancial 10 2.815 4,005 57 5 3.433 -0.618
CITICSecurities 11 2.380 3,387 30 9 2.639 -0.259
MizuhoFinancial 12 1.993 2,837 49 13 2.204 -0.211
DeutscheBank 13 1.833 2,608 25 12 2.246 -0.413
DaiwaSecurities 14 1.803 2,566 31 14 2.166 -0.363
ChinaMerchantsSecurities 15 1.775 2,525 19 19 1.564 0.211
ChinaMerchantsBank 16 1.618 2,303 16 40 0.564 1.054
HSBC 17 1.513 2,152 14 25 1.140 0.373
ChinaSecurities 18 1.331 1,894 16 18 1.659 -0.328
HaitongSecurities 19 1.254 1,784 27 15 2.141 -0.887
BNPParibas 20 1.249 1,777 10 59 0.334 0.915
TOTAL 100% 142,297 1,449 100%
APACEquityLinked1st3Q2018 1st3Q2017
Firm Rank MktShare(%) Volume(USDMln) DealCount PrevRank PrevMktShare(%) MktShareChg(%)
GoldmanSachs 1 12.261 3,628 8 2 8.703 3.558
ChinaSecurities 2 9.756 2,887 12 15 2.012 7.744
CreditSuisse 3 7.200 2,131 11 31 0.496 6.704
JPMorgan 4 6.230 1,844 10 14 2.406 3.824
Nomura 5 4.742 1,403 12 1 12.862 -8.120
DaiwaSecurities 6 3.833 1,134 6 10 3.515 0.318
CITICSecurities 7 3.324 983 3 3 8.560 -5.236
DeutscheBank 8 3.280 971 4 5 6.734 -3.454
Citi 9 3.083 912 5 23 0.953 2.130
ChinaInternationalCapitalCorp 10 2.874 850 4 4 6.734 -3.860
MorganStanley 11 2.802 829 8 6 6.404 -3.602
MinshengSecurities 12 2.615 774 5 - - 2.615
HuataiSecurities 13 2.568 760 2 - - 2.568
HaitongSecurities 14 2.508 742 5 - - 2.508
BankofChina 15 2.464 729 2 13 2.606 -0.142
BNPParibas 16 2.317 686 3 - - 2.317
ZhongtaiSecurities 17 2.063 611 2 - - 2.063
SumitomoMitsuiFinancial 18 1.972 583 4 37 0.144 1.828
GuotaiJunanSecurities 19 1.848 547 2 - - 1.848
ChinaMerchantsSecurities 20 1.720 509 2 22 1.354 0.366
TOTAL 100% 29,591 166 100%
Bloomberg PreliminaryGlobalEquity|1st3Q2018
BloombergLeagueTableReports Page18
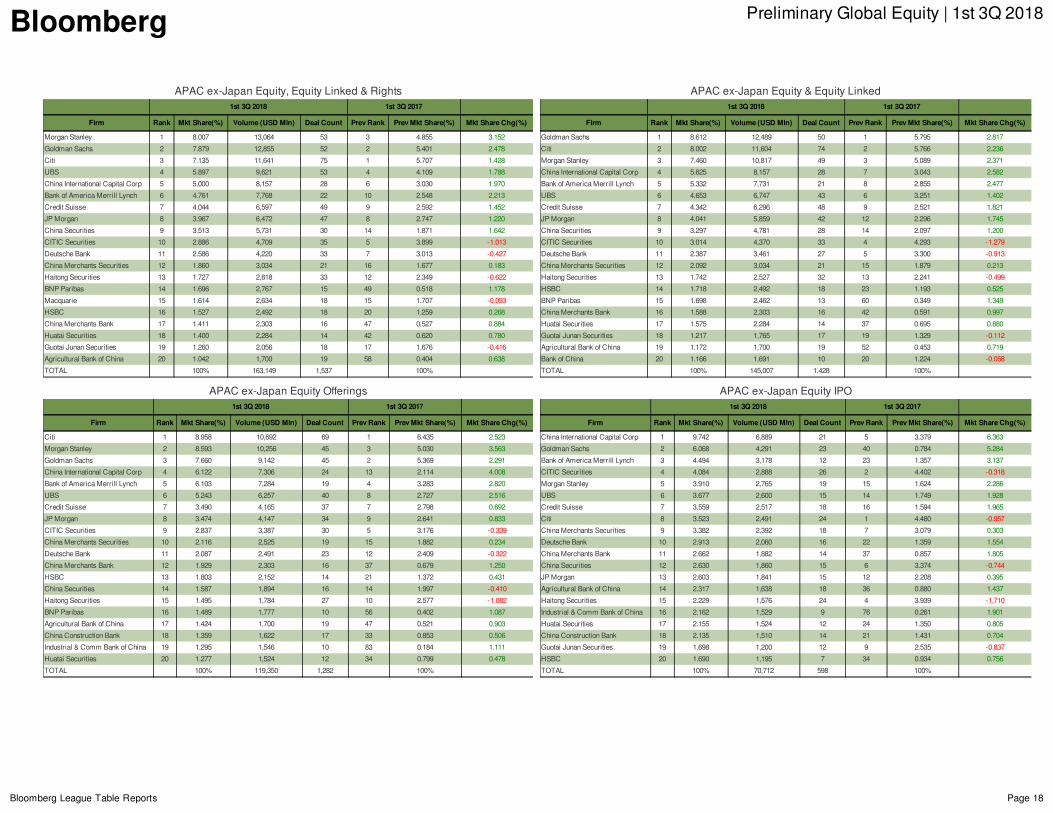
APACex-JapanEquity,EquityLinked&Rights1st3Q2018 1st3Q2017
Firm Rank MktShare(%) Volume(USDMln) DealCount PrevRank PrevMktShare(%) MktShareChg(%)
MorganStanley 1 8.007 13,064 53 3 4.855 3.152
GoldmanSachs 2 7.879 12,855 52 2 5.401 2.478
Citi 3 7.135 11,641 75 1 5.707 1.428
UBS 4 5.897 9,621 53 4 4.109 1.788
ChinaInternationalCapitalCorp 5 5.000 8,157 28 6 3.030 1.970
BankofAmericaMerrillLynch 6 4.761 7,768 22 10 2.548 2.213
CreditSuisse 7 4.044 6,597 49 9 2.592 1.452
JPMorgan 8 3.967 6,472 47 8 2.747 1.220
ChinaSecurities 9 3.513 5,731 30 14 1.871 1.642
CITICSecurities 10 2.886 4,709 35 5 3.899 -1.013
DeutscheBank 11 2.586 4,220 33 7 3.013 -0.427
ChinaMerchantsSecurities 12 1.860 3,034 21 16 1.677 0.183
HaitongSecurities 13 1.727 2,818 33 12 2.349 -0.622
BNPParibas 14 1.696 2,767 15 49 0.518 1.178
Macquarie 15 1.614 2,634 18 15 1.707 -0.093
HSBC 16 1.527 2,492 18 20 1.259 0.268
ChinaMerchantsBank 17 1.411 2,303 16 47 0.527 0.884
HuataiSecurities 18 1.400 2,284 14 42 0.620 0.780
GuotaiJunanSecurities 19 1.260 2,056 18 17 1.676 -0.416
AgriculturalBankofChina 20 1.042 1,700 19 58 0.404 0.638
TOTAL 100% 163,149 1,537 100%
APACex-JapanEquity&EquityLinked1st3Q2018 1st3Q2017
Firm Rank MktShare(%) Volume(USDMln) DealCount PrevRank PrevMktShare(%) MktShareChg(%)
GoldmanSachs 1 8.612 12,489 50 1 5.795 2.817
Citi 2 8.002 11,604 74 2 5.766 2.236
MorganStanley 3 7.460 10,817 49 3 5.089 2.371
ChinaInternationalCapitalCorp 4 5.625 8,157 28 7 3.043 2.582
BankofAmericaMerrillLynch 5 5.332 7,731 21 8 2.855 2.477
UBS 6 4.653 6,747 43 6 3.251 1.402
CreditSuisse 7 4.342 6,296 48 9 2.521 1.821
JPMorgan 8 4.041 5,859 42 12 2.296 1.745
ChinaSecurities 9 3.297 4,781 28 14 2.097 1.200
CITICSecurities 10 3.014 4,370 33 4 4.293 -1.279
DeutscheBank 11 2.387 3,461 27 5 3.300 -0.913
ChinaMerchantsSecurities 12 2.092 3,034 21 15 1.879 0.213
HaitongSecurities 13 1.742 2,527 32 13 2.241 -0.499
HSBC 14 1.718 2,492 18 23 1.193 0.525
BNPParibas 15 1.698 2,462 13 60 0.349 1.349
ChinaMerchantsBank 16 1.588 2,303 16 42 0.591 0.997
HuataiSecurities 17 1.575 2,284 14 37 0.695 0.880
GuotaiJunanSecurities 18 1.217 1,765 17 19 1.329 -0.112
AgriculturalBankofChina 19 1.172 1,700 19 52 0.453 0.719
BankofChina 20 1.166 1,691 10 20 1.224 -0.058
TOTAL 100% 145,007 1,428 100%
APACex-JapanEquityOfferings1st3Q2018 1st3Q2017
Firm Rank MktShare(%) Volume(USDMln) DealCount PrevRank PrevMktShare(%) MktShareChg(%)
Citi 1 8.958 10,692 69 1 6.435 2.523
MorganStanley 2 8.593 10,256 45 3 5.030 3.563
GoldmanSachs 3 7.660 9,142 45 2 5.369 2.291
ChinaInternationalCapitalCorp 4 6.122 7,306 24 13 2.114 4.008
BankofAmericaMerrillLynch 5 6.103 7,284 19 4 3.283 2.820
UBS 6 5.243 6,257 40 8 2.727 2.516
CreditSuisse 7 3.490 4,165 37 7 2.798 0.692
JPMorgan 8 3.474 4,147 34 9 2.641 0.833
CITICSecurities 9 2.837 3,387 30 5 3.176 -0.339
ChinaMerchantsSecurities 10 2.116 2,525 19 15 1.882 0.234
DeutscheBank 11 2.087 2,491 23 12 2.409 -0.322
ChinaMerchantsBank 12 1.929 2,303 16 37 0.679 1.250
HSBC 13 1.803 2,152 14 21 1.372 0.431
ChinaSecurities 14 1.587 1,894 16 14 1.997 -0.410
HaitongSecurities 15 1.495 1,784 27 10 2.577 -1.082
BNPParibas 16 1.489 1,777 10 56 0.402 1.087
AgriculturalBankofChina 17 1.424 1,700 19 47 0.521 0.903
ChinaConstructionBank 18 1.359 1,622 17 33 0.853 0.506
Industrial&CommBankofChina 19 1.295 1,546 10 83 0.184 1.111
HuataiSecurities 20 1.277 1,524 12 34 0.799 0.478
TOTAL 100% 119,350 1,282 100%
APACex-JapanEquityIPO1st3Q2018 1st3Q2017
Firm Rank MktShare(%) Volume(USDMln) DealCount PrevRank PrevMktShare(%) MktShareChg(%)
ChinaInternationalCapitalCorp 1 9.742 6,889 21 5 3.379 6.363
GoldmanSachs 2 6.068 4,291 23 40 0.784 5.284
BankofAmericaMerrillLynch 3 4.494 3,178 12 23 1.357 3.137
CITICSecurities 4 4.084 2,888 26 2 4.402 -0.318
MorganStanley 5 3.910 2,765 19 15 1.624 2.286
UBS 6 3.677 2,600 15 14 1.749 1.928
CreditSuisse 7 3.559 2,517 18 16 1.594 1.965
Citi 8 3.523 2,491 24 1 4.480 -0.957
ChinaMerchantsSecurities 9 3.382 2,392 18 7 3.079 0.303
DeutscheBank 10 2.913 2,060 16 22 1.359 1.554
ChinaMerchantsBank 11 2.662 1,882 14 37 0.857 1.805
ChinaSecurities 12 2.630 1,860 15 6 3.374 -0.744
JPMorgan 13 2.603 1,841 15 12 2.208 0.395
AgriculturalBankofChina 14 2.317 1,638 18 36 0.880 1.437
HaitongSecurities 15 2.229 1,576 24 4 3.939 -1.710
Industrial&CommBankofChina 16 2.162 1,529 9 76 0.261 1.901
HuataiSecurities 17 2.155 1,524 12 24 1.350 0.805
ChinaConstructionBank 18 2.135 1,510 14 21 1.431 0.704
GuotaiJunanSecurities 19 1.698 1,200 12 9 2.535 -0.837
HSBC 20 1.690 1,195 7 34 0.934 0.756
TOTAL 100% 70,712 598 100%
Bloomberg PreliminaryGlobalEquity|1st3Q2018
BloombergLeagueTableReports Page19
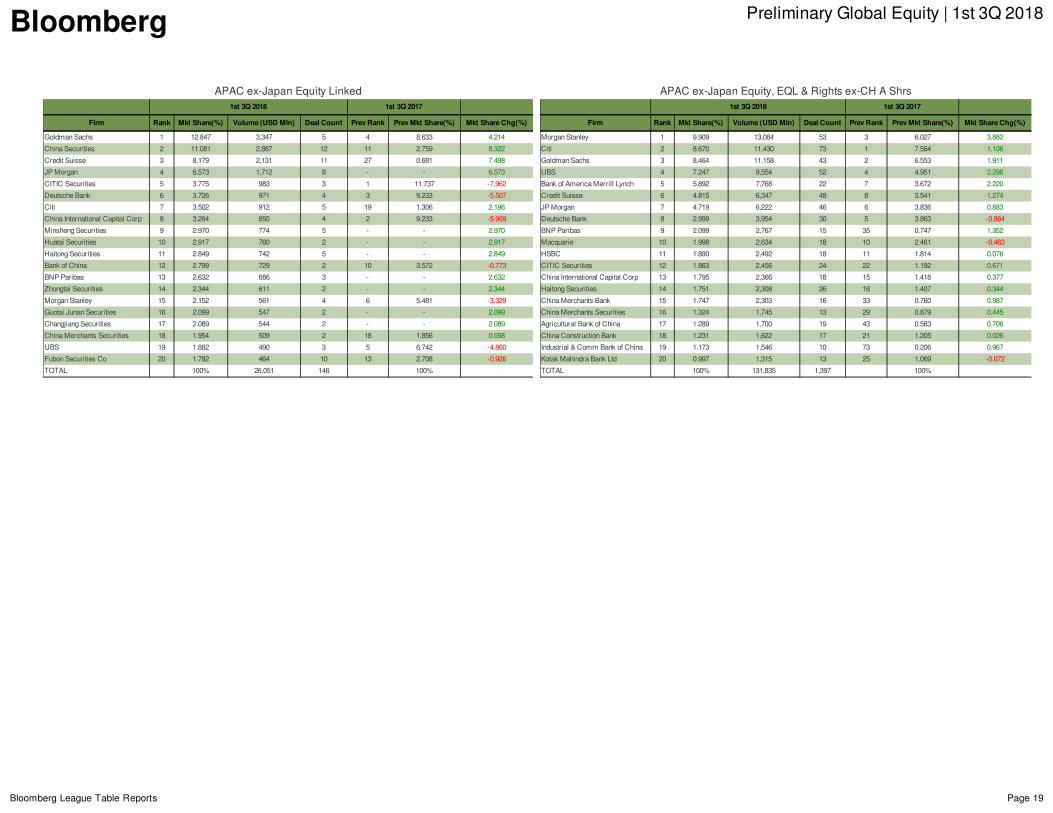
APACex-JapanEquityLinked1st3Q2018 1st3Q2017
Firm Rank MktShare(%) Volume(USDMln) DealCount PrevRank PrevMktShare(%) MktShareChg(%)
GoldmanSachs 1 12.847 3,347 5 4 8.633 4.214
ChinaSecurities 2 11.081 2,887 12 11 2.759 8.322
CreditSuisse 3 8.179 2,131 11 27 0.681 7.498
JPMorgan 4 6.573 1,712 8 - - 6.573
CITICSecurities 5 3.775 983 3 1 11.737 -7.962
DeutscheBank 6 3.726 971 4 3 9.233 -5.507
Citi 7 3.502 912 5 19 1.306 2.196
ChinaInternationalCapitalCorp 8 3.264 850 4 2 9.233 -5.969
MinshengSecurities 9 2.970 774 5 - - 2.970
HuataiSecurities 10 2.917 760 2 - - 2.917
HaitongSecurities 11 2.849 742 5 - - 2.849
BankofChina 12 2.799 729 2 10 3.572 -0.773
BNPParibas 13 2.632 686 3 - - 2.632
ZhongtaiSecurities 14 2.344 611 2 - - 2.344
MorganStanley 15 2.152 561 4 6 5.481 -3.329
GuotaiJunanSecurities 16 2.099 547 2 - - 2.099
ChangjiangSecurities 17 2.089 544 2 - - 2.089
ChinaMerchantsSecurities 18 1.954 509 2 18 1.856 0.098
UBS 19 1.882 490 3 5 6.742 -4.860
FubonSecuritiesCo 20 1.782 464 10 13 2.708 -0.926
TOTAL 100% 26,051 146 100%
APACex-JapanEquity,EQL&Rightsex-CHAShrs1st3Q2018 1st3Q2017
Firm Rank MktShare(%) Volume(USDMln) DealCount PrevRank PrevMktShare(%) MktShareChg(%)
MorganStanley 1 9.909 13,064 53 3 6.027 3.882
Citi 2 8.670 11,430 73 1 7.564 1.106
GoldmanSachs 3 8.464 11,158 43 2 6.553 1.911
UBS 4 7.247 9,554 52 4 4.951 2.296
BankofAmericaMerrillLynch 5 5.892 7,768 22 7 3.672 2.220
CreditSuisse 6 4.815 6,347 48 8 3.541 1.274
JPMorgan 7 4.719 6,222 46 6 3.836 0.883
DeutscheBank 8 2.999 3,954 30 5 3.863 -0.864
BNPParibas 9 2.099 2,767 15 35 0.747 1.352
Macquarie 10 1.998 2,634 18 10 2.461 -0.463
HSBC 11 1.890 2,492 18 11 1.814 0.076
CITICSecurities 12 1.863 2,456 24 22 1.192 0.671
ChinaInternationalCapitalCorp 13 1.795 2,366 18 15 1.418 0.377
HaitongSecurities 14 1.751 2,308 26 16 1.407 0.344
ChinaMerchantsBank 15 1.747 2,303 16 33 0.760 0.987
ChinaMerchantsSecurities 16 1.324 1,745 13 29 0.879 0.445
AgriculturalBankofChina 17 1.289 1,700 19 43 0.583 0.706
ChinaConstructionBank 18 1.231 1,622 17 21 1.205 0.026
Industrial&CommBankofChina 19 1.173 1,546 10 73 0.206 0.967
KotakMahindraBankLtd 20 0.997 1,315 13 25 1.069 -0.072
TOTAL 100% 131,835 1,397 100%
Bloomberg PreliminaryGlobalEquity|1st3Q2018
BloombergLeagueTableReports Page20
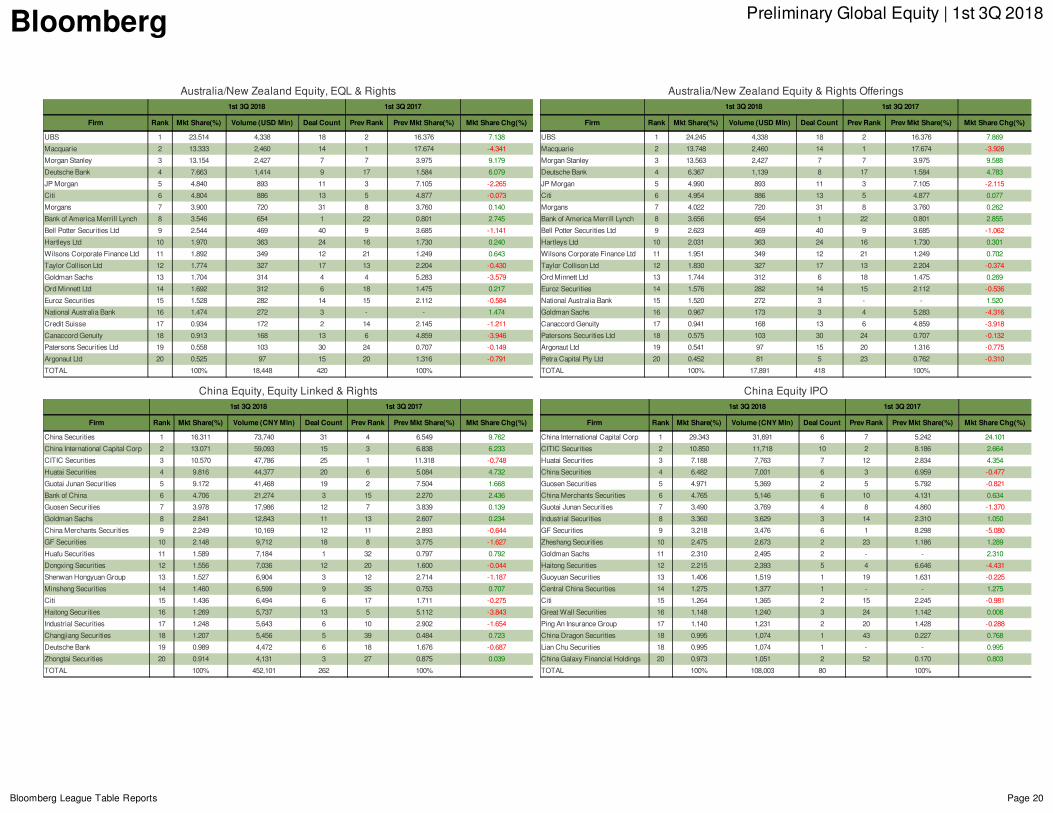
Australia/NewZealandEquity,EQL&Rights1st3Q2018 1st3Q2017
Firm Rank MktShare(%) Volume(USDMln) DealCount PrevRank PrevMktShare(%) MktShareChg(%)
UBS 1 23.514 4,338 18 2 16.376 7.138
Macquarie 2 13.333 2,460 14 1 17.674 -4.341
MorganStanley 3 13.154 2,427 7 7 3.975 9.179
DeutscheBank 4 7.663 1,414 9 17 1.584 6.079
JPMorgan 5 4.840 893 11 3 7.105 -2.265
Citi 6 4.804 886 13 5 4.877 -0.073
Morgans 7 3.900 720 31 8 3.760 0.140
BankofAmericaMerrillLynch 8 3.546 654 1 22 0.801 2.745
BellPotterSecuritiesLtd 9 2.544 469 40 9 3.685 -1.141
HartleysLtd 10 1.970 363 24 16 1.730 0.240
WilsonsCorporateFinanceLtd 11 1.892 349 12 21 1.249 0.643
TaylorCollisonLtd 12 1.774 327 17 13 2.204 -0.430
GoldmanSachs 13 1.704 314 4 4 5.283 -3.579
OrdMinnettLtd 14 1.692 312 6 18 1.475 0.217
EurozSecurities 15 1.528 282 14 15 2.112 -0.584
NationalAustraliaBank 16 1.474 272 3 - - 1.474
CreditSuisse 17 0.934 172 2 14 2.145 -1.211
CanaccordGenuity 18 0.913 168 13 6 4.859 -3.946
PatersonsSecuritiesLtd 19 0.558 103 30 24 0.707 -0.149
ArgonautLtd 20 0.525 97 15 20 1.316 -0.791
TOTAL 100% 18,448 420 100%
Australia/NewZealandEquity&RightsOfferings1st3Q2018 1st3Q2017
Firm Rank MktShare(%) Volume(USDMln) DealCount PrevRank PrevMktShare(%) MktShareChg(%)
UBS 1 24.245 4,338 18 2 16.376 7.869
Macquarie 2 13.748 2,460 14 1 17.674 -3.926
MorganStanley 3 13.563 2,427 7 7 3.975 9.588
DeutscheBank 4 6.367 1,139 8 17 1.584 4.783
JPMorgan 5 4.990 893 11 3 7.105 -2.115
Citi 6 4.954 886 13 5 4.877 0.077
Morgans 7 4.022 720 31 8 3.760 0.262
BankofAmericaMerrillLynch 8 3.656 654 1 22 0.801 2.855
BellPotterSecuritiesLtd 9 2.623 469 40 9 3.685 -1.062
HartleysLtd 10 2.031 363 24 16 1.730 0.301
WilsonsCorporateFinanceLtd 11 1.951 349 12 21 1.249 0.702
TaylorCollisonLtd 12 1.830 327 17 13 2.204 -0.374
OrdMinnettLtd 13 1.744 312 6 18 1.475 0.269
EurozSecurities 14 1.576 282 14 15 2.112 -0.536
NationalAustraliaBank 15 1.520 272 3 - - 1.520
GoldmanSachs 16 0.967 173 3 4 5.283 -4.316
CanaccordGenuity 17 0.941 168 13 6 4.859 -3.918
PatersonsSecuritiesLtd 18 0.575 103 30 24 0.707 -0.132
ArgonautLtd 19 0.541 97 15 20 1.316 -0.775
PetraCapitalPtyLtd 20 0.452 81 5 23 0.762 -0.310
TOTAL 100% 17,891 418 100%
ChinaEquity,EquityLinked&Rights1st3Q2018 1st3Q2017
Firm Rank MktShare(%) Volume(CNYMln) DealCount PrevRank PrevMktShare(%) MktShareChg(%)
ChinaSecurities 1 16.311 73,740 31 4 6.549 9.762
ChinaInternationalCapitalCorp 2 13.071 59,093 15 3 6.838 6.233
CITICSecurities 3 10.570 47,786 25 1 11.318 -0.748
HuataiSecurities 4 9.816 44,377 20 6 5.084 4.732
GuotaiJunanSecurities 5 9.172 41,468 19 2 7.504 1.668
BankofChina 6 4.706 21,274 3 15 2.270 2.436
GuosenSecurities 7 3.978 17,986 12 7 3.839 0.139
GoldmanSachs 8 2.841 12,843 11 13 2.607 0.234
ChinaMerchantsSecurities 9 2.249 10,169 12 11 2.893 -0.644
GFSecurities 10 2.148 9,712 18 8 3.775 -1.627
HuafuSecurities 11 1.589 7,184 1 32 0.797 0.792
DongxingSecurities 12 1.556 7,036 12 20 1.600 -0.044
ShenwanHongyuanGroup 13 1.527 6,904 3 12 2.714 -1.187
MinshengSecurities 14 1.460 6,599 9 35 0.753 0.707
Citi 15 1.436 6,494 6 17 1.711 -0.275
HaitongSecurities 16 1.269 5,737 13 5 5.112 -3.843
IndustrialSecurities 17 1.248 5,643 6 10 2.902 -1.654
ChangjiangSecurities 18 1.207 5,456 5 39 0.484 0.723
DeutscheBank 19 0.989 4,472 6 18 1.676 -0.687
ZhongtaiSecurities 20 0.914 4,131 3 27 0.875 0.039
TOTAL 100% 452,101 262 100%
ChinaEquityIPO1st3Q2018 1st3Q2017
Firm Rank MktShare(%) Volume(CNYMln) DealCount PrevRank PrevMktShare(%) MktShareChg(%)
ChinaInternationalCapitalCorp 1 29.343 31,691 6 7 5.242 24.101
CITICSecurities 2 10.850 11,718 10 2 8.186 2.664
HuataiSecurities 3 7.188 7,763 7 12 2.834 4.354
ChinaSecurities 4 6.482 7,001 6 3 6.959 -0.477
GuosenSecurities 5 4.971 5,369 2 5 5.792 -0.821
ChinaMerchantsSecurities 6 4.765 5,146 6 10 4.131 0.634
GuotaiJunanSecurities 7 3.490 3,769 4 8 4.860 -1.370
IndustrialSecurities 8 3.360 3,629 3 14 2.310 1.050
GFSecurities 9 3.218 3,476 6 1 8.298 -5.080
ZheshangSecurities 10 2.475 2,673 2 23 1.186 1.289
GoldmanSachs 11 2.310 2,495 2 - - 2.310
HaitongSecurities 12 2.215 2,393 5 4 6.646 -4.431
GuoyuanSecurities 13 1.406 1,519 1 19 1.631 -0.225
CentralChinaSecurities 14 1.275 1,377 1 - - 1.275
Citi 15 1.264 1,365 2 15 2.245 -0.981
GreatWallSecurities 16 1.148 1,240 3 24 1.142 0.006
PingAnInsuranceGroup 17 1.140 1,231 2 20 1.428 -0.288
ChinaDragonSecurities 18 0.995 1,074 1 43 0.227 0.768
LianChuSecurities 18 0.995 1,074 1 - - 0.995
ChinaGalaxyFinancialHoldings 20 0.973 1,051 2 52 0.170 0.803
TOTAL 100% 108,003 80 100%
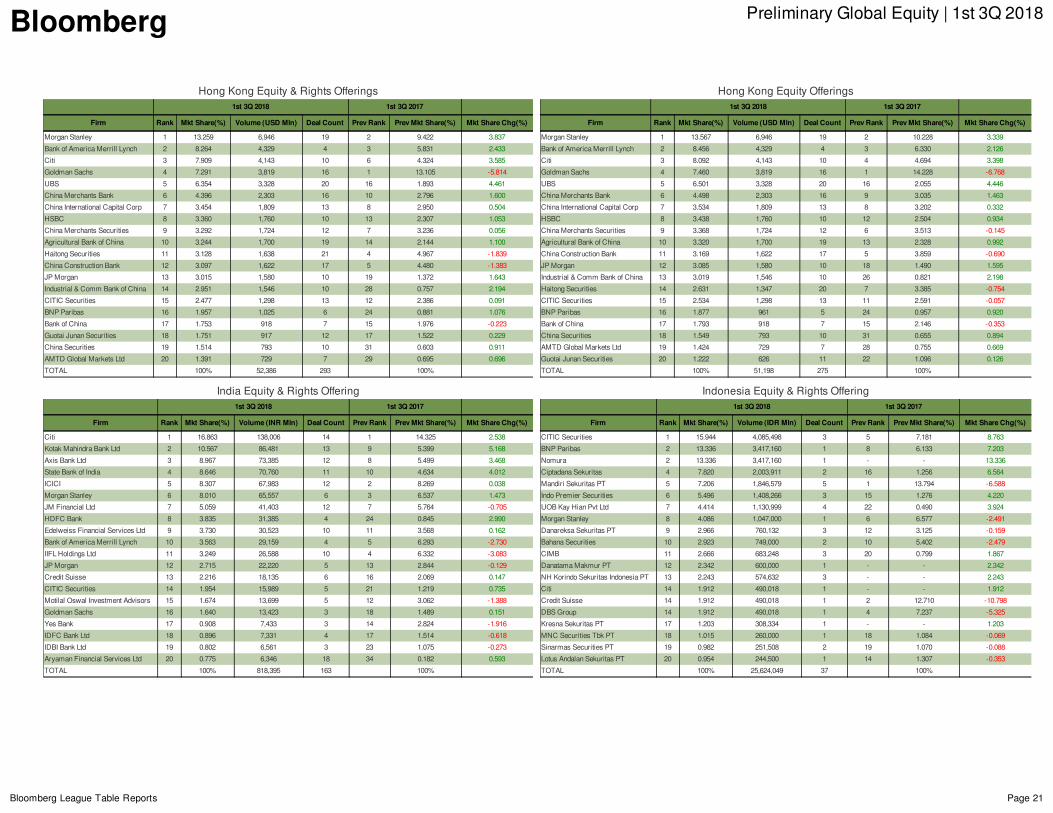
Bloomberg PreliminaryGlobalEquity|1st3Q2018
BloombergLeagueTableReports Page21
HongKongEquity&RightsOfferings1st3Q2018 1st3Q2017
Firm Rank MktShare(%) Volume(USDMln) DealCount PrevRank PrevMktShare(%) MktShareChg(%)
MorganStanley 1 13.259 6,946 19 2 9.422 3.837
BankofAmericaMerrillLynch 2 8.264 4,329 4 3 5.831 2.433
Citi 3 7.909 4,143 10 6 4.324 3.585
GoldmanSachs 4 7.291 3,819 16 1 13.105 -5.814
UBS 5 6.354 3,328 20 16 1.893 4.461
ChinaMerchantsBank 6 4.396 2,303 16 10 2.796 1.600
ChinaInternationalCapitalCorp 7 3.454 1,809 13 8 2.950 0.504
HSBC 8 3.360 1,760 10 13 2.307 1.053
ChinaMerchantsSecurities 9 3.292 1,724 12 7 3.236 0.056
AgriculturalBankofChina 10 3.244 1,700 19 14 2.144 1.100
HaitongSecurities 11 3.128 1,638 21 4 4.967 -1.839
ChinaConstructionBank 12 3.097 1,622 17 5 4.480 -1.383
JPMorgan 13 3.015 1,580 10 19 1.372 1.643
Industrial&CommBankofChina 14 2.951 1,546 10 28 0.757 2.194
CITICSecurities 15 2.477 1,298 13 12 2.386 0.091
BNPParibas 16 1.957 1,025 6 24 0.881 1.076
BankofChina 17 1.753 918 7 15 1.976 -0.223
GuotaiJunanSecurities 18 1.751 917 12 17 1.522 0.229
ChinaSecurities 19 1.514 793 10 31 0.603 0.911
AMTDGlobalMarketsLtd 20 1.391 729 7 29 0.695 0.696
TOTAL 100% 52,386 293 100%
HongKongEquityOfferings1st3Q2018 1st3Q2017
Firm Rank MktShare(%) Volume(USDMln) DealCount PrevRank PrevMktShare(%) MktShareChg(%)
MorganStanley 1 13.567 6,946 19 2 10.228 3.339
BankofAmericaMerrillLynch 2 8.456 4,329 4 3 6.330 2.126
Citi 3 8.092 4,143 10 4 4.694 3.398
GoldmanSachs 4 7.460 3,819 16 1 14.228 -6.768
UBS 5 6.501 3,328 20 16 2.055 4.446
ChinaMerchantsBank 6 4.498 2,303 16 9 3.035 1.463
ChinaInternationalCapitalCorp 7 3.534 1,809 13 8 3.202 0.332
HSBC 8 3.438 1,760 10 12 2.504 0.934
ChinaMerchantsSecurities 9 3.368 1,724 12 6 3.513 -0.145
AgriculturalBankofChina 10 3.320 1,700 19 13 2.328 0.992
ChinaConstructionBank 11 3.169 1,622 17 5 3.859 -0.690
JPMorgan 12 3.085 1,580 10 18 1.490 1.595
Industrial&CommBankofChina 13 3.019 1,546 10 26 0.821 2.198
HaitongSecurities 14 2.631 1,347 20 7 3.385 -0.754
CITICSecurities 15 2.534 1,298 13 11 2.591 -0.057
BNPParibas 16 1.877 961 5 24 0.957 0.920
BankofChina 17 1.793 918 7 15 2.146 -0.353
ChinaSecurities 18 1.549 793 10 31 0.655 0.894
AMTDGlobalMarketsLtd 19 1.424 729 7 28 0.755 0.669
GuotaiJunanSecurities 20 1.222 626 11 22 1.096 0.126
TOTAL 100% 51,198 275 100%
IndiaEquity&RightsOffering1st3Q2018 1st3Q2017
Firm Rank MktShare(%) Volume(INRMln) DealCount PrevRank PrevMktShare(%) MktShareChg(%)
Citi 1 16.863 138,006 14 1 14.325 2.538
KotakMahindraBankLtd 2 10.567 86,481 13 9 5.399 5.168
AxisBankLtd 3 8.967 73,385 12 8 5.499 3.468
StateBankofIndia 4 8.646 70,760 11 10 4.634 4.012
ICICI 5 8.307 67,983 12 2 8.269 0.038
MorganStanley 6 8.010 65,557 6 3 6.537 1.473
JMFinancialLtd 7 5.059 41,403 12 7 5.764 -0.705
HDFCBank 8 3.835 31,385 4 24 0.845 2.990
EdelweissFinancialServicesLtd 9 3.730 30,523 10 11 3.568 0.162
BankofAmericaMerrillLynch 10 3.563 29,159 4 5 6.293 -2.730
IIFLHoldingsLtd 11 3.249 26,588 10 4 6.332 -3.083
JPMorgan 12 2.715 22,220 5 13 2.844 -0.129
CreditSuisse 13 2.216 18,135 6 16 2.069 0.147
CITICSecurities 14 1.954 15,989 5 21 1.219 0.735
MotilalOswalInvestmentAdvisors 15 1.674 13,699 5 12 3.062 -1.388
GoldmanSachs 16 1.640 13,423 3 18 1.489 0.151
YesBank 17 0.908 7,433 3 14 2.824 -1.916
IDFCBankLtd 18 0.896 7,331 4 17 1.514 -0.618
IDBIBankLtd 19 0.802 6,561 3 23 1.075 -0.273
AryamanFinancialServicesLtd 20 0.775 6,346 18 34 0.182 0.593
TOTAL 100% 818,395 163 100%
IndonesiaEquity&RightsOffering1st3Q2018 1st3Q2017
Firm Rank MktShare(%) Volume(IDRMln) DealCount PrevRank PrevMktShare(%) MktShareChg(%)
CITICSecurities 1 15.944 4,085,498 3 5 7.181 8.763
BNPParibas 2 13.336 3,417,160 1 8 6.133 7.203
Nomura 2 13.336 3,417,160 1 - - 13.336
CiptadanaSekuritas 4 7.820 2,003,911 2 16 1.256 6.564
MandiriSekuritasPT 5 7.206 1,846,579 5 1 13.794 -6.588
IndoPremierSecurities 6 5.496 1,408,266 3 15 1.276 4.220
UOBKayHianPvtLtd 7 4.414 1,130,999 4 22 0.490 3.924
MorganStanley 8 4.086 1,047,000 1 6 6.577 -2.491
DanareksaSekuritasPT 9 2.966 760,132 3 12 3.125 -0.159
BahanaSecurities 10 2.923 749,000 2 10 5.402 -2.479
CIMB 11 2.666 683,248 3 20 0.799 1.867
DanatamaMakmurPT 12 2.342 600,000 1 - - 2.342
NHKorindoSekuritasIndonesiaPT 13 2.243 574,632 3 - - 2.243
Citi 14 1.912 490,018 1 - - 1.912
CreditSuisse 14 1.912 490,018 1 2 12.710 -10.798
DBSGroup 14 1.912 490,018 1 4 7.237 -5.325
KresnaSekuritasPT 17 1.203 308,334 1 - - 1.203
MNCSecuritiesTbkPT 18 1.015 260,000 1 18 1.084 -0.069
SinarmasSecuritiesPT 19 0.982 251,508 2 19 1.070 -0.088
LotusAndalanSekuritasPT 20 0.954 244,500 1 14 1.307 -0.353
TOTAL 100% 25,624,049 37 100%
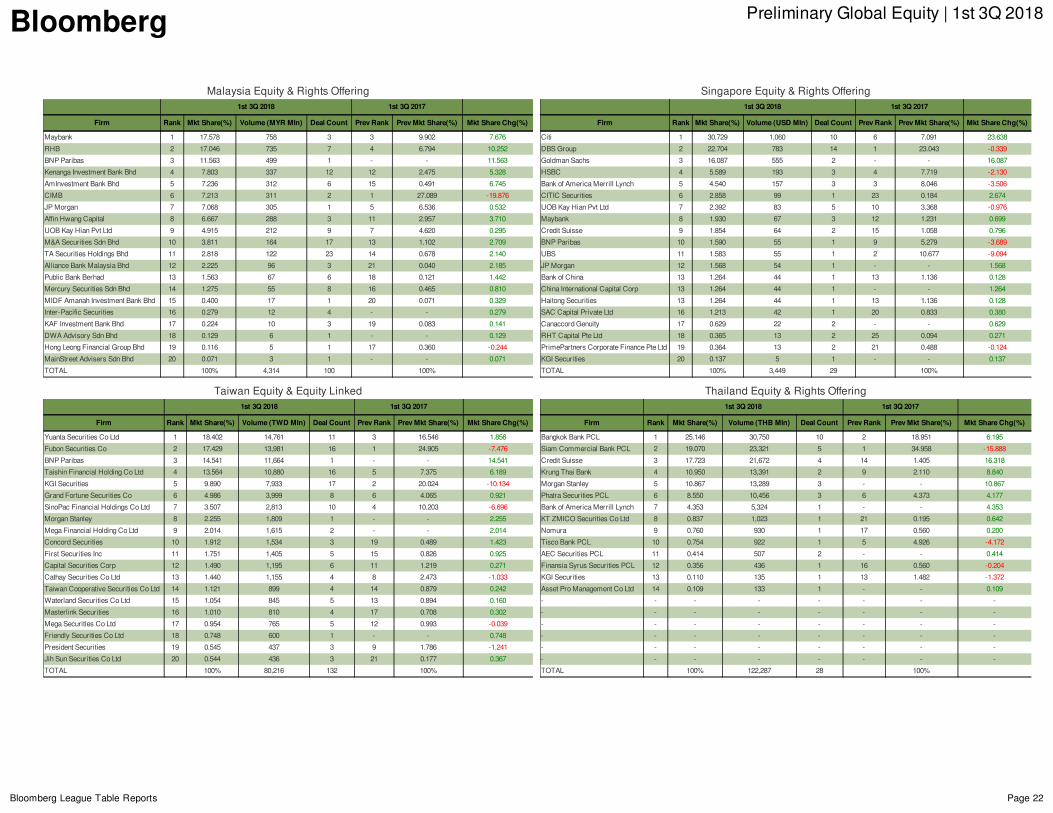
Bloomberg PreliminaryGlobalEquity|1st3Q2018
BloombergLeagueTableReports Page22
MalaysiaEquity&RightsOffering1st3Q2018 1st3Q2017
Firm Rank MktShare(%) Volume(MYRMln) DealCount PrevRank PrevMktShare(%) MktShareChg(%)
Maybank 1 17.578 758 3 3 9.902 7.676
RHB 2 17.046 735 7 4 6.794 10.252
BNPParibas 3 11.563 499 1 - - 11.563
KenangaInvestmentBankBhd 4 7.803 337 12 12 2.475 5.328
AmInvestmentBankBhd 5 7.236 312 6 15 0.491 6.745
CIMB 6 7.213 311 2 1 27.089 -19.876
JPMorgan 7 7.068 305 1 5 6.536 0.532
AffinHwangCapital 8 6.667 288 3 11 2.957 3.710
UOBKayHianPvtLtd 9 4.915 212 9 7 4.620 0.295
M&ASecuritiesSdnBhd 10 3.811 164 17 13 1.102 2.709
TASecuritiesHoldingsBhd 11 2.818 122 23 14 0.678 2.140
AllianceBankMalaysiaBhd 12 2.225 96 3 21 0.040 2.185
PublicBankBerhad 13 1.563 67 6 18 0.121 1.442
MercurySecuritiesSdnBhd 14 1.275 55 8 16 0.465 0.810
MIDFAmanahInvestmentBankBhd 15 0.400 17 1 20 0.071 0.329
Inter-PacificSecurities 16 0.279 12 4 - - 0.279
KAFInvestmentBankBhd 17 0.224 10 3 19 0.083 0.141
DWAAdvisorySdnBhd 18 0.129 6 1 - - 0.129
HongLeongFinancialGroupBhd 19 0.116 5 1 17 0.360 -0.244
MainStreetAdvisersSdnBhd 20 0.071 3 1 - - 0.071
TOTAL 100% 4,314 100 100%
SingaporeEquity&RightsOffering1st3Q2018 1st3Q2017
Firm Rank MktShare(%) Volume(USDMln) DealCount PrevRank PrevMktShare(%) MktShareChg(%)
Citi 1 30.729 1,060 10 6 7.091 23.638
DBSGroup 2 22.704 783 14 1 23.043 -0.339
GoldmanSachs 3 16.087 555 2 - - 16.087
HSBC 4 5.589 193 3 4 7.719 -2.130
BankofAmericaMerrillLynch 5 4.540 157 3 3 8.046 -3.506
CITICSecurities 6 2.858 99 1 23 0.184 2.674
UOBKayHianPvtLtd 7 2.392 83 5 10 3.368 -0.976
Maybank 8 1.930 67 3 12 1.231 0.699
CreditSuisse 9 1.854 64 2 15 1.058 0.796
BNPParibas 10 1.590 55 1 9 5.279 -3.689
UBS 11 1.583 55 1 2 10.677 -9.094
JPMorgan 12 1.568 54 1 - - 1.568
BankofChina 13 1.264 44 1 13 1.136 0.128
ChinaInternationalCapitalCorp 13 1.264 44 1 - - 1.264
HaitongSecurities 13 1.264 44 1 13 1.136 0.128
SACCapitalPrivateLtd 16 1.213 42 1 20 0.833 0.380
CanaccordGenuity 17 0.629 22 2 - - 0.629
RHTCapitalPteLtd 18 0.365 13 2 25 0.094 0.271
PrimePartnersCorporateFinancePteLtd 19 0.364 13 2 21 0.488 -0.124
KGISecurities 20 0.137 5 1 - - 0.137
TOTAL 100% 3,449 29 100%
TaiwanEquity&EquityLinked1st3Q2018 1st3Q2017
Firm Rank MktShare(%) Volume(TWDMln) DealCount PrevRank PrevMktShare(%) MktShareChg(%)
YuantaSecuritiesCoLtd 1 18.402 14,761 11 3 16.546 1.856
FubonSecuritiesCo 2 17.429 13,981 16 1 24.905 -7.476
BNPParibas 3 14.541 11,664 1 - - 14.541
TaishinFinancialHoldingCoLtd 4 13.564 10,880 16 5 7.375 6.189
KGISecurities 5 9.890 7,933 17 2 20.024 -10.134
GrandFortuneSecuritiesCo 6 4.986 3,999 8 6 4.065 0.921
SinoPacFinancialHoldingsCoLtd 7 3.507 2,813 10 4 10.203 -6.696
MorganStanley 8 2.255 1,809 1 - - 2.255
MegaFinancialHoldingCoLtd 9 2.014 1,615 2 - - 2.014
ConcordSecurities 10 1.912 1,534 3 19 0.489 1.423
FirstSecuritiesInc 11 1.751 1,405 5 15 0.826 0.925
CapitalSecuritiesCorp 12 1.490 1,195 6 11 1.219 0.271
CathaySecuritiesCoLtd 13 1.440 1,155 4 8 2.473 -1.033
TaiwanCooperativeSecuritiesCoLtd 14 1.121 899 4 14 0.879 0.242
WaterlandSecuritiesCoLtd 15 1.054 845 5 13 0.894 0.160
MasterlinkSecurities 16 1.010 810 4 17 0.708 0.302
MegaSecuritiesCoLtd 17 0.954 765 5 12 0.993 -0.039
FriendlySecuritiesCoLtd 18 0.748 600 1 - - 0.748
PresidentSecurities 19 0.545 437 3 9 1.786 -1.241
JihSunSecuritiesCoLtd 20 0.544 436 3 21 0.177 0.367
TOTAL 100% 80,216 132 100%
ThailandEquity&RightsOffering1st3Q2018 1st3Q2017
Firm Rank MktShare(%) Volume(THBMln) DealCount PrevRank PrevMktShare(%) MktShareChg(%)
BangkokBankPCL 1 25.146 30,750 10 2 18.951 6.195
SiamCommercialBankPCL 2 19.070 23,321 5 1 34.958 -15.888
CreditSuisse 3 17.723 21,672 4 14 1.405 16.318
KrungThaiBank 4 10.950 13,391 2 9 2.110 8.840
MorganStanley 5 10.867 13,289 3 - - 10.867
PhatraSecuritiesPCL 6 8.550 10,456 3 6 4.373 4.177
BankofAmericaMerrillLynch 7 4.353 5,324 1 - - 4.353
KTZMICOSecuritiesCoLtd 8 0.837 1,023 1 21 0.195 0.642
Nomura 9 0.760 930 1 17 0.560 0.200
TiscoBankPCL 10 0.754 922 1 5 4.926 -4.172
AECSecuritiesPCL 11 0.414 507 2 - - 0.414
FinansiaSyrusSecuritiesPCL 12 0.356 436 1 16 0.560 -0.204
KGISecurities 13 0.110 135 1 13 1.482 -1.372
AssetProManagementCoLtd 14 0.109 133 1 - - 0.109
- - - - - - - -
- - - - - - - -
- - - - - - - -
- - - - - - - -
- - - - - - - -
- - - - - - - -
TOTAL 100% 122,287 28 100%
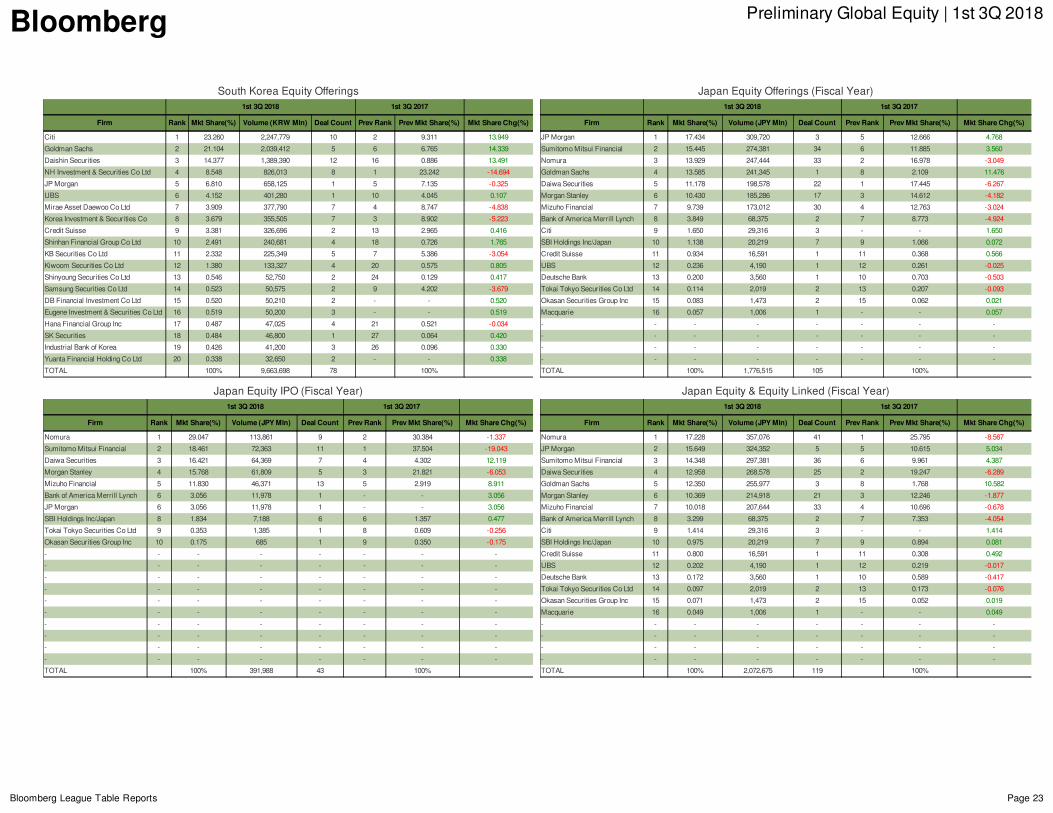
Bloomberg PreliminaryGlobalEquity|1st3Q2018
BloombergLeagueTableReports Page23
SouthKoreaEquityOfferings1st3Q2018 1st3Q2017
Firm Rank MktShare(%) Volume(KRWMln) DealCount PrevRank PrevMktShare(%) MktShareChg(%)
Citi 1 23.260 2,247,779 10 2 9.311 13.949
GoldmanSachs 2 21.104 2,039,412 5 6 6.765 14.339
DaishinSecurities 3 14.377 1,389,390 12 16 0.886 13.491
NHInvestment&SecuritiesCoLtd 4 8.548 826,013 8 1 23.242 -14.694
JPMorgan 5 6.810 658,125 1 5 7.135 -0.325
UBS 6 4.152 401,280 1 10 4.045 0.107
MiraeAssetDaewooCoLtd 7 3.909 377,790 7 4 8.747 -4.838
KoreaInvestment&SecuritiesCo 8 3.679 355,505 7 3 8.902 -5.223
CreditSuisse 9 3.381 326,696 2 13 2.965 0.416
ShinhanFinancialGroupCoLtd 10 2.491 240,681 4 18 0.726 1.765
KBSecuritiesCoLtd 11 2.332 225,349 5 7 5.386 -3.054
KiwoomSecuritiesCoLtd 12 1.380 133,327 4 20 0.575 0.805
ShinyoungSecuritiesCoLtd 13 0.546 52,750 2 24 0.129 0.417
SamsungSecuritiesCoLtd 14 0.523 50,575 2 9 4.202 -3.679
DBFinancialInvestmentCoLtd 15 0.520 50,210 2 - - 0.520
EugeneInvestment&SecuritiesCoLtd 16 0.519 50,200 3 - - 0.519
HanaFinancialGroupInc 17 0.487 47,025 4 21 0.521 -0.034
SKSecurities 18 0.484 46,800 1 27 0.064 0.420
IndustrialBankofKorea 19 0.426 41,200 3 26 0.096 0.330
YuantaFinancialHoldingCoLtd 20 0.338 32,650 2 - - 0.338
TOTAL 100% 9,663,698 78 100%
JapanEquityOfferings(FiscalYear)1st3Q2018 1st3Q2017
Firm Rank MktShare(%) Volume(JPYMln) DealCount PrevRank PrevMktShare(%) MktShareChg(%)
JPMorgan 1 17.434 309,720 3 5 12.666 4.768
SumitomoMitsuiFinancial 2 15.445 274,381 34 6 11.885 3.560
Nomura 3 13.929 247,444 33 2 16.978 -3.049
GoldmanSachs 4 13.585 241,345 1 8 2.109 11.476
DaiwaSecurities 5 11.178 198,578 22 1 17.445 -6.267
MorganStanley 6 10.430 185,286 17 3 14.612 -4.182
MizuhoFinancial 7 9.739 173,012 30 4 12.763 -3.024
BankofAmericaMerrillLynch 8 3.849 68,375 2 7 8.773 -4.924
Citi 9 1.650 29,316 3 - - 1.650
SBIHoldingsInc/Japan 10 1.138 20,219 7 9 1.066 0.072
CreditSuisse 11 0.934 16,591 1 11 0.368 0.566
UBS 12 0.236 4,190 1 12 0.261 -0.025
DeutscheBank 13 0.200 3,560 1 10 0.703 -0.503
TokaiTokyoSecuritiesCoLtd 14 0.114 2,019 2 13 0.207 -0.093
OkasanSecuritiesGroupInc 15 0.083 1,473 2 15 0.062 0.021
Macquarie 16 0.057 1,006 1 - - 0.057
- - - - - - - -
- - - - - - - -
- - - - - - - -
- - - - - - - -
TOTAL 100% 1,776,515 105 100%
JapanEquityIPO(FiscalYear)1st3Q2018 1st3Q2017
Firm Rank MktShare(%) Volume(JPYMln) DealCount PrevRank PrevMktShare(%) MktShareChg(%)
Nomura 1 29.047 113,861 9 2 30.384 -1.337
SumitomoMitsuiFinancial 2 18.461 72,363 11 1 37.504 -19.043
DaiwaSecurities 3 16.421 64,369 7 4 4.302 12.119
MorganStanley 4 15.768 61,809 5 3 21.821 -6.053
MizuhoFinancial 5 11.830 46,371 13 5 2.919 8.911
BankofAmericaMerrillLynch 6 3.056 11,978 1 - - 3.056
JPMorgan 6 3.056 11,978 1 - - 3.056
SBIHoldingsInc/Japan 8 1.834 7,188 6 6 1.357 0.477
TokaiTokyoSecuritiesCoLtd 9 0.353 1,385 1 8 0.609 -0.256
OkasanSecuritiesGroupInc 10 0.175 685 1 9 0.350 -0.175
- - - - - - - -
- - - - - - - -
- - - - - - - -
- - - - - - - -
- - - - - - - -
- - - - - - - -
- - - - - - - -
- - - - - - - -
- - - - - - - -
- - - - - - - -
TOTAL 100% 391,988 43 100%
JapanEquity&EquityLinked(FiscalYear)1st3Q2018 1st3Q2017
Firm Rank MktShare(%) Volume(JPYMln) DealCount PrevRank PrevMktShare(%) MktShareChg(%)
Nomura 1 17.228 357,076 41 1 25.795 -8.567
JPMorgan 2 15.649 324,352 5 5 10.615 5.034
SumitomoMitsuiFinancial 3 14.348 297,381 36 6 9.961 4.387
DaiwaSecurities 4 12.958 268,578 25 2 19.247 -6.289
GoldmanSachs 5 12.350 255,977 3 8 1.768 10.582
MorganStanley 6 10.369 214,918 21 3 12.246 -1.877
MizuhoFinancial 7 10.018 207,644 33 4 10.696 -0.678
BankofAmericaMerrillLynch 8 3.299 68,375 2 7 7.353 -4.054
Citi 9 1.414 29,316 3 - - 1.414
SBIHoldingsInc/Japan 10 0.975 20,219 7 9 0.894 0.081
CreditSuisse 11 0.800 16,591 1 11 0.308 0.492
UBS 12 0.202 4,190 1 12 0.219 -0.017
DeutscheBank 13 0.172 3,560 1 10 0.589 -0.417
TokaiTokyoSecuritiesCoLtd 14 0.097 2,019 2 13 0.173 -0.076
OkasanSecuritiesGroupInc 15 0.071 1,473 2 15 0.052 0.019
Macquarie 16 0.049 1,006 1 - - 0.049
- - - - - - - -
- - - - - - - -
- - - - - - - -
- - - - - - - -
TOTAL 100% 2,072,675 119 100%
Bloomberg Equity & Equity Linked - League Tables Criteria
Bloomberg L.P. reserves the right of final decision concerning league eligibility and requires adequate documentation for the same. Bloomberg L.P. and its suppliers believe the information herein was obtained from reliable sources, but they do not guarantee its accuracy. Neither the information nor the opinion expressed constitutes a solicitation of the purchase or sale of securities or commodities. Due to the dynamic nature of the Professional Service product, League Table rankings may vary between the quarterly/year-end publications and data found on the Bloomberg Professional Service.
General Guidelines Credit is based on the total amount of the offering sold to the public, including exercised over-allotment. Full credit is awarded to sole book-running manager or split equally among joint book-running managers.
Equities
Equity market transactions: initial public offerings, additional offerings of common stocks, units, and depositary receipts (ADRs, GDRs, etc) and rights offerings. Exclusions: Non-underwritten/best efforts, privately placed transactions, funds, self-led, preferred offerings, pre-negotiated offerings, certain lower hierarch titles, i.e. Jr Bookrunner. Note: Criteria may vary for some local and/or regional table.
Equities-Linked
Equity-linked transactions: convertible bonds, convertible preferred stock and exchangeable bonds. Only issues that mature and are callable/puttable in 12 months or longer are included. Make-whole calls, provisional calls, and provisional puts are exempt from this rule. Convertible bonds with attached warrants are included. These are defined as synthetic convertibles with the combination of a fixed income instrument and warrants which can be converted into shares. The embedded warrant can be detachable or non-detachable but the bond and the warrant must be sold as a unit, i.e. there cannot be separate book building for the warrant and the bond. Exclusions: Redemption-linked instruments, reverse convertibles or similar instruments, synthetics convertibles, issues convertible into participation in an underlying fund or investment trust, pre-IPO convertible instruments, pre-negotiated offerings, certain lower hierarch titles, i.e. Jr Bookrunner.
The full version of Bloomberg’s League table Standards & Guidelines can be accessed and subscribed to on the Reports tab on LEAG<GO>.