GLOBAL EQUITY CAPITAL MARKETS REVIEW -...
20
GLOBAL EQUITY CAPITAL MARKETS REVIEW MANAGING UNDERWRITERS First Half 2017 REUTERS/Eddie Keogh
Transcript of GLOBAL EQUITY CAPITAL MARKETS REVIEW -...

GLOBAL EQUITY CAPITAL MARKETS REVIEW MANAGING UNDERWRITERS First Half 2017
REUTERS/Eddie Keogh
Asia Equity & Equity-Related, ex Chinese A-shares (C1ba)
Asia Common Stock, inc Chinese A-shares (C4a)
Asia IPOs, inc Chinese A-shares (C7a)
Asia Secondary Offerings, inc Chinese A-shares (C8c)
Asia Convertibles, inc Chinese A-shares (C9b)
12
13
13
13
13
10
Asia Equity
18
11 Regional Contacts
Thomson Reuters Solutions for the Deal Making Community
12
EMEA Convertibles (C9d)
EMEA Rights Offerings (C8fr)
EMEA IPOs (C7c)
11
Banking Composite of Top US Equity Bookrunners 7
Asia Equity & Equity-Related, inc Chinese A-shares (C1b)
US Common Stock (C3) 6
10EMEA Deals Intelligence
EMEA Common Stock (C4c)
Global Equity & Equity-Related (C1) 2 Canada Equtiy & Equity Related (CA1a) 9
Global Convertibles (C9)
EMEA Equity & Equity-related (C1d)
First Half 2017 | Equity Capital Markets | Managing Underwriters
Equity Capital Markets Review
Global Equity
Global Common Stock (C2) 3
Australia & New Zealand Equity
Global Deals Intelligence
Table of Contents
Latin America Equity
1 Latin America Equity & Equity Related (C1f) 8 Australian Equity & Equity-related (AK1) 14
Leading Underwriters for First Half 2017 2 Latin America Proceeds by Domicile Nation & Sector 8 Australian Common Stock (AK2) 14
Australian ECM Proceeds by Industry 14
Global Debt, Equity & Equity Related (A1) 2 Japan Equity
Global Scorecard 2
Canada Equity
Latin America Year-on-Year % Change in ECM Volume 8
Japan Equity & Equity-Related (C1e) 15
9 Japan Common Stock (C4d) 15Canada Initial Public Offering -Ex.Self-Led (CA3)
3 9 Japan IPOs (C7d) 16Canada Common Stock & Trusts - Ex.Self-Led (CA2a)
Global IPOs (C5) 3 9 Japan Secondary Offerings (C8d) 16
5
Canada Secondary Offerings - Ex.Self-Led (CA4a)
Japan Convertible Offerings (C9e) 16
US Equity Criteria Summary
EMEA EquityGlobal Equity Rankings - Last Ten Years 4
US Convertibles (C9a)
US Deals Intelligence 5 Equity Capital Markets Criteria Summary 17
17
US IPOs (C6) 5 11
US Equity & Equity-Related (C1a)
6
US Secondary Offerings (C8a) 6 11
US Year-on-Year % Change in ECM Volume 7
US Block Trades 6
Top US Equity and Equity-Related Deals 7

nc
EUROPEAN ISSUERS ACCOUNT FOR ONE-THIRD OF GLOBAL ECM - Issuers from Europe raised US$130.9billion in the global equity capital markets during the first half of 2017, an increase of 58% compared with levelsseen a year ago. As a percentage of global ECM, Europe accounted for 33% of overall issuance during the first
First Half 2017
EQUITY CAPITAL MARKETS REVIEW Global Equity Capital Markets Activity Up 33% from 2016 | Europe Accounts for 33% of ECM, up 58% | US IPO Activity Up Triple-Digit Percentages, Hits 3-Year High | ECM Fees Up 62%
Global Initial Public OfferingsGlobal Deals Intelligence
Global Equity & Equity-Related Volume
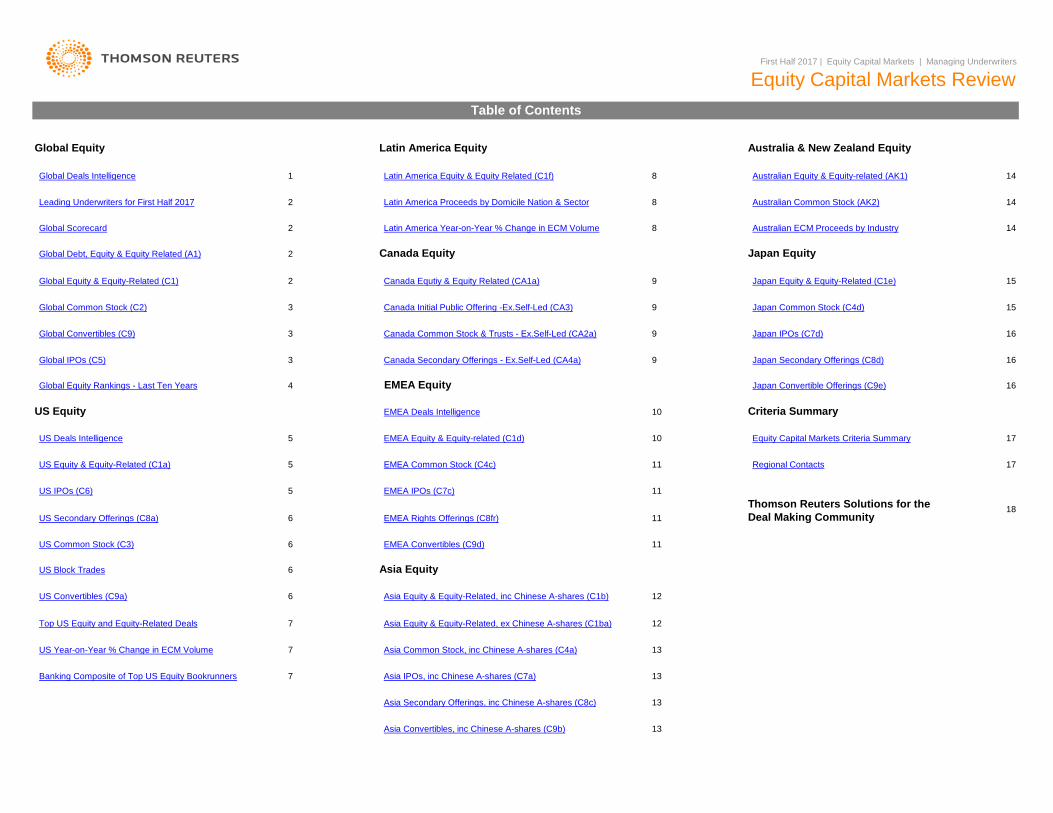
GLOBAL ECM ACTIVITY HITS TWO-YEAR HIGH, UP 33% - Equity capital markets activity totaled US$400.1billion during the first half of 2017, a 33% increase compared to a year ago and the strongest first six months forglobal equity capital markets issuance in two years. By number of issues, 2,735 ECM offerings were brought tomarket during the first quarter, a 29% increase compared to a year ago and the strongest first half for newofferings since the first half of 1996, when 2,858 offerings priced.
FOLLOW-ON OFFERINGS UP 44%, LED BY FINANCIALS, TELECOM & MEDIA - Global follow-on offeringstotaled US$273.0 billion during the first half of 2017, an increase of 26% compared to a year ago and the strongestfirst half for follow-on offerings in two years. Follow-on offerings from companies in the Financial sector accountedfor 27% of capital raising during the first half of 2017, up significantly from 13% of overall follow-on offerings a yearago, while media offerings increasd nearly five times compared to first half 2016.
TRIPLE-DIGIT PERCENTAGE INCREASE FOR US IPO LISTINGS - Global initial public offering activity during thefirst half of 2017 totaled US$79.4 billion, a 67% increase compared to last year and the strongest opening six-month period for global IPOs since 2015. Proceeds from listings on US exchanges surpassed US$22 billion for thefirst time since the first half of 2014, while IPOs by EMEA issuers increased 6%. Asia Pacific (ex. Australia) IPOactivity increased 69% from 2016. Global IPO proceeds during the second quarter increased 36% compared tothe first quarter of this year and 4% by number of deals.
1,600$400Proceeds (US$b) # of Issues
0
10
20
30
40
50
60
70
$0
$20
$40
$60
$80
$100
$120
$140
1 2 3 4 1 2 3 4 1 2 3 4 1 2 3 4 1 2 3 4 1 2 3 4 1 2 3 4 1 2 3 4 1 2 3 4 1 2
2008 2009 2010 2011 2012 2013 2014 2015 2016 2017
% o
f Pro
ceed
s fro
m A
sia
Pac
ific
Pro
ceed
s (U
S$b
)
Global IPOs (US$bil) US Listed IPOs as % of Global IPOs
see a yea ago s a pe ce tage o g oba C , u ope accou ted o 33% o o e a ssua ce du g t e sthalf, the highest percentage since the first half of 2014, when European issuers accounted for 37% of global ECMissuance. Offerings by US issuers, which accounted for 30% of first half 2017 ECM activity, increased 43%compared to a year ago.
FOUR SECTORS ACCOUNT FOR 57% OF ACTIVITY - Led by Financial issuance (23%), the overall volume ofequity capital markets activity remained highly concentrated among four main sectors including Industrials, Energy& Power (12%) and Technology (11%).
JP MORGAN TOPS GLOBAL ECM RANKINGS - JP Morgan led all equity capital markets underwriters during thefirst half of 2017, with US$31.3 billion in proceeds from 206 issues, a decrease of 0.4 market share pointscompared to a year ago. Morgan Stanley maintained second place with a market share increase of 0.4 points,while Goldman Sachs maintained third place with a market share of 7.6%, up 0.9 points from a year ago.
ECM FEES INCREASE 62% - According to estimates, fees from equity capital markets transactions during the firsthalf of 2017 totaled US$10.3 billion, up 62% compared to levels seen during the first half of 2016.
Global Equity & Equity-Related Volume by Domicile Region
0
200
400
600
800
1,000
1,200
1,400
$0
$100
$200
$300
1 2 3 4 1 2 3 4 1 2 3 4 1 2 3 4 1 2 3 4 1 2 3 4 1 2 3 4 1 2 3 4 1 2 3 4 1 2
2008 2009 2010 2011 2012 2013 2014 2015 2016 2017
# of
Issu
es
Pro
ceed
s (U
S$b
)
Proceeds (US$b) # of Issues
0%
10%
20%
30%
40%
50%
60%
70%
80%
90%
100%
2000 2001 2002 2003 2004 2005 2006 2007 2008 2009 2010 2011 2012 2013 2014 2015 2016 2017
Africa/Middle East/Central Asia Japan Asia Pacific E rope Americas
Visit http://dmi.thomsonreuters.com to view archives and order custom League Tables https://www.thomsonone.com
Africa/Middle East/Central Asia Japan Asia-Pacific Europe Americas
1
Leading Underwriters for the First Half of 2017
EMEA Common Stock (C4c)EMEA IPOs (C7c)EMEA Convertibles (C9d)
Asia-Pacific Common Stock (C4a)Asia-Pacific Convertibles (C9b)
GlobalGlobal Debt, Equity & Equity-Related (A1)Global Disclosed Fees (A2)
Japan Equity & Equity Related (C1e)
Asia-Pacific ex. Japan ex. Australia
Japan
Global Convertibles (C9)
US Equity & Equity-Related (C1a)US Common Stock (C3)US IPOs (C6)US Convertibles (C9a)
EMEA Equity & Equity-Related (C1d)
US
Global Equity & Equity-related (C1)Global Common Stock (C2)Global IPOs (C5)
Europe, Middle East & Africa (EMEA)
First Half 2017 | Equity Capital Markets | Managing Underwriters
Global Equity Capital Markets
Market Sector
Citi
Current Qtr Market Sh. (%)
7.1 0.3 ▲
EMEA - Europe, Middle East & Africa (C1d)Australia (C1c)Morgan StanleyAsia Pacific ex Australia (C1b)
United States (C3)Global Common Stock (C2)Latin America (C1f)Japan (C1e)Citi 7.7 4.0 ▲ 1
Japan (C4d)EMEA - Europe, Middle East & Africa (C4c)JP MorganAustralia (C4b)Asia Pacific ex Australia (C4a)Morgan Stanley
Morgan Stanley 13.5 4.6 ▲
Asia Pacific ex Australia (C7a)United States (C6)Morgan StanleyGlobal IPOs (C5)Latin America (C4e)
Latin America (C7e)Japan (C7d)EMEA - Europe, Middle East & Africa (C7c)Australia (C7b)Citi
Morgan Stanley 18.6 16.8 ▲
246 8.1% ▲Global Secondary Offerings (C8)Morgan Stanley
56 871 6Mitsubishi UFJ Morgan Stanley 18 3 7 2
Mkt. Share Chg. from Last Qtr (%)
Consecutive Quarters No. 1No. 1 Manager
1Morgan Stanley 9.1 2.2 ▲ 1
9.7 4.1 ▲ 1Morgan Stanley 9.4 4.2 ▲ 1
Morgan Stanley 12.9 4.9 ▲ 1
13.4 4.7 ▲ 11
12.3 -2.0 ▼ 2JP Morgan 14.7 2.4 ▲ 1
9.6 5.3 ▲ 1Citi 9.0 2.0 ▲ 1
9.5 2.8 ▲ 11
6.8 5.3 ▲ 1CITIC 27.5 14.2 ▲ 1
US$m
▲ 1
Asia Pacific ex Australia (C8c) 51,529.3 421 54,903.6United States (C8a) 77,099.7 368 71,310.2
EMEA Europe Middle East & Africa (C8f) 104 067 6 504 396 83 0%
Global Scorecard1/1/2017 - 6/30/2017 1/1/2016 - 6/30/2016
Proceeds No. Proceeds No. % ChangeDeals US$m Deals in Proceeds
Global Equity & Equity-Related (C1) 400,141.7 2,735 301,745.2 2,120 32.6% ▲United States (C1a) 119,940.6 496 84,111.4 312 42.6% ▲
89,403.3 929 85,567.8 703 4.5% ▲6,928.7 281 7,781.2 307 -11.0% ▼
137,665.9 632 89,105.6 523 54.5% ▲18,987.0 109 10,460.4 98 81.5% ▲
6,857.6 19 2,298.5 12 198.4% ▲352,378.9 2,577 263,601.2 1,970 33.7% ▲
97,837.1 437 77,414.4 284 26.4% ▲81,862.5 888 72,836.4 637 12.4% ▲
6,918.2 279 7,471.7 306 -7.4% ▼123,573.5 600 75,265.5 491 64.2% ▲
15,921.0 102 6,281.8 83 153.4% ▲6,857.6 19 2,298.5 12 198.4% ▲
79,386.0 745 47,620.3 447 66.7% ▲20,737.4 69 6,104.2 38 239.7% ▲30,333.2 467 17,932.8 237 69.1% ▲
905.7 33 1,840.2 22 -50.8% ▼19,505.9 96 18,393.9 95 6.0% ▲
2,484.1 43 2,448.4 44 1.5% ▲2,360.8 7 531.9 4 343.8% ▲
272,992.9 1,832 215,980.9 1,523 26.4% ▲
400 -6.1% ▼Australia (C8b) 6,012.6 246 5,631.5 284 6.8% ▲
▲Japan Equity & Equity-Related (C1e)
Global Equity & Equity-Related (C1) Jan 1 - Jun 30Jan 1 - Jun 30Global Debt, Equity & Equity-Related (A1)
56,871.6Japan Common Stock (C4d)Japan IPOs (C7d)
ManagerChange in MarketProceeds per Bookrunner (US$m)Imputed Fees (US$m)Proceeds per Bookrunner (US$m) # of Deals per Bookrunner
Manager MarketChange in # of Deals per Bookrunner Imputed Fees (US$m)
MarketMarket # of MarketMarketShare Ch. # of Deals
# of MarketSh. (%)Bookrunner Proceeds Sh. (%)
2017 Rank
2016 Rank
MarketBookrunnerShare Ch.
2017 Rank
2016 RankDeals Sh. (%) Fees
Market MarketFees Sh. (%)# of Deals Share Ch.Proceeds Sh. (%) Deals Sh. (%)Share Ch.
JP Morgan 1 1 272,770.5 7.0 +0.8 ▲ 1110 8.7 +82 ▲ 1,823.0 7.4 +0.5 ▲ JP Morgan 1 1 31,264.7 7.8 -0.4 ▼ 206 7.5 +53 ▲ 778.8 7.5 -0.4 ▼Citi 2 2 270,246.7 7.0 +1.5 ▲ 1132 8.8 +226 ▲ 1,444.6 5.9 +0.5 ▲ Morgan Stanley 2 2 30,725.3 7.7 +0.4 ▲ 217 7.9 +94 ▲ 706.2 6.8 +0.3 ▲Bank of America Merrill Lynch 3 3 227,598.2 5.9 +0.7 ▲ 936 7.3 +53 ▲ 1,346.2 5.5 -0.4 ▼ Goldman Sachs & Co 3 3 30,248.8 7.6 +0.9 ▲ 177 6.5 +59 ▲ 632.6 6.1 +0.2 ▲Barclays 4 4 197,396.4 5.1 +0.4 ▲ 787 6.1 +92 ▲ 982.3 4.0 0.0 - Citi 4 4 25,089.7 6.3 +0.8 ▲ 190 6.9 +84 ▲ 552.4 5.3 +1.0 ▲Morgan Stanley 5 8 191,370.9 4.9 +1.3 ▲ 884 6.9 +137 ▲ 1,356.0 5.5 +0.7 ▲ Bank of America Merrill Lynch 5 5 24,374.8 6.1 +1.0 ▲ 173 6.3 +69 ▲ 521.0 5.0 -0.5 ▼Goldman Sachs & Co 6 6 185,943.5 4.8 +0.8 ▲ 714 5.6 +132 ▲ 1,291.9 5.3 +0.2 ▲ UBS 6 8 16,480.1 4.1 +0.6 ▲ 112 4.1 +36 ▲ 301.2 2.9 -0.1 ▼Deutsche Bank 7 5 156,937.4 4.1 +0.1 ▲ 701 5.5 +19 ▲ 870.2 3.6 -0.1 ▼ Barclays 7 9 15,307.1 3.8 +0.3 ▲ 114 4.2 +47 ▲ 301.5 2.9 +0.2 ▲HSBC Holdings PLC 8 7 156,074.8 4.0 0.0 - 685 5.3 -30 ▼ 636.9 2.6 +0.4 ▲ Deutsche Bank 8 7 14,699.1 3.7 -0.9 ▼ 106 3.9 +28 ▲ 313.6 3.0 +0.3 ▲BNP Paribas SA 9 10 117,264.3 3.0 +0.5 ▲ 488 3.8 +59 ▲ 479.2 2.0 +0.2 ▲ Credit Suisse 9 6 13,413.4 3.4 -1.3 ▼ 119 4.4 +16 ▲ 342.0 3.3 -0.7 ▼Wells Fargo & Co 10 9 111,875.8 2.9 0.0 - 607 4.7 +29 ▲ 622.1 2.5 -0.4 ▼ RBC Capital Markets 10 11 8,385.1 2.1 -0.2 ▼ 84 3.1 +15 ▲ 249.1 2.4 -0.1 ▼Credit Suisse 11 11 107,286.9 2.8 +0.3 ▲ 563 4.4 +123 ▲ 810.0 3.3 -0.1 ▼ Wells Fargo & Co 11 12 7,197.4 1.8 +0.2 ▲ 78 2.9 +30 ▲ 221.3 2.1 +0.4 ▲Nomura 12 15 85,998.3 2.2 +0.4 ▲ 440 3.4 +76 ▲ 306.0 1.3 0.0 - BNP Paribas SA 12 15 6,647.4 1.7 +0.3 ▲ 54 2.0 +24 ▲ 126.3 1.2 0.0 -RBC Capital Markets 13 17 83,981.2 2.2 +0.5 ▲ 502 3.9 +70 ▲ 598.3 2.4 0.0 - Jefferies LLC 13 20 5,381.1 1.3 +0.3 ▲ 69 2.5 +27 ▲ 152.9 1.5 0.0 -Mizuho Financial Group 14 21 68,435.5 1.8 +0.3 ▲ 496 3.9 +90 ▲ 335.0 1.4 -0.4 ▼ Societe Generale 14 29 5,369.3 1.3 +0.6 ▲ 40 1.5 +13 ▲ 82.8 0.8 +0.2 ▲Credit Agricole CIB 67,486.4 1.7 +0.1Societe Generale 66,431.5 1.7 +0.1
15 19 -10 245.6299 2.3 +38 290.6 -0.2 65
1.0 0.0 CITIC1.2 +0.2 BMO Capital Markets
15-0.6
374 522.6
+3 99.6 1.0 -0.54,918.5 1.2 -1.5
UniCredit 46,302.5 203 151.521 97.00.8 +8 ▲47 120.6
▲ ▼ -16 20 ▲ ▲ ▲
309 2.4
TD Securities Inc 17 23 62,979.9 1.6 +0.2 ▲ 375 2.9 +81 ▲ 307.8UBS 18 22 60,474.3 1.6 +0.1 2.1 -0.1 ▼
1.3 +0.1 ▲
+0.1 1.6 +132.9 +28 ▲▲
0.6 0.0Mitsubishi UFJ Financial Group 35,962.3 0.9 +0.2 199 1.6 +45
1.2221.4 0.9 0.0
12,824 24,502.1Top Twenty Total 2,572,817.3 66.4
19 24 ▲ ▲ -20 29 ▲ ▲ -
14,641.2 59.8Industry Total 3,874,470.6 100.0 -731 100.0
Industry % Change from Same Period Last Year -8.4% ▼ -5.4% 23.3% ▲Industry % Change from Last Quarter -7.6% ▼ 5.8% -6.3% ▼▲
▼16 17 ▼ ▲ ▼2.4 +17 136.4 1.3
4,151.8 1.0 +0.1
10 ▼ ▲28 1.04,497.4 1.1
▲ 28 1.0 +9 ▲ 81.3 0.8 -0.1 ▼China Securities Co Ltd 18 33 3,667.9 0.9 +0.3 ▲ 0.9 +0.4 ▲Nomura 19 13 3,482.5 0.9 -0.6 ▼ 1.7 +3 ▲ 1.2 -0.8 ▼
▲ 76.5Guotai Junan Securities 20 19 3,425.8 0.9 -0.2 ▼ 26 1.0 +257.0
100.0
0.7 -0.1 ▼Top Twenty Total 258,727.2 64.7
10,334.55,893.1
▲
Industry Total 400,141.7 100.0 2,735 +615
2.3% ▲ -1.4% -2.0% ▼32.6% ▲ 29.0% 61.5%
Industry % Change from Last QuarterIndustry % Change from Same Period Last Year
HSBC Holdings PLC 17 25
Mitsubishi UFJ Morgan Stanley 18.3 7.2
Japan (C9e)
▼
Mitsubishi UFJ Morgan Stanley 18.3 8.4 ▲ 1Nomura 42.0 11.9 ▲ 4
▲ 1
12 1,766.6 8 154.5%
EMEA - Europe, Middle East & Africa (C8f) 104,067.6 504 396 83.0%
2 309.5 1 -96.6%
United States (C9a) 22,103.5 59 6,697.0 28 230.1%
▲Japan (C8d) 13,436.9 59 3,833.4 39 250.5% ▲
▲Global Convertible Offerings (C9) 47,762.8 158 38,143.9 150 25.2% ▲Latin America (C8e) 4,496.7
▲Asia Pacific ex Australia (C9b) 7,540.8 41 12,731.4 66 -40.8% ▼
▼EMEA - Europe, Middle East & Africa (C9d) 14,092.4 32 13,840.1 32 1.8% ▲Australia (C9c) 10.5
3,066.0 7 4,178.6 15 -26.6% ▼
▼▲
Visit http://dmi.thomsonreuters.com to view archives and order custom League Tables https://www.thomsonone.com
2

First Half 2017 | Equity Capital Markets | Managing Underwriters
Global Equity Capital Markets
Imputed Fees (US$m)2017 Rank
2016 Rank
Global Common Stock (C2) Jan 1 - Jun 30 Global Convertibles (C9) Jan 1 - Jun 30
Proceeds per Bookrunner (US$m) # of Deals per Bookrunner Imputed Fees (US$m) Proceeds per Bookrunner (US$m) # of Deals per BookrunnerMarket Market # of Market Change in Manager Market Market 2017
Rank2016 RankSh. (%) Share Ch. Bookrunner Proceeds
Market Market # of Market Change in Manager Market MarketBookrunner Proceeds Sh. (%) Share Ch. Deals Sh. (%) # of Deals Fees Sh. (%) Share Ch. Deals Sh. (%) # of Deals Fees Sh. (%) Share Ch.Goldman Sachs & Co 1 2 26,507.1 7.5 +0.9 ▲ 158 6.1 +55 ▲ 568.1 6.0 +0.3 ▲ JP Morgan 1 2 7,215.3 15.1 +2.3 ▲ 32 20.3 +6 ▲ 147.4 16.2 +2.9 ▲Morgan Stanley 2 3 25,996.8 7.4 +1.4 ▲ 188 7.3 +77 ▲ 624.0 6.6 +0.5 ▲ Morgan Stanley 2 1 4,728.5 9.9 -6.5 ▼ 29 18.4 +17 ▲ 82.1 9.0 -1.1 ▼JP Morgan 3 1 24,049.3 6.8 -0.8 ▼ 174 6.8 +47 ▲ 631.5 6.7 -0.6 ▼ Goldman Sachs & Co 3 5 3,741.7 7.8 +0.9 ▲ 19 12.0 +4 ▲ 64.6 7.1 -0.8 ▼Citi 4 4 22,840.7 6.5 +0.9 ▲ 170 6.6 +77 ▲ 495.5 5.3 +1.3 ▲ Deutsche Bank 4 3 3,075.0 6.4 -4.9 ▼ 14 8.9 +6 ▲ 57.8 6.3 +1.3 ▲Bank of America Merrill Lynch 5 6 21,871.4 6.2 +1.0 ▲ 149 5.8 +55 ▲ 475.2 5.0 -0.6 ▼ Bank of America Merrill Lynch 5 8 2,503.4 5.2 +0.8 ▲ 24 15.2 +14 ▲ 45.8 5.0 +0.1 ▲UBS 6 7 14,918.6 4.2 +0.4 ▲ 103 4.0 +33 ▲ 286.7 3.0 -0.2 ▼ Citi 6 7 2,249.0 4.7 -0.3 ▼ 20 12.7 +7 ▲ 56.9 6.2 -0.5 ▼Barclays 7 8 13,421.3 3.8 0.0 - 100 3.9 +36 ▲ 268.9 2.9 +0.1 ▲ Wells Fargo & Co 7 27 2,073.1 4.3 +3.8 ▲ 13 8.2 +11 ▲ 41.0 4.5 +3.7 ▲Credit Suisse 8 5 12,288.5 3.5 -1.7 ▼ 109 4.2 +11 ▲ 320.5 3.4 -0.8 ▼ BNP Paribas SA 8 6 1,937.0 4.1 -2.2 ▼ 14 8.9 -1 ▼ 33.4 3.7 -2.1 ▼Deutsche Bank 9 9 11,624.2 3.3 -0.3 ▼ 92 3.6 +22 ▲ 255.9 2.7 +0.2 ▲ Barclays 9 17 1,885.8 4.0 +2.7 ▲ 14 8.9 +11 ▲ 32.5 3.6 +2.1 ▲RBC Capital Markets 10 11 7,681.9 2.2 -0.2 ▼ 75 2.9 +12 ▲ 228.1 2.4 -0.2 ▼ UBS 10 12 1,561.6 3.3 +1.7 ▲ 9 5.7 +3 ▲ 14.6 1.6 +0.2 ▲Wells Fargo & Co 11 12 5,124.3 1.5 -0.3 ▼ 65 2.5 +19 ▲ 180.3 1.9 +0.1 ▲ CITIC 11 39* 1,304.3 2.7 +2.4 ▲ 2 1.3 +1 ▲ 7.8 0.9 +0.5 ▲BNP Paribas SA 12 30 4,710.4 1.3 +0.6 ▲ 40 1.6 +25 ▲ 92.8 1.0 +0.4 ▲ Societe Generale 12 18 1,161.8 2.4 +1.2 ▲ 9 5.7 +3 ▲ 21.7 2.4 +1.4 ▲Jefferies LLC 13 19 4,475.2 1.3 +0.2 ▲ 62 2.4 +21 ▲ 129.1 1.4 -0.2 ▼ Credit Suisse 13 13 1,124.9 2.4 +0.9 ▲ 10 6.3 +5 ▲ 21.5 2.4 +0.9 ▲Societe Generale 14 31 4,207.5 1.2 +0.5 ▲ 31 1.2 +10 ▲ 61.1 0.7 +0.1 ▲ Nomura 14 4 1,056.3 2.2 -4.7 ▼ 4 2.5 -4 ▼ 21.8 2.4 -6.8 ▼China Securities Co Ltd 15 34 3,667.9 1.0 +0.4 ▲ 21 0.8 +9 ▲ 96.9 1.0 +0.5 ▲ BMO Capital Markets 15 47 925.4 1.9 +1.7 ▲ 10 6.3 +8 ▲ 20.1 2.2 +1.9 ▲CITIC 16 10 3,614.2 1.0 -2.0 ▼ 26 1.0 +2 ▲ 91.8 1.0 -0.6 ▼ Jefferies LLC 16 41 905.9 1.9 +1.6 ▲ 7 4.4 +6 ▲ 23.8 2.6 +2.1 ▲BMO Capital Markets 17 15 3,572.1 1.0 -0.4 ▼ 55 2.1 +9 ▲ 116.3 1.2 -0.9 ▼ Mizuho Financial Group 17 9 873.7 1.8 -0.7 ▼ 5 3.2 0 - 15.6 1.7 -3.6 ▼Guotai Junan Securities 18 18 3,425.8 1.0 -0.1 ▼ 26 1.0 +3 ▲ 76.5 0.8 -0.1 ▼ China International Capital Co 18 16 853.1 1.8 +0.5 ▲ 2 1.3 -2 ▼ 4.0 0.4 -0.3 ▼HSBC Holdings PLC 19 27 3,404.9 1.0 +0.3 ▲ 22 0.9 +7 ▲ 67.9 0.7 -0.1 ▼ HSBC Holdings PLC 19 10 747.0 1.6 -0.1 ▼ 6 3.8 +2 ▲ 13.4 1.5 -0.1 ▼Sumitomo Mitsui Finl Grp Inc 20 42 3,087.1 0.9 +0.5 Everbright Securities Co Ltd 20 -▲ 32 1.2 +10 ▲ 153.0 ▲ 1.8 0.2 0.0 -723.3 1.5 +1.5 ▲ 1
Industry Total 352,378.9 100.0
+10.61.6 +0.8 ▲5,220.1
2,577 +607 9,422.8Top Twenty Total 220,489.2 62.6 55.4 Top Twenty Total
100.0 Industry Total40,646.1 85.147,762.8 100.0 158
727.6 79.8
Industry % Change from Same Period Last Year 33 7% ▲ 30 8% 63 6% 5 3% 42 2%
+8 911.6 100.0
▲▲ ▲▲ Industry % Change from Same Period Last Year 25 2% ▲
*tie
▲▼
Industry % Change from Same Period Last Year
Industry % Change from Same Period Last Year 33.7% ▲ 30.8% 63.6% 5.3% 42.2%-22.4% ▼
Global IPOs (C5) Jan 1 - Jun 30
▲Industry % Change from Last Quarter 9.1% ▲ -1.6% 0.2%
Market # ofProceeds per Bookrunner (US$m) # of Deals per Bookrunner Imputed Fees (US$m)
2.6%▲ Industry % Change from Last Quarter -36.6% ▼
Market Change in Manager Market Market# of Deals Fees Sh. (%) Share Ch.Bookrunner Proceeds Sh. (%) Share Ch. Deals Sh. (%)
2017 Rank
2016 Rank
Market
Citi 1 3 4,745.7 6.0 +0.3 5.1 +1.2 ▲▲ 51 6.8 +26 ▲ 170.9JP Morgan 2 2 4,608.4 5.8 -0.8 5.9 -1.2 ▼▼ 40 5.4 +13 ▲ 198.6Morgan Stanley 3 1 4,561.4 5.8 -0.8 6.3 -0.6 ▼▼ 44 5.9 +17 ▲ 211.9Goldman Sachs & Co 4 4 3,603.5 4.5 -0.2 4.8 -1.7 ▼▼ 31 4.2 +6 ▲ 160.2Credit Suisse 5 8 3,441.0 4.3 +1.9 3.1 +0.8 ▲▲ 35 4.7 +17 ▲ 105.3Deutsche Bank 6 5 3,036.1 3.8 0.0 3.2 -0.2 ▼- 30 4.0 +10 ▲ 108.4Barclays 7 9 2,476.1 3.1 +0.7 2.1 +0.3 ▲▲ 23 3.1 +9 ▲ 71.5Bank of America Merrill Lynch 8 6 2,046.2 2.6 -0.3 2.4 -0.7 ▼▼ 27 3.6 +9 ▲ 79.5UBS 9 7 2,041.6 2.6 0.0 1.8 -0.1 ▼- 16 2.1 +4 ▲ 60.8RBC Capital Markets 10 70 1,903.5 2.4 +2.1 2.0 +1.6 ▲▲ 18 2.4 +13 ▲ 67.7GF Securities 11 26 1,647.9 2.1 +1.1 3.1 +1.1 ▲▲ 24 3.2 +16 ▲ 103.9Haitong Securities Co Ltd 12 14 1,247.8 1.6 +0.1 2.3 +1.5 ▲▲ 25 3.4 +14 ▲ 76.3China International Capital Co 13 36 1,070.9 1.4 +0.7 1.0 +0.7 ▲▲ 12 1.6 +9 ▲ 34.4Guosen Securities Co Ltd 14 50 1,050.8 1.3 +0.8 2.2 +1.5 ▲▲ 15 2.0 +13 ▲ 73.3CITIC 15 17 1,000.2 1.3 -0.1 1.7 +0.1 ▲▼ 17 2.3 +10 ▲ 56.8Jefferies LLC 16 32 963.4 1.2 +0.3 1.0 -0.4 ▼▲ 21 2.8 +11 ▲ 33.6Nomura 17 16 957.8 1.2 -0.3 1.5 -0.7 ▼▼ 21 2.8 +9 ▲ 50.3China Merchants Securities Co 18 33 952.9 1.2 +0.3 1.4 +0.1 ▲▲ 14 1.9 +9 ▲ 46.6China Securities Co Ltd 19 21 949.0 1.2 0.0 1.6 +0.7 ▲- 12 1.6 +7 ▲ 54.5Wells Fargo & Co 20 39 938.1 1.2 +0.5 1.5 +0.9 ▲▲ 15 2.0 +9 ▲ 49.6Top Twenty Total 43,242.3 54.5Industry Total 79,386.0 100.0 100.0
1,814.1
66.7% ▲ 66.7% 120.7%
54.1745 +298 3,353.9
Global Equity & Equity-Related Quarterly Imputed Fees (US$Bil)
Industry % Change from Last Quarter 35.5% ▲ 4.1% 11.7% ▲▲
▼▲ ▲
▲▲ Industry % Change from Same Period Last Year 25.2% ▲
0
200
400
600
800
1,000
1,200
1,400
1,600
$0
$1
$2
$3
$4
$5
$6
$7
$8
$9
1 2 3 4 1 2 3 4 1 2 3 4 1 2 3 4 1 2 3 4 1 2 3 4 1 2 3 4 1 2 3 4 1 2 3 4 1 2
2008 2009 2010 2011 2012 2013 2014 2015 2016 2017
# of
Issu
es
US
$Bil
Fees (US$bn) # of Issues
Visit http://dmi.thomsonreuters.com to view archives and order custom League Tables https://www.thomsonone.com
3
First Half 2017 | Equity Capital Markets | Managing Underwriters
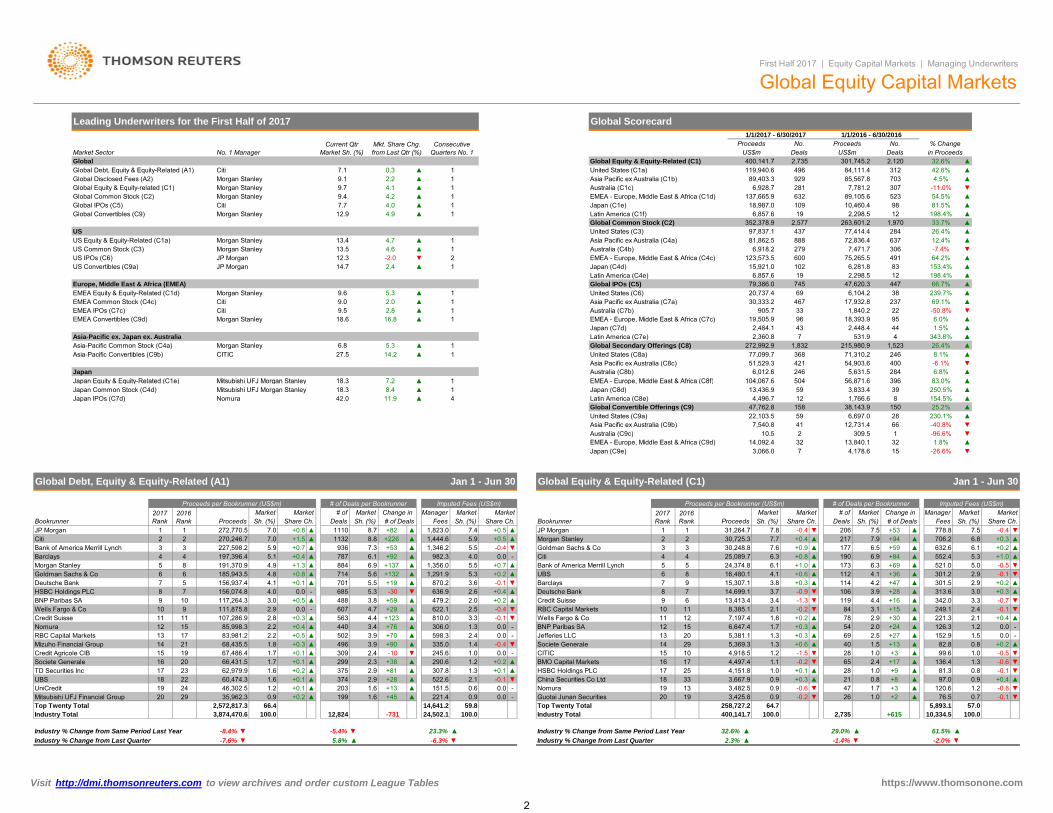
Global Equity Capital Markets: Ten Years of Rankings
1
2
3
4
JP Morgan
Morgan Stanley
Goldman Sachs & Co
Citi
Rankings shown are as of the current quarter-end in each calendar year.Note: League Table positions reflect consolidation within the banking sector.
5
6
7
8
9
10
2008 2009 2010 2011 2012 2013 2014 2015 2016 2017
Ran
k
Bank of America Merrill Lynch
UBS
Barclays
Deutsche Bank
Credit Suisse
RBC Capital Markets
Visit http://dmi.thomsonreuters.com to view archives and order custom League Tables https://www.thomsonone.com
g q y
4

nc
JP MorganBookrunner
Goldman Sachs & CoBank of America Merrill LynchMorgan Stanley
Deutsche Bank
Wells Fargo & CoBarclaysCiti
BMO Capital MarketsJefferies LLCUBSRBC Capital Markets
Credit Suisse
Stifel/KBW
▼▼▲▲▼
▲▲▲▲▲▼
+0.8+4.5-3.5
▲
+0.8-3.1+0.1-0.4-0.9-3.2
+0 6+0.1+0.6+0.1
10.410.912.1
3.95.45.97.88.9
10.0
1 31.52.42.4
12,516.813,096.514,467.8
4,678.46,486.07,124.19,293.7
10,679.111,949.1
1 568 41,821.32,833.32,907.23,938.0
958632
1913121110
7654
14131211
2016 Rank
1098
+32+41
+56+68
Proceeds per Bookrunner (US$m)
Share Ch.Market
Sh. (%)Market
Proceeds
+14+21+17+18+18+28
+24+6
8 14.6
7474
8.37.79.98.5
9388
4271 14.3
14.914.918.8
40234138
▲▲+4926.6132
118115
23.823.2
▲▲▲▲▲▲
▲▲▲▲▲▲
Deals# of
# of Deals per BookrunnerChange in Market
-0.4
0.0
+0 70.0
9.48.1
-0.9+0.8+0.6-2.2+1.2
+1.6-0.2-2.0
3.23.34.95.65.27.9
196.7299.4354.6307.6
89.579.9
119.7126.3185.9213.5
▼▲+2.010.0377.0
▼▲-
▲
1 81.32.42.1
▲▼
▲-▼▼▲
ECM Volume Up 43% | IPO Issuance Up Significantly | Technology Sector Leads Issuance
▼-2.211.6441.1Sh. (%)
US Deals Intelligence
The Technology sector led issuance in the first half of 2017, with three of the top tenlargest deals. The sector took a 15% share of the market, with US$18.7 billion inproceeds. The largest Technology issue of the first half was the US$3.9 billionoffering by Snap Inc.
US equity & equity-related proceeds for the first half of 2017 totaled US$119.9billion from 496 deals, a 42.6% increase from the same period last year. Accordingto estimates, fees increased 72.2%, to US$3.8 billion, with the top 20 banks taking83.6% of the wallet share.
US IPOs totaled $20.7 billion from 69 deals, a 239.7% increase from the sameperiod last year. According to estimates, fees increased 184%, to US$1 billion.
US Equity and Equity-related Volume (US$Bil) by Sector and Issue Type First Half 2017Jan 1 - Jun 30US Equity & Equity-Related (C1a)
# of Deals
US Equity Capital MarketsFirst Half 2017 | Equity Capital Markets | Managing Underwriters
Imputed Fees (US$m)
Share Ch.Market
Sh. (%)Market
FeesManager
69 647.6
493.3 +0.8
▲▼
17.7 +30
2017 Rank
321
471
$18.7 15%
$18.1 15%
$16.4 14%
$15 9
$12.0 10%
$10.6 9%
$9.4 8%
$18.8 16% $20.7
17%
$77.1 64%
$22.1 19%
Industry % Change from Last Quarter 0.1% ▲ 100.0% ▲▲ 18.6%Industry % Change from Same Period Last Year 239.7% ▲ 81.6% ▲▲ 184.0%
Industry Total 20,737.4 100.0 69 +31 1,032.0880.4 85.3
100.0
1.1 +0.6 ▲Top Twenty Total 19,895.9 95.94
▲ 2 2.9 +1 ▲ 11.1Raymond James Financial Inc 20 38 73.5 0.4 +0.2+1 ▲ 5.9 0.6 -0.7 ▼
-Leerink Partners LLC 19 22 86.4 0.4 -0.7 ▼ 3 4.3
5.8 +3 ▲ 10.2 1.0 0.0-0.4 ▼
BMO Capital Markets 18 34 186.7 0.9 +0.6 ▲ 41 1.4 +1 ▲ 3.0 0.3BNP Paribas SA 17 - 239.1 1.2 +1.2
-1 ▼ 12.5 1.2 -1.7 ▼▼
Cowen & Co 16 10 239.3 1.2 -1.8 ▼ 5 7.213.0 +4 ▲ 14.9 1.4 -1.3Jefferies LLC 15 11 259.0 1.3 -1.7
+4 ▲ 19.8 1.9 +0.5 ▲-0.3 ▼
Stifel/KBW 14 16 280.3 1.4 -0.1 ▼ 72 2.9 +1 ▲ 12.4 1.2
2.6 +0.3 ▲KKR & Co LP 13 13 307.5 1.5 -0.6 ▼
▲ 6 8.7 +1 ▲ 27.2UBS 12 15 584.1 2.8 +1.0+3 ▲ 12.6 1.2 +0.9 ▲
▲Allen & Co Inc 11 29* 715.7 3.5 +3.1 ▲ 4 5.8
20.3 +8 ▲ 46.7 4.5 +1.9+2.2 ▲
Wells Fargo & Co 10 9 916.9 4.4 -0.8 ▼ 1413 18.8 +8 ▲ 37.8 3.7
5.5 -2.1 ▼RBC Capital Markets 9 14 1,087.4 5.2 +3.2 ▲
▼ 17 24.6 +9 ▲ 56.8Bank of America Merrill Lynch 8 3 1,245.3 6.0 -2.5+5 ▲ 51.9 5.0 -1.5 ▼
+2.5 ▲Deutsche Bank 7 4 1,383.9 6.7 -1.7 ▼ 12
20 29.0 +11 ▲ 79.5 7.76.0 +1.4 ▲
Citi 6 2 1,610.1 7.8 -0.8 ▼▲ 18 26.1 +10 ▲ 62.0
51.7 5.0 +0.2 ▲Credit Suisse 5 8 1,645.4 7.9 +1.8
▼Barclays 4 7 1,833.6 8.8 +2.3 ▲ 15 21.7
27.5 +9 ▲ 110.1 10.7 -0.6+1.8 ▲
Goldman Sachs & Co 3 6 2,208.9 10.7 +3.2 ▲ 1920 29.0 +12 ▲ 120.0 11.6
13.0 +2.0 ▲Morgan Stanley 2 5 2,239.0 10.8 +3.1 ▲
▲ 27 39.1 +18 ▲ 134.3Sh. (%) # of Deals Fees Sh. (%) Share Ch.
JP Morgan 1 1 2,753.8 13.3
Market Change in Manager Market MarketBookrunner Proceeds Sh. (%) Share Ch. Deals
Jan 1 - Jun 30US IPOs (US$Bil)US IPOs (C6) Jan 1 - Jun 30
Proceeds per Bookrunner (US$m) # of Deals per Bookrunner Imputed Fees (US$m)
SunTrust BanksRobert W Baird & Co IncRaymond James Financial IncCowen & CoBNP Paribas SAStifel/KBW
Industry % Change from Last QuarterIndustry % Change from Same Period Last Year
Industry TotalTop Twenty TotalMitsubishi UFJ Financial Group ▼
▼▲▲▲▲▲
+0.4+1.0+0.6
-0.2-0.6+0.5+0.2
1.01.11.3
100.091.3
0.70.70.81.0
▼▲
-11.8%42.6%
1,276.81,568.4
119,940.6109,479.8
794.6820.1945.2
1,134.7
4519
1714251821
1514
2019181716 +9
+7+24
4.05.85.21.68.1
+184
0-2
0.83.2
-5.5%59.0%
▼▲
268
40
496
4162029
▲
-▼▲▲▲▲
+0.3
▼▲
-6.0%72.2%
-0.1-0.4+0.7
+0.3+0.5+0.7
100.083.6
0.71.11.21.4
3,789.93,169.4
27.540.344.552.262.5
1.8
▲▲▲
▼▼▲▲
+4.3
1,148.7
+12+12
34.069.6
1.70.9
2016 Rank
2017 Rank
Market Market # of
▼ 9
+7 ▲
17.4
▲
10.1
$15.9 13%
High Technology Real EstateEnergy and Power HealthcareFinancials Media and EntertainmentIndustrials Others
IPO Follow-On Convertible
$25.5 $2.5 $8.5 $23.2 $28.5 $21.8 $27.7 $18.7 $6.1 $20.7
25 13
5864
69
86
127
89
38
69
0
20
40
60
80
100
120
140
$-
$4.0
$8.0
$12.0
$16.0
$20.0
$24.0
$28.0
$32.0
2008 2009 2010 2011 2012 2013 2014 2015 2016 2017Proceeds # of Issues
Pro
ceed
sU
S$
Billi
ons
# of
Issu
es
Visit http://dmi.thomsonreuters.com to view archives and order custom League Tables https://www.thomsonone.com
*tieProceeds # of Issues
5

▲
US Secondary Offerings (C8a)
Proceeds per Bookrunner (US$m) # of Deals per Bookrunner Imputed Fees (US$m)
Jan 1 - Jun 30
2017 Rank
2016 Rank
Market MarketProceeds Sh. (%) Share Ch.
# of Market Change in Manager Market
▲ 205.310.9 -2.8
Sh. (%)
9.1 +1.1
5.3 -0.4
Bank of America Merrill Lynch 1 4 8,768.1 11.4DealsBookrunner
+1.7 ▲ 77 20.9
▲ 74 20.1 +38
9.1 -1.6-4.0 ▼JP Morgan 2 1 8,767.1 11.4
+28 ▲ 205.184 22.8 +22 ▲ 245.0
Sh. (%) # of Deals
3 7,803.8 10.1 +0.2 16.6Morgan Stanley 3 7 8,588.1 11.1 +4.8
Goldman Sachs & Co 5 2 7,645.7+23▲ 61Citi 4 ▲ 180.3 8.0 +1.9
9.9 -3.5 ▼ 56 15.2 +14 ▲ 190.4 8.5 -0.2Barclays 6 6 6,204.6 8.1 -0.9 ▼ 47 12.8 +14 ▲ 118.1Wells Fargo & Co 7 8 4,134.1 5.4 -0.7 ▼ 47 12.8 +9 ▲ 125.8 5.6 +0.7
▲ 107.9Credit Suisse 8 5 3,979.2 5.2 -4.0▲ 30▼ 45 12.2 +2
2.9 +0.54.8 -3.3
RBC Capital Markets 9 11 2,289.2 3.0 +0.72.8 +0.3 ▲ 28 7.6
8.2 +6 ▲ 66.0-1.1
Deutsche Bank 11 9 1,958.9 2.5UBS 10 10 2,151.8
-0.2 ▼ 24 6.5 +8 ▲Jefferies LLC 12 13 1,668.4 2.2 +0.5 ▲ 50.8
46.6 2.1 +0.1+17 ▲ 48.3 2.2
2.3 -0.6Stifel/KBW 13 21 1,238.1 1.6 +1.1 ▲ 48.2▲ 32 8.7 +21
25 6.8 +4▲2.2 +1.3
Raymond James Financial Inc 14 16 1,023.0 1.3 +0.4 ▲ 26 7.1 +10 ▲ 39.9 1.8 +0.5BMO Capital Markets 15 12 928.8 1.2 -0.5 ▼ 12 3.3 -4 ▼ 24.7Robert W Baird & Co Inc 16 26 910.0 1.2 +1.0 ▲ 32.1 1.4 +1.0
1.1 -0.3
Cowen & Co 17 22 781.4 1.0 +0.6 ▲ 19 5.2 +85.2 +13▲ 19
Sandler O'Neill Partners 18 33 673.8 0.9 +0.8 ▲ 24.3▲ 46.7 2.1 +0.9
1.1 +0.8Scotiabank 19 19 669.0 0.9 +0.3 - 11.2▲ 4 1.1 0
▲ 13 3.5 +90.5 -0.2
Cantor Fitzgerald LP 20 - 572.8 0.7 +0.7 ▲ 14 3.8 +14 ▲ 30.0 1.3 +1.3Top Twenty Total 70,755.9 91.8Industry Total 77,099.7 100.0
1,846.7368
▲ 49 6% 34 5% ▲
82.2+122 2,246.6 100.0
▲
Industry % Change from Same Period Last Year 8 1%
▼▲
MarketShare Ch.
▼▼▲
▼▲▼
▼
▲▼▲▲▼▲▲▲▼▲
Jan 1 - Jun 30
Proceeds per Bookrunner (US$m) # of Deals per Bookrunner Imputed Fees (US$m)2017 Rank
2016 Rank
Market Market # of Market Change in ManagerBookrunner Proceeds Sh. (%) Share Ch.
Market MarketDeals Sh. (%) # of Deals Fees Sh. (%) Share Ch.
JP Morgan 1 1
US Common Stock (C3)
Fees11,521.0 11.8 -3.1 ▼ 111 25.4 +40 ▲ 379.4 11.6 -1.6 ▼
94 21.5 +50Morgan Stanley 2 7 10,827.2 11.1 9.9 +1.6 ▲Bank of America Merrill Lynch 3 4 10,013.4 10.2
▲+4.7+0.6 ▲ 94 21.5 +37
US Equity Capital MarketsFirst Half 2017 | Equity Capital Markets | Managing Underwriters
▲ 325.4▲ 261.9 8.0 -2.1 ▼
Goldman Sachs & Co 4 2 9,854.6 10.1 -2.9 ▼ 75 17.2 +23 ▲ 300.5 9.2 0.0 -Citi 5 3 9,413.9 9.6 -0.2 ▼ 81 18.5 +34 ▲ 259.8 7.9 +2.0 ▲Barclays 6 6 8,038.1 8.2 -0.6 ▼ 62 14.2 +21 ▲ 169.8 5.2 -0.3 ▼Credit Suisse 7 5 5,624.6 5.8 -3.2 ▼ 63 14.4 +12 ▲ 169.9 5.2 -2.3 ▼Wells Fargo & Co 8 8 5,051.0 5.2 -0.8 ▼ 61 14.0 +17 ▲ 172.5 5.3 +0.8 ▲RBC Capital MarketsDeutsche BankUBSJefferies LLCStifel/KBW
9 11 3,376.610 9 3,342.811
3.5 +1.3 ▲ 43 9.8 +14+13
12 12
▲ 103.8 3.2 +1.0 ▲3.4 +0.3 ▲ 36 8.2 ▲ 98.4 3.0 +0.2 ▲
10 34 7.8 +18 ▲
13 20
2,735.9 2.8 +0.4 ▲1,927.4 2.0 +0.2 ▲
75.6 2.3 -0.9 ▼34 7.8 +8 ▲ 65.7 2.0 -0.8 ▼
1,518.4 1.6 +1.0 ▲ 39 8.9 +25 ▲ 68.0 2.1 +1.1 ▲BMO Capital Markets 14 13 1,115.5 1.1 -0.5 ▼ 16 3.7 -1 ▼ 34.8 1.1 -0.3 ▼Raymond James Financial Inc 15 16 1,096.5 1.1 +0.2 ▲ 28 6.4 +11 ▲ 50.9 1.6 +0.4 ▲Cowen & Co 16 19 1,020.7 1.0 +0.4 ▲ 24 5.5 +7 ▲ 59.2 1.8 +0.3 ▲Robert W Baird & Co Inc 17 25 945.2 1.0 +0.7 ▲ 20 4.6 +12 ▲ 44.4 1.4 +0.9 ▲BNP Paribas SA 18 44 773.4 0.8 +0.7 ▲ 4 0.9 +3 ▲ 22.9 0.7 +0.3 ▲Sandler O'Neill Partners 19 27 733.9 0.8 +0.6 ▲ 15 3.4 +8 ▲ 30.9 0.9 +0.4 ▲Allen & Co Inc 20 52* 715.7 0.7 +0.7 ▲ 4 0.9 +3 ▲ 12.6 0.4 +0.3 ▲Top Twenty Total 89,645.8 91.6 2,706.4 82.5
+153 3,278.7 100.0Industry Total 97,837.1 100.0 437
Industry % Change from Same Period Last Year 26 4% ▲ 53 9% 61 2% ▲▲
*tie** Rankings exclude self-funded proceeds, per Standard Criteria
▲▼
▼ Industry % Change from Last Quarter -23.9%▼ ▼Industry % Change from Same Period Last Year 230.1% ▲ 110.7% 204.8% ▲
-21.2% -10.3% ▼▼
472.2
▲
92.4511.2 100.0
0.7 +0.3 ▲3.3Top Nineteen Total 21,401.2 96.8Industry Total 22,103.5 100.0
▲Cowen & Co 20 - 128.0 +2 ▲
+3159
0.6 +0.6+3 ▲ 4.4 0.94 6.8
2 3.4-0.3 ▼
▼UBS 19 16 171.3 0.8 -0.6 ▼
5.1 +2 ▲ 2.7 0.5 -5.0+0.5 ▲
Mizuho Financial Group 18 7 206.9 0.9 -4.5 ▼ 35 8.5 +4 ▲ 9.0 1.8
1.8 -0.4 ▼SunTrust Banks 17 17 312.9 1.4 +0.1 ▲
▼ 2 3.4 +1 ▲ 9.1Mitsubishi UFJ Financial Group 16 10* 375.8 1.7 -1.0+2 ▲ 6.8 1.3 +1.2 ▲
▲US Bancorp 15 - 395.8 1.8 +1.8 ▲ 2 3.4
6.8 +4 ▲ 11.1 2.2 +2.0+0.9 ▲
BNP Paribas SA 14 - 503.4 2.3 +2.3 ▲ 44 6.8 +4 ▲ 8.8 1.7
3.1 -1.8 ▼HSBC Holdings PLC 13 - 528.7 2.4 +2.4 ▲
▼ 6 10.2 +3 ▲ 15.9RBC Capital Markets 12 6 561.5 2.5 -3.3+7 ▲ 12.7 2.5 +2.2 ▲
▲BMO Capital Markets 11 - 705.8 3.2 +3.2 ▲ 7 11.9
13.6 +6 ▲ 16.0 3.1 +0.6+2.7 ▲
Credit Suisse 10 8 861.5 3.9 +1.1 ▲ 8
▲Jefferies LLC 9 14 905.9 4.1 +2.4 ▲ 23.8 4.6
-
-65.8%
Credit Agricole CIB 18 -
26.9 5.3 +3.1
-0.4 ▼ 6 ▲ 8.4
240.9 0.8 +0.8 ▲0.9
1.8 +25.5 +1
11 626.9 2.0 +0.9
Credit Suisse 88 1,916.7 6.0 +3.2
▲ 5
▲ 7
1 7 4,933.5 15.5 +10.2
▲ 49.6% 34.5% ▲Industry % Change from Last Quarter -11.1% ▼ -15.1% -14.6% ▼Industry % Change from Same Period Last Year 8.1%
Market Change in
76.0 12.5
US Block Trades Jan 1 - Jun 30
Proceeds per Bookrunner (US$m) # of Deals per Bookrunner
5 4.6 +2
2017 Rank
2016 Rank Fees
Imputed Fees (US$m)Manager Market Market
Industry % Change from Same Period Last Year 26.4% ▲ 53.9% 61.2% ▲▲Industry % Change from Last Quarter -8.8% ▼ -3.2% -5.3% ▼▼
Sh. (%) Share Ch.Market Market # of
Proceeds Sh. (%) Share Ch.▲ 33 30.3 +21 ▲
Bookrunner Sh. (%) # of DealsDealsMorgan Stanley
10.3 0.0+1.3 ▲
Bank of America Merrill Lynch 2 5 3,998.0 12.5 +2.0▼ 24 22.0
26.6 +10 ▲▲ 2910.5 +5.9 ▲
-Citi 3 4 3,812.7 11.9 -0.2Goldman Sachs & Co 4 1 3,662.1 11.5 -9.2 ▼ 18 16.5 -2 ▼ 49.7 8.2 -6.4 ▼JP Morgan 5 2 3,298.8 10.3 -5.3 ▼ 25 22.9 -1 ▼ 43.9
+8 ▲ 63.862.5
7.2 -6.0 ▼Barclays 6 6 2,494.8 7.8 -2.0 ▼ 16 14.7 -1 ▼ 37.1 6.1 -1.8 ▼Wells Fargo & Co 7 ▲ 19 17.4 +7 ▲ 29.0 4.8 +1.3 ▲
3 1,199.1 3.8 -10.1 ▼ 11 10.1 -13 ▼ 31.3 5.2 -8.9 ▼Deutsche Bank 9 10 699.7 2.2 +1.0 4.6 +1 ▲ 9.0 1.5 -0.4 ▼Scotiabank 10 14 669.0 2.1 +1.4 ▲ 4 3.7 +2 ▲ 7.1 1.2 +0.3 ▲UBS 11 9 632.8 2.0 +0.5 6.4 +3 ▲ 8.2 1.3 -0.7 ▼RBC Capital Markets 12 ▲ 8 7.3 +3 ▲ 13.0 2.1 +0.6 ▲Jefferies LLC 13 17 568.5 1.8 +1.3 ▲ ▲ 13.4 2.2 +1.6 ▲Robert W Baird & Co Inc 14 - 450.6 1.4 +1.4 ▲ 5 4.6 +5 ▲ 11.8 2.0 +1.8 ▲BMO Capital Markets 15 13 441.5 1.4 +0.5 ▲ 5 4.6 0 - 11.0 1.8 +0.5 ▲Sandler O'Neill Partners 16 - 296.3 0.9 +0.9 ▲ 3 2.8 +3 ▲ 10.5 1.7 +1.7 ▲Stifel/KBW 17 18 281.3 +0.5 ▲ 8 7.3 +5 ▲ 11.1 1.8 +1.1 ▲
1 0.9 +1 ▲ 3.1 0.5 +0.1 ▲Cantor Fitzgerald LP 19 206.3 0.7 +0.7 ▲ 2 ▲ 10.1 1.7 +1.7 ▲Raymond James Financial Inc 20 12 195.3 0.6 1.4 -0.3 ▼Top Twenty Total 30,624.8 95.9 510.0
109 +7 608.283.9
Industry Total 31,932.3 100.0 100.0
Industry % Change from Same Period Last Year -16.0% ▼ 6.9% -3.4% ▼▲Industry % Change from Last Quarter -47.0% ▼ -44.3%
US Convertibles (C9a) Jan 1 - Jun 30
Proceeds per Bookrunner (US$m) # of Deals per Bookrunner Imputed Fees (US$m)2017 Rank
2016 Rank
Market Market # of MarketProceeds Sh. (%) Share Ch. Deals
Change in Manager Market MarketBookrunner Sh. (%) # of Deals Fees Sh. (%) Share Ch.JP Morgan 1 1 2,946.9 13.3 -10.3 ▼ 21 35.6 +9 ▲ 61.7 12.1 -7.7 ▼Bank of America Merrill Lynch 2 3 2,503.4 11.3 +0.7 ▲ 24 40.7 +19 ▲ 45.8 9.0 -0.9 ▼Morgan Stanley 3 5 2,269.4 10.3 +3.4 ▲ 21 35.6 +18 ▲ 51.6 10.1 +5.7 ▲Goldman Sachs & Co 4 2 2,094.5 9.5 -6.0 ▼ 13 22.0 +7 ▲ 54.1 10.6 -3.9 ▼Wells Fargo & Co 5 9 2,073.1 9.4 +6.7 ▲ 13 22.0 +11 ▲ 41.0 8.0 +4.8 ▲Deutsche Bank 6 10* 1,335.6 6.0 +3.3 ▲ 6 10.2 +5Citi 7
▲20.3 +7 ▲
27.9 5.5 +3.7 ▲4 1,265.2 5.7 -4.4 ▼ 12 39.6 7.8 -2.2 ▼
Barclays 8 15 1,255.6 5.7 +4.3 ▲ 12 20.3 +11 ▲▲ 7 11.9 +6
Visit http://dmi.thomsonreuters.com to view archives and order custom League Tables https://www.thomsonone.com
6

US Equity Capital MarketsFirst Half 2017 | Equity Capital Markets | Managing Underwriters
Top 10 US Equity & Equity-Related Deals (US$Bil) First Half 2017US Equity & Equity-Related Industry Composition for Top Bookrunners First Half 2017
$3.9
$2.5
$2.5
$2.2
$2.2
$2.2
$1.8
$1.8
$1.6
03/01/17
05/10/17
05/10/17
03/09/17
01/09/17
06/21/17
02/10/17
01/31/17
05/02/17
Snap Inc
Becton Dickinson & Co
Becton Dickinson & Co
Equinix Inc
The Williams Cos Inc
Altice USA Inc
Microchip Technology Inc
Invitation Homes Inc
Healthcare Trust of America8.4%9.8%
10.0%
2.3% 15.9%
5.3% 10.3%
9.7%
10.6%
11.4%6.4%
5.8%
11.5%7.6%
0.4%
5.4%
9.8%
7.3%
7.7%
9.5%
3.4%
6.4%
8.4%
11.1%4.8%
14.6% 3.8%
5.3%
12.0%0.6%
14.1%
11.7%
0.3%
2.3%
4.7%
8.9%
4.8% 6.3%
7.1%4.5%
6.4%
1.4% 2.1% 1.8% 2.3%3.4%
2.1% 2.3%
60%
70%
80%
90%
100%
US Year-on-Year % Change in ECM Volume (US$Bil) Jan 1 - Jun 30
$1.503/28/17Athene Holding Ltd
-10.2%
-25.9%
68.4%
-15.0%
21.6%
3.8%10.7%
-46.6%
42.6%
-$1.0
-$0.5
$0.0
$0.5
$1.0
$1.5
$2.0
-60%
-40%
-20%
0%
20%
40%
60%
80%
100%2009 2010 2011 2012 2013 2014 2015 2016 2017
Proceeds (US$B)
% C
hang
eYO
Y in
Pro
ceed
s
Pro
ceed
s U
S$
Billi
ons
15.0%12.7%
22.8%
13.2% 13.8%
8.2%
18.7%
10.7% 14.1%
20.4%
24.0%
18.8%
15.6%
8.6%
13.2%
19.8%
17.1%
0.9%
23.4%
15.1%
9.6%
13.5%
11.9%
9.0%
10.7% 10.1%
9.6%
28.6%
15.2%
13.3%
10.9%
12.0%
9.5% 12.1%
10.0%
0%
10%
20%
30%
40%
50%
JP Morgan Goldman Sachs & Co
Bank of America
Merrill Lynch
Citi Credit Suisse
Barclays Morgan Stanley
Wells Fargo Deutsche Bank
RBC Capital Markets
% T
otal
Pro
ceed
s
Real Estate High Technology Financials
Media and Entertainment Industrials Retail
Healthcare Consumer Products and Services Consumer Staples
Visit http://dmi.thomsonreuters.com to view archives and order custom League Tables https://www.thomsonone.com
7

GBM Grupo Bursatil Mexicano
+1 ▲ 3.7
227.612 1 137.313
CitiUBSLarrainVial SA
11 10
Latin America Equity Capital MarketsFirst Half 2017 | Equity Capital Markets | Managing Underwriters
Latin America ECM Volume Up Triples
Latin America Equity and Equity-related Volume (US$Bil) Jan 1 - Jun 30Jan 1 - Jun 30Latin America Equity & Equity Related (C1f)
Proceeds per Bookrunner (US$m) # of Deals per Bookrunner Imputed Fees (US$m)2017 Rank
2016 Rank
Market Market # of Market Change in Manager Market MarketBookrunner Proceeds Sh. (%) Share Ch. Deals Sh. (%) # of Deals Fees Sh. (%) Share Ch.Itau Unibanco 1 6* 968.3 14.1 +9.0 ▲ 10 52.6 +9 ▲ 23.3 10.7 +6.4 ▲Santander 2 2 928.5 13.5 +1.2 ▲ 9 47.4 +4 ▲ 34.2 15.7 +2.4 ▲JP Morgan 3 - 743.3 10.8 +10.8 ▲
5.7 -4.5 ▼Morgan Stanley 7
7.9Banco Bradesco SA 6 6* 542.69.1Banco BTG Pactual SA 5 11 626.89.6Bank of America Merrill Lynch 4 3 660.0
8 42.1 +8 ▲ 22.8 10.4 +10.4 ▲-2.4 ▼ 4 21.1 +1 ▲ 26.8 12.3 +2.1 ▲+6.2 ▲ 7 36.8 +5 ▲ 15.0 6.9 +3.7 ▲+2.8 ▲ 8 42.1 +7 ▲ 13.7 6.3 +2.0 ▲
5 519.7 7.6 -1.3 ▼ 5 26.3 +3 ▲ 17.3 7.9 -4.3 ▼Credit Suisse 8 4 387.3 4 21.1 +1 ▲ 22.7 10.4 +6.5 ▲Banco do Brasil SA 9 6* 349.2 5.1 0.0 - 4 21.1 +3 ▲ 7.1 3.2 -1.1 ▼Goldman Sachs & Co 10 - 328.9 4.8 +4.8 ▲ 2 10.5 +2 ▲ 12.7 5.8 +5.8 ▲
3.3 -0.9 ▼ 1 5.3 0 - 4.9 2.2 -1.3 ▼2.0 -20.9 ▼ 2 10.5 0 - 4.2 1.9 -17.7 ▼
- 120.5 1.8 +1.8 ▲ 1 5.3 1.7 +1.7 ▲14 - 66.5 1.0 +1.0 ▲ 1 5.3 +1 ▲ 2.2 1.0 +1.0 ▲
BBVA 15* - 42.4 0.6 +0.6 ▲ 1 5.3 +1 ▲ 1.1 0.5 -0.9 ▼Grupo Financiero Banorte-Ixe 15* 12 42.4 0.6 -2.0 ▼ 1 5.3 -1 ▼ 1.1 0.5 -2.6 ▼Raymond James Financial Inc 17 - 31.8 0.5 +0.5 ▲ 2 10.5 +2 ▲ 1.1 0.5 -0.7 ▼Jefferies LLC 18* - 29.7 0.4 +0.4 ▲ 1 5.3 +1 ▲ .7 0.3 +0.3 ▲Allen & Co Inc 18* - 29.7 0.4 +0.4 ▲
11 5.3 +1 ▲ .7
▲ .720 - 26.9 0.4 +0.4 ▲ 0.3 +0.3+0.3 ▲0.3
▲Top Twenty Total 6,809.4 99.3
5.3 +1216.0 98.9
+7 218 5 100 0Industry Total 6 857 6 100 0
XP Investimentos
19
$11.7 $6.3 $18.4 $21.2 $9.5 $20.7 $12.1 $10.7 $2.3 $6.9
10
6
17
27
17
29
12
8 8 12
8
1
10
18
10
12
3
44
7
0
4
8
12
16
20
24
28
32
$0
$4
$8
$12
$16
$20
$24
2008 2009 2010 2011 2012 2013 2014 2015 2016 2017
Pro
ceed
sU
S$
Billi
ons
# of
Issu
es
*tie
▲▲
First Half 2017Latin America ECM Volume (US$Bil) by Domicile Nation and SectorJan 1 - Jun 30Latin America Year-on-Year % Change in ECM Volume (US$Bil)
Industry % Change from Same Period Last Year 198.4% ▲ 58.3%
+7 218.5 100.0Industry Total 6,857.6 100.0 19
263.6% ▲Industry % Change from Last Quarter -6.7% ▼ 71.4% 48.9% ▲
2008 2009 2010 2011 2012 2013 2014 2015 2016 2017
Proceeds # of Non-IPOs # of IPOs
$4.5 66%
$1.5 22%
$0.6 9%
$0.2 3%
Brazil Mexico Argentina Chile
$2.8 41%
$1.8 26%
$1.5 21%
$0.3 4%
$0.2 3%
RetailFinancialsIndustrialsHealthcareConsumer Products and ServicesEnergy and Power
-45.8%
190.8%
15.2%
-55.0%
117.5%
-41.8%
-11.6%
-78.4%
198.4%
-100%
-60%
-20%
20%
60%
100%
140%
180%
220%2009 2010 2011 2012 2013 2014 2015 2016 2017
% Change YOY in Proceeds
% C
hang
e YO
Y in
Pro
ceed
s
Visit http://dmi.thomsonreuters.com to view archives and order custom League Tables https://www.thomsonone.com
8

First Half 2017 ECM Issuance Down 10% l Secondary Offerings Down 23% | Eleven Qualifying IPOs Up From Zero Last Year
12.4 +0.6
54
19
Canada Equity & Equity-Related - Ex. Self-Led (CA1a) Jan 1 - Jun 30
15.3
0 5
+0.3
13.31.0
▲
-
+0.5
158.2 0.620
16
+0.5137 1
1819 22
Haywood Securities Ltd.
14
Raymond James Financial Inc
+0.9
+0.9
Bank of America Merrill Lynch183.3
+1.5
11
1.61.01.5
▲
CIBC World Markets Inc8.4
-11-▼
▼ 27 +417
▲
25*
▲+1
▲
▲
+20
+4
2.2577.1
▲▲
Canada Common Stock & Trusts - Ex. Self-Led (CA2a)
1
▲2▲
3,109.9BMO Capital MarketsJP Morgan
+4 5
21.514.329 +1.01
36 17.7+7
# of Deals per BookrunnerMarket
Sh. (%)# of DealsRBC Capital Markets
# ofProceeds
2017 Rank
Proceeds per Bookrunner (C$m)
Sh. (%)
Jan 1 - Jun 30
Market MarketBookrunner
MarketProceeds
MarketShare Ch.
2016 Rank
# of Deals per Bookrunner
# of Deals▲ 26
2
Sh. (%)Deals▼-3
Market
1.2
- 183.3 0.7
1.0
13 289.0385.7
25
158.2
17
15
+2 9Canaccord Genuity
Goldman Sachs & Co
+5+1
Raymond James Financial Inc 12
Clarus Securities Inc.
▲
+1
▼-2
8
▲▲▲ Credit Suisse
4 ▲+5.8-7.9
▲
3 3,402.052
# of
31
Deals
13.0 +1.1 ▲9.1
-3.916.0
Sh. (%)RBC Capital Markets
2
Proceeds per Bookrunner (C$m)
+1.0TD Securities Inc
Share Ch.2017 Rank
1▼
5,577.4
2,373.3
4,186.721 21.4
BMO Capital Markets7JP Morgan
CIBC World Markets Inc 5
1,298.06 1,314.5
2,177.43
Credit Suisse 9 574.8
8.3
5.05.0
Scotiabank 7 48
10
National Bank of Canada Fin'l 6
Canaccord Genuity2.2
16.33
1.7-
33
Morgan Stanley8 -0.1
▼
▲
11-7.0
+1.7449.810 ▲
5.4
2
0 1
10
1 5
0
+0.6▲
▼
1.00.70.7
+0.8
▲
+0.5 2
▲▲
5.4
240.6▲
+2
+6+40.8220.1
129
1.1
▲
0.9
2 1.0169.2
GMP Capital Corp
Barclays
Goldman Sachs & Co
15Cormark Securities Inc
13287.7
4.4
M i G 3
14Clarus Securities Inc.
17
420
Cantor Fitzgerald LP16
+0.7
▼▲0 - Cantor Fitzgerald LP▲ 2.0
+2
1.55.9
3
M i G2
4.9
14
▲
▲
116.9
1315
406.2
1.1385.7289.0 ▲
1.5
+1
21-
1112
16.3
1,987.0 7.9
4,086.6
1,307.8
5,389.7
17.5
5.2National Bank of Canada Fin'l 6 6
Bookrunner
26
+6.1
+413.8
0
2016 Rank
Change in
TD Securities Inc3
Change in
1.19.5
13.8▼-3.6+3
▲
+1▲ 33 ▲▲ 2 ▲
-8.4 ▼2,373.3
Scotiabank 1,298.07 4
73
11
+2 ▲-
5.8 -11
23 12.2
+2▼
▲ 155.2 +0.8-7.1 ▼
7.9 0
▲14 553.6 2.2
+0.1+1.5 ▲
▲31 16.4 +18 ▲
10 574.8 2.3 +1.0 ▲▲ 3 1.6
8 473.7 1.9Morgan Stanley 11 - 449.8 1.8GMP Capital Corp 10 15 7.9 +5
2 1.1 +2▲▲ 11 5.8 +5
▲ ▲3
▲1.5 +0.9
+1.8 ▲
9 4.8 +6+0.9 ▲▲
1.6
▲
+1+10 12 6.3-
+0.4
+220.9 +0.7 +4▲
▲10
+0.7Haywood Securities Ltd. 16 21 220.1
Cormark Securities Inc 14 1115
287.7240.6
Bank of America Merrill Lynch
16
+0.5
▼20 0 6 3 1 62.11.1▲ 20.7
4
1.1
1.2
5.3
Barclays 13
22
▲▲▲
0▲0.6 +0.5▲
First Half 2017 | Equity Capital Markets | Managing Underwriters
137 1 20 2
20
Canadian Equity
-18 +1169.2
% Change from Last Year % Change from Last Year% Change from Last Quarter % Change from Last Quarter*tie
*tie
Leerink Partners LLC
% Change from Last Year
+1+1+1
▲▲▲▲
2.21.9
2111
18.29.19.19.1
+2
3,108.4
10*
11 +11Top Eleven totalIndustry Total
% Change from Last Quarter 280.5% ▲
100.02,870.1 92.3
1.71.7
+2.2+1.9+1.7+1.7
---
68.258.352.252.210*
ScotiabankMorgan StanleyBank of America Merrill LynchINFOR Financial
89
-
75.0%
▲
▲
▲▲▲
+3.1 ▲ 1 9.1 +1 ▲▲ 1 9.1 +1 ▲
Goldman Sachs & Co 6* - 97.8 3.1
3 27.3 +3 ▲Credit Suisse 6* - 97.8 3.1 +3.1
▼
Share Ch.▲
BMO Capital Markets 5 - 120.5 3.9 +3.9 ▲
+50
▼
189
▲
▲
-32.1%
# of Deals per BookrunnerMarket
4 - 133.4
-10.3%5.9% -25.9%▲
▼
- 1,018.7
32.7% ▲▼
Top Twenty Total203
31.3%
Industry Total 100.0 Industry Total26,122.8
3.8%
94.6+4525,016.8 100.0
5
-12.3%
22
116.9
10.8
158.2
36.4
2 18.2 +2
18.2+4+2
4
8
-
Raymond James Financial Inc
Barclays
Morgan StanleyCredit Suisse
GMP Capital Corp 11
2017 Rank
2016 Rank
1410
▲
▲
National Bank of Canada Fin'l 6Scotiabank
RBC Capital Markets
Top Twenty Total
20
Cantor Fitzgerald LP
19
CIBC World Markets Inc
17
0.5
23.6%
Visit http://dmi.thomsonreuters.com to view archives and order custom League Tables
20,799.3
Canada Initial Public Offerings - Ex. Self-Led (CA3)
▲
Jan 1 - Jun 30Canada Secondary Offerings- Ex. Self-Led (CA4a)
93.424,408.1137.1 +0.1 1.5Macquarie Group 320 16 ▼▲ Macquarie Group-2
2,373.3JP Morgan 4
16
Proceeds per Bookrunner (C$m)
7
▲
Top Twenty Total▼20 0.6 3
2BMO Capital Markets 2,989.43
Bookrunner
TD Securities Inc
1.6
# of Deals
▼-74,371.11 1
Sh. (%)-0.5
2 3,201.7 13.5▼20.0
Sh. (%)Proceeds
13.714.6
Deals
-5.3▲ 30 16.9
▼
+1.9 0 -
▼2422 12.4 -7
1.1 +1▲ 25 3 1,700.9 7.8
+7.4▼▲
-1▲ 14-8.5 ▼ 18 10.1 -3+1.51,297.96 ▼
▼9 5.1 -135.9
▼
▲
1,229.8 -6.7Canaccord Genuity
7
2.22.5553.65.6
9+18
0.6 +1▲ 1
7.9
1.8
▲+0.9
31+1.8
▲▲ 2 1.1 +1
-0.212 15 335.7
+1.8101.68 340.3
391.5
▲▼ 13 7.3 +3 ▲
5.6 +4+0.1+0.9 ▲ 10
Cormark Securities Inc 13 11 287.7 1.31.5
-▲ 12 6.7 +1 ▲
1.1 0▲ 2+0.414 13 260.1
1.01.11.2
15 25 240.6 +1.0Haywood Securities Ltd. 16 21 220.1Clarus Securities Inc.
▲▲ 9 5.1 +6 ▲
5.6 +4▲ 100 -
1.7 -23 ▼4
Industry Total
-▲ 1
21,908.4
-36.1%
+0.3-
▲
▲▼
-23.2% ▼
94.9+0.5
0.6Macquarie Group 137.1 0.6
2.20.7
477.0
18 16
17.4
% Change from Last Quarter
▲
0.6▲116.4
+0.2
100.0
0.5
+0.6+0.8
20 +1 ▲
-11.7% ▼
+34
01
https://www.thomsonone.com
Market Change in # of Deals
Change in Market
Bank of America Merrill Lynch
178
Sh. (%)
0.5
# ofMarketMarket
Jan 1 - Jun 30
23,675.1▲137.1 -2+0.2
Proceeds per Bookrunner (C$m) # of Deals per Bookrunner2017 Rank
2016 Rank
Market # ofDeals
32.8 +32.8Bookrunner Proceeds Sh. (%) Share Ch.RBC Capital Markets 1TD Securities Inc 2 - 884.9 28.5 2+28.5 ▲
4
CIBC World Markets Inc 3 - 286.1 9.2 +9.2+4.3 ▲4.3
Jan 1 - Jun 30Secondary Proceeds by Industry Sector (C$M)
▲ 5 45.5 +5 ▲GMP Capital Corp
58%12%
9% 6% 15% Energy and Power
Materials
Real Estate
Healthcare
All Others
Visit http://dmi.thomsonreuters.com to view archives and order custom League Tables https://www.thomsonone.com
9
nc
First Half 2017 | Equity Capital Markets | Managing Underwriters
EMEA Equity Capital MarketsEMEA ECM Reaches US$ 138 billion | IPO Fees Increase by 43% | Financials Lead Issuance
EMEA Deals Intelligence
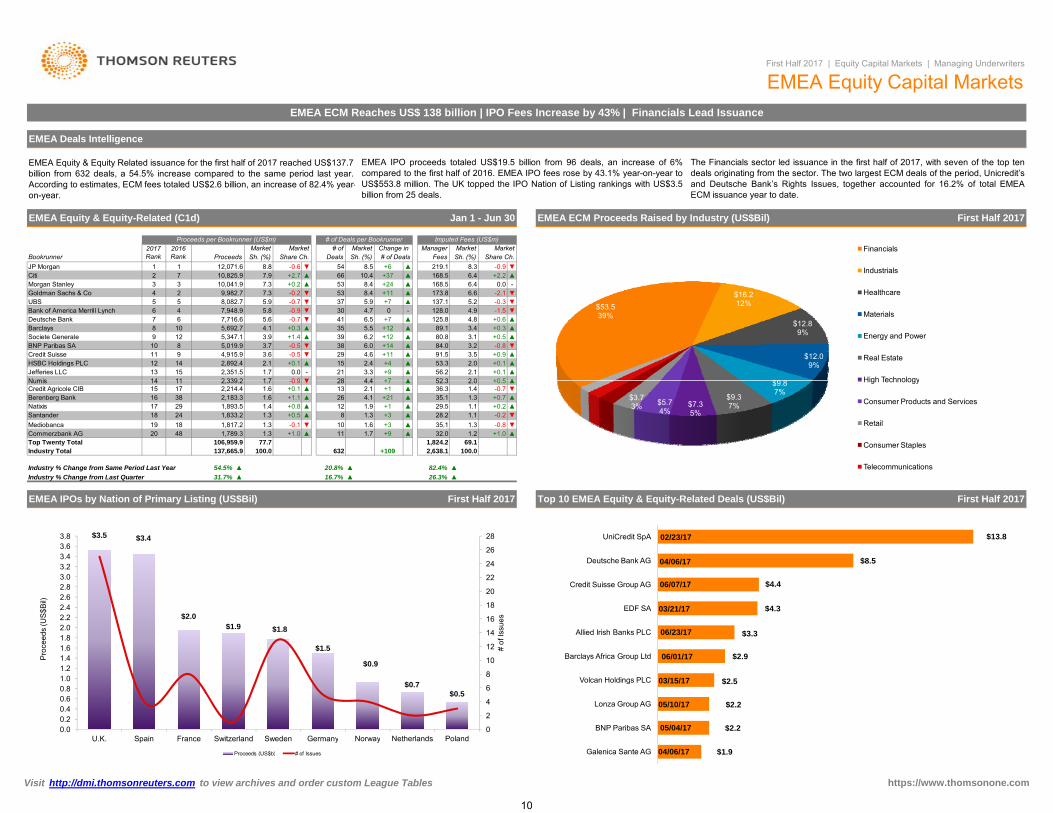
EMEA Equity & Equity Related issuance for the first half of 2017 reached US$137.7billion from 632 deals, a 54.5% increase compared to the same period last year.According to estimates, ECM fees totaled US$2.6 billion, an increase of 82.4% year-on-year.
EMEA IPO proceeds totaled US$19.5 billion from 96 deals, an increase of 6%compared to the first half of 2016. EMEA IPO fees rose by 43.1% year-on-year toUS$553.8 million. The UK topped the IPO Nation of Listing rankings with US$3.5billion from 25 deals.
The Financials sector led issuance in the first half of 2017, with seven of the top tendeals originating from the sector. The two largest ECM deals of the period, Unicredit’sand Deutsche Bank’s Rights Issues, together accounted for 16.2% of total EMEAECM issuance year to date.
Jan 1 - Jun 30 EMEA ECM Proceeds Raised by Industry (US$Bil) First Half 2017
Proceeds per Bookrunner (US$m) # of Deals per Bookrunner Imputed Fees (US$m)
EMEA Equity & Equity-Related (C1d)
2017 Rank
2016 Rank
Market Market # of Market Change in Manager Market MarketBookrunner Proceeds Sh. (%) Share Ch. Deals Sh. (%) # of Deals Fees Sh. (%) Share Ch.JP Morgan 1 1 12,071.6 8.8 -0.6 ▼ 54 8.5 +6 ▲ 219.1 8.3 -0.9 ▼Citi 2 7 10,825.9 7.9 +2.7 ▲ 66 10.4 +37 ▲ 168.5 6.4 +2.2 ▲Morgan Stanley 3 3 10,041.9 7.3 +0.2 ▲ 53 8.4 +24 ▲ 168.5 6.4 0.0 -Goldman Sachs & Co 4 2 9,982.7 7.3 -0.2 ▼ 53 8.4 +11 ▲ 173.8 6.6 -2.1 ▼UBS 5 5 8,082.7 5.9 -0.7 ▼ 37 5.9 +7 ▲ 137.1 5.2 -0.3 ▼Bank of America Merrill Lynch 6 4 7,948.9 5.8 -0.9 ▼ 30 4.7 0 - 128.0 4.9 -1.5 ▼Deutsche Bank 7 6 7,716.6 5.6 -0.7 ▼ 41 6.5 +7 ▲ 125.8 4.8 +0.6 ▲Barclays 8 10 5,692.7 4.1 +0.3 ▲ 35 5.5 +12 ▲ 89.1 3.4 +0.3 ▲Societe Generale 9 12 5,347.1 3.9 +1.4 ▲ 39 6.2 +12 ▲ 80.8 3.1 +0.5 ▲BNP Paribas SA 10 8 5,019.9 3.7 -0.5 ▼ 38 6.0 +14 ▲ 84.0 3.2 -0.8 ▼Credit Suisse 11 9 4,915.9 3.6 -0.5 ▼ 29 4.6 +11 ▲ 91.5 3.5 +0.9 ▲HSBC Holdings PLC 12 14 2,892.4 2.1 +0.1 ▲ 15 2.4 +4 ▲ 53.3 2.0 +0.1 ▲Jefferies LLC 13 15 2,351.5 1.7 0.0 - 21 3.3 +9 ▲ 56.2 2.1 +0.1 ▲Numis 14 11 2 339 2 1 7 0 9 ▼ 28 4 4 +7 ▲ 52 3 2 0 +0 5 ▲
$53.5 39%
$16.2 12%
$12.8 9%
$12.0 9%
$9 8
Financials
Industrials
Healthcare
Materials
Energy and Power
Real Estate
High TechnologyNumis 14 11 2,339.2 1.7 -0.9 ▼ 28 4.4 +7 ▲ 52.3 2.0 +0.5 ▲Credit Agricole CIB 15 17 2,214.4 1.6 +0.1 ▲ 13 2.1 +1 ▲ 36.3 1.4 -0.7 ▼Berenberg Bank 16 38 2,183.3 1.6 +1.1 ▲ 26 4.1 +21 ▲ 35.1 1.3 +0.7 ▲Natixis 17 29 1,893.5 1.4 +0.8 ▲ 12 1.9 +1 ▲ 29.5 1.1 +0.2 ▲Santander 18 24 1,833.2 1.3 +0.5 ▲ 8 1.3 +3 ▲ 28.2 1.1 -0.2 ▼Mediobanca 19 18 1,817.2 1.3 -0.1 ▼ 10 1.6 +3 ▲ 35.1 1.3 -0.8 ▼Commerzbank AG 20 48 1,789.3 1.3 +1.0 ▲ 11 1.7 +9 ▲ 32.0 1.2 +1.0 ▲Top Twenty Total 106,959.9 77.7Industry Total 137,665.9 100.0
1,824.2632
69.1+109 2,638.1 100.0
Industry % Change from Same Period Last Year 54.5% ▲ 20.8% 82.4% ▲▲Industry % Change from Last Quarter 31.7% ▲ 16.7% 26.3% ▲▲
EMEA IPOs by Nation of Primary Listing (US$Bil) First Half 2017 Top 10 EMEA Equity & Equity-Related Deals (US$Bil) First Half 2017
$9.8 7%
$9.3 7%$7.3
5%$5.7 4%
$3.7 3%
$2.9 2%
$2.4 2%
$2.1 1%
High Technology
Consumer Products and Services
Retail
Consumer Staples
Telecommunications
$3.5 $3.4
$2.0$1.9 $1.8
$1.5
$0.9
$0.7$0.5
0
2
4
6
8
10
12
14
16
18
20
22
24
26
28
0.00.20.40.60.81.01.21.41.61.82.02.22.42.62.83.03.23.43.63.8
U.K. Spain France Switzerland Sweden Germany Norway Netherlands Poland
# of
Issu
es
Pro
ceed
s (U
S$B
il)
Proceeds (US$b) # of Issues
$13.8
$8.5
$4.4
$4.3
$3.3
$2.9
$2.5
$2.2
$2.2
$1.9
02/23/17
04/06/17
06/07/17
03/21/17
06/23/17
06/01/17
03/15/17
05/10/17
05/04/17
04/06/17
UniCredit SpA
Deutsche Bank AG
Credit Suisse Group AG
EDF SA
Allied Irish Banks PLC
Barclays Africa Group Ltd
Volcan Holdings PLC
Lonza Group AG
BNP Paribas SA
Galenica Sante AG
Visit http://dmi.thomsonreuters.com to view archives and order custom League Tables https://www.thomsonone.com
10

553.8 100.0Industry TotalTop Twenty Total
+19619,505.9 100.0
First Half 2017 | Equity Capital Markets | Managing Underwriters
EMEA Equity Capital Markets
EMEA Common Stock (C4c) Jan 1 - Jun 30 EMEA IPOs (C7c) Jan 1 - Jun 30
Proceeds per Bookrunner (US$m) # of Deals per Bookrunner Imputed Fees (US$m) Proceeds per Bookrunner (US$m) # of Deals per Bookrunner Imputed Fees (US$m)
Sh. (%) Share Ch.2017 Rank
2016 Rank
Market Market # of # of MarketMarket Change in Manager Market Market 2017 Rank# of Deals Fees
Change in Manager Market MarketBookrunner Proceeds Sh. (%) Share Ch. Deals Sh. (%) Bookrunner Proceeds Sh. (%) Share Ch. Deals Sh. (%)
2016 Rank
Market Market# of Deals Fees Sh. (%) Share Ch.
Citi 1 7 10,059.5 8.1 +3.0 ▲ 61 10.2 +37 ▲ 156.8 6.5 +2.8 ▲ Citi 1 2 1,683.3 8.6 +1.2 ▲ 14 14.6 +5 ▲ 42.4 7.7 +2.4 ▲Goldman Sachs & Co 2 3 9,507.7 7.7 +0.7 ▲ 50 8.3 +16 ▲ 166.8 6.9 -1.7 ▼ Credit Suisse 2 16 1,317.0 6.8 +4.4 ▲ 10 10.4 +7 ▲ 29.4 5.3 +2.7 ▲Morgan Stanley 3 6 8,754.9 7.1 +1.1 ▲ 48 8.0 +22 ▲ 152.2 6.3 +1.1 ▲ UBS 3 6 1,207.9 6.2 +1.6 ▲ 7 7.3 +4 ▲ 25.7 4.7 +1.4 ▲JP Morgan 4 1 8,252.1 6.7 -1.5 ▼ 45 7.5 +5 ▲ 153.6 6.4 -1.4 ▼ Deutsche Bank 4 5 1,136.2 5.8 +1.0 ▲ 8 8.3 0 - 18.9 3.4 -0.9 ▼Bank of America Merrill Lynch 5 4 7,948.9 6.4 -0.3 ▼ 30 5.0 +4 ▲ 128.0 5.3 -1.1 ▼ Goldman Sachs & Co 5 4 1,096.4 5.6 +0.5 ▲ 9 9.4 +1 ▲ 40.4 7.3 -1.3 ▼UBS 6 2 7,582.4 6.1 -1.5 ▼ 34 5.7 +6 ▲ 131.9 5.5 -0.6 ▼ JP Morgan 6 1 916.1 4.7 -5.6 ▼ 6 6.3 -6 ▼ 37.2 6.7 -5.1 ▼Deutsche Bank 7 5 6,026.7 4.9 -1.5 ▼ 34 5.7 +5 ▲ 97.3 4.1 0.0 - Morgan Stanley 7 3 875.3 4.5 -2.6 ▼ 8 8.3 0 - 29.5 5.3 -1.2 ▼Barclays 8 9 5,100.0 4.1 +0.2 ▲ 34 5.7 +13 ▲ 84.4 3.5 +0.3 ▲ Jefferies LLC 8 38 601.4 3.1 +2.5 ▲ 8 8.3 +6 ▲ 15.4 2.8 +1.8 ▲Credit Suisse 9 8 4,652.5 3.8 -0.7 ▼ 27 4.5 +11 ▲ 85.9 3.6 +0.8 ▲ Barclays 9 9 556.8 2.9 -1.0 ▼ 6 6.3 0 - 14.7 2.7 +0.3 ▲Societe Generale 10 12 4,207.5 3.4 +1.1 ▲ 31 5.2 +10 ▲ 59.6 2.5 -0.1 ▼ Carnegie 10 7 536.2 2.8 -1.7 ▼ 10 10.4 0 - 17.4 3.1 -1.0 ▼BNP Paribas SA 11 15 3,586.3 2.9 +1.1 ▲ 28 4.7 +18 ▲ 61.7 2.6 +0.8 ▲ Cenkos Securities PLC 11 58 534.4 2.7 +2.6 ▲ 2 2.1 +1 ▲ 12.7 2.3 +2.1 ▲HSBC Holdings PLC 12 17 2,674.2 2.2 +0.6 ▲ 13 2.2 +5 ▲ 48.7 2.0 +0.5 ▲ HSBC Holdings PLC 12 23 439.4 2.3 +1.0 ▲ 3 3.1 +1 ▲ 7.2 1.3 +0.9 ▲Jefferies LLC 13 13 2,351.5 1.9 -0.1 ▼ 21 3.5 +9 ▲ 56.2 2.3 0.0 - Santander 13 25 437.3 2.2 +1.0 ▲ 5 5.2 +3 ▲ 8.4 1.5 +0.1 ▲Numis 14 10 2,318.4 1.9 -1.2 ▼ 26 4.3 +5 ▲ 51.8 2.2 +0.4 ▲ Societe Generale 14 13 429.6 2.2 -0.3 ▼ 6 6.3 -2 ▼ 9.1 1.7 -1.0 ▼Berenberg Bank 15 48 2,183.3 1.8 +1.4 ▲ 26 4.3 +22 ▲ 35.1 1.5 +1.0 ▲ Berenberg Bank 15 48 423.5 2.2 +2.0 ▲ 6 6.3 +5 ▲ 9.9 1.8 +1.1 ▲Santander 16 23 1,833.2 1.5 +0.6 ▲ 8 1.3 +3 ▲ 28.2 1.2 -0.3 ▼ BNP Paribas SA 16 22 384.4 2.0 +0.7 ▲ 4 4.2 +2 ▲ 8.2 1.5 +0.8 ▲Commerzbank AG 17 47 1,789.3 1.5 +1.1 ▲ 11 1.8 +9 ▲ 32.0 1.3 +1.1 ▲ Bank of America Merrill Lynch 17 14 362.1 1.9 -0.6 ▼ 3 3.1 -2 ▼ 6.7 1.2 -1.6 ▼Mediobanca 18 16 1,711.0 1.4 -0.3 ▼ 9 1.5 +2 ▲ 33.2 1.4 -1.1 ▼ Danske Bank 18 10 347.6 1.8 -0.9 ▼ 5 5.2 +4 ▲ 8.2 1.5 +1.1 ▲Natixis 19 45 1,623.7 1.3 +0.9 ▲ 9 1.5 0 - 22.7 0.9 +0.1 ▲ Nordea 19 8 343.3 1.8 -2.6 ▼ 5 5.2 0 - 10.1 1.8 -0.3 ▼Credit Agricole CIB 20 20 1,584.7 1.3 +0.3 ▲ 8 1.3 +1 ▲ 23.8 1.0 -0.7 ▼ Peel Hunt LLP 20 20 334.9 1.7 +0.2 ▲ 3 3.1 -1 ▼ 10.0 1.8 +0.3 ▲Top Twenty Total 93,747.8 75.9Industry Total 123,573.5 100.0
1,609.9600 +109 2,403.3
67.0100.0
361.5 65.313,963.1 71.6
*tie** Rankings exclude self-funded proceeds, per Standard Criteria
82.3% ▲▲74.3%Industry % Change from Last Quarter 141.1% ▲
-
▲▲
▼▲
Industry % Change from Same Period Last Year 64.2% ▲ 22.2% 96.7% ▲Industry % Change from Last Quarter 40.0% ▲ 17.7% 32.9% ▲
Industry % Change from Same Period Last Year 6.0% ▲ 1.1% 43.1% ▲▲
EMEA Rights Offerings (C8fr) Jan 1 - Jun 30 EMEA Convertibles (C9d) Jan 1 - Jun 30
Proceeds per Bookrunner (US$m) # of Deals per Bookrunner Imputed Fees (US$m) Proceeds per Bookrunner (US$m) # of Deals per Bookrunner Imputed Fees (US$m)
Sh. (%) Share Ch.2017 Rank
2016 Rank
Market Market # of # of MarketMarket Change in Manager Market Market 2017 Rank# of Deals Fees
Change in Manager Market MarketBookrunner Proceeds Sh. (%) Share Ch. Deals Sh. (%) Bookrunner Proceeds Sh. (%) Share Ch. Deals Sh. (%)
2016 Rank
Market Market# of Deals Fees Sh. (%) Share Ch.
JP Morgan 1 7 2,618.8 7.0 +2.1 ▲ 11 18.0 +6 ▲ 53.5 6.8 +3.5 ▲ JP Morgan 1 2 3,819.6 27.1 +11.2 ▲ 9 28.1 +1 ▲ 65.5 27.9 +11.2 ▲Bank of America Merrill Lynch 2 1 2,307.2 6.2 -3.3 ▼ 7 11.5 +3 ▲ 54.9 7.0 -3.6 ▼ Deutsche Bank 2 7 1,690.0 12.0 +6.6 ▲ 7 21.9 +2 ▲ 28.5 12.2 +7.6 ▲Credit Suisse 3 36 2,155.9 5.8 +5.4 ▲ 5 8.2 +3 ▲ 40.3 5.1 +3.4 ▲ BNP Paribas SA 3 1 1,433.6 10.2 -6.8 ▼ 10 31.3 -4 ▼ 22.3 9.5 -6.5 ▼Goldman Sachs & Co 4 2 2,104.9 5.6 -3.1 ▼ 8 13.1 +1 ▲ 44.8 5.7 -6.6 ▼ Morgan Stanley 4 3 1,287.0 9.1 -3.8 ▼ 5 15.6 +2 ▲ 16.3 6.9 -6.3 ▼Morgan Stanley 5 12 2,066.0 5.5 +2.6 ▲ 8 13.1 +4 ▲ 38.3 4.9 +1.9 ▲ Societe Generale 5 10 1,139.6 8.1 +4.7 ▲ 8 25.0 +2 ▲ 21.2 9.0 +6.2 ▲BNP Paribas SA 6 15 1,866.2 5.0 +2.2 ▲ 12 19.7 +8 ▲ 33.9 4.3 +1.2 ▲ Citi 6 6 766.4 5.4 -0.6 ▼ 5 15.6 0 - 11.6 5.0 -1.6 ▼Barclays 7 3 1,836.7 4.9 -1.3 ▼ 5 8.2 +1 ▲ 34.9 4.5 -0.2 ▼ Credit Agricole CIB 7 8 629.7 4.5 0.0 - 5 15.6 0 - 12.5 5.3 +0.8 ▲HSBC Holdings PLC 8 24 1,782.3 4.8 +3.4 ▲ 6 9.8 +4 ▲ 36.2 4.6 +1.4 ▲ Barclays 8 11 592.7 4.2 +1.3 ▲ 1 3.1 -1 ▼ 4.7 2.0 -0.6 ▼Deutsche Bank 9 6 1,732.0 4.6 -0.6 ▼ 7 11.5 +3 ▲ 35.6 4.5 +0.9 ▲ UBS 9 14 500.3 3.6 +2.1 ▲ 3 9.4 +1 ▲ 5.2 2.2 +0.2 ▲Societe Generale 10 13 1,722.5 4.6 +1.8 ▲ 8 13.1 +3 ▲ 23.2 3.0 -0.7 ▼ Goldman Sachs & Co 10 4 475.1 3.4 -7.1 ▼ 3 9.4 -5 ▼ 7.0 3.0 -6.4 ▼Citi 11 5 1,618.9 4.3 -1.3 ▼ 5 8.2 +1 ▲ 28.7 3.7 +0.4 ▲ UniCredit 11 16 301.9 2.1 +0.7 ▲ 1 3.1 0 - 4.0 1.7 -0.1 ▼Natixis 12 26 1,512.8 4.0 +2.7 ▲ 4 6.6 -1 ▼ 19.3 2.5 +0.7 ▲ Natixis 12 15 269.8 1.9 +0.4 ▲ 3 9.4 +1 ▲ 6.8 2.9 +1.2 ▲Mediobanca 13 4 1,421.8 3.8 -1.8 ▼ 4 6.6 +2 ▲ 27.7 3.5 -2.9 ▼ Credit Suisse 13 12 263.4 1.9 -0.1 ▼ 2 6.3 0 - 5.6 2.4 +0.7 ▲UBS 14 11 1,407.0 3.8 +0.9 ▲ 3 4.9 -1 ▼ 34.0 4.3 -2.7 ▼ HSBC Holdings PLC 14 9 218.3 1.6 -2.4 ▼ 2 6.3 -1 ▼ 4.6 2.0 -1.8 ▼BBVA 15* 18 1,392.1 3.7 +1.6 ▲ 3 4.9 +2 ▲ 16.9 2.2 -0.2 ▼ Nplus1 Singer Advisory LLP 15 18 130.5 0.9 -0.2 ▼ 1 3.1 0 - 2.4 1.0 -0.2 ▼Banca IMI (Intesa Sanpaolo) 15* 19* 1,392.1 3.7 +1.8 ▲ 3 4.9 +1 ▲ 20.0 2.6 +1.9 ▲ Stifel/KBW 16* - 110.0 0.8 +0.8 ▲ 1 3.1 +1 ▲ 3.0 1.3 +2.6 ▲Santander 15* 9 1,392.1 3.7 +0.5 ▲ 3 4.9 0 - 19.7 2.5 -0.9 ▼ Cenkos Securities PLC 16* - 110.0 0.8 +0.8 ▲ 1 3.1 +1 ▲ 3.0 1.3 +2.5 ▲Credit Agricole CIB 18 8 1,361.5 3.6 +0.1 ▲ 5 8.2 +1 ▲ 18.7 2.4 -1.8 ▼ Mediobanca 18 - 106.2 0.8 +0.8 ▲ 1 3.1 +1 ▲ 1.9 0.8 +2.4 ▲Commerzbank AG 19 - 1,159.0 3.1 +3.1 ▲ 3 4.9 +3 ▲ 20.2 2.6 +2.5 ▲ Nordea 19 - 83.9 0.6 +0.6 ▲ 1 3.1 +1 ▲ 1.2 0.5 +2.6 ▲UniCredit 20 19* 840.2 2.2 +0.3 +2
-461
▲ 15.6
Industry Total 37,524.0 100.0Top Twenty Total 89.833,690.0 Top Nineteen Total
+1.3 ▲
783.9616.4
▲ 4 6.6 2.078.6
100.0 Industry Total 14,092.4 100.0 3213,928.0 98.8 227.3 96.8
Industry % Change from Same Period Last Year 156.8% ▲ -6.2% 110.0% 0.0% 4.7%
0 234.8 100.0
-Industry % Change from Last Quarter -22.3% ▼
▲ Industry % Change from Same Period Last Year 1.8% ▲0.0% -24.9% ▼
▲Industry % Change from Last Quarter 2.2% ▲ 17.9% -8.7% ▼
Visit http://dmi.thomsonreuters.com to view archives and order custom League Tables https://www.thomsonone.com
11

nc
3 4 0 3 ▼▼ 13 1 4 +3 ▲ 73 8Essence Securities Co Ltd 14 9 1 791 0 2 0 1 10 - 42.6 2.0 -1.2 ▼
▲Deutsche Bank 13 3 1,829.4 2.1 -4.0 ▼ 16 1.7
1.4 +7 ▲ 35.2 1.6 +0.9+2.1 ▲
Bank of America Merrill Lynch 12 29 2,179.5 2.4 +1.6 ▲ 1333 3.6 +14 ▲ 97.9 4.6
5.4 +1.2 ▲Haitong Securities Co Ltd 11 11 2,425.7 2.7 +0.2 ▲
▼ 32 3.4 +13 ▲ 116.1GF Securities 10 7 2,492.0 2.8 -0.4+3 ▲ 17.5 0.8 0.0 -
▲NH Investment & Securities Co 9 19 2,772.6 3.1 +1.5 ▲ 13 1.4
2.6 +6 ▲ 69.6 3.2 +0.4+0.6 ▲
Citi 8 8 3,008.3 3.4 +0.2 ▲ 2418 1.9 +8 ▲ 34.0 1.6
2.4 +0.6 ▲UBS 7 21 3,182.8 3.6 +2.4 ▲
▲ 19 2.0 +7 ▲ 51.1China International Capital Co 6 6 3,339.4 3.7 +0.2+2 ▲ 76.5 3.6 -0.4 ▼
▲Guotai Junan Securities 5 5 3,425.8 3.8 +0.1 ▲ 26 2.8
2.3 +8 ▲ 97.0 4.5 +2.2-4.2 ▼
China Securities Co Ltd 4 15 3,667.9 4.1 +2.2 ▲ 2122 2.4 -7 ▼ 52.4 2.4
4.6 -2.6 ▼Morgan Stanley 3 1 4,093.2 4.6 -5.0 ▼
▼ 28 3.0 +3 ▲ 99.664.2 3.0 +1.0 ▲
CITIC 2 2 4,918.5 5.5 -3.9+4.5 ▲ 22 2.4 +9 ▲
Sh. (%) # of Deals Fees Sh. (%) Share Ch.Goldman Sachs & Co 1 12 6,082.4 6.8
Market Change in Manager Market MarketBookrunner Proceeds Sh. (%) Share Ch. Deals
2017 Rank
2016 Rank
Market Market # of
Asia Equity & Equity-Related, inc Chinese A-shares (C1b) Jan 1 - Jun 30 Asia Equity & Equity-Related Imputed Fees by Domicile Nation (US$Mil) Jan 1 - Jun 30
Proceeds per Bookrunner (US$m) # of Deals per Bookrunner Imputed Fees (US$m)
First Half 2017 | Equity Capital Markets | Managing Underwriters
Asia (ex-Japan, ex-Australia) Equity Capital MarketsAsian Equity & Equity-Related Proceeds Up 5% | Asian IPO Up 69% | Shanghai Tops Asia IPO Exchanges
Asia Deals Intelligence
Asian equity and equity-related proceeds for the first half of 2017 totaled US$89.4billion, a 4.5% increase compared to the same period a year ago. Financials led allsectors, capturing 21.5% of the market. Industrials and Materials rounded out thetop three, capturing 19.7% and 11.4% market shares, respectively.
Asian IPO proceeds totaled US$30.3 billion, a 69% increase compared to lastyear. The Shanghai Stock Exchange led all Asian stock exchanges in IPOlistings, with a total of US$9.5 billion in proceeds from 111 issues. Asian follow-onproceeds reached US$51.5 billion and captured a 57.6% market share.
According to Thomson Reuters fee estimates, Asian ECM fees during the first halfof 2017 totaled US$2.1 billion from 929 transactions, a 60.6% increase compared tothe total fees earned during the first half of 2016.
$1,000
$1,500
$2,000
$2,500
$3,000
Industry % Change from Last Quarter 43.7% ▲ 7.0% 19.8% ▲▲Industry % Change from Same Period Last Year 15.4% ▲ 22.2% 25.8% ▲▲
Industry Total 46,262.4 100.0 616373.2 51.9
+112 718.5 100.0
▲Top Twenty Total 28,752.5 62.2
0.6 +1 ▲ 2.3 0.3 +0.1+1.2 ▲
JM Financial Group 20 69 548.6 1.2 +1.0 ▲ 49 1.5 -3 ▼ 16.0 2.2
2.3 -0.6 ▼CIMB Group Holdings Bhd 19 25 561.9 1.2 +0.4 ▲
▲ 11 1.8 +8 ▲ 16.7DBS Group Holdings 18 26 703.3 1.5 +0.8-1 ▼ 7.2 1.0 -0.3 ▼
▼ICICI Bank Ltd 17 14 707.1 1.5 -0.2 ▼ 9 1.5
1.3 +2 ▲ 10.3 1.4 -0.6+0.4 ▲
HSBC Holdings PLC 16 16 714.0 1.5 -0.1 ▼ 811 1.8 +5 ▲ 12.6 1.8
0.5 +0.3 ▲China Construction Bank 15 17 751.2 1.6 +0.2 ▲
▲ 4 0.6 +1 ▲ 3.5IIFL Holdings Ltd 14 74 782.8 1.7 +1.5-9 ▼ 9.0 1.3 -3.5 ▼
▼JP Morgan 13 4 814.3 1.8 -2.6 ▼ 5 0.8
2.3 -3 ▼ 16.3 2.3 -1.90.0 -
Haitong Securities Co Ltd 12 7 840.2 1.8 -1.3 ▼ 1411 1.8 +1 ▲ 9.1 1.3
2.3 +0.7 ▲Korea Investment Holdings Co 11 10 1,020.4 2.2 +0.3 ▲
▲ 9 1.5 +3 ▲ 16.8CITIC 10 18 1,022.0 2.2 +0.8-4 ▼ 21.8 3.0 +0.9 ▲
▼Credit Suisse 9 8 1,160.5 2.5 -0.4 ▼ 10 1.6
1.5 -1 ▼ 15.5 2.2 -2.6+1.8 ▲
Deutsche Bank 8 2 1,316.7 2.9 -7.2 ▼ 913 2.1 +5 ▲ 22.9 3.2
1.7 +1.3 ▲UBS 7 9 1,544.6 3.3 +1.3 ▲
▲ 6 1.0 +1 ▲ 12.3Kotak Mahindra Bank Ltd 6 33 1,740.6 3.8 +3.30 - 28.8 4.0 -0.6 ▼
▲Citi 5 3 2,078.7 4.5 -0.7 ▼ 15 2.4
2.1 +7 ▲ 35.2 4.9 +3.2+0.4 ▲
Bank of America Merrill Lynch 4 15 2,179.5 4.7 +3.1 ▲ 1313 2.1 +3 ▲ 17.5 2.4
6.9 -5.9 ▼NH Investment & Securities Co 3 6 2,772.6 6.0 +2.6 ▲
▼ 20 3.2 -3 ▼ 49.549.9 7.0 +2.7 ▲
Morgan Stanley 2 1 3,195.5 6.9 -10.9+5.1 ▲ 18 2.9 +7 ▲
Sh. (%) # of Deals Fees Sh. (%) Share Ch.Goldman Sachs & Co 1 5 4,298.0 9.3
Market Change in Manager Market MarketBookrunner Proceeds Sh. (%) Share Ch. Deals
2017 Rank
2016 Rank
Market Market # of
Asia Equity & Equity-Related, ex Chinese A-shares (C1ba) Jan 1 - Jun 30 Top 10 Asia Equity & Equity-Related Deals (US$Bil) Jan 1 - Jun 30
Proceeds per Bookrunner (US$m) # of Deals per Bookrunner Imputed Fees (US$m)
Industry % Change from Last Quarter -9.3% ▼ -7.8% -16.3% ▼▼Industry % Change from Same Period Last Year 4.5% ▲ 32.1% 60.6% ▲▲
Industry Total 89,403.3 100.0 9291,171.8 54.6
+226 2,144.5 100.0
▼Top Twenty Total 53,861.8 60.2
1.1 -7 ▼ 21.8 1.0 -0.2+0.3 ▲
Credit Suisse 20 13 1,160.5 1.3 -0.9 ▼ 105 0.5 +2 ▲ 19.0 0.9
2.0 +0.1 ▲Tianfeng Securities Co Ltd 19 52 1,203.1 1.4 +1.1 ▲
▼ 12 1.3 +2 ▲ 43.2Huatai Securities Co Ltd 18 10 1,212.8 1.4 -1.3+13 ▲ 60.3 2.8 +1.0 ▲
▲China Merchants Securities Co 17 28 1,634.3 1.8 +1.0 ▲ 21 2.3
2.0 +10 ▲ 87.7 4.1 +1.8+0.4 ▲
Guosen Securities Co Ltd 16 17 1,702.0 1.9 +0.1 ▲ 196 0.6 +1 ▲ 12.3 0.6
3.4 -0.3 ▼Kotak Mahindra Bank Ltd 15 56 1,740.6 2.0 +1.7 ▲
▼ 13 1.4 +3 ▲ 73.8Essence Securities Co Ltd 14 9 1,791.0 2.0 -1.1
$0
$500
2008 2009 2010 2011 2012 2013 2014 2015 2016 2017
China Hong Kong Malaysia Singapore Taiwan Rest of Asia
$4.3
$2.3
$2.3
$2.2
$2.2
$1.7
$1.6
$1.6
$1.2
$1.2
03/14/17
04/21/17
06/06/17
03/28/17
01/12/17
04/18/17
03/02/17
06/12/17
01/24/17
06/13/17
China Everbright Bank Co Ltd
Netmarble Games Corp
State Bank of India
Guotai Junan Securities Co Ltd
SAIC Motor Corp Ltd
Power Constr Corp of China Ltd
Air China Ltd
Hyundai Robotics Co Ltd
Banco De Oro Unibank Inc
Hong Kong Intl Constr Invest
*tie
Visit http://dmi.thomsonreuters.com to view archives and order custom League Tables https://www.thomsonone.com
12

▲ 97 0% 145 4% ▲
+230 1,382.9 100.0
Industry % Change from Same Period Last Year 12 4% ▲ 39 4% 72 8%
818.2 59.216,839.6 55.530,333.2 100.0 467
54.9 Top Twenty Total100.0 Industry Total
1,146.3888 +251 2,087.4
Top Twenty Total 49,106.2 60.0Industry Total 81,862.5 100.0
+10 ▲ 36.1 2.6 +2.0 ▲457.6 1.5 +1.3 ▲ 11 2.41.0 -0.2 ▼ Industrial Securities Co Ltd 20 77▼ 10 1.1 -6 ▼ 21.8Credit Suisse 20 13 1,160.5 1.4 -1.0+1 ▲ 3.5 0.3 +0.3 ▲469.5 1.6 +1.6 ▲ 1 0.20.9 +0.2 ▲ SK Securities Co Ltd 19 -▲ 5 0.6 +2 ▲ 19.0Tianfeng Securities Co Ltd 19 51 1,203.1 1.5 +1.1+8 ▲ 28.1 2.0 +2.0 ▲478.1 1.6 +1.6 ▲ 8 1.72.1 -0.1 ▼ Soochow Securities Co Ltd 18 -▼ 12 1.4 +2 ▲ 43.2Huatai Securities Co Ltd 18 9 1,212.8 1.5 -1.7+4 ▲ 11.3 0.8 +0.2 ▲478.8 1.6 +1.4 ▲ 5 1.12.9 +1.0 ▲ Dongxing Securities 17 81▲ 21 2.4 +13 ▲ 60.3China Merchants Securities Co 17 27 1,634.3 2.0 +1.1+3 ▲ 6.4 0.5 0.0 -561.5 1.9 +1.4 ▲ 6 1.34.2 +1.8 ▲ Korea Investment Holdings Co 16 46▲ 19 2.1 +11 ▲ 87.7Guosen Securities Co Ltd 16 16 1,702.0 2.1 +0.2+8 ▲ 34.0 2.5 +2.5 ▲590.0 1.9 +1.9 ▲ 8 1.70.6 +0.4 ▲ Shenwan Hongyuan Securities Co 15 -▲ 6 0.7 +1 ▲ 12.3Kotak Mahindra Bank Ltd 15 54 1,740.6 2.1 +1.8-2 ▼ 11.5 0.8 -2.1 ▼608.1 2.0 +0.1 ▲ 3 0.62.0 0.0 - JP Morgan 14 17▼ 15 1.7 +1 ▲ 41.3Deutsche Bank 14 12 1,780.1 2.2 -0.3-1 ▼ 22.0 1.6 -1.9 ▼610.4 2.0 -1.2 ▼ 6 1.33.5 -0.6 ▼ Morgan Stanley 13 7▼ 13 1.5 +3 ▲ 73.8Essence Securities Co Ltd 13 7 1,791.0 2.2 -1.4
+5 ▲ 9.4 0.7 +0.4 ▲686.2 2.3 +1.7 ▲ 8 1.71.7 +0.9 ▲ NH Investment & Securities Co 12 44▲ 13 1.5 +8 ▲ 35.2Bank of America Merrill Lynch 12 29 2,179.5 2.7 +1.9+15 ▲ 63.0 4.6 +3.8 ▲838.0 2.8 +2.4 ▲ 16 3.41.4 +0.5 ▲ Sinolink Securities Co Ltd 11 60*▲ 16 1.8 +9 ▲ 29.0UBS 11 23 2,292.9 2.8 +1.8+7 ▲ 43.7 3.2 -0.8 ▼926.1 3.1 +0.2 ▲ 14 3.04.7 +2.0 ▲ Guotai Junan Securities 10 9▲ 33 3.7 +14 ▲ 97.9Haitong Securities Co Ltd 10 10 2,425.7 3.0 +0.1+7 ▲ 60.2 4.4 -0.4 ▼929.6 3.1 -0.8 ▼ 11 2.45.5 +1.0 ▲ Essence Securities Co Ltd 9 4▼ 31 3.5 +13 ▲ 115.6GF Securities 9 6 2,446.9 3.0 -0.6+7 ▲ 54.5 3.9 +1.4 ▲949.0 3.1 0.0 - 12 2.62.3 +0.7 ▲ China Securities Co Ltd 8 8▼ 17 1.9 +9 ▲ 47.1China International Capital Co 8 8 2,486.3 3.0 -0.4+9 ▲ 46.6 3.4 0.0 -952.9 3.1 +0.8 ▲ 14 3.00.8 -0.1 ▼ China Merchants Securities Co 7 13▲ 13 1.5 +3 ▲ 17.5NH Investment & Securities Co 7 18 2,772.6 3.4 +1.5+10 ▲ 56.8 4.1 -0.1 ▼1,000.2 3.3 -0.4 ▼ 17 3.63.2 +0.3 ▲ CITIC 6 5▼ 22 2.5 +5 ▲ 66.4Citi 6 5 2,841.0 3.5 -0.2+13 ▲ 73.3 5.3 +3.3 ▲1,050.8 3.5 +2.3 ▲ 15 3.22.4 -2.9 ▼ Guosen Securities Co Ltd 5 26▼ 21 2.4 -4 ▼ 50.6Morgan Stanley 5 2 3,369.9 4.1 -2.1+9 ▲ 34.4 2.5 +1.6 ▲1,070.9 3.5 +1.5 ▲ 12 2.63.7 -0.5 ▼ China International Capital Co 4 15▲ 26 2.9 +3 ▲ 76.5Guotai Junan Securities 4 4 3,425.8 4.2 +0.1+15 ▲ 76.3 5.5 +3.5 ▲1,247.8 4.1 +0.1 ▲ 25 5.44.4 -3.3 ▼ Haitong Securities Co Ltd 3 3▼ 26 2.9 +2 ▲ 91.8CITIC 3 1 3,614.2 4.4 -6.4+7 ▲ 43.2 3.1 +0.2 ▲1,286.2 4.2 +0.1 ▲ 13 2.84.6 +2.4 ▲ Citi 2 2▲ 21 2.4 +9 ▲ 96.9China Securities Co Ltd 2 15 3,667.9 4.5 +2.4+16 ▲ 103.9 7.5 +2.2 ▲1,647.9 5.4 +2.7 ▲ 24 5.13.0 +1.2 ▲ GF Securities 1 12▲ 21 2.4 +9 ▲ 62.4# of Deals Fees Sh. (%) Share Ch.
Goldman Sachs & Co 1 11 5,359.1 6.6 +4.1Bookrunner Proceeds Sh. (%) Share Ch. Deals Sh. (%)
2016 Rank
Market Market Change in Manager Market MarketBookrunner Proceeds Sh. (%) Share Ch. Deals Sh. (%)
# of MarketMarket Change in Manager Market Market 2017 Rank# of Deals Fees Sh. (%) Share Ch.
2017 Rank
2016 Rank
Market Market # of
Asia Common stock, inc Chinese A-shares (C4a) Jan 1 - Jun 30 Asia IPOs, inc Chinese A-shares (C7a) Jan 1 - Jun 30
Proceeds per Bookrunner (US$m) # of Deals per Bookrunner Imputed Fees (US$m) Proceeds per Bookrunner (US$m) # of Deals per Bookrunner Imputed Fees (US$m)
First Half 2017 | Equity Capital Markets | Managing Underwriters
Asia (ex-Japan, ex-Australia) Equity Capital Markets
▲ ▲▲ Industry % Change from Same Period Last Year 69 1%
*tie41.2% -6.4% ▼
▼Industry % Change from Last Quarter -16.2% ▼ -10.7% -27.1% ▼ Industry % Change from Last Quarter -61.1% ▼
▲ Industry % Change from Same Period Last Year -40.8% ▼ -37.9% -55.2%
-25 57.1 100.0
Industry % Change from Same Period Last Year -6.1% ▼ 5.3% 9.3%
54.1 94.77,370.1 97.77,540.8 100.0 41
62.3 Top Twenty Total100.0 Industry Total
439.0421 +21 704.5
Top Twenty Total 35,111.0 68.1Industry Total 51,529.3 100.0
+1 ▲ .9 1.6 +1.6 ▲37.5 0.5 +0.5 ▲ 1 2.41.9 +1.3 ▲ Barclays 20 -▲ 7 1.7 +4 ▲ 13.6China Merchants Securities Co 20 39 681.4 1.3 +0.90 - .5 0.8 -0.6 ▼45.1 0.6 -0.4 ▼ 1 2.41.4 +0.9 ▲ GF Securities 19 14*▲ 7 1.7 +5 ▲ 9.9HSBC Holdings PLC 19 42 695.9 1.4 +1.0-1 ▼ 1.3 2.4 -12.2 ▼49.4 0.7 -25.9 ▼ 1 2.41.9 +0.3 ▲ Deutsche Bank 18 2▼ 5 1.2 -7 ▼ 13.5Credit Suisse 18 10 782.3 1.5 -1.3
+2 ▲ .7 1.2 +0.5 ▲53.4 0.7 +0.3 ▲ 6 14.61.7 -2.2 ▼ Taishin Finl Hldg Co Ltd 17 31▼ 7 1.7 -3 ▼ 11.7GF Securities 17 5 799.0 1.6 -2.3+1 ▲ 1.3 2.3 +2.3 ▲69.2 0.9 +0.9 ▲ 1 2.41.9 -1.7 ▼ Shenwan Hongyuan (H.K.) Ltd 16 -▼ 2 0.5 -4 ▼ 13.6Essence Securities Co Ltd 16 8 861.5 1.7 -1.8+1 ▲ 1.3 2.2 +2.2 ▲104.2 1.4 +1.4 ▲ 1 2.42.9 +0.2 ▲ Pacific Securities 15 -▼ 4 1.0 -2 ▼ 20.2Huatai Securities Co Ltd 15 9 904.4 1.8 -1.3+1 ▲ 2.1 3.6 +3.6 ▲113.0 1.5 +1.5 ▲ 1 2.42.3 +1.9 ▲ Hongta Securities Co Ltd 14 -▲ 4 1.0 +3 ▲ 16.1Tianfeng Securities Co Ltd 14 46 1,171.1 2.3 +2.0+1 ▲ 1.9 3.4 +3.4 ▲119.5 1.6 +1.6 ▲ 1 2.43.1 -0.2 ▼ CSC Financial Co Ltd 13 -▼ 8 1.9 -1 ▼ 21.7Haitong Securities Co Ltd 13 12 1,178.0 2.3 -0.2+1 ▲ 3.1 5.5 +4.0 ▲167.3 2.2 +1.4 ▲ 2 4.91.0 -1.4 ▼ Citi 12 21▼ 7 1.7 -3 ▼ 6.8Deutsche Bank 12 11 1,327.2 2.6 -0.1+2 ▲ 5.2 9.1 +9.1 ▲227.2 3.0 +3.0 ▲ 2 4.91.8 -0.4 ▼ Bank of China Ltd 11 -▼ 5 1.2 0 - 12.7China International Capital Co 11 6 1,415.4 2.8 -1.1+1 ▲ 3.4 6.0 +5.6 ▲248.1 3.3 +2.8 ▲ 4 9.83.3 +0.3 ▲ Yuanta Financial Hldg Co Ltd 10 26▼ 9 2.1 -2 ▼ 23.2Citi 10 7 1,554.8 3.0 -0.5+2 ▲ 5.6 9.9 +9.9 ▲264.1 3.5 +3.5 ▲ 2 4.91.5 +1.4 ▲ DBS Group Holdings 9 -▲ 4 1.0 +3 ▲ 10.8Kotak Mahindra Bank Ltd 9 77 1,681.8 3.3 +3.20 - 4.2 7.3 +6.2 ▲308.1 4.1 +3.1 ▲ 5 12.24.1 +3.0 ▲ KGI Financial Services Group 8 13▲ 10 2.4 +6 ▲ 28.9Bank of America Merrill Lynch 8 26 1,922.7 3.7 +2.80 - .4 0.7 +0.5 ▲346.8 4.6 +4.1 ▲ 2 4.91.2 -0.2 ▼ Fubon Financial Holding Co Ltd 7 28▲ 5 1.2 -2 ▼ 8.1NH Investment & Securities Co 7 14 2,086.4 4.1 +1.80 - 1.8 3.2 -0.9 ▼723.3 9.6 +8.6 ▲ 1 2.44.1 +3.4 ▲ Goldman Sachs & Co 4* 16*▲ 16 3.8 +12 ▲ 29.0UBS 6 25 2,292.9 4.5 +3.6-3 ▼ 1.8 3.2 -15.9 ▼723.3 9.6 -19.5 ▼ 1 2.44.7 +0.2 ▲ Morgan Stanley 4* 1▲ 12 2.9 -4 ▼ 32.8Guotai Junan Securities 5 4 2,499.7 4.9 +0.4
+1 ▲ 1.8 3.2 +3.2 ▲723.3 9.6 +9.6 ▲ 1 2.45.0 -5.8 ▼ Everbright Securities Co Ltd 4* -▼ 9 2.1 -8 ▼ 35.0CITIC 4 1 2,614.0 5.1 -8.0-2 ▼ 4.0 7.0 +3.4 ▲853.1 11.3 +7.3 ▲ 2 4.96.0 +4.0 ▲ China International Capital Co 3 5▲ 9 2.1 +2 ▲ 42.3China Securities Co Ltd 3 19 2,718.9 5.3 +3.6-1 ▼ 5.0 8.8 +6.7 ▲889.9 11.8 +9.3 ▲ 2 4.94.1 -2.7 ▼ UBS 2 6▼ 15 3.6 -3 ▼ 28.6Morgan Stanley 2 2 2,759.5 5.4 -1.8
+1 ▲ 7.8 13.6 +11.5 ▲1,304.3 17.3 +16.3 ▲ 2 4.98.6 +7.4 ▲ CITIC 1 16*▲ 20 4.8 +12 ▲ 60.5# of Deals Fees Sh. (%) Share Ch.
Goldman Sachs & Co 1 13 5,164.1 10.0 +7.6Proceeds Sh. (%) Share Ch. Deals Sh. (%)
2016 Rank
Market Market Market Change in Manager Market MarketBookrunner Proceeds Sh. (%) Share Ch. Deals Sh. (%)
Market Change in Manager Market Market 2017 Rank# of Deals Fees Bookrunner
Imputed Fees (US$m)
Sh. (%) Share Ch.2017 Rank
2016 Rank
Market Market # of # of
Asia Secondary Offerings, inc Chinese A-shares (C8c) Jan 1 - Jun 30 Asia Convertibles, inc Chinese A-shares (C9b) Jan 1 - Jun 30
▼
Proceeds per Bookrunner (US$m) # of Deals per Bookrunner Imputed Fees (US$m) Proceeds per Bookrunner (US$m) # of Deals per Bookrunner
Industry % Change from Last Quarter 25.9% ▲ -8.6% -10.7% ▼▲ 97.0% 145.4% ▲
Industry % Change from Last Quarter -2.5% ▼ -9.6% -16.6% ▼Industry % Change from Same Period Last Year 12.4% ▲ 39.4% 72.8%▲
▲▼
▲▼
▼▲
▲ Industry % Change from Same Period Last Year 69.1%
https://www.thomsonone.comVisit http://dmi.thomsonreuters.com to view archives and order custom League Tables
13

Imputed Fees (AU$m)2017 Rank
2016 Rank Share Ch. # of Deals
Australian ECM Drops 12% | Follow-On Offerings Capture 87% of the Market | Financials Top Sector
Australia Deal Intelligence
Proceeds raised from Australian Equity and Equity-Related offerings during thefirst half of 2017 totaled AU$9.2 billion from 281 deals, a 12.1% decrease from thefirst half of 2016. Issuance from Financials, Industrials and Real Estate sectorscaptured 25.1%, 19% and 14.2% of the market, respectively.
According to estimates by Thomson Reuters, total fees in the region for the firsthalf of 2017 totaled AU$259.4 million, a 13.6% decrease, compared to feesearned during the same period last year. Macquarie Group, the top fee earner forAustralian offerings, captured 17.8% of the total wallet share.
Australian IPO and Follow-on proceeds during the first half of 2017 registered a51.8% and 4.6% decline respectively, compared to the first half of 2016. BingoIndustries Ltd’s AU$439.6 million IPO was the largest Australian IPO during the firsthalf of 2017.
Australian Equity & Equity-Related (AK1) Jan 1 - Jun 30 Australian ECM Proceeds by Industry (AU$Mil) Jan 1 - Jun 30
+1 0 ▲3 1 1 +3 ▲ 3 4 1 32.6 -0.1 ▼
Commonwealth Bank of Australia 14 - 153 6 1 7 +1 7 ▲▲ 13 4.6 -6 ▼ 6.8Hartleys Ltd 13 15 166.6 1.8 +0.4
0 - 8.6 3.3 +2.5 ▲▼
Argonaut Ltd 12 27 195.9 2.1 +1.7 ▲ 8 2.81.4 -1 ▼ 5.1 2.0 -1.0
-1.1 ▼Ord Minnett Ltd 11 16 206.6 2.3 +1.1 ▲ 4
16 5.7 -3 ▼ 6.9 2.74.0 +2.2 ▲
Taylor Collison Ltd 10 9 243.9 2.7 -0.1 ▼▲ 11 3.9 +2 ▲ 10.4Euroz Securities Ltd 9 18 261.0 2.9 +2.0
-2 ▼ 11.7 4.5 -1.2 ▼▼
Canaccord Genuity 8 8 282.5 3.1 -0.5 ▼ 13 4.67.8 -6 ▼ 11.2 4.3 -2.2
-1.4 ▼Bell Financial Group Ltd 7 7 287.7 3.1 -0.7 ▼ 22
18 6.4 +2 ▲ 12.4 4.85.0 -0.5 ▼
Morgans Financial Ltd 6 6 338.0 3.7 -0.3 ▼▼ 1 0.4 -3 ▼ 12.9JP Morgan 4* 4 441.5 4.8 -5.4
-1 ▼ 6.9 2.6 +1.1 ▲▲
Citi 4* 14 441.5 4.8 +3.2 ▲ 1 0.41.4 +2 ▲ 12.7 4.9 +3.1
+2.8 ▲Goldman Sachs & Co 3 13 679.7 7.4 +5.7 ▲ 4
10 3.6 -4 ▼ 42.2 16.317.8 +4.9 ▲
UBS 2 1 1,776.9 19.4 +2.6 ▲▲ 10 3.6 -4 ▼ 46.2Macquarie Group 1 2 2,285.4 24.9 +8.5
MarketBookrunner Proceeds Sh. (%) Sh. (%) Share Ch.Deals Sh. (%) Fees
Australia Equity Capital Markets
Market Market # of Market Change in Manager
First Half 2017 | Equity Capital Markets | Managing Underwriters
MarketProceeds per Bookrunner (AU$m) # of Deals per Bookrunner
$2,300.3 25%
$1,729.1 19%
$1,299.5 14%
$1,048.0 12%
$1,038.7 11%
$551.3 6%
$428.6 5%
$254.5 3%
$145.7 2%
$104.2 1%
-27 259.0 100.0
Industry % Change from Last Quarter 106.2% ▲
Imputed Fees (AU$m)2017 Rank
2016 Rank Share Ch. # of Deals
▼ -8.8%
9,149.0
Proceeds per Bookrunner (AU$m) # of Deals per Bookrunner
-9.2
24.6% 85.9% ▲
84.8
Industry % Change from Same Period Last Year -8.7%
▲
▲
100.0 279
▼0.8-8
Industry Total
Top 10 Australian Equity & Equity-Related Deals (AU$Mil) Jan 1 - Jun 30
Industry % Change from Last Quarter 105.3% ▲ 24.4% 85.3% ▲
-2784.7
Australian Common Stock (AK2) Jan 1 - Jun 30
259.4 100.0Industry Total 9,162.8 100.0 281
Top Twenty Total 8,321.3 91.02 0.7▼
-12.8% ▼▼
219.7Credit Suisse 50.1 0.6 -13.420 3
2.4 0.9 +0.5 ▲▼
▲ 5 1.82.0
▲+3 ▲
2.6▲ 3Blue Ocean Equities Pty Ltd 19 27 60.5 0.7 +0.4
1.0 +0.9-0.5 ▼
Viel & Cie Finances 18 53* 69.2 0.8 +0.727 9.7 -3▲
1.1 +2▼ 5.0 1.9
2.0 +0.9 ▲Patersons Securities Ltd 17 15 114.1 1.3 +0.1
▲ 5 1.8 -2 ▼ 5.25.1 2.0 +0.7 ▲
Petra Capital Pty Ltd 16 19 128.4 1.4 +0.6Wilson HTM 15 18 138.2 1.5 +0.7 ▲ 6 2.2
1.1 +3 ▲0 -
+1.0-0.2 ▼
Commonwealth Bank of Australia 14 - 153.6 1.7+0.3 ▼
▲
+1.7 ▲ 313 4.7 -6▲
3.4 1.36.8 2.6
3.3 +2.58 2.9 0 - 8.6Hartleys Ltd 13 13 166.6 1.8
2.04 1.4 -1 ▼ -1.0 ▼Argonaut Ltd 12 25 195.9 2.1 +1.6 ▲
▲ 5.1Ord Minnett Ltd 11 14 206.6 2.3 +1.1-3 ▼ 6.9 2.7 -1.1 ▼
▲Taylor Collison Ltd 10 9 243.9 2.7 -0.2 ▼ 16 5.7
3.9 +2 ▲ 10.4 4.0 +2.2-1.3 ▼
Euroz Securities Ltd 9 16 261.0 2.9 +1.9 ▲ 1113 4.7 -2 ▼ 11.7 4.5
4.3 -2.3 ▼Canaccord Genuity 8 8 282.5 3.1 -0.7 ▼
▼ 22 7.9 -6 ▼ 11.2Bell Financial Group Ltd 7 7 287.7 3.1 -0.9+2 ▲ 12.4 4.8 -1.5 ▼
▼Morgans Financial Ltd 6 6 338.0 3.7 -0.5 ▼ 18 6.5
0.4 -3 ▼ 12.9 5.0 -0.6+1.1 ▲
JP Morgan 4* 4 441.5 4.8 -5.9 ▼ 11 0.4 -1 ▼ 6.9 2.7
4.9 +3.1 ▲Citi 4* 12 441.5 4.8 +3.1 ▲
▲ 4 1.4 +2 ▲ 12.742.2 16.3 +2.6 ▲
Goldman Sachs & Co 3 11 679.7 7.4 +5.7+1.9 ▲ 10 3.6 -4 ▼
▼ 46.2 17.9 +5.0 ▲UBS 2 1 1,776.9 19.4
▲Deals Sh. (%)
10 3.6 -4Macquarie Group 1 2 2,285.4 25.0 +7.9
Market MarketBookrunner Proceeds Sh. (%)
MarketSh. (%) Share Ch.
Market # of MarketFees
Change in Manager
▼0.8 -9.1219.7
+0.5
Industry % Change from Same Period Last Year -12.1% ▼ -8.8% -13.6% ▼
-8 2.0▼▼5 1.8
Top Twenty Total 8,321.3 90.82 0.7
0.91.0 +0.9
▲Credit Suisse 50.1 0.6 -12.820 3
▲▲ 3
+3 ▲ 2.4Blue Ocean Equities Pty Ltd 19 29 60.5 0.7 +0.4Viel & Cie Finances 18 55* 69.2 0.8 +0.7
1.9 -0.5 ▼1.1 +2 ▲ 2.6 ▲
▲ 27 9.6 -3 ▼ 5.0Patersons Securities Ltd 17 17 114.1 1.2 +0.1-2 ▼ 5.2 2.0 +0.9 ▲
▲Petra Capital Pty Ltd 16 21 128.4 1.4 +0.6 ▲ 5 1.8
2.1 0 - 5.1 2.0 +0.7+1.0 ▲
Wilson HTM 15 20 138.2 1.5 +0.7 ▲ 63 1.1 +3 ▲ 3.4 1.3Commonwealth Bank of Australia 14 - 153.6 1.7 +1.7 ▲
▲▼
▲
$1,007.5
$883.0
$645.0
$500.0
$439.6
$355.0
$350.0
$325.9
$275.0
$214.7
04/11/17
06/27/17
05/25/17
06/22/17
05/02/17
02/24/17
06/09/17
04/21/17
05/04/17
06/23/17
Downer EDI Ltd
Link Administration Hldg Ltd
BT Investment Management Ltd
DEXUS
Bingo Industries Ltd
MYOB Group Ltd
Qube Holdings Ltd
Plato Income Maximiser Ltd
Charter Hall Group
Aventus Retail Property Fund
Financials Industrials Real Estate Materials
Energy and Power High Technology Healthcare Consumer Products and Services
Telecommunications Consumer Staples Retail
https://www.thomsonone.com
*tie
Visit http://dmi.thomsonreuters.com to view archives and order custom League Tables
14
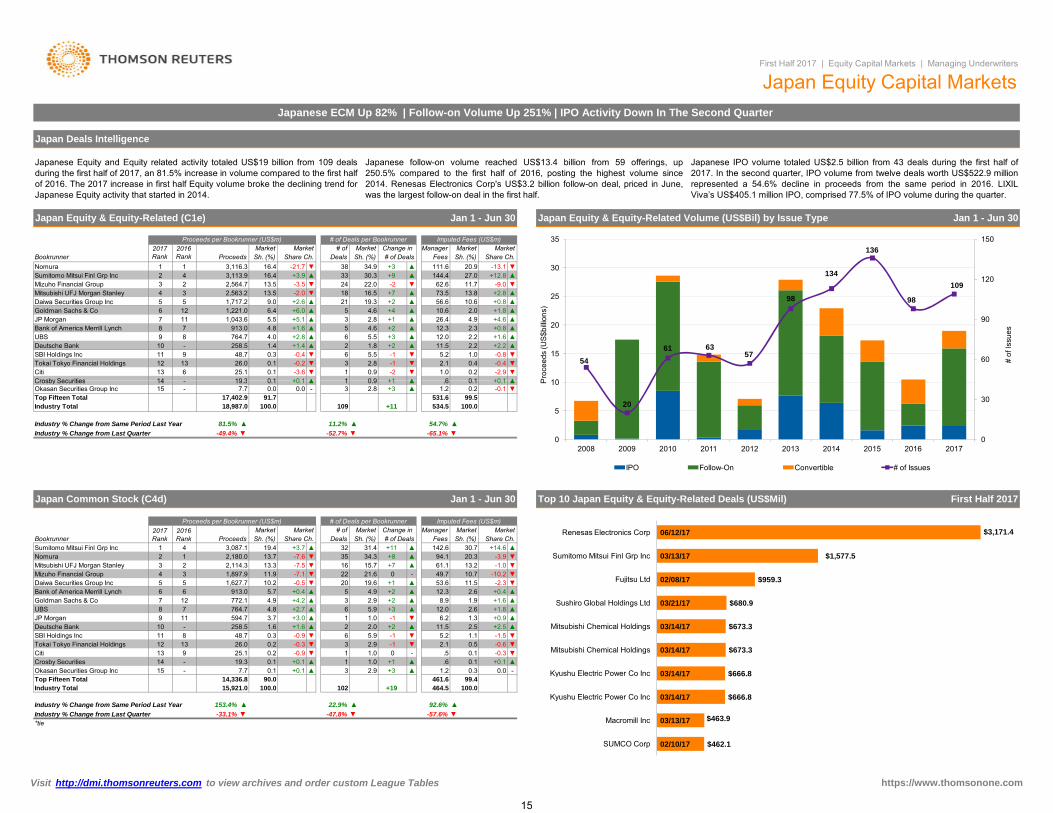
nc
0 1 +0 1 ▲+1 ▲ 6Crosby Securities 14 19 3 0 1 +0 1 ▲ 1 0 9-2 ▼ 1.0 0.2 -2.9 ▼
▼Citi 13 6 25.1 0.1 -3.6 ▼ 1 0.9
2.8 -1 ▼ 2.1 0.4 -0.4-0.8 ▼
Tokai Tokyo Financial Holdings 12 13 26.0 0.1 -0.2 ▼ 36 5.5 -1 ▼ 5.2 1.0
2.2 +2.2 ▲SBI Holdings Inc 11 9 48.7 0.3 -0.4 ▼
▲ 2 1.8 +2 ▲ 11.5Deutsche Bank 10 - 258.5 1.4 +1.4+3 ▲ 12.0 2.2 +1.6 ▲
▲UBS 9 8 764.7 4.0 +2.8 ▲ 6 5.5
4.6 +2 ▲ 12.3 2.3 +0.8+4.6 ▲
Bank of America Merrill Lynch 8 7 913.0 4.8 +1.6 ▲ 53 2.8 +1 ▲ 26.4 4.9
2.0 +1.8 ▲JP Morgan 7 11 1,043.6 5.5 +5.1 ▲
▲ 5 4.6 +4 ▲ 10.6Goldman Sachs & Co 6 12 1,221.0 6.4 +6.0+2 ▲ 56.6 10.6 +0.8 ▲
▲Daiwa Securities Group Inc 5 5 1,717.2 9.0 +2.6 ▲ 21 19.3
16.5 +7 ▲ 73.5 13.8 +2.8-9.0 ▼
Mitsubishi UFJ Morgan Stanley 4 3 2,563.2 13.5 -2.0 ▼ 1824 22.0 -2 ▼ 62.6 11.7
27.0 +12.8 ▲Mizuho Financial Group 3 2 2,564.7 13.5 -3.5 ▼
▲ 33 30.3 +9 ▲ 144.4111.6 20.9 -13.1 ▼
Sumitomo Mitsui Finl Grp Inc 2 4 3,113.9 16.4 +3.9-21.7 ▼ 38 34.9 +3 ▲
Sh. (%) # of Deals Fees Sh. (%) Share Ch.Nomura 1 1 3,116.3 16.4
Market Change in Manager Market MarketBookrunner Proceeds Sh. (%) Share Ch. Deals
2017 Rank
2016 Rank
Market Market # of
Jan 1 - Jun 30 Japan Equity & Equity-Related Volume (US$Bil) by Issue Type Jan 1 - Jun 30
Proceeds per Bookrunner (US$m) # of Deals per Bookrunner Imputed Fees (US$m)
First Half 2017 | Equity Capital Markets | Managing Underwriters
Japan Equity Capital MarketsJapanese ECM Up 82% | Follow-on Volume Up 251% | IPO Activity Down In The Second Quarter
Japan Deals Intelligence
Japanese Equity and Equity related activity totaled US$19 billion from 109 dealsduring the first half of 2017, an 81.5% increase in volume compared to the first halfof 2016. The 2017 increase in first half Equity volume broke the declining trend forJapanese Equity activity that started in 2014.
Japanese follow-on volume reached US$13.4 billion from 59 offerings, up250.5% compared to the first half of 2016, posting the highest volume since2014. Renesas Electronics Corp's US$3.2 billion follow-on deal, priced in June,was the largest follow-on deal in the first half.
Japanese IPO volume totaled US$2.5 billion from 43 deals during the first half of2017. In the second quarter, IPO volume from twelve deals worth US$522.9 millionrepresented a 54.6% decline in proceeds from the same period in 2016. LIXILViva’s US$405.1 million IPO, comprised 77.5% of IPO volume during the quarter.
Japan Equity & Equity-Related (C1e)
5461 63
57
98
134
136
98
109
60
90
120
150
10
15
20
25
30
35
# of
Issu
es
Pro
ceed
s (U
S$b
illion
s)
Industry % Change from Last Quarter -33.1% ▼ ▼-47.8% -57.6%*tie
▲ ▲
+19 464.5 100.0
▼
Top Fifteen Total 14,336.8 90.0
Industry % Change from Same Period Last Year 22.9% 92.6%▲
Industry Total 15,921.0 100.0 102
153.4%
0.0 -461.6 99.4
3 2.9 +3 ▲ 1.2 0.30.1 +0.1 ▲
Okasan Securities Group Inc 15 - 7.7 0.1 +0.1 ▲▲ 1 1.0 +1 ▲ .6Crosby Securities 14 - 19.3 0.1 +0.1
0 - .5 0.1 -0.3 ▼▼
Citi 13 9 25.1 0.2 -0.9 ▼ 1 1.02.9 -1 ▼ 2.1 0.5 -0.6
-1.5 ▼Tokai Tokyo Financial Holdings 12 13 26.0 0.2 -0.3 ▼ 3
6 5.9 -1 ▼ 5.2 1.12.5 +2.5 ▲
SBI Holdings Inc 11 8 48.7 0.3 -0.9 ▼▲ 2 2.0 +2 ▲ 11.5Deutsche Bank 10 - 258.5 1.6 +1.6
-1 ▼ 6.2 1.3 +0.9 ▲▲
JP Morgan 9 11 594.7 3.7 +3.0 ▲ 1 1.05.9 +3 ▲ 12.0 2.6 +1.8
+1.6 ▲UBS 8 7 764.7 4.8 +2.7 ▲ 6
3 2.9 +2 ▲ 8.9 1.92.6 +0.4 ▲
Goldman Sachs & Co 7 12 772.1 4.9 +4.2 ▲▲ 5 4.9 +2 ▲ 12.3Bank of America Merrill Lynch 6 6 913.0 5.7 +0.4
+1 ▲ 53.6 11.5 -2.3 ▼▼
Daiwa Securities Group Inc 5 5 1,627.7 10.2 -0.5 ▼ 20 19.621.6 0 - 49.7 10.7 -10.2
-1.0 ▼Mizuho Financial Group 4 3 1,897.9 11.9 -7.1 ▼ 22
16 15.7 +7 ▲ 61.1 13.220.3 -3.9 ▼
Mitsubishi UFJ Morgan Stanley 3 2 2,114.3 13.3 -7.5 ▼▼ 35 34.3 +8 ▲ 94.1Nomura 2 1 2,180.0 13.7 -7.6
+11 ▲ 142.6 30.7 +14.6 ▲Sh. (%) Share Ch.
Sumitomo Mitsui Finl Grp Inc 1 4 3,087.1 19.4 +3.7 ▲ 32Bookrunner Proceeds Sh. (%) Share Ch. Deals Sh. (%)
2017 Rank
2016 Rank
Market Market # of
Japan Common Stock (C4d) Jan 1 - Jun 30 Top 10 Japan Equity & Equity-Related Deals (US$Mil) First Half 2017
Proceeds per Bookrunner (US$m) # of Deals per Bookrunner Imputed Fees (US$m)
Industry % Change from Last Quarter -49.4% ▼ -52.7% -65.1% ▼▼Industry % Change from Same Period Last Year 81.5% ▲ 11.2% 54.7% ▲▲
531.6 99.5534.5 100.0109
Top Fifteen Total 17,402.9 91.7Industry Total 18,987.0 100.0 +11
Market Change in # of Deals
31.4
1.2 -0.1 ▼
Manager Market MarketFees
0.20.1 +0.1 ▲
Okasan Securities Group Inc 15 - 7.7 0.0 0.0 -+1 ▲
3 2.8 +3 ▲.6Crosby Securities 14 - 19.3 0.1 +0.1 ▲ 1 0.9
20
0
30
0
5
10
2008 2009 2010 2011 2012 2013 2014 2015 2016 2017
P
IPO Follow-On Convertible # of Issues
$3,171.4
$1,577.5
$959.3
$680.9
$673.3
$673.3
$666.8
$666.8
$463.9
$462.1
06/12/17
03/13/17
02/08/17
03/21/17
03/14/17
03/14/17
03/14/17
03/14/17
03/13/17
02/10/17
Renesas Electronics Corp
Sumitomo Mitsui Finl Grp Inc
Fujitsu Ltd
Sushiro Global Holdings Ltd
Mitsubishi Chemical Holdings
Mitsubishi Chemical Holdings
Kyushu Electric Power Co Inc
Kyushu Electric Power Co Inc
Macromill Inc
SUMCO Corp
Visit http://dmi.thomsonreuters.com to view archives and order custom League Tables https://www.thomsonone.com
15

Japan Equity & Equity-Related Proceeds by Industry (US$Bil)
+10.8 ▲
Jan 1 - Jun 30
Proceeds per Bookrunner (US$m) # of Deals per Bookrunner Imputed Fees (US$m)Manager Market Market# of MarketMarket
Japan Secondary Offerings (C8d) Jan 1 - Jun 30
3
▼-61.3% -70.9%Industry % Change from Last Quarter -73.3% ▼▲-2.3% 6.6%Industry % Change from Same Period Last Year 1.5% ▲
100.043 -1 127.398.3
Industry Total 2,484.1 100.0125.1Top Twelve Total 2,484.1 100.0
0.2 +0.1 ▲▲ 1 2.3 +1 ▲ .2Toyo Securities Co Ltd 12 - 2.2 0.1 +0.10.6 +0.4 ▲▲ 2 4.7 +2 ▲ .7Okasan Securities Group Inc 11 - 6.2 0.3 +0.30.9 -0.5 ▼▼ 2 4.7 -1 ▼ 1.1Tokai Tokyo Financial Holdings 10 9 14.2 0.6 -0.40.5 +0.5 ▲▲ 1 2.3 +1 ▲ .6Crosby Securities 9 - 19.3 0.8 +0.83.4 -0.5 ▼▼ 6 14.0 +1 ▲ 4.4SBI Holdings Inc 8 7 48.7 2.0 -0.33.5 +3.3 ▲▲ 2 4.7 +1 ▲ 4.4Bank of America Merrill Lynch 7 6 87.7 3.5 +1.03.0 +3.0 ▲▲ 1 2.3 +1 ▲ 3.8UBS 6 - 121.6 4.9 +4.9
13.3 -0.8 ▼▼ 3 7.0 +1 ▲ 17.0▼ 12.2
Mitsubishi UFJ Morgan Stanley 5 2 282.3 11.4 -11.8Daiwa Securities Group Inc 4Mizuho Financial Group 3 1
9.6 -8.1 ▼▼ 8 18.6 -14 285.3 11.5 -3.3
Sumitomo Mitsui Finl Grp Inc 2 5376.1 15.1 -9.9 -10.4 ▼▼ 7 16.3 -5
114.8431.5 17.4 +9.5
▼ 14.7 11.6+2.8 ▲▲ 6 14.0 -1 ▼ 18.9
Share Ch.47.1 37.0▲ +11.9
Fees Sh. (%)# of Deals▲+6Nomura 809.2 32.6 15 34.9
2017 Rank
2016 Rank
MarketBookrunner Sh. (%)Proceeds Sh. (%) Share Ch. Deals
Japan IPOs (C7d)
Change in
Jan 1 - Jun 30
First Half 2017 | Equity Capital Markets | Managing Underwriters
Japan Equity Capital Markets
▼▼
$5.931%
$2.915%
$2.815%
$1.68%
$1.48%$1.3
7%$1.26%
$0.84%
$0.63%
$0.42% High Technology
Real Estate
Financials
Materials
Retail
Energy and Power
Industrials
Consumer Products and Services
Media and Entertainment
Consumer Staples
Healthcare
Japan IPO Quarterly Volume (US$Bil) and Deal Count
70.0 100.069.4 99.1
+2.4 ▲▲
+14.2 ▲
Share Ch.
+2.3 ▲
Top Seven Total 3,066.0 100.0Industry Total 3,066.0 100.0
+2 ▲
-87
1 14.3 -2
1.7 2.428.9 +28.9+2 ▲ 20.2
Goldman Sachs & Co 3* - 448.9 14.6 +14.614.6 +14.6 ▲ 28.62
2 28.6▲
▼12.9Mitsubishi UFJ Morgan Stanley 3* 3* 448.9 14.6 +7.0 ▲ 28.6
+7.9 -22
▼ 18.4 -1.70 - 17.712.4
▲ 2 28.61 1 ▼2 2 666.8 21.8
▼+2.0 ▲-1.8
Market Market
▼0.1 -1.2
+2 ▲
▼Sh. (%)
24.9 -31.617.4
Jan 1 - Jun 30Japan Convertibles (C9e)
▼
▲ 12 20.3
7 10 +4.7 ▲
Daiwa Securities Group Inc 5 5 1,342.4 10.0 +2.014.0
+2 ▲ 41.3 12.3▼-9.4
-9.5 ▼Nomura 4 1 1,370.8 10.2 -10.8 ▼ 20
15 25.4 +5 ▲ 34.933.9 +2 ▲ 47.1
10.413.1 -1.2 ▼
Mizuho Financial Group 3 4 1,521.8 11.3 -3.9Mitsubishi UFJ Morgan Stanley 2 3 1,832.1 13.6
▼▼ 44.2
123.7 36.7 +16.7 ▲13 22.0 +6 ▲
Share Ch.Sumitomo Mitsui Finl Grp Inc 1 2 2,655.6 19.8 -0.9 ▼ 26
Sh. (%)2017 Rank
2016 Rank
MarketFees
Manager# of Market Change in # of DealsBookrunner Proceeds Sh. (%) Share Ch. Deals
Proceeds per Bookrunner (US$m) # of Deals per Bookrunner
30.5 -32.8Deals Sh. (%)
▼Sh. (%) Share Ch.
42.9
# of
-5
2017 Rank
2016 Rank
Nomura 936.3 3
Market
-5.6
Change in Market
JP Morgan 3* - 448.9
Bookrunner Proceeds
Mizuho Financial Group
Imputed Fees (US$m)Proceeds per Bookrunner (US$m) # of Deals per Bookrunner
Fees# of DealsMarket ManagerMarket
-36.1% -51.8%Industry % Change from Last Quarter -22.7% ▼▲51.3% 177.1%Industry % Change from Same Period Last Year 250.5% ▲
100.059 +20 337.299.7
13,436.9 100.0336.1Top Fourteen Total 11,859.4 88.3
Industry Total
0.1 -0.2- 1 1.7 +1 ▲ .5Okasan Securities Group Inc 14 - 1.5 0.0 0.0▼▼ 1 1.7 0 - .2Ichiyoshi Securities Co Ltd 13 12 4.6 0.0 -0.5
0.3 -0.4 ▼▼ 1 1.7 0 - 1.0Tokai Tokyo Financial Holdings 12 13 11.8 0.1 -0.10.1 -0.7 ▼▼ 1 1.7 0 - .5Citi 11 8 25.1 0.2 -1.63.4 +3.4 ▲▲ 2 3.4 +2 ▲ 11.5Deutsche Bank 10 - 258.5 1.9 +1.91.9 +1.2 ▲▲ 1 1.7 -1 ▼ 6.2JP Morgan 9 9 594.7 4.4 +3.22.4 +0.8 ▲▲ 5 8.5 +2 ▲ 8.2UBS 8 7 643.1 4.8 +1.4
Goldman Sachs & Co 772.1 5.8 3 5.15.1Bank of America Merrill Lynch 6 6 -1.0 2.3
8.9 2.6825.3 6.1 3▼ +1 7.9▲
Market
+12 ▲
Imputed Fees (US$m)
Sh. (%)44.1
Market
-7.3 ▼Sumitomo Mitsui Finl Grp Inc 7 5 26.8 0.9 1.8 2.6▼▲ 1 14.3 +1 +3.8 ▲3.0 4.3▲Daiwa Securities Group Inc 6 - 89.5 2.9 +2.9
-6.6 ▼
▼Industry % Change from Last Quarter -100.0% ▼ -100.0% ▼ -100.0% ▼Industry % Change from Same Period Last Year -26.6% ▼ -53.3% ▼ -33.0%
▲▼
49
20 22
36
54 62
83
98 93
43
-
20
40
60
80
100
120
140
160
-
2
4
6
8
10
12
14
16
2008 2009 2010 2011 2012 2013 2014 2015 2016 2017
# of
Issu
es
Pro
ceed
s (U
S$b
illion
s)
1Q 2Q 3Q 4Q # of Issues
*tie
y g Q
Visit http://dmi.thomsonreuters.com to view archives and order custom League Tables https://www.thomsonone.com
16

-
-
-
-
EMEA
-
-Asia-Pacific
-
Japan
Tel: +632.459.1647
Tel: +813.6441.1120
E-mail: [email protected]
Rebecca Cox
Tel: +1.646.223.8457E-mail: [email protected]
Tel: +44.207.542.7376
First Half 2017 | Equity Capital Markets | Managing Underwriters
League table volumes for Mitsubishi UFJ Financial Group and Morgan Stanley, included herein, reflect changes after the commencement of their jointly established securities firms in Japan: (1) Mitsubishi UFJ Morgan Stanley Securities and (2) Morgan Stanley MUFG Securities. Credit for the newly established joint ventures rolls up to Morgan Stanley. For Japanese involvement league tables Morgan Stanley will be represented as "Mitsubishi UFJ Morgan Stanley".
Convertible Bonds with a minimum life of less than 360 days are excluded. Minimum life defined as the difference between the settlement date and the earliest maturity date or first call/put option.
Imputed fees are generated using a proprietary Thomson Reuters algorithm when spreads or fees are not disclosed. Deal fees are on a gross basis before all expenses. Each underwriter or advisor is allocated its share of deal fees using the Thomson Reuters allocation methodology, based on the number of underwriters or advisors on the deal and their role. No fees are allocated to non-lead loan syndicate members. Fee estimates presented in the Quarterly Review for deals updated prior to February 1st, 2017 were generated by Freeman Consulting in partnership with Thomson Reuters.
Database coverage includes domestic and international placements of equity offerings in addition to domestic and international equity-related transactions. This includes IPOs, follow-on offerings, accelerated bookbuilds and block trades (with certain restrictions) and convertible bonds.
If you would like to participate in the submission process, receive quarterly press releases, or have questions about our full league table criteria please contact:
Evgeniya KolesovaAmericas
E-mail: [email protected]
Non-US dollar denominated transactions are converted to the US dollar equivalent at the time of pricing.
https://www.thomsonone.com
Ranking Criteria Summary
E-mail: [email protected]
Aki Sato
Antoinette Reyes
Transactions must be received within 5 business days of pricing. (Rule 144a transactions sold exclusively in the US market, MBS, ABS transactions in all markets and all Federal Credit Agency transactions must be received within 5 business days of settlement.) Transactions not received by the applicable deadline are entered into the database but classified as rank ineligible and are not included in league tables for the current calendar year.
All league tables are based on deal proceeds (total issue amount or number of shares multiplied by the issue price) unless otherwise stated. All data for the periods shown are as reflected in Thomson Reuters databases as of 9:00am EDT on June 30, 2017. Full credit is given to the bookrunner, equal if joint books. In cases of underwriter consolidation, credit is given to the surviving/parent firm.
Visit http://dmi.thomsonreuters.com to view archives and order custom League Tables
While Thomson Reuters has used reasonable endeavors to ensure that the information provided in this document is accurate and up to date as at the time of issue, neither Thomson Reuters nor its third party content providers shall be liable for any errors, inaccuracies or delays in the information, nor for any actions taken in reliance thereon, nor does it endorse any views or opinions of any third party content provider. Thomson Reuters disclaims all warranties, express or implied, as to the accuracy or completeness of any of the content provided, or as to the fitness of the content for any purpose to the extent permitted by law. The content herein is not appropriate for the purposes of making a decision to carry out a transaction or trade and does not provide any form of advice (investment, tax, legal) amounting to investment advice, nor make any recommendations or solicitations regarding particular financial instruments, investments or products, including the buying or selling of securities. Thomson Reuters has not undertaken any liability or obligation relating to the purchase or sale of securities for or by any person in connection with this document. © 2017 Thomson Reuters. All rights reserved. Thomson Reuters and the Thomson Reuters logo are registered trademarks and trademarks of Thomson Reuters and its affiliated companies. Any third party name or mark herein belongs to the relevant third party.
17

Thomson Reuters Solutions for the Deal Making Community
FOR STRATEGY AND PLANNING TEAMSFOR INFORMATION PROFESSIONALSSDC Platinum is the world’s foremost financial transactions database, covering new issues, M&A, syndicated loans, private equity, project finance, poison pills, and more.
Solution for:• Market Analysis & Trends (Geography, Sector,Asset Class, Deal Type, Deal Size, etc.)• Deal Origination (Debt Maturity Analysis,Company Lifecycle including Private Equity)• Pitch Creation (Firm Credentials, Representative Acquirors)• M&A Targeting (Active Strategic/SponsorAcquirors, Target Company Screener)• Negotiation (T&C Benchmarking)
Thomson Reuters Deals Business Intelligence enables you to slice and dice our renowned Deals and Fees data to create ad hoc reports, analyze market trends, benchmark your performance and identify opportunities – all within a tool built into your workflow in Excel®, saving you valuable time and giving you a competitive edge.
Solution for:• Conducting market analysis and identifying trends• Benchmarking your performance and monitoring competitors• Targeting clients by wallet size and banking relationship• Allocating resources more effectively by evaluating and analyzing lost deals
FOR INVESTMENT BANKERS
evaluating and analyzing lost deals
Send us a sales enquiry at: financial.thomsonreuters.com/salesRead more about our products at: financial.thomsonreuters.com/products
To purchase individual Thomson reuters Deals or League Table reports, please contact our Thomson Reuters On Demand group:
Email: [email protected]
Access unique analysis for free anytime using Thomson Reuters Deals Intelligence website and receive regular updates, delivered direct to your inbox.
Go to: dmi.thomsonreuters.com/dealsintelligence
Thomson Reuters Eikon is the most intuitive and comprehensive way of staying informed. With natural-language search, you can quickly find global information,news, charts and analytics. Company and industry views provide top-level summaries, and then detailed information is just a click away. Identify new opportunities and gain deep understanding of markets, industries, companies and events.
Thomson Reuters Eikon also includes an Add-In for Microsoft® Office to help you increase your efficiency. From screening and targeting to comparables analysis, building league tables, valuing a company
and developing a client pitch book, you can do all this without leaving Microsoft Office. Search and autosuggest features in Excel make model-building easier.
Solution for:• Managing Client Relationships• Deal Origination• New Issues Pre-Marketing/Roadshows• Financial Modeling• Customized League Tables• Simple Deals screening• Valuation analysis and comparabledeal screening• On-brand pitch book creation
©2017 Thomson ReutersThomson Reuters and the Kinesis logo are trademarks of Thomson Reuters.
18