Global growth markets: the changing face of world finance.€¦ · Global growth markets: the...
28
Global growth markets: the changing face of world finance. Capital Markets Guide 2008
Transcript of Global growth markets: the changing face of world finance.€¦ · Global growth markets: the...

Global growth markets:the changing face of world finance.
Capital Markets Guide 2008

Contents
01 Foreword
02 Market and economic overview
03 Markets in context
04 Market insights
10 The company experience
11 The company experience
12 Market performance
18 Admission requirements
20 Directory of growth markets
22 Directory of main markets
24 Grant Thornton International
25 Global capital markets contacts
MethodologyThe 2008 global growth markets guide from Grant ThorntonInternational analyses the performance of the eight largeststock markets competing to list growth company stocks inthe world between 2005 and 2007. All growth markets arelisted in the directory at the back of this guide. Information inthis report was prepared by Grant Thornton International andwas current at 31 December 2007. Although everything hasbeen done to ensure that information is accurate, GrantThornton International makes no representation as to theaccuracy or completeness of information included in thisreport. Opinions in this report constitute the currentjudgement of the authors at the date of this report andshould not be construed as advice to adopt any particularinvestment strategy. All figures have been converted intoUS dollars using the exchange rate prevailing at the time.

Capital Markets Guide 2008 1
Global Growth Markets Guide 2008
Foreword
Running a market for growth companies isbecoming an increasingly competitive business, aswell as challenging in the present economic climate.AIM and NASDAQ, the two largest markets, arenot only vying with each other to woo prized newlistings from emerging economies, but they also facerenewed efforts by those economies to buildattractive junior bourses of their own. Singapore’sCatalist, previously known as SESDAQ, is a case inpoint with its potential to list exciting companiesfrom Indonesia and Vietnam, while Hong Kong’sGEM should be well placed to capture Chinesebusinesses. This is also true for South Africa, wherethe Johannesburg Stock Exchange operates AltX forgrowth companies, and in Brazil the domesticplayers have been largely able to meet local needs.
Yet, while the new junior markets in Asia inparticular have begun closing the gap in the lastthree years and can offer impressive liquidity, thereis no doubt that AIM and NASDAQ still lead thefield. AIM has made itself relevant both to its ownheartland of mid and small-cap UK companies andto the more ambitious Chinese and Indiancompanies. There have been concerns expressedabout liquidity on AIM, but fundraising in 2007 wasstronger than on any other market. NASDAQ’sperformance all round was consistently strongbetween 2005 and 2007, the period reviewed by thisguide.
The 2008 Grant Thornton global growthmarkets guide looks at these themes and others as itanalyses the performance of the eight largest andmost important stock markets in the worldcompeting to list growth company stocksthroughout 2007, giving an overview of their size,activity and admission requirements.
The 2008 Grant Thornton global growthmarkets guide is part of a series of capital marketsguides that Grant Thornton International hascompiled over seven years. If you are interested inaccessing other Grant Thornton capital marketsguides, visit the publications section ofwww.gti.org.

2 Capital Markets Guide 2008
The 2008 global growth markets guide from Grant ThorntonInternational analyses of the world’s leading growth companymarkets. It reveals that, at their current level of performance,there are exciting prospects ahead for junior bourses in theAsia-Pacific region in particular. As measured by their marketindices and market capitalisation, Catalist, GEM and KOSDAQmade considerable progress between 2005 and 2007.
It also confirms that the more established markets, AIMand NASDAQ, remained well ahead of the others inimportant respects. Both were able to attract large numbers ofnew listings to buoy their market capitalisation, although thelatter has seen a slight fall in the overall number of companieslisted, and both remained the best markets on which to raisefunds. The third best, the TSX-Venture Exchange, is also basedin a mature economy, Canada. Significantly, NASDAQ andAIM were much less volatile than their newer rivals,something that is reassuring to investors and companies alike.AIM’s only weaknesses was its comparative lack of liquidityand a slight fall in its main index.
The survey also reveals that Japan's Mothers Market hasbeen struggling by most measures, depressed by the sluggishJapanese economy. It was alone among the markets inexperiencing a fall in average total market capitalisation in 2007.
There are 40 growth stock markets around the world, butthis guide focuses on those which meet certain criteria, statedin the next pages, as to size, age and importance.
Market and economic overview

Capital Markets Guide 2008 3
At the end of 2007, there were 40 growth markets aroundthe world – 18 in Europe, 15 in Asia Pacific, three in Africaand four in the Americas.
Growth markets are aimed at younger and smaller companieswith high growth potential.
This contrasts with the main markets which typically targetlarger, more established companies. Smaller, fledglingcompanies can suffer on main markets through comparisonswith better resourced and larger companies, resulting in a lowor poor profile.
Growth markets analysed in detail are those which havebeen in existence for at least four years, have more than 150companies listed, and a market capitalisation in excess of US$2billion.
We also provide insight into some of the countries andregions attracting significant international investment.
Where to listSome growth markets like to claim that they are sector ratherthan geographically based and that they attract similarcompanies from across the world. In reality, growth marketspredominantly list domestic stocks only. For most smallcompanies, opportunities to raise money on an internationalstock exchange are limited. Companies are often drawn tointernational exchanges due to their perceived brand valuerather than for purely commercial reasons. There is also awidespread and sometimes mistaken belief that highervaluations can be obtained by going to an international stockmarket. Accurate comparisons can only be made betweensimilar-sized companies and after making adjustments fordifferent accounting policies.
Growth market characteristicsRegulated marketA qualifying growth market must be regulated by either astock exchange or respected governing body.
Companies listedCompanies within a qualifying market tend to be of smallor medium market capitalisation and active in rapid growthsectors.
Reduced admission criteriaWhen compared with its principal market, a qualifyinggrowth market often has less stringent admission criteria.
Markets in context
4 Capital Markets Guide 2008
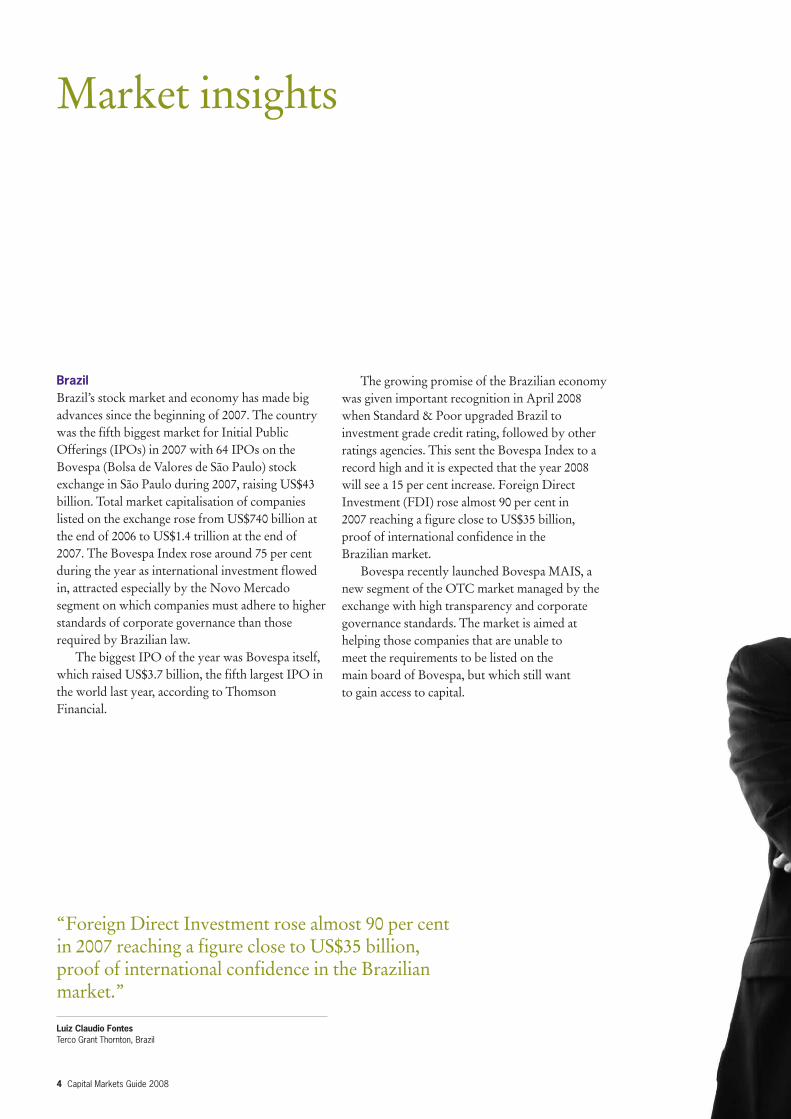
The growing promise of the Brazilian economywas given important recognition in April 2008when Standard & Poor upgraded Brazil toinvestment grade credit rating, followed by otherratings agencies. This sent the Bovespa Index to arecord high and it is expected that the year 2008will see a 15 per cent increase. Foreign DirectInvestment (FDI) rose almost 90 per cent in2007 reaching a figure close to US$35 billion,proof of international confidence in theBrazilian market.
Bovespa recently launched Bovespa MAIS, anew segment of the OTC market managed by theexchange with high transparency and corporategovernance standards. The market is aimed athelping those companies that are unable tomeet the requirements to be listed on themain board of Bovespa, but which still wantto gain access to capital.
BrazilBrazil’s stock market and economy has made bigadvances since the beginning of 2007. The countrywas the fifth biggest market for Initial PublicOfferings (IPOs) in 2007 with 64 IPOs on theBovespa (Bolsa de Valores de São Paulo) stockexchange in São Paulo during 2007, raising US$43billion. Total market capitalisation of companieslisted on the exchange rose from US$740 billion atthe end of 2006 to US$1.4 trillion at the end of2007. The Bovespa Index rose around 75 per centduring the year as international investment flowedin, attracted especially by the Novo Mercadosegment on which companies must adhere to higherstandards of corporate governance than thoserequired by Brazilian law.
The biggest IPO of the year was Bovespa itself,which raised US$3.7 billion, the fifth largest IPO inthe world last year, according to ThomsonFinancial.
Market insights
“Foreign Direct Investment rose almost 90 per centin 2007 reaching a figure close to US$35 billion,proof of international confidence in the Brazilianmarket.”
Luiz Claudio FontesTerco Grant Thornton, Brazil

Capital Markets Guide 2008 5
FranceTotal listings on NYSE Euronext’s Alternext(NYX) market, which is focused on small andmid-cap growth companies, passed the 100 markin 2007. Some 46 companies joined Alternext byway of an IPO, confirming the market’s role asan important destination for small and mid-sizecompanies.
Funds raised amounted to €450 million(US$594 million) last year. In total, over 120companies are now listed on Alternext, and thesecompanies have raised a total of €1.6 billion(US$2.3 billion – including funds raised on thesecondary market) since the market opened inMay 2005. Total market capitalisation is over€5 billion (US$7.3 billion).
This year has brought further strides forwardwith the listings of the market’s first two Chinesecompanies, China Corn Oil and Huacheng RealEstate, as well as adding another UK company,Proventec, the first AIM-listed company to havea dual listing on Alternext.
“Some 46 companies joined Alternext byway of an IPO in 2007, confirming themarket’s role as an important destinationfor small and mid-size companies. ”
Pierre CazilhacGrant Thornton, France

South AfricaThe South African economy, recognised as anengine for growth for the Southern African regionby the International Monetary Fund (IMF) hasremained strong due to infrastructure development,but the consumer boom of previous years hasended. According to the country’s treasury, GrossDomestic Product (GDP) growth is forecast to befour per cent in 2008, only slightly down on 2007.The Johannesburg Stock Exchange (JSE) has heldup this year, sustained by high commodity prices.There were 25 new listings on the main board in2007, taking the total number of companies to 411at the end of last year. Total market capitalisationstood at nearly R6 trillion (US$828 billion). TheJSE's AltX, a secondary board for growthcompanies, has also been very active. There were 39new listings in 2007, pushing up the total number ofcompanies to 76 by the end of the year and marketcapitalisation to R31 billion (US$4.6 billion).Around a quarter of the companies on the marketoperate in the important construction and thematerials sectors, areas which have been boosted bySouth Africa's growing infrastructure expenditure.
“The JSE has held up this year, sustained byhigh commodity prices. The JSE’s AltX, asecondary board for growth companies, hasalso been very active, there were 39 newlistings in 2007, pushing up the total numberof companies to 76 by the end of the yearand market capitalisation to US$4.6 billion.”
Jeanette HernGrant Thornton, South Africa
6 Capital Markets Guide 2008

ThailandDisruptive political events in Thailand have skewedthe capital markets somewhat in the last 18 months,but the markets began returning to normal in 2008.The markets were subdued after the coup d'étatthat took place in September 2006. The effect on themarkets of this uneasy political situation wascompounded when the Bank of Thailandintroduced capital control measures in December2006 to slow down the appreciation of the localcurrency against the US dollar. The result was onlya handful of IPOs on both the Stock Exchange ofThailand (SET) and Market for AlternativeInvestment (MAI) for the year.
In 2008 with the political outlook improved bythe election of a democratic government, bettermacro-economic fundamentals, growing foreignreserves passing US$100 billion and soaringexports, the markets put in a strong performanceto reach multi-year highs.
Thailand's financial sector was generallyunexposed to the sub-prime market and as such didnot suffer any significant direct impact from thecredit crisis. The SET continued to perform welluntil late April 2008 when, as with other emergingmarkets, the Thai SET saw persistent foreign sellingpressure due to the global de-leveraging and oilprice driven inflation concerns.
“In 2008 with the political outlook improved by theelection of a democratic government, better macro-economic fundamentals, growing foreign reservespassing US$100 billion and soaring exports, themarkets put in a strong performance to reachmulti-year highs.”
Bill HutchisonGrant Thornton, Thailand
8 Capital Markets Guide 2008
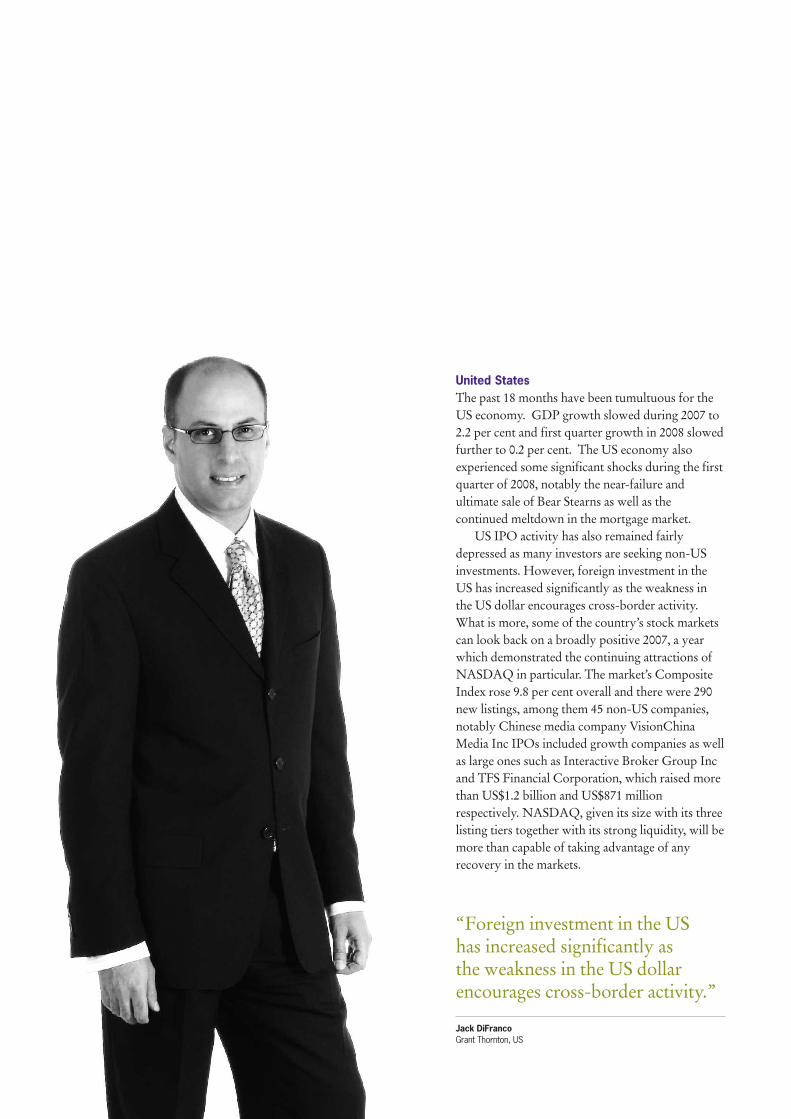
United StatesThe past 18 months have been tumultuous for theUS economy. GDP growth slowed during 2007 to2.2 per cent and first quarter growth in 2008 slowedfurther to 0.2 per cent. The US economy alsoexperienced some significant shocks during the firstquarter of 2008, notably the near-failure andultimate sale of Bear Stearns as well as thecontinued meltdown in the mortgage market.
US IPO activity has also remained fairlydepressed as many investors are seeking non-USinvestments. However, foreign investment in theUS has increased significantly as the weakness inthe US dollar encourages cross-border activity.What is more, some of the country’s stock marketscan look back on a broadly positive 2007, a yearwhich demonstrated the continuing attractions ofNASDAQ in particular. The market’s CompositeIndex rose 9.8 per cent overall and there were 290new listings, among them 45 non-US companies,notably Chinese media company VisionChinaMedia Inc IPOs included growth companies as wellas large ones such as Interactive Broker Group Incand TFS Financial Corporation, which raised morethan US$1.2 billion and US$871 millionrespectively. NASDAQ, given its size with its threelisting tiers together with its strong liquidity, will bemore than capable of taking advantage of anyrecovery in the markets.
“Foreign investment in the UShas increased significantly asthe weakness in the US dollarencourages cross-border activity.”
Jack DiFrancoGrant Thornton, US

United KingdomAlternative Investment Market (AIM) emphasisedits status as the largest growth market in Europewith a record year for fundraising in 2007, thanks inparticular to a strong first half. A total of US$32.1billion was raised, compared with US$30.7 billionin the previous record year of 2006. At the end of2007 there were 1,694 companies listed on AIMwith a total market capitalisation of £97.6 billion(US$193.6 billion), a net gain of 60 companies andover £7 billion (US$16 billion) in marketcapitalisation compared to 2006. The figuresindicate the strengthening of investor support forthose companies looking to AIM as a source ofgrowth capital.
Market conditions have become more difficultsince the second half of 2007, but AIM still saw£1.13 billion (US$2.24 billion) raised in the firstquarter of 2008 in a period when many marketswere feeling the effects of the credit crunch and theresulting market turmoil.
There has also been an increase in cross-borderfloats and currently there are more than 500overseas companies originating from around 70countries. The international spread of thesehighlights the fact that AIM has a credibledominance in attracting companies and investorappetite from all over the world, both fromemerging economies and from highly developedeconomies: as at 31 December 2007, there were, forinstance, 46 US companies listed. Another keypoint for the UK business community is that themarket has not abandoned its roots and maintainsits support for UK small and medium sizedbusiness enterprises.
“AIM emphasised its status as the largest growth market in Europe with a record yearfor fundraising in 2007. Market conditions have become more difficult since 2007, butAIM still saw US$2.24 billion raised in the first quarter of 2008 in a period when manymarkets were feeling the effects of the credit crunch and the resulting market turmoil.”
Fiona OwenGrant Thornton, UK
10 Capital Markets Guide 2008
The company experience
On 15 May 2008, with the support of two GrantThornton member firms, Mortice was the firstIndian corporate listing this year on the AlternativeInvestment Market (AIM). Grant Thornton UKacted as the nominated adviser for this listing andthe deal was led by members of the firm’s UK SouthAsia Group. Grant Thornton India acted asreporting accountants.
Manjit Rajain goes on to say “The team’sapproach was very structured and professionalfrom beginning to end, in particular, their ability tomanage the large number of individuals and partiesinvolved in the process, which took place acrossthree time zones”. He added “The team providedfocused advice in terms of their experience on theAIM market and demonstrated a depth ofunderstanding amassed from having advisedSouth Asian companies for 16 years.”
“We opted for AIM because most of ourcustomers are multinational companies andwe wanted the credibility that AIM’s reputationand a London location would give us.”
Manjit RajainExecutive Chairman of Mortice and Chairman of Tenon Group of Companies
Founded in 1995 Mortice Limited (Mortice) is anewly incorporated company located in Singapore.The two Indian operational companies of Morticeare Tenon Property Services Private Limited andPeregrine Guarding Private Limited, which have beenproviding security services in India for over 13 years.
Manjit Rajain, Executive Chairman of Morticeand Chairman of Tenon Group of Companies,explains: “We looked at private equity funding, buta public listing was preferable as it brings with it thecredibility of appropriate corporate governance. Weopted for AIM because most of our customers aremultinational companies and we wanted thecredibility that AIM’s reputation and Londonlocation would give us. Also, we’re a small butgrowing company and AIM offered us a moreefficient, simpler listing process and a platform fora more attractive valuation based on our futureprojections.”
Company name Mortice LimitedIndustry sector Services (facilities management)Stock exchange AIMDate of listing 15/05/2008Market cap. at listing US$ 61,458,113Present value US$ 68,549,433*Present price per share 72.5pCompany website www.morticegroup.com*as at 1 August 2008
AIM is the London Stock Exchange’s international market for smallergrowing companies. Since its launch in 1995, over 2,518 UK companiesand 499 international companies have joined AIM – raising more than£59bn, through initial public offerings (IPOs) and further capital raisings.

Capital Markets Guide 2008 11
The company experience
John Mandalas, managing director ofMEDITERRA says: ‘We wanted to list on ENAbecause we believed that it was a great opportunityfor us to gain publicity and a higher profile.Moreover, we were already a company with manydifferent investors and for that reason it was easierfor us to go public. Finally, we needed to raisecapital in order to fund our new productionfacilities and expand our retail network. ENA wasthe perfect way’.
“We wanted to list on ENA because weneeded to raise capital to fund our newproduction facilities and expand our retailnetwork. ENA was the perfect way.”
John MandalasManaging Director, MEDITERRA – a client of Grant Thornton Greece.
Company name MEDITERRAIndustry sector Food Retailer & WholesalerStock exchange ENADate of listing 28/2/2008Market capitalisation at listing US$28.11m*Present value US$39.26m*Present price per share US$5.38Company website www.mastihashop.gr*as at 2 June 2008
Mediterra was founded in 2002 by the Chios GumMastic Growers Association. It aims todemonstrate and promote natural Chios Mastihaand its different uses and qualities. A resinous sapproduced from the trunk and branches of thelentisk tree on the island of Chios, Mastiha is wellknown for its nutritional, therapeutic and cosmeticattributes. There are over 500 products in eightcategories which are sold through a retail networkof 12 shops in several countries.
The company recently listed on the AlternativeMarket (ENA), a market operated by the AthensExchange (ATHEX).
ENA is Greece’s new alternativemarket for fast-growing smallcompanies. Launched in February2008 it has six companies and amarket capitalisation of US$222.6million at 3 June 2008.
12 Capital Markets Guide 2008
Among the more mature markets, NASDAQComposite Index was an impressive performerfinishing up 9.8 per cent, and outperforming allthe major US benchmark indices including theStandard & Poor (S&P) 500 and the Dow JonesIndustrial Average. The FTSE AIM All-Share wasdown only slightly, as was Canada’s Toronto StockExchange (TSX) Venture, but the Tokyo StockExchange's (TSE) Mothers Market plunged 30 percent, reflecting a lack of confidence in Japaneseeconomic prospects.
The overall picture is only slightly modified if thestarting point is January 2005. TSX-Venture was up ahealthy 58 per cent, but otherwise the trends evidentin 2007 are merely accentuated. The NASDAQComposite Index, for instance, was up nearly 29 percent. Of the emerging market exchanges in Asia,GEM was up nearly 40 per cent, KOSDAQ bynearly 50 per cent and the outstanding performeragain was Catalist/SESDAQ which soared by 140 percent. The biggest fall has been in the TSE MothersIndex which has dropped by more than 60 per cent.
Market indicesAs market indices are used to track movementsin the overall share prices of the market, theyrepresent how well a market and the companieslisted on it have performed as a whole.
Indices in 2007 revealed a small but perceptibleshift in the balance of power in the world’s growthcapital markets. In general, market indices withexposure to emerging markets, for which there hasbeen strong demand among both institutionaland retail investors, experienced the most strikingrises while several of those focused on moremature markets either fell or failed to advancesignificantly.
Singapore’s Catalist, known as SESDAQ untilNovember 2007, was the outstanding performer,finishing the year up 50 per cent. Korea’s KOSDAQwas also up appreciably by 16 per cent, althoughHong Kong’s GEM was up only modestly.
Market performance

Capital Markets Guide 2008 13
Figure 1: Market indices
3500
3000
2500
2000
1500
1000
500
0
January 2005 January 2006 January 2007
The market indices for all markets have been re-based to 1000 at 1 January 2005Source: Stock Exchanges and Bloomberg
SESDAQ/Catalist
TSX-V
KOSDAQ
GEM
NASDAQ
AIM
Mothers Market

14 Capital Markets Guide 2008
Total market capitalisationSeveral exchanges consistently boosted theiraverage market capitalisation substantially between2005 and the end of 2007, notably AIM, GEM andKOSDAQ. AIM’s figure had more than doubledto US$205 billion by the end of 2007 while GEMand KOSDAQ doubled to US$18 billion andUS$102 billion respectively. SESDAQ/Catalist alsomore than doubled in value, but from a much lowerbase up to US$8 billion. Strong equities marketsglobally, a good flow of IPOs during some of theperiod under review, and demand for emergingmarkets stocks all helped push up values.
Most of the other exchanges also appreciated,especially TSX-V which nearly doubled its averagemarket capitalisation, but the Mothers Market fellsubstantially from US$40 billion in 2005 to US$28billion in 2007, reflecting a faltering Japaneseeconomy. There were only 23 IPOs on the MothersMarket in 2007 compared with 41 in 2006.
Number of companies listedAs the oldest exchange in the group, it is notsurprising that NASDAQ, founded in 1971, has amuch larger number of companies listed than anyof its competitors. But unlike most of its rivals, itsuffered slight falls in the average number ofcompanies listed in both 2006 and 2007.Nonetheless, it continued to attract new companies:there were 290 new listings in 2007 including 45non-US listings. There were also 154 IPOs and 34switches or dual listings from American StockExchange (Amex) and New York Stock Exchange(NYSE) companies.
The only other exchanges to suffer falls in theaverage number of companies listed wereSESDAQ/Catalist and GEM; though again thenumbers involved were small and, as the ability ofthe struggling Mothers Market to list newcompanies shows, there is not necessarily a linkwith market performance.
Figure 2a: Average total market capitalisation (US$m)
AIM
Catalist
GEM
KOSDAQ
Mothers Market
PLUS
TSX-V
2007
2006
2005
204,958140,23478,027
8,3214,8353,392
17,97010,4508,617
101,71171,66748,420
28,45937,97340,122
4,4433,3272,400
56,80042,67423,900
Figure 2b: Average total market capitalisation (US$m)
NASDAQ
NASDAQ dwarfs all the other growth markets combined and, as the oldest established market,it has a substantially different type and size of company listed. However, it is widely regardedas the benchmark for growth companies around the world and is therefore included for thepurposes of comparison.This is the sum of the total market capitalisation at the end of each month in a given year, dividedby 12.
2007
2006
2005
4,088,9213,698,0743,442,223
Capital Markets Guide 2008 15
Nonetheless, AIM’s figures suggest anunderlying strength in spite of the performance ofits index. In attracting overseas companies itboosted its average number of companies listed to1,661 in 2007 compared with 1,535 in 2006 and1,232 in 2005. This was despite a fall in the numberof new companies listing to 284 in 2007 comparedwith 462 in 2006. Around 20 per cent of thecompanies listed on the exchange are now fromoutside the UK, and the trend has been upwards as31 per cent of newly listed companies in 2007 wereinternationally incorporated. For many companiesAIM offers flexible regulation and valuable accessto UK capital markets.
TSX-V saw a slight increase in the number ofcompanies listed, as did the much smallerKOSDAQ and PLUS.
Average market capitalisation per companyNASDAQ’s companies have consistently been onaverage by far the largest of the exchanges underreview. But the US exchange welcomes wellestablished corporations as well as growthcompanies, as the presence of some of the biggestcompanies in the US such as Microsoft and Appleattests. It has also sought to pitch itself tocompanies already listed on the NYSE and Amex,and so it operates in a very different way from all ofthe other markets here.
Average market capitalisation per company hasfallen by around 50 per cent since 2005 on theMothers Market, but it is still a relatively highUS$148 million.
AIM’s figure has doubled since 2005 to US$123million, even though its largest companies oftenmigrate to the main market of the London StockExchange (LSE). Nonetheless, it can still boastsome large companies such as Sibir Energy, whichwas capitalised at £2.2 billion (US$4.37 billion) atthe end of 2007 and Nikanor £1.29 billion (US$2.56billion).
KOSDAQ’s average market capitalisation percompany has also nearly doubled to an impressiveUS$103 million, thanks to a growing retail investorbase. Catalist, despite not stipulating a minimummarket capitalisation for companies, and GEM,have prospered by this measure too, underlining theincreasing importance of the Asian growth markets.
Figure 3a: Number of companies listed (average in year)
Catalist
GEM
KOSDAQ
Mothers Market
PLUS
2007
2006
2005
Figure 3b: Number of companies listed (average in year)
AIM
NASDAQ
TSX-V
This is the sum of the number of companies listed at the end of each month in a given year,divided by 12.
2007
2006
2005
1,6611,5351,232
3,0973,1453,187
2,2882,2262,213
164173182
195200203
989938894
192164131
209169139
Figure 4a: Average market capitalisation per company (US$m)
AIM
Catalist
GEM
KOSDAQ
Mothers Market
PLUS
TSX-V
2007
2006
2005
1239163
512819
925242
1037654
148232307
212017
251911
Figure 4b: Average market capitalisation per company (US$m)
NASDAQ
This is the average total market capitalisation divided by the average number of companies listed.
2007
2006
2005
1,3211,1761,080
16 Capital Markets Guide 2008
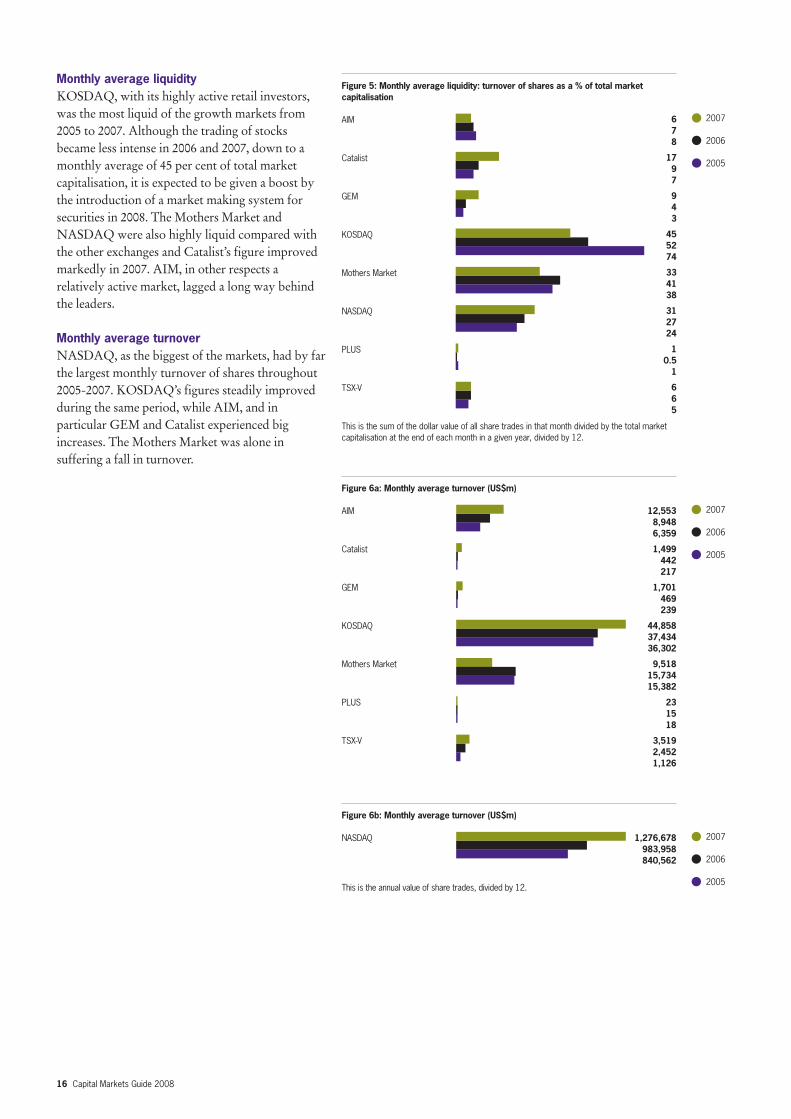
Monthly average liquidityKOSDAQ, with its highly active retail investors,was the most liquid of the growth markets from2005 to 2007. Although the trading of stocksbecame less intense in 2006 and 2007, down to amonthly average of 45 per cent of total marketcapitalisation, it is expected to be given a boost bythe introduction of a market making system forsecurities in 2008. The Mothers Market andNASDAQ were also highly liquid compared withthe other exchanges and Catalist’s figure improvedmarkedly in 2007. AIM, in other respects arelatively active market, lagged a long way behindthe leaders.
Monthly average turnoverNASDAQ, as the biggest of the markets, had by farthe largest monthly turnover of shares throughout2005-2007. KOSDAQ’s figures steadily improvedduring the same period, while AIM, and inparticular GEM and Catalist experienced bigincreases. The Mothers Market was alone insuffering a fall in turnover.
Figure 6a: Monthly average turnover (US$m)
AIM
Catalist
GEM
KOSDAQ
Mothers Market
PLUS
TSX-V
2007
2006
2005
12,5538,9486,359
1,499442217
1,701469239
44,85837,43436,302
9,51815,73415,382
231518
3,5192,4521,126
Figure 6b: Monthly average turnover (US$m)
NASDAQ
This is the annual value of share trades, divided by 12.
2007
2006
2005
1,276,678983,958840,562
Figure 5: Monthly average liquidity: turnover of shares as a % of total marketcapitalisation
AIM
Catalist
GEM
KOSDAQ
Mothers Market
NASDAQ
PLUS
TSX-V
This is the sum of the dollar value of all share trades in that month divided by the total marketcapitalisation at the end of each month in a given year, divided by 12.
678
1797
943
455274
334138
312724
10.51
665
2007
2006
2005

Capital Markets Guide 2008 17
VolatilityHigh volatility can reflect an immature, high-risk,high-growth market. Both GEM and Catalist, onwhich turnover and liquidity increased in 2006 and2007 also became more volatile. But as KOSDAQshowed between 2006-2007, volatility in growthcompany stock exchanges in the emerging marketscan be curbed, although it still remains a concern.Volatility on TSX-V increased considerably in 2007.
Funds raisedAIM led the field in funds raised in 2007, thankslargely to secondary fundraisings totalling £9.6billion (US$19.1 billion). This was the first yearsince 1999 when more money was raised in thisway than by companies newly admitted to AIM,which only raised £6.6 billion (US$13.1 billion) in2007. Most of the big fundraisings took place in thefirst half of the year, such as Mecom Group’s £570million (US$1.1 trillion) in April, before marketconditions became more difficult.
There were also substantial fundraisings in 2007on NASDAQ and TSX-V, driven by IPOs. Therelatively small amounts raised on the up andcoming GEM, which did at least double the moneyraised in 2006, and Catalist, showed their relativeimmaturity.
Companies on the Mothers Market raised onlyUS$485 million, a very small amount for such alarge market and the junior bourse of the TSE.
Figure 7: Volatility (%)
AIM
Catalist
GEM
KOSDAQ
Mothers Market
NASDAQ
TSX-V
This is the sum of the dollar value of all share trades in that month divided by the total marketcapitalisation at the end of each month in a given year, divided by 12.Market indices were not available for PLUS.
Source: Stock exchanges and World Federation of Exchanges
2007
2006
2005
3.03.33.8
13.78.04.9
7.85.14.4
4.54.7
10.7
7.114.19.5
2.73.45.8
9.27.05.4
Figure 8a: Funds raised (US$m)
Catalist
GEM
KOSDAQ
Mothers Market
PLUS
2007
2006
2005
Figure 8b: Funds raised (US$m)
AIM
NASDAQ
TSX-V
This is the sum of the funds raised at the end of each month in a given year, divided by 12.Information was not available for all markets for all years.
2007
2006
2005
32,12330,71215,408
16,19317,37512,193
11,6706,9025,304
8313796
2,4951,094374
4,2842,7113,758
485818
1,002
N/A4667

18 Capital Markets Guide 2008
Admission requirements
Europe Asia PacificAIM Alternext Open Market Plus Markets Group GEM
Entry StandardMinimum public float No minimum requirement US$3.6m No minimum requirement No minimum requirement Minimum of 100 or 300
shareholders with 20% or25% of shares with a minimummarket value of US$19.2mheld by the public (dependingon circumstances)
Initial equity required No minimum requirement No minimum requirement No minimum requirement No minimum requirement No minimum requirement
Market capitalisation No minimum requirement US$7.3m No minimum requirement No minimum requirement Minimum of US$12.8m
Trading history No minimum requirement Minimum 2 years No minimum requirement No minimum requirement Latest 2 financial years undersubstantially the samemanagement
Profitability No minimum requirement No minimum requirement No minimum requirement No minimum requirement Positive cash flow of not less thanbut to be profitable is US$2.6 million in aggregate forstrongly recommended two preceding financial years
Accounting standards International Accounting IFRS of national accounting HGB for Germany or IFRS UK GAAP/IFRS/ US GAAP*** HK GAAP/US GAAP/IFRSStandards/US GAAP/ standards of the memberCanadian GAAP/IFRS/ stateJapanese GAAP
Reporting language English French or English German or English English English or Chinese
Interview with exchange No Yes Yes Yes No
Some markets may have additional requirements.All figures shown are US dollar equivalents.

Capital Markets Guide 2008 19
AmericasKOSDAQ Mothers Market Catalist NASDAQ Global Market NASDAQ Capital Market TSX-V
Minimum of 500 shareholders Offering of minimum 1,000 15% of issued capital in public Minimum of 400 shareholders Minimum of 300 shareholders $500,000-1m publicly heldwith 30% of issued shares shares, including at least hands with a minimum of 200 with a minimu of 1.1 million with a minimu of 1 million 500,000-1m free tradingheldby the public or 10% 500 shares to be issued shareholders shares pubicly held and a shares pubicly held and a public shares 200 publicand 100m-500m shares newly at IPO. Minimum of market value of US$8-20m market value of US$5-15m holders with Board Lots
300 public shareholders depending on listing route depending on listing route depending upon type ofthrough IPO company and listing route
US$1.6-3.2m depending No minimum requirement No minimum requirement US$0-30m depending upon US$4-5m depending upon US$0-2m net tangibleupon type of company listing route listing route assets, depending upon
type of company and listingroute
No minimum requirement Minimum of US$9m No minimum requirement US$0-75m depending upon US$0-50m depending upon At least US$0.5mlisting route listing route
0-3 years depending upon 1 year or shorter as long No minimum requirement 0 - 2 years depending upon 0 - 2 years depending upon No minimum requirementtype of company as the company has listing route listing route
operated another businessin the precedent period.Different requirementsdepending on circumstances;US$0.9 m or they shoulddisclose “Summary ofBusiness Plan” on the dayof listing. (exempt when theprofit before extraordinaryitems is positive)
Ordinary profit No minimum requirement No minimum requirement US$0-1m income depending US$750,000 net income US$0-5m depending uponbut the company must have upon listing route depending upon listing type of company and listinga sponsor route route
SK GAAP (with exemption for Japanese GAAP Singapore FRS/US GAAP/ US GAAP/ IFRS US GAAP/ IFRS Canadian GAAP ornon domestic companies) IFRS US/UK/International GAAP
with a reconciliation toCanadian GAAP
English or Korean Japanese English English English English or French
Yes Yes No No No Yes
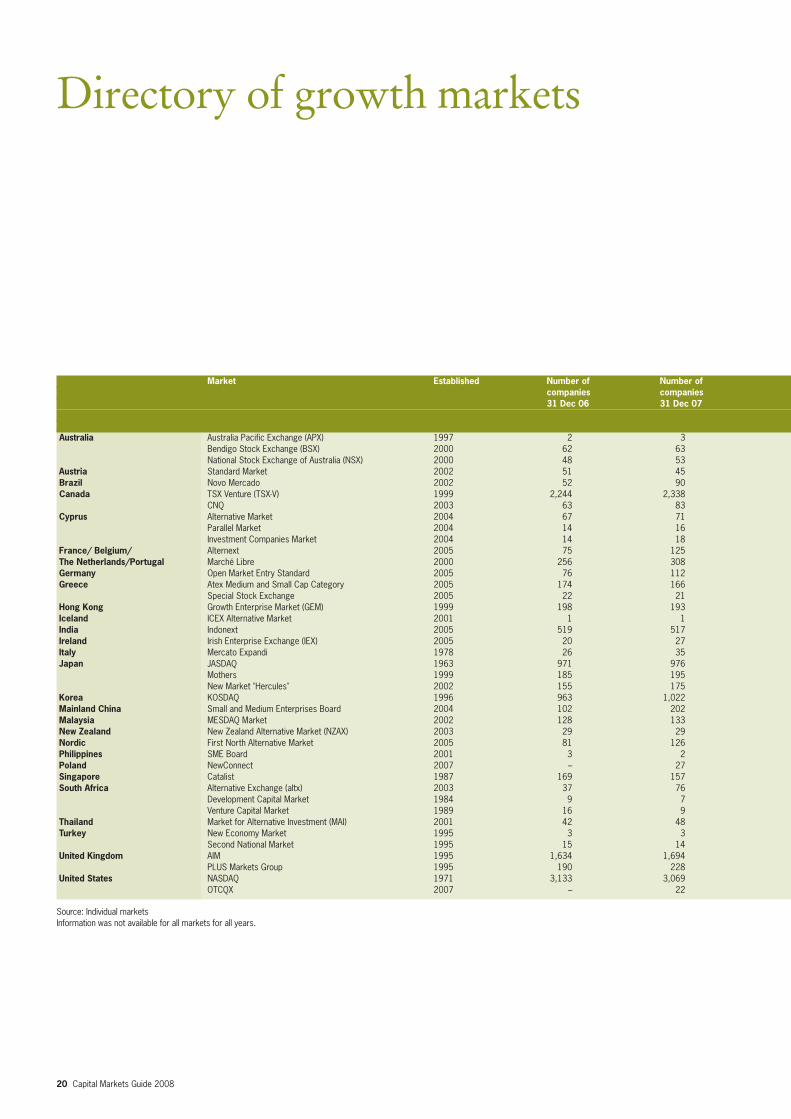
Directory of growth markets
20 Capital Markets Guide 2008
Market Established Number of Number ofcompanies companies31 Dec 06 31 Dec 07
Australia Australia Pacific Exchange (APX) 1997 2 3Bendigo Stock Exchange (BSX) 2000 62 63National Stock Exchange of Australia (NSX) 2000 48 53
Austria Standard Market 2002 51 45Brazil Novo Mercado 2002 52 90Canada TSX Venture (TSX-V) 1999 2,244 2,338
CNQ 2003 63 83Cyprus Alternative Market 2004 67 71
Parallel Market 2004 14 16Investment Companies Market 2004 14 18
France/ Belgium/ Alternext 2005 75 125The Netherlands/Portugal Marché Libre 2000 256 308Germany Open Market Entry Standard 2005 76 112Greece Atex Medium and Small Cap Category 2005 174 166
Special Stock Exchange 2005 22 21Hong Kong Growth Enterprise Market (GEM) 1999 198 193Iceland ICEX Alternative Market 2001 1 1India Indonext 2005 519 517Ireland Irish Enterprise Exchange (IEX) 2005 20 27Italy Mercato Expandi 1978 26 35Japan JASDAQ 1963 971 976
Mothers 1999 185 195New Market "Hercules" 2002 155 175
Korea KOSDAQ 1996 963 1,022Mainland China Small and Medium Enterprises Board 2004 102 202Malaysia MESDAQ Market 2002 128 133New Zealand New Zealand Alternative Market (NZAX) 2003 29 29Nordic First North Alternative Market 2005 81 126Philippines SME Board 2001 3 2Poland NewConnect 2007 – 27Singapore Catalist 1987 169 157South Africa Alternative Exchange (altx) 2003 37 76
Development Capital Market 1984 9 7Venture Capital Market 1989 16 9
Thailand Market for Alternative Investment (MAI) 2001 42 48Turkey New Economy Market 1995 3 3
Second National Market 1995 15 14United Kingdom AIM 1995 1,634 1,694
PLUS Markets Group 1995 190 228United States NASDAQ 1971 3,133 3,069
OTCQX 2007 – 22
Source: Individual marketsInformation was not available for all markets for all years.

Capital Markets Guide 2008 21
Total market Total market Ave market Ave market Website Telephonecapitalisation capitalisation capitalisation capitalisation31 Dec 06 31 Dec 07 per company per company(US$m) (US$m) 31 Dec 06 31 Dec 07
(US$m) (US$m)16 N/A 8 N/A www.apx.com.au +61 3 8601 2020390 N/A 6 N/A www.bsx.com.au +61 3 9664 0000418 541 9 10 www.nsxa.com.au +61 2 4929 6377
9,024 38,334 177 852 www.wienerborse.at +43 1 531 650N/A N/A N/A N/A www.bovespa.com.br +5511 3233 2000
47,425 58,588 21 25 www.tsx.com +1 416 947 4670588 1,054 9 13 www.cnq.ca +1 416 572 2000
1,758 2,749 26 39 www.cse.com.cy +357 22 712300409 768 29 48 www.cse.com.cy +357 22 712300607 654 43 36 www.cse.com.cy +357 22 712300
4,618 7,433 62 59 www.euronext.com +33 1 49 27 10 0014,768 22,885 58 74 www.euronext.com +33 1 49 27 10 0077,874 51,065 1,025 456 www.deutsche-boerse.com +49 692 11014,127 22,059 81 133 www.ase.gr +30 210 336-68003,334 20,098 152 957 www.ase.gr +30 210 336-680011,426 20,649 58 107 www.hkgem.com +852 2522 1122
5 6 5 6 www.icex.is +354 525 280017,711 39,599 34 77 www.bseindia.com +91 22 2272 31213,041 4,426 152 164 www.ise.ie +353 1 617 420013,635 15,673 524 448 www.borsaitaliana.it +39 02 72426 1112,299 120,116 116 123 www.jasdaq.co.jp +81 3 3669 110032,571 24,807 176 127 www.tse.or.jp +81 3 3666 014120,095 15,243 130 87 www.ose.or.jp +81 6 4706 080077,569 106,727 81 104 www.kosdaq.or.kr +82 2 3774 900025,796 145,755 253 722 www.szse.cn +86 755 2591 81793,745 3,349 29 25 www.bursamalaysia.com +603 2732 0067380 421 13 15 www.nzx.com +64 4 472 7599
6,143 8,273 76 66 www.omxgroup.com/nordicexchange +46 8 405 60 0015,765 186,148 5,255 93,074 www.pse.com.ph +632 688 7600
– 445 – 16 www.gpw.com.pl +48 22 628 32326,416 7,029 38 45 www.sgx.com +65 6236 88881,294 4,552 35 60 www.altx.co.za +27 861 00 ALTX30 34 3 5 www.jse.co.za +27 11 520 7000186 222 12 25 www.jse.co.za +27 11 520 7000615 1,284 15 27 www.mai.or.th +66 2229 222255 101 18 34 www.ise.org +90 212 298 2100
1,112 1,435 74 103 www.ise.org +90 212 298 2100177,606 193,649 109 114 www.londonstockexchange.com +44 20 7797 10003,908 4,729 21 21 www.plusmarketsgroup.com +44 20 7553 2000
3,865,004 4,013,650 1,234 1,308 www.nasdaq.com +1 212 401 8700– 367,500 – 16,705 www.otcqx.com +1 212 896 44
22 Capital Markets Guide 2008
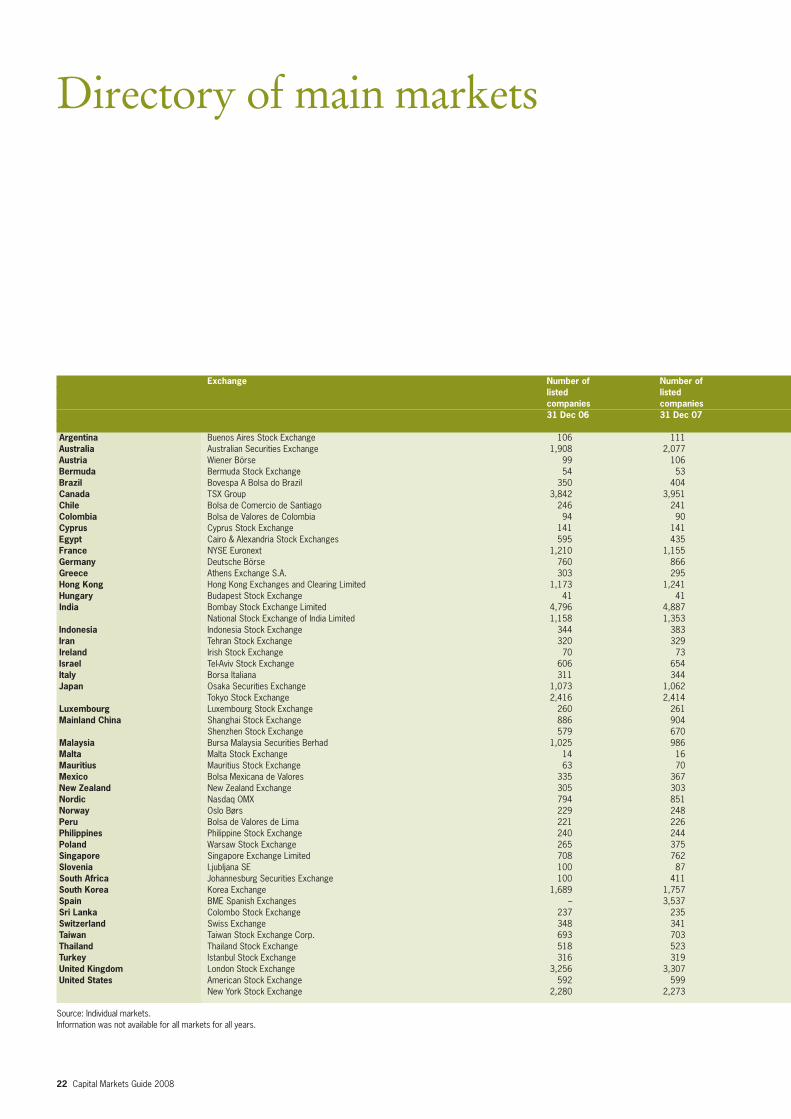
Directory of main markets
Exchange Number of Number oflisted listedcompanies companies31 Dec 06 31 Dec 07
Argentina Buenos Aires Stock Exchange 106 111Australia Australian Securities Exchange 1,908 2,077Austria Wiener Börse 99 106Bermuda Bermuda Stock Exchange 54 53Brazil Bovespa A Bolsa do Brazil 350 404Canada TSX Group 3,842 3,951Chile Bolsa de Comercio de Santiago 246 241Colombia Bolsa de Valores de Colombia 94 90Cyprus Cyprus Stock Exchange 141 141Egypt Cairo & Alexandria Stock Exchanges 595 435France NYSE Euronext 1,210 1,155Germany Deutsche Börse 760 866Greece Athens Exchange S.A. 303 295Hong Kong Hong Kong Exchanges and Clearing Limited 1,173 1,241Hungary Budapest Stock Exchange 41 41India Bombay Stock Exchange Limited 4,796 4,887
National Stock Exchange of India Limited 1,158 1,353Indonesia Indonesia Stock Exchange 344 383Iran Tehran Stock Exchange 320 329Ireland Irish Stock Exchange 70 73Israel Tel-Aviv Stock Exchange 606 654Italy Borsa Italiana 311 344Japan Osaka Securities Exchange 1,073 1,062
Tokyo Stock Exchange 2,416 2,414Luxembourg Luxembourg Stock Exchange 260 261Mainland China Shanghai Stock Exchange 886 904
Shenzhen Stock Exchange 579 670Malaysia Bursa Malaysia Securities Berhad 1,025 986Malta Malta Stock Exchange 14 16Mauritius Mauritius Stock Exchange 63 70Mexico Bolsa Mexicana de Valores 335 367New Zealand New Zealand Exchange 305 303Nordic Nasdaq OMX 794 851Norway Oslo Børs 229 248Peru Bolsa de Valores de Lima 221 226Philippines Philippine Stock Exchange 240 244Poland Warsaw Stock Exchange 265 375Singapore Singapore Exchange Limited 708 762Slovenia Ljubljana SE 100 87South Africa Johannesburg Securities Exchange 100 411South Korea Korea Exchange 1,689 1,757Spain BME Spanish Exchanges – 3,537Sri Lanka Colombo Stock Exchange 237 235Switzerland Swiss Exchange 348 341Taiwan Taiwan Stock Exchange Corp. 693 703Thailand Thailand Stock Exchange 518 523Turkey Istanbul Stock Exchange 316 319United Kingdom London Stock Exchange 3,256 3,307United States American Stock Exchange 592 599
New York Stock Exchange 2,280 2,273
Source: Individual markets.Information was not available for all markets for all years.

Capital Markets Guide 2008 23
Total market Total market Ave market Ave market Website Telephonecapitalisation capitalisation capitalisation capitalisationat 31 Dec 06 at 31 Dec 07 per company per company(US$m) (US$m) 31 Dec 06 31 Dec 07
(US$m) (US$m)51,240 57,070 483 514 www.bcba.sba.com.ar +54 4316 7010
1,096,463 1,293,771 575 623 www.asx.com.au +61 2 9338 0000191,015 228,404.9 1,929 2,155 www.wienerboerse.at +43 1 531 6502,704 2,731 50 52 www.bsx.com +441 292 7212
710,247 1,369,711 2,029 3,390 www.bovespa.com.br +55 11 3233 20001,700,708 2,186,550 443 553 www.tsx.com +1 416 947 4670174,419 212,910 709 883 www.bolsadesantiago.com +56 2 3993 00056,204 101,956 598 1,133 www.bvc.com.co +57 1 313 980016,158 29,474 115 209 www.cse.com.cy +357 22 71230093,496 139,274 157 320 www.egyptse.com +202 392 8698
3,708,150 4,205,676 3,065 3,641 www.euronext.com +33 1 49 27 10 001,637,610 2,105,198 2,155 2,431 www.deutsche-boerse.com +49 692 110461,275 569,246 1,522 1,930 www.ase.gr +30 210 336-6800
1,714,953 2,654,416 1,462 2,139 www.hkex.com.hk +852 2522 112241,861 45,972 1,021 1,121 www.bse.hu +36 1 429 6857818,879 1,819,101 171 372 www.bseindia.com +91 22-22721233774,116 1,660,097 668 1,227 www.nse-india.com +91 22 26598100 114138,886 211,693 404 553 www.idx.co.id +62 (021) 515 0515 430736,315 43,885 113 133 www.tse.ir +98 21 6670 8385163,269 143,905 2,332 1,971 www.ise.ie +353 1 617 4200161,732 235,056 267 359 www.tase.co.il +972 3 567 7411
1,027,543 1,070,343 3,304 3,111 www.borsaitalia.it +39 02 7242613,124,612 2,918,071 2,912 2,748 www.ose.or.jp +81 6 4706 08004,614,069 4,330,922 1,910 1,794 www.tse.or.jp +81 3 3666 014179,514 166,094 306 636 www.bourse.lu +352 47 79 36-1917,508 3,694,348 1,036 4,087 www.sse.com.cn +86 21 6880 8888227,947 784,519 394 1,171 www.szse.cn +867 55 2591 8545235,581 325,290 230 330 www.klse.com.my +60 3 2732 00674,504 5,633.4 322 352 www.borzamalta.com.mt +356 212440514,959 7,919 79 113 www.semdex.com +230 212 9541
348,345 397,725 1,040 1,084 www.bmv.com.mx +52 55 5726 67 9444,817 47,238 147 156 www.nzx.com +64 4 472 7599
1,123,042 1,242,578 1,414 1,460 www.nasdaqomx.com +46 8 405 60 00279,423 352,919 1,220 1,423 www.oslobors.no +47 22 34 17 0040,022 69,386 181 307 www.bvl.com.pe –67,852 102,853 283 422 www.pse.org.ph +632 688 7600148,796 210,016 561 560 www.gpw.com.pl +48 22 628 3232384,286 539,177 543 708 www.sgx.com +65 6236 888815,182 28,794 152 331 www.ljse.si +386 1 471 0211711,232 828,185 7,112 2,015 www.jse.co.za –834,404 1,122,606 494 639 www.kse.or.kr +82 51 662 2000
1,322,915 1,781,133 – 504 www.bolsasymercados.es +34 91 709 50007,769 7,553 33 32 www.cse.lk +94 11 2446581
1,305,537 1,709,148 3,752 5,012 www.swx.com +41 58 854 5454594,659 663,716 858 944 www.tse.com.tw +886 2 810 131 01140,161 197,129 271 377 www.set.or.th +66 2229 2222162,399 286,572 514 898 www.ise.org +90 212 298 2100
3,797,353 2,856,430 1,166 864 www.londonstockexchange.com +44 20 7797 1000282,801 257,797 478 430 www.amex.com +1 212 306 1000
15,421,168 15,650,833 6,764 6,886 www.nyse.com +1 212 656 3000

24 Capital Markets Guide 2008
Grant Thornton International
This guide and others in the capitalmarkets series can be downloaded fromwww.gti.org.
2,400 partners in over 100 countries andconsistently receive a distinctive, highquality service wherever they chooseto do business.
Please contact Edward Turner,assistant director of specialist advisoryservices, if you would like moreinformation on +44 20 7391 9513or visit www.gti.org to find yournearest Grant Thornton firm.
Grant Thornton International Ltd(Grant Thornton International) is one ofthe world’s leading organisations ofindependently owned and managedaccounting and consulting firms. Thesefirms provide assurance, tax andspecialist business advice to privatelyheld businesses and public interestentities. Clients of member andcorrespondent firms can access theknowledge and experience of more than
Antilles*ArgentinaArmeniaAustraliaAustriaBahamasBahrainBelgiumBermuda*BotswanaBrazilBulgariaCambodiaCanadaCayman IslandsChannel IslandsChileChinaColombiaCosta RicaCroatiaCyprusCzech RepublicDenmarkDominican RepublicEgyptEl Salvador
FinlandFranceGabon*GermanyGhana*GibraltarGreeceGuamGuatemalaGuyana*HondurasHong KongHungaryIcelandIndiaIndonesiaIran*IrelandIsle of ManIsraelItalyJamaicaJapanJordanKenyaKoreaKosovo
KuwaitLatvia*LebanonLiechtenstein*LuxembourgMacedoniaMalaysiaMaltaMauritiusMexicoMoroccoMozambiqueNamibiaNetherlandsNew ZealandNicaraguaNigeria*NorwayOmanPakistanPanamaPhilippinesPolandPortugalPuerto RicoQatarRomania*
RussiaSaudi ArabiaSerbia*SingaporeSlovak RepublicSloveniaSouth AfricaSpainSri Lanka*SwedenSwitzerlandTaiwanThailandTunisiaTurkeyTurks and Caicos*UgandaUkraineUnited Arab EmiratesUnited KingdomUnited StatesUruguayVenezuelaVietnamYemenZambia
This list represents the countries and territorieswhere Grant Thornton International member andcorrespondent* firms currently have operations.June 2008.
*for a detailed explanation of the differences betweencorrespondent and member firms please visit www.gti.org

ArgentinaGrant ThorntonAlejandro ChiappeT +54 11 4105 0000E [email protected]
AustraliaGrant ThorntonScott GriffinT +61 2 8297 2755E [email protected]
BelgiumGrant ThorntonMarleen MannekensT +32 2 468 5051E [email protected]
BrazilTerco Grant ThorntonLuiz Claudio FontesT +55 11 3054 0019E [email protected]
CanadaGrant Thornton LLPDonna CarmichaelT +1 416 360 5001E [email protected]
CanadaRaymond Chabot Grant ThorntonLaurier DuchesneT +1 514 878 2691E [email protected]
CyprusGrant ThorntonIoannou StavrosT +357 22 872222E [email protected]
DenmarkGrant ThorntonJan Hetland MøllerT +45 35 27 13 83E [email protected]
FinlandGrant Thornton OYJoakim RehnT +3589 5123 3344E [email protected]
FranceGrant ThorntonPierre CazhilacT +33 1 56 21 06 73E [email protected]
GermanyGrant Thornton GmBHDr Kai BartelsT +49 40 415 22 495E [email protected]
GreeceGrant ThorntonSotiris ConstantinouT +30 210 72 80 000E [email protected]
Hong KongGrant ThorntonAndrew LamT +852 2218 3115E [email protected]
IcelandGrant Thornton ehfOlafur SigurdssonT +354 520 7000E [email protected]
IndiaGrant ThorntonHarish HVT +91 80 41261227E [email protected]
IrelandGrant ThorntonPaul RaleighT +353 1 433 2406E [email protected]
ItalyGrant Thornton Bernoni & PartnersGiuseppe BernoniT +39 02 783351E [email protected]
JapanGrant Thornton JapanEiten InamuraT +81 3 3595 0525E [email protected]
KoreaDaemyung Grant ThorntonMoon-Won ChoiT +82 2 548 4211E [email protected]
MalaysiaShamsir Jasani Grant ThorntonNarendra Kumar JasaniT +60 3 2698 8242E [email protected]
MaltaGrant ThorntonMark BugejaT +356 99437890E [email protected]
MexicoSalles, Sáinz – Grant Thornton S.C.Jose FrancoT +52 55 5336 2630E [email protected]
NetherlandsArenthals Grant ThorntonPeter den HertogT +31 17 242 38 70E [email protected]
New ZealandGrant ThorntonPaul McCormickT +64 2 476 7086E [email protected]
PhilippinesPunongbayan & AraulloRaul TomasT +63 2 887 9484E [email protected]
PortugalGrant ThorntonMaria Jose MendesT +35 1214123524E [email protected]
SingaporeFoo Kon Tan Grant ThorntonKon Yin TongT +65 6304 2301E [email protected]
South AfricaGrant ThorntonJeanette HernT +27 11 322-4562E [email protected]
SpainAudihispana Grant ThorntonAlejandro MartinezT +34 94 424 3992E [email protected]
SwedenGrant Thornton Sweden ABPär EkengrenT +46 8 5630 70 84E [email protected]
SwitzerlandGrant Thornton AGJoerg FischerT +41 43 960 71 71E [email protected]
ThailandGrant ThorntonIan PascoeT +66 2 654 3330E [email protected]
United Arab EmiratesGrant ThorntonHisham FaroukT +971 4 2688070E [email protected]
United KingdomGrant Thornton UK LLPPhilip SecrettT +44 20 7728 2578E [email protected]
United StatesGrant Thornton LLPJack di FrancoT +1 248 233 6913E [email protected]
Global capital markets contacts
Capital Markets Guide 2008 25

www.gti.org
© 2008 Grant Thornton International Ltd. All rights reserved.Grant Thornton International Ltd (Grant Thornton International) andthe member firms are not a worldwide partnership. Services aredelivered independently by the member firms.Printed on 50% recycled content paper.