Global Financial Crisis and Foreign Currency Borrowing ... · 1 Global Financial Crisis and Foreign...
44
1 Global Financial Crisis and Foreign Currency Borrowing 1 Philippe Bacchetta 2 Ouarda Merrouche University of Lausanne University of Lausanne Swiss Finance Institute CEPR CEPR First draft: February 2015 Abstract Despite international financial disintegration, we document a dramatic increase in foreign currency borrowing among leveraged Eurozone corporates in the aftermath of the US financial crisis. Using firm- level borrowing data, we trace this increase to two main symptoms of the global financial crisis: (1) a domestic credit crunch causing leveraged corporates to switch to foreign banks; and (2) a higher funding cost in the borrower home currency causing foreign banks to increasingly transfer currency risk to the borrower. While large high-credit quality corporates could tap the bond market during the credit crunch, lower-credit quality borrowers turned to foreign banks. Although global bank lending is often reported to amplify the international credit cycle, we show that foreign banking acted as a shock absorber that weathered the real consequences of the credit crunch for Eurozone corporates that suffered most from the credit crunch. JEL classification numbers: G21, G30, E44 Keywords: Money market, credit crunch, corporate debt, foreign banks, currency risk 1 Financial support from the ERC Advanced Grant #269573 is gratefully acknowledged. 2 Authors’ emails: [email protected] and [email protected]
Transcript of Global Financial Crisis and Foreign Currency Borrowing ... · 1 Global Financial Crisis and Foreign...
1
Global Financial Crisis and Foreign Currency Borrowing1
Philippe Bacchetta2 Ouarda Merrouche University of Lausanne University of Lausanne
Swiss Finance Institute CEPR CEPR
First draft: February 2015
Abstract Despite international financial disintegration, we document a dramatic increase in foreign currency borrowing among leveraged Eurozone corporates in the aftermath of the US financial crisis. Using firm-level borrowing data, we trace this increase to two main symptoms of the global financial crisis: (1) a domestic credit crunch causing leveraged corporates to switch to foreign banks; and (2) a higher funding cost in the borrower home currency causing foreign banks to increasingly transfer currency risk to the borrower. While large high-credit quality corporates could tap the bond market during the credit crunch, lower-credit quality borrowers turned to foreign banks. Although global bank lending is often reported to amplify the international credit cycle, we show that foreign banking acted as a shock absorber that weathered the real consequences of the credit crunch for Eurozone corporates that suffered most from the credit crunch. JEL classification numbers: G21, G30, E44
Keywords: Money market, credit crunch, corporate debt, foreign banks, currency risk
1 Financial support from the ERC Advanced Grant #269573 is gratefully acknowledged. 2 Authors’ emails: [email protected] and [email protected]

2
1. Introduction
Global banking flows have been a major victim of the US financial crisis. While gross capital
flows declined sharply in general (e.g., Broner et al., 2013), the decline has been particularly
steep for banking flows among developed economies (Milesi-Ferretti and Tille, 2011). The
literature shows evidence of a flight home effect in syndicated bank loans (Giannetti and Laeven,
2012a) and of financial protectionism in bank lending (Rose and Wieladek, 2014). We also
observe that global banks have increased the use of their local currency in their lending (e.g.,
Ivashina et al., 2012). More generally, the evidence indicates that global banking flows amplify
international credit cycles (Giannetti and Laeven, 2012b).
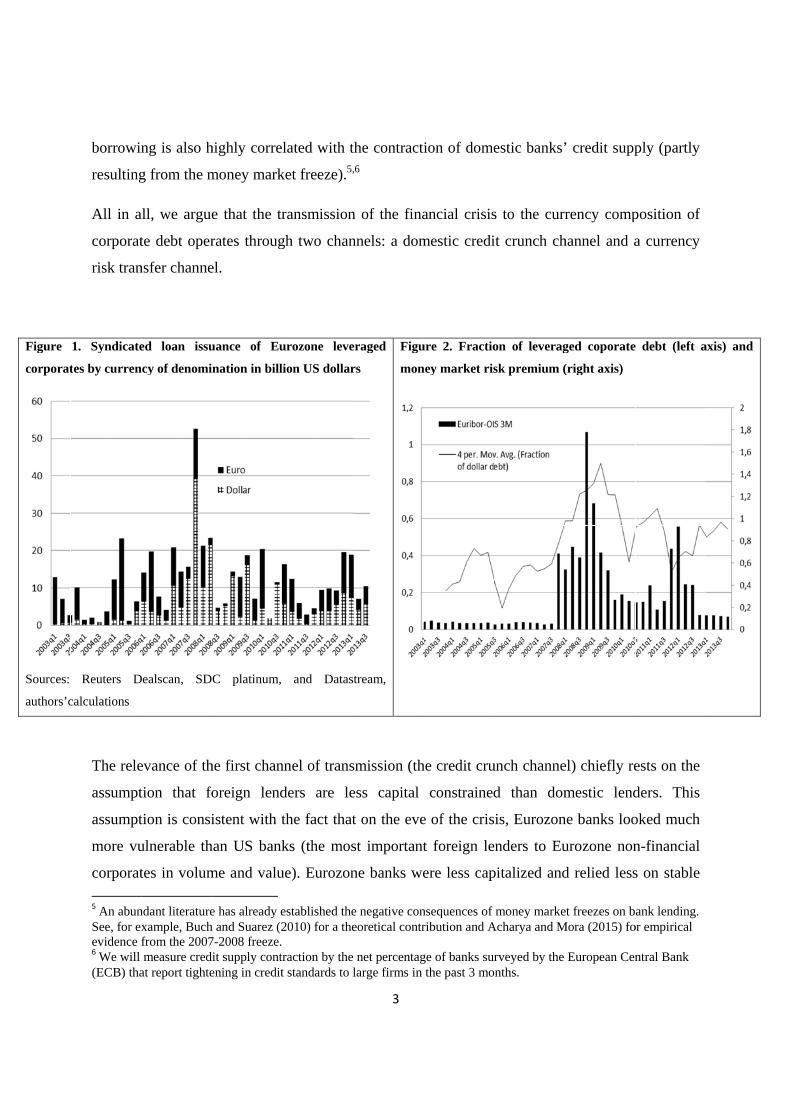
In this context of substantial financial disintegration, it is surprising that foreign currency
borrowing by leveraged Eurozone non-financial corporates increased dramatically. While the
proportion of dollar borrowing by non-investment grade firms was about 30% in 2003-2006, it
increased to 90% in the second half of 2008.3 Importantly, this increase in foreign currency debt
comes mainly from newly issued syndicated loans by leveraged corporates, and not in bonds, as
illustrated in Figure 1. The purpose of this paper is to document this surprising aspect of
international banking flows and identify the factors that led to that development. Moreover, we
show that foreign banking could mitigate the transmission of the credit crunch to employment
and investment.
We argue that the increase in foreign currency borrowing by Eurozone leveraged4 firms is a
consequence of two main (and related) symptoms of the global financial crisis: the domestic
credit crunch and the drying up of the Euro interbank market. Figure 2 plots the evolution of
dollar lending together with the Euro interbank risk premium measured by Euribor-OIS 3-month
spread. The two series are highly positively correlated: a higher cost of bank funding in home
currency is associated with an increase in foreign currency borrowing. Foreign currency
3 This increase cannot be attributed to a valuation effect: the Euro appreciated against the dollar by about 20% during the period when the increase was strongest, i.e., Q2-2007 and Q3-2008. 4 Throughout the paper we use the terms leveraged, non-investment grade, and low-credit quality interchangeably. Non-investment grade firms in our sample have a leverage ratio (or a ratio of long-term debt over total debt) of 19.5% against 5.7% for investment grade firms.
Figure
corporat
Sources:
authors’c
borrowin
resulting
All in a
corporat
risk tran
1. Syndicate
tes by curren
Reuters D
calculations
The rele
assumpt
assumpt
more vu
corporat
5 An abunSee, for exevidence 6 We will (ECB) tha
ng is also h
g from the m
all, we argue
te debt oper
nsfer channe
ed loan issu
ncy of denomi
Dealscan, SD
evance of th
tion that fo
tion is consi
ulnerable th
tes in volum
ndant literaturexample, Buchfrom the 2007measure cred
at report tighte
highly corre
money mark
e that the tr
rates throug
el.
uance of Eu
ination in bill
C platinum,
he first chan
foreign lend
istent with t
han US bank
me and valu
e has already eh and Suarez (27-2008 freeze. dit supply contrening in credit
lated with t
ket freeze).5,
ransmission
gh two chan
urozone leve
ion US dollar
and Datas
nnel of trans
ders are le
the fact that
ks (the mos
ue). Eurozon
established the2010) for a the raction by thet standards to l
3
the contracti,6
n of the fina
nnels: a dom
eraged
rs
stream,
Figu
mon
smission (th
ess capital
t on the eve
st important
ne banks we
e negative coneoretical contr
e net percentaglarge firms in
ion of dome
ancial crisis
mestic credi
ure 2. Fractio
ney market ris
he credit cru
constrained
e of the cris
t foreign le
ere less cap
nsequences of ribution and A
ge of banks surthe past 3 mo
estic banks’
s to the curr
it crunch ch
on of leverag
sk premium (
unch channe
d than dom
is, Eurozon
nders to Eu
pitalized and
money markeAcharya and M
rveyed by the nths.
’ credit supp
rency comp
hannel and a
ged coporate
(right axis)
el) chiefly re
mestic lend
ne banks loo
urozone non
d relied less
et freezes on bMora (2015) fo
European Cen
ply (partly
position of
a currency
debt (left a
ests on the
ders. This
oked much
n-financial
s on stable
ank lending. or empirical
ntral Bank
axis) and

4
forms of funding.7 According to Merrouche and Mariathasan (2012) Eurozone banks also
required much more public capital injections compared with US banks. Relatedly, Laeven and
Valencia (2013) find that a much bigger fraction of the banking system failed or was intervened
in the Eurozone than in the US, reaching 80% of total banking sector assets in some countries
like Greece, Belgium, or France.
Another fundamental difference between US and Eurozone banks is the fact that US banks are
not subject to Basel II; until now their capital requirement is still fixed under the Basel I
framework. Under the Basel I framework, the risk weight on risky and safe corporate debt is the
same. This means that US banks have greater incentive than Eurozone banks to load onto risky
corporate debt.8
The second channel means that lenders have been less willing to bear currency risk. Foreign
lenders found it more convenient to get their funding in their own currency, mainly dollars, and
avoid a currency mismatch by lending in the same currency. The main reason is that they found it
more costly to get their funding in euros or to hedge foreign currency exposure through FX swaps
given the violations of covered interest parity (CIP) during this period.
Using quarterly bond and syndicated loans issuance data by currency of denomination and lender
nationality at the firm level (from Thomson-Reuters SDC platinum for the period Q1-2003 to Q3-
2013), we find evidence for both channels being at work. Looking at the composition of newly
issued debt by instrument we find that when the domestic supply of bank credit contracts,
investment grade firms shift to bonds while non-investment grade firms shift to foreign bank
loans. 9 We find that the shift to bonds is stronger for large investment grade firms and for firms
that are located in non-GIIPS countries. On the other hand, the shift to foreign bank loans is
stronger for risky firms, irrespective of their size. Moreover, foreign banks manage exchange rate
risk by lending more in their home currency as funding conditions deteriorate in the borrowers’
home currency. These two combined effects explain why the increase in foreign currency 7 For example see The Economist “Reshaping banking: the retreat from everywhere”, April 2012. According to Bankscope data in 2007 Eurozone banks had a Tier1 leverage ratio of 5% and a ratio of retail deposits to total assets of 44% against 9% and 72% respectively for US banks. 8 Relatedly, Duchin and Sosyura (2013) show that after receiving government support, US bank rebalance toward riskier assets and that this shift in risk occurs mostly within the same asset class and therefore remains undetected by regulatory capital ratios. 9 In our setting we define foreign banks as banks headquartered outside the Eurozone. Moreover, we define a foreign bank loan as a syndicated loan with at least one lead foreign bank.

5
borrowing is dramatic during the period 2007-2009 and significant only for non-investment grade
firms.
In addition, we find that foreign banking alleviates the financial constraints of risky firms: risky
firms cut employment and investment less when they have a relationship with a foreign lender
and when they have a natural hedge against foreign currency risk.
We specify a linear probability model with firm fixed effects to model the borrower choice
among different sources of finance and among different currencies. We examine whether this
choice is a function of a firm exposure to the two transmission channels mentioned above.
Exposure to the credit crunch channel is captured by the interaction between home country credit
supply conditions and a borrower credit quality. Exposure to the currency risk transfer channel is
captured by the interaction between home currency risk premium and a dummy for whether
lending is by foreign banks.
The fact that we focus on within-firm time variations means that our results cannot be driven by
changes in the composition of firms tapping different forms of finance, by changes in the
aggregate demand for debt, or by changes in the demand for a particular currency over time.
Further, the fact that we focus on Eurozone countries means that our results cannot be driven by
differences in the stance of monetary policy across countries.
Our findings on the role of foreign banks extends earlier work by Haselmann and Watchel (2011)
and Bruno and Hauswald (2012). Haselmann and Watchel (2011) document that foreign banks
(banks headquartered outside the borrower home country) play a prominent role in the syndicated
loan market and that they lend more to riskier borrowers in developed markets. They however do
not study the role of foreign banks during a crisis. Using country-level data, Bruno and Hauswald
(2012) find a positive effect of foreign banks’ presence on real growth and this effect is stronger
during banking crises and in contexts where informational and legal frictions loom larger,
hindering firms’ access to credit. Our firm-level data allow for a better identification of the
channel through which the presence of foreign banks alters firm performance during a crisis.
Our paper extends two other strands of literature on the reshaping of corporate financing during
the credit crunch and on the real effects of the credit crunch. We confirm the result of Ivashina
and Becker (2014) that Eurozone corporates increased their reliance on the bond market but we

6
show that the shift to bond markets does not concern debt raised for real investment finance
purposes (which matters more for real outcomes) and we do not find supporting evidence that
firms that tapped the bond market increasingly did so because they faced a reduction in bank
lending rather than because bond markets became more attractive for them due to flight to
quality.10
A theoretical literature studies the choice between bank finance and bond finance. Diamond
(1991) explains this choice by the interaction between borrower reputation and monitoring.
Reputation effects eliminate the need for monitoring (when interest rates are low and expected
future profitability is high) so that borrowers with higher credit ratings choose to raise debt
directly from the market rather than via financial intermediaries. Holmstrom and Tirole (1997)
use a model with firms that are heterogeneous in their net worth to study the effect of a credit
contraction on the forms of financing. In line with our findings they obtain that a contraction in
credit induces an increase in bank finance for firms with low net worth. Fiorella de Fiore and
Uhlig (2013) develop a general equilibrium model with firms that differ in their risk of default
that can replicate the aggregate shift from bank finance to bond finance witnessed in Europe since
2009.
The literature on foreign currency borrowing or lending focuses on emerging markets in the
context of financial crises11, but there is little work on advanced economies. The empirical
evidence shows that firms are more likely to borrow in foreign currency when they are exporters
or with large cross-currency interest differentials (e.g., Keloharju and Niskanen, 2001 or
McCauley et al., 2015). For the recent financial crisis, Ivashina et al. (2012) find that Eurozone
banks reduced their dollar lending.
The growing literature on the real consequences of the 2008-2009 credit crunch includes
Chodorow-Reich (2013); Bentolila et al. (2013), and Haltenhof et al. (2014) who study the
impact on employment; and Acharya et al (2014) and Cingano et al. (2014) who also analyse the
10 Our samples are however quite different. We do include credit lines as well as term loans, but do not cover small loans because we are also interested in studying the changing patterns of corporate financing towards foreign banks. Ivashina and Becker (2014) collect additional debt data from CapitalIQ which unfortunately are not sufficiently granular to know whether the loans are from domestic banks or from foreign banks. And we do not cover three countries due to the unavailability of the credit supply contraction index. 11 For theoretical papers, see Aghion et al. (2004), Burnside et al. (2004), Jeanne (2005), or Schneider and Tornell (2004).

7
effect on investment. Like our paper, all these papers find a significant effect on both
employment and investment exploiting micro (firm or industry) level data. But none of these
papers studies the mitigating role of foreign banks which is a main focus of this paper. Our
findings also contrast with some papers, using US data, showing that bond market access
mitigates the real effect of the credit crunch. Using Eurozone data we show instead that the
increase in bond market activity concerned only non-real investment purpose debt and did not
concern firms that suffered most from the credit crunch.
The remainder of the paper is organized as follows. The next section develops the theoretical
hypotheses that guide our empirical analysis and interpretation of the data. Section 3 describes
the methodology and the data. Section 4 discusses the results and Section 5 concludes with policy
lessons.
2. Theoretical Predictions
Consider an economy where three categories of agents co-exist: firms, banks, and bond investors.
Firms differ along two dimensions: credit quality and transparency (or size). And banks are split
into domestic and foreign banks. Loans are denominated in domestic currency or in foreign
currency. Banks borrow from other banks in either the domestic or the foreign interbank market
to fund their loans. Following Holmstrom and Tirole (1997) and Diamond (1992) we make the
following key assumptions:
(i) Bonds are contracts that depend only on public information. As a consequence, they
are used primarily by high-quality and transparent borrowers. Nonetheless financing
through bonds is a risky choice for firms because a situation of financial distress can
only be resolved with liquidation and the total loss of the firm’s net worth.
(ii) Bank loans are an information intensive source of finance. Banks spend resources to
acquire information and monitor borrowers hence they reduce the amount of required
collateral. Therefore low-credit quality (non-investment grade) firms demand more
information intensive finance. However, the fact that banks spend resources to acquire
information implies that bond finance is less costly than bank finance.
8
And we add assumption (iii):
(iii) Foreign loans are more costly than domestic loans and bonds because foreign banks
are newer in the market and unlike domestic banks cannot capitalize on past
information production. In other words, domestic banks have an informational
advantage over foreign banks.
The currency denomination of loans can be determined by several factors (see Shapiro, 1985, for
an early analysis). First, assume that banks prefer to fully hedge currency risk. This can be done
by lending and borrowing in the same currency. For example, a foreign bank can lend in
domestic currency borrowing from the domestic interbank market. Alternatively, a foreign bank
may borrow in foreign currency and lend in domestic currency using FX swaps. In these cases, a
foreign bank can offer a domestic currency loan to a domestic firm at not risk. However, if the
domestic funding market or the FX swap market are not functioning efficiently or are costly to
use, a foreign bank may prefer borrowing and lending in foreign currency. In that case, the
domestic firm bears the exchange rate risk (which may become a credit risk for the bank).
However, exporting firms should be less sensitive to a change in currency denomination.
When domestic currency depreciations are anticipated, it may be that domestic firms prefer
borrowing in foreign currency because they find the domestic interest rate “too high”. The reason
is that domestic firms are less affected by a depreciation than lenders: in case of a large
depreciation firms may default (Aghion et al., 2004).12 Then domestic firms may prefer foreign
currency borrowing with high income and currency risk.
We are interested in the effect of the financial crisis on the choice between different sources of
finance, the currency denomination of newly issued loans, employment, and investment. We
discuss two channels of transmission: a credit crunch channel which operates through domestic
banks and a currency risk transfer channel which operates through foreign banks.
12 Firms may also receive a government subsidy in case of large depreciation (Burnside et al., 2004, Schneider and Tornell, 2004).

9
i. Credit crunch channel
A financial crisis causes domestic banks to cut credit to firms. Following from assumptions (i) to
(iii) we can derive the following hypotheses regarding the impact of a domestic credit crunch on
the forms of financing for different categories of firms.
Hypothesis 1. In response to a contraction in the supply of domestic credit, investment
grade (and large or transparent) firms shift to bonds while non-investment grade firms (of
all size) shift to foreign loans.
Holmstrom and Tirole (1997) show that a credit crunch hits more severely non-investment grade
firms. If investment grade firms are unaffected by the credit crunch we ought to observe that they
do not shift to bonds or that any shift to bonds is not attributable to the fact that these firms are
financially constrained. A simultaneous flight to quality in the bond market is a plausible
confounding factor; it renders bond finance more attractive than bank finance for investment
grade firms.
Now consider what happens to small investment-grade firms. Since large investment-grade firms
shift to bonds, that may crowd-in domestic bank credit for small investment-grade firms.
Hypothesis 2. During a domestic credit-crunch, small investment-grade firms shift from
foreign to domestic loans. This follows directly from the assumption that foreign bank loans
are more onerous than domestic bank loans (foreign premium).
This should hold if the cost of domestic loans remains below the cost of foreign loans for this
category of borrowers.
ii. Currency risk transfer channel
Foreign banks react to the increase in the cost of funding in host currency by lending less in host
currency and more in foreign currency.13
13 Ivashina et al. (2012) show that the disruption in the FX swap markets led Eurozone banks to lend less in dollars.

10
Hypothesis 3. When host country interbank markets dry up, foreign banks increasingly
transfer the currency risk to borrowers: they lend less in the borrower home currency and
more in their home currency.
We may also expect that low-credit quality firms are more willing to assume the currency risk as
the cost of borrowing in domestic currency increases relative to the cost of borrowing in foreign
currency (Aghion et al., 2004).
The spillover of interbank markets turbulence has also consequences on the use of currency
swaps for funding in foreign currency and this in turn has potential consequences on the demand
and supply of bank credit in foreign currency. Ivashina et al. (2012) and Baba et al. (2008) have
shown that the reduced access to interbank dollar funding led to an increased use of synthetic
dollar funding. The subsequent increase in the cost of dollar funding through swaps should cause
a reduced supply of dollar loans by domestic banks and an increase in the demand for dollar loans
by exporters which is more likely to be met by foreign banks.
Hypothesis 4. An increase in the cost of synthetic foreign currency borrowing leads to a
decline in the supply of foreign currency loans by domestic banks and an increase in the
supply of foreign currency loans by foreign banks.
Typically when the swap market is well-functioning a Eurozone exporter would find it attractive
to raise dollar through swapping euro against dollar with a US exporter. The dollar interest rate
paid to the US exporter would tend to be lower than the dollar interest rate she would pay to a
bank. However when liquidity in the swap market evaporates, as it did since 2007, synthetic
dollar borrowing becomes more onerous. One should then observe an increase in dollar lending
from foreign banks and this effect should be larger for exporters.
iii. Real effect of the credit crunch
In light of Hypotheses 1 and 2, what will be the consequence of the credit crunch on employment
and investment and the mitigating role of foreign banking?
Hypothesis 5. The real effects of the credit crunch are mitigated for non-investment grade
firms that have a relationship with a foreign bank.

11
Firms and banks form relationships and cannot costlessly or swiftly switch to borrowing from
less capital constrained foreign banks (Chodorow-Reich, 2013). However the benefit of using a
previous foreign bank relationship, or conversely the lemons cost to switching to a foreign lender,
should decline with the transparency (size) of the borrower (Sufi, 2007; Williamson, 1987).
Following from Hypothesis 3, if the chief purpose of foreign banks is to limit their exposure to
risk, they will refrain from transactions that rather than transferring the currency risk transform it
into credit risk. This happens the more they extend foreign currency loans to borrowers who do
not earn foreign currency revenues.
Hypothesis 6. The real benefit of foreign banking during a credit crunch is stronger for
firms with a natural hedge against currency risk
In the next section we present the methodology and data that we use to test these hypotheses.
3. Methodology and Data
First, we investigate the relevance of the credit crunch channel: we relate a direct country-level
time-varying measure of domestic credit supply contraction (CCI) to the choice between different
sources of finance.
Our prior interpretation is that firms switch to alternative sources of finance when domestic credit
is tight because they are financially constrained. For this interpretation to be valid we must also
show that domestic credit supply conditions are not negatively correlated with bond market
liquidity or with changes in the supply of foreign banks’ credit.
Second, we document the currency risk transfer channel using a specification that relates the
currency denomination of newly issued loans with the lender cost of funding in the borrower
home currency.
a. Methodology
i. Credit crunch channel

12
Hypothesis 1 posits that more risky firms tend to borrow with foreign loans. We test this
hypothesis in two steps using the following baseline regression:
(1) ∗ ∗
In the first regression, the left-hand side variable is a dummy that takes value one if firm i
headquartered in country j issues a bond at time t and 0 if it issues a loan. In the second
regression, is a dummy that takes value one if the firm issues a syndicated loan at least partly
subscribed by a foreign (extra-Eurozone) lead bank and zero if it issues a (fully) domestic loan or
a bond. Hence all the firms in our analysis have a positive demand for debt.
is a firm fixed effect and a time fixed effect.14 Risky is a dummy that indicates whether the
firm is rated investment grade and Not risky whether it is rated below investment grade or not
rated. is a country level credit contraction index, i.e. a measure of the decline in the supply
of domestic bank credit which varies over time as well as across countries. The inclusion of firm
fixed effects is key to our analysis: it rules out the possibility that our results could be driven by
changes over time in the composition of firms raising debt. And the fact that we focus on changes
in the debt composition rather than the debt level means that we abstract from changes in the
demand for debt.
The coefficients of interest are and estimated by OLS.15 They are interpreted as average
effects on the probability that a firm issues a bond or borrows from a foreign bank. If Hypothesis
1 is verified we should obtain 0 and 0. We estimate equation (1) for the full sample
and for a sub-sample of debt issued for real investment purposes (general corporate purpose and
working capital).
14 All our results are also robust to the inclusion of country*time fixed effects. 15 We specify a linear probability model in order to include firms fixed effects. Our analysis would not
benefit from using non-linear models such as probit or logit (see Angrist and Pischke, 2009). All predicted probabilities from our model range between 0 and 1. Horrace and Oaxaca (2006) show that, as the relative proportion
of linear probability models (LPM)’ predicted probabilities that fall outside the unit interval increases, the potential bias of the LPM increases. Conversely if no (or very few) predicted probabilities lie outside the unit interval then the LPM is expected to be unbiased and consistent (or largely so).

13
To test Hypothesis 2, we run an augmented version of equation (1) allowing and to vary
across firm size bins.
ii. Competing Interpretation
A competing interpretation for being positive is that bonds or foreign loans become more
attractive independently of the deterioration of the domestic supply of bank credit. A flight to
quality or liquidity in bond markets may render bonds more attractive for investment-grade
borrowers. Figure 3 shows a high correlation between CCI and bond investors risk aversion.
Foreign loans may become more attractive if the cost of funding of foreign banks falls relative to
the cost of funding of domestic banks due to looser monetary policy abroad. To test the relevance
of these alternative interpretations we proceed as follows:
1. In the case of the shift to bonds we let the coefficients and differ between firms
headquartered in countries that experienced a severe disruption in bond markets due to
heightened sovereign risk (GIIPS countries) and firms headquartered in other countries
(Not-GIIPS countries). If the shift to bonds is more significant for GIIPS corporates that
gives more credibility to the prior interpretation that the shift is due to the contraction in
bank credit rather than to the flight to quality in the bond market.
2. In the case of the shift to foreign loans we test the robustness of our estimates to adding as
a control variable the interaction between and the monetary policy rate abroad.
3. In addition, we test whether the difference in the spread between safe and risky borrowers
varies positively with CCI for bonds (indicating a positive correlation with a flight to
quality in the bond market) and negatively with CCI for foreign loans (indicating a
positive correlation with heightened search for yield among foreign lenders). For this we
estimate the following regression:
(2) ∑ ∑ ∗ ∑ ∗
Where spread is the cost of debt issued, are country*time fixed effects,∑ are issue type
fixed effects (bond, foreign loan, or domestic loan), and X is a vector of control variables including the
issue size, maturity, and issue purpose dummy (real investment purpose dummy). The other
variables are as previously defined (see Equation 1). Here too the inclusion of firm fixed effects

14
is important since otherwise, because of flight to quality or search for yield interest rate, spreads
across periods would not be comparable.
If >0, that indicates that the difference in the cost of bond debt between good and bad
borrowers widens during the credit crunch which is suggestive of CCI being positively correlated
with a flight to quality or liquidity in the bond market. That would cast doubt on the validity of
our prior interpretation.
If <0, that indicates that the difference in the cost of foreign debt between good and
bad borrowers narrows during the credit crunch, which is suggestive of CCI being positively
correlated with heightened search for yield among foreign lenders. Again that would cast doubt
on the validity of our prior interpretation.
iii. Currency risk transfer channel
Hypothesis 3 is tested using the following specification:
3 ∗ ∗ ∗
Where the left-hand side variable is a dummy that indicates if the loan issued is not in the
borrower home currency; RP is a vector of domestic (Euro) and foreign (Dollar) interbank risk
premium; Foreign indicates whether the lender is a foreign bank; and is a vector of control
variables including the borrower credit-quality, a dummy for whether the borrower has a natural
hedge against currency risk16, and the Euro-Dollar interest rate differential. The coefficients of
interest are , . A positive coefficient indicates that an increase in the cost
of funding in the borrower home currency reduces the probability that foreign banks lend in the
borrower home currency.
We run alternative specifications where we include triple interactions to test whether the
willingness of the borrower (or lender) to assume exchange rate risk vary with her natural hedge
against currency risk. We also run a specification where the main explanatory variable is the cost
of hedging against currency risk, the Euro basis, to assess how the spillover of money market
16 We measure this by whether she belongs to an export intensive sector (a sector with higher than median export sale to total sales)

15
disturbance to cross-currency swap markets affects the supply and demand of bank credit in
foreign currency (Hypothesis 4).
The specification reads as follows:
4 ∗ ∗ ∗ ∗ ∗
Where now also includes relevant partial terms and Hedged is a dummy that indicates
whether the firm belongs to an export intensive industry. If Hypothesis 4 is verified we should
obtain that 0 and 0.
iv. Real Effects of the Credit Crunch
To test Hypotheses 5 & 6 we estimate the difference in the change in employment and investment
during the credit-crunch for low-credit quality firms, between firms that have a relationship with
a foreign bank and firms that do not have such a relationship. The regression for the change in
real outcome R reads:
5 ∆ ∆ ∗ ∗ ∗
where ∆ is the lagged dependent variable; and are country and industry-sector fixed
effects; indicates whether the firm was rated below investment grade before the credit
crunch and capture the firm’s exposure to the credit crunch; is a vector of variables which
control for credit demand (cash holdings before the credit crunch, whether the last pre-crisis debt
issued was a credit line rather than a term loan or a bond, and whether the firm has a debt
maturing during the credit crunch), access to the bond market, and other relevant firm
characteristics (total assets and age). ( is a dummy that indicates whether
the firm belongs to a sector with higher (lower) than median export sales over total sales.
If foreign banking alleviates the financial constraint of firms we should expect to be
significant and negative only in the sample of firms that do not have a relationship with a foreign
bank. A firm with a foreign bank relationship is defined as a firm that has borrowed from a bank
headquartered outside the Eurozone at least once between 2003 and 2012 (our sample period).

16
Further if Hypothesis 6 is verified we should find that is not significantly different between
the sample of firms with and without a foreign bank relationship.
b. Data
Our benchmark sample covers the quarterly debt issuance of Eurozone non-financial corporates
during the period Q1-2003 to Q3-2013. The data source for bonds and syndicated loans is
Thomson-Reuters SDC platinum and Dealscan. We are able to distinguish between three sources
of finance: bonds, domestic syndicated loans, and foreign syndicated loans. For each form of debt
we observe the amount in US dollars, the purpose of the debt, the currency denomination, and
can separate real investment purpose debt and debt raised for other purposes such as mainly
refinancing and restructuring purposes (leveraged-buyouts, mergers and acquisitions). We also
obtain the (partially populated) spread to benchmark at issuance and maturity of the debt. We
include only non-convertible bonds and exclude mortgage backed-securities, asset-backed
securities, and preference shares which are listed as bonds. And include both term loans and
credit lines.
Foreign loans are defined as syndicated loans underwritten by at least one lead bank
headquartered outside the Eurozone. US banks participate in about 9% of all syndicates and other
foreign (i.e. extra-Eurozone) banks 20% on average over the sample period with peaks at 20%
and 30% respectively after 2008-Q3. Syndicated loans are often subscribed by more than one
lead bank, but we do not observe the contribution of each bank. In order to get a proxy for the
amount extended by foreign banks we prorate the total amount by the number of lead banks in a
syndicate.
The data are organized as a panel of firm-quarter observations with positive debt issuance over
the sample period. As our regression model includes firm fixed effects we eliminate firms that tap
only one source of finance because the coefficients in equation (1) can be identified only for
switchers, i.e. firms that switch from one source of finance to another.17
17 Hence our analysis will deliver lower band estimates of the real effect of the credit crunch because it misses firms that are excluded from all sources of finance.

17
We match the firm-level data with macroeconomic variables used in the analysis. The credit
contraction index (CCI) is from the ECB bank lending survey and measures the net percentage of
banks that report having tightened their lending standard for large firms in the past 3 months.
Although the method of calculation of this index is not harmonized across countries that does not
affect our analysis because our regressions include firms fixed effects. Three countries for which
the index is not available, Greece, Finland, and Belgium, are excluded from the sample. We use
the Fed fund target from Datastream to proxy for the stance of monetary policy abroad. This is
motivated by the fact that US banks are the main source of bank finance from abroad.
Table 1 reports summary statistics for the variables issued in regressions (1), (2), and (3) for the
sample of firms that issue both bonds and loans (Panel A); the sample of firms that issue both
domestic and foreign loans (Panel B); and the sample of firms that issue both foreign and
domestic currency denominated syndicated loans (Panel C). Non-investment grade firms
represent about one third of the observations in both samples. Bond spreads at issuance are
calculated as yields above the equal maturity ECB yield curve spot rate. Loan spreads at issuance
are all in drawn spreads above Libor. In Panel A, bonds represent 63 per cent of total debt issued,
the average spread to benchmark is about 137 basis points for bonds and 112 basis points for
loans, and maturity on average about 9 years for bonds (value weighted average by quarter) and 5
years for loans. The average spread for non-investment grade borrowers (all instruments
confounded) is 212 basis points and the average maturity 9 years indicating that low-credit
quality borrowers are charged higher spreads but borrow at longer maturities compared to high-
credit quality borrowers. Average issue size is above 1 billion USD. The characteristics of debt
instruments in the second sample are about the same. Here the share of bank debt subscribed by
at least one foreign bank is above 60 per cent.
The credit contraction index experienced important variations over the sample period from -7% at
the 10th percentile to 39.2% at the 90th percentile. Variations across country are important with
an earlier, more persistent, and deeper contraction of credit in southern countries. The period
covered also witnessed important fluctuations in the stance of US monetary policy with the
average quarterly fed funds target varying between 1.76% and 5.22%. Hence the importance of
controlling for US monetary policy, as loose monetary policy could trigger higher risky taking
18
among US banks and therefore would contribute also to explain changes in the pattern of
corporate financing across different types of Eurozone corporates.
In Panel B, foreign loans represent more than 60% of the sample. The sample is comparable to
the sample used in specification 1 as regards the characteristics of the debt issued, the
characteristic of the average borrower, and macroeconomic variables. In Panel C we report the
average interbank market risk premium for the domestic market and the US market and the
currency basis (the cost of hedging against EUR/USD exchange rate risk). The US premium
reached significantly higher values following the Lehman default and significantly lower values
since the break out of the Eurozone sovereign debt crisis. The currency basis is the difference
between the FX-swap implied dollar rate and the USD Libor 3 month, a measure of the cost of
hedging against EUR/USD exchange rate risk. The FX-swap implied dollar rate is calculated as
1 3 to which we add a spread which we assume to equal the difference
between USD Libor 3 M and Euro OIS 3 month. is the ratio between the EUR/USD 1 year
forward exchange rate and the spot rate. Rates and exchange rate data are downloaded from
Reuters. The currency basis experienced two peaks in Q4-2008 (Lehman collapse) and Q3-Q4
2011 (Greek crisis).
Table 2 summarizes the composition of our sample by country. Columns I and III show the
number of observations for the sample of firms with access to the bond market and for the sample
of firms with a foreign bank relationship by country. In column II the share of bond debt seems
high for Portugal and Austria which is attributable to the fact that we do not cover small loans. In
column IV the percentage of debt that are subscribed by foreign banks is generally high at around
60% on average (74% for Spain and Portugal), and the average prorated contribution of foreign
banks (column V) is about 35%. When we consider the full sample of firms with and without a
foreign bank relationship, the participation of foreign banks is much higher in foreign currency
loans than in domestic currency loans, 75% and 42%, respectively.
Figure 4 shows the sharp decline in syndicated lending since 2007 by loan purpose, with a more
immediate decline in real investment purpose loans.
To estimate regressions (4) and (5) we hand-matched the SDC data with the Bureau van Djink
Amadeus data which contains the number of employees by firm and firms’ balance sheet data.
19
We could exactly match 691 firms and after eliminating firms that reported zero total assets in
2007 we were left with a sample of 506 firms and nine countries. Of these 506 firms about half
are non-investment grade firms or leveraged firms, 116 have issued a bond over the SDC sample
period and 268 firms had a relationship with a foreign bank, which means that they borrowed at
least once from a foreign lead bank between 2003 and 2012.
Table 3 reports the descriptive statistics of the variables used in the regressions for the sample of
firms at the intersection of SDC and Amadeus. The sample is about equally split between firms
with and without a foreign bank relationship and risky and safe firms. We notice that about 20%
of the firms have debt maturing during the credit crunch and the same proportion had contracted
a credit line rather than a term loan or a bond pre-crisis initially due to mature after 2009.18 Both
proportions are significantly higher for the sample of firms that have a relationship with a foreign
bank. Another variable we obtain to capture the demand for credit is the cash to total assets ratio
in 2007. Cash includes bank accounts and cash equivalents such as marketable securities and
short-term government bonds.
The growth rate in the number of employees per firm (winsorized at the 1% and 99% level to
remove outliers) is on average -12% between 2007 and 2009, and twice higher in the sample with
a foreign bank relationship, suggesting that the fact that these firms had greater reliance on credit
lines, were slightly less liquid, and were more likely to have debt maturing during the credit
crunch, caused them to lay off more. Because firms with and without a foreign bank relationship
differ in all these dimensions which matter for employment it is important to control for all these
factors to be able to properly identify the role of foreign banking as a cushion against domestic
credit shocks.
Figure 5 shows that the drop in the number of employees per firm between 2005 and 2012
coincides with the timing of the credit crunch. We observe a decline already starting in 2006 but
this is due to an increase in the number of firms reporting to Amadeus in 2007, for this reason we
focus our analysis on the change between 2007 and 2009.
We also calculate investment growth as the ratio of the change in fixed assets between 2007 and
2009 scaled by tangible assets in 2007 (also winsorized at the 1% and 99% level to remove 18 This is meant to capture whether the firm raised an instable or a stable form of debt to cover its liquidity needs during the credit crunch.

20
outliers). We set negative values to zero. We next turn to the multivariate regression analysis of
our data testing one hypothesis at a time. This will allow accounting for confounding factors
which a simple comparison of means cannot do.
4. Results
This section is organized as follows. First, we document the switch to alternative forms of finance
in reaction to the credit crunch and discuss estimates of equation (1). We discuss estimates of
equation (2) which we use to assess the validity of our prior interpretation that borrowers
increasingly tap alternative sources of finance because they are credit constrained rather than
because these alternative sources of finance become more attractive due to (simultaneous) flight
to quality or search for yield. Then we assess the relevance of the currency risk transfer channel
using equation (3). Finally, we turn to the estimation of equation (4) which we use to study the
real cost of the credit crunch and the mitigating role of foreign banking.
a. Safe borrowers shift to bonds
In Table 4 we report estimates of equation (1) when the dependent variable is a dummy that takes
value 1 if the firms issues a bond and 0 if it issues a loan. Hence the estimates are interpreted as
average effects on the probability of issuing a bond. In column I, is positive and statistically
significant at the 5 per cent level and is negative and statistically significant at the 10 per cent
level, which confirms hypotheses 1: as domestic bank credit contracts investment grade firms
shift to bonds and non-investment grade firms shift to loans. The effect is also economically
significant: a contraction of credit from the 10th percentile to the 90th percentile is associated with
an increase 7.5 percentage point increase in the probability of issuing a bond for investment grade
firms and an 8 percentage point increase in the probability of issuing a loan for non-investment
grade firms.
Next we split the sample of firms into three size bins (large, medium, and small) and re-estimate
the coefficients and for firms falling in each bin. The results reported in column II confirm
that larger or more transparent firms have a better access to the bond market. For the investment
grade medium size firm a contraction of credit from the 10th percentile to the 90th percentile is

21
associated with a 9.7 per cent increase in the probability of issuing a bond. In contrast the effect
is insignificant for small firms irrespective of their credit quality and significantly different
statistically from the effect for large and medium size firms.
The fact that investment grade firms shift to bonds may be interpreted as evidence that they
experience a decline in bank lending and that the bond market acts as a shock absorber.
However, this interpretation fails if simultaneously to the contraction of credit the bond market
experiences a flight to quality. Indeed if that is the case one could suppose that investment grade
firms shift to bonds because bond finance becomes more attractive for them (see Figure 3). In
column III we report a first test for this competing interpretation. We estimate and for
firms headquartered in GIIPS countries and Not-GIIPS countries. There is evidence that bond
markets in GIIPS countries have witnessed important disruptions due to heightened sovereign
risk (Almeida et al, 2014). We find that is not significant for firms in the GIIPS countries but
is significant for firms in the countries that benefited from a flight to quality which casts doubt on
the validity of our initial interpretation and is suggestive of the fact that high-credit quality firms
shift to bonds not because they are financially constrained but because they enjoy a flight to
quality in the bond market. Further in columns IV to VI the shift to bonds is not significant
whatever the size of firms when we restrict the sample to real investment purpose debt, which are
expected to matter more for real outcomes like employment and investment. Throughout the
estimated difference in the shift to bonds between high credit quality and low credit quality firms
is robust to including country*quarter fixed effects.
All in all, at this stage we are not able to rule out the possibility that firms that increasingly tap
the bond market during the credit crunch do so because they benefit from a flight to quality and
not to compensate for a decline in bank lending.
b. Risky borrowers shift to foreign loans
In Table 5 we report estimates of equation (1) when the dependent variable is a dummy that
indicates whether a firm borrows from a foreign bank in a given quarter. In column I we confirm
that high credit quality firms shift away from loans ( < 0) and is positive but not
statistically significant. In column II we report the estimates for different size bins. Here
interestingly and in line with Hypothesis 2 we find that is bigger in magnitude, negative and

22
statistically significant for small investment grade firms. Indeed this result, combined with the
result reported in Table 4, indicates that this category of borrowers switches from foreign loans to
domestic loans.
is positive and statistically significant at the 5 per cent level for small non-investment grade
firms. In other words, the switch to foreign loans is economically and statistically significant for
low-credit quality and small firms, i.e., those firms that are most likely to be credit constrained
and have limited access to bond finance.
In column III we control for the fed funds target to account for the fact that the stance of foreign
monetary policy affects the supply of credit of foreign banks to low-credit quality Eurozone
firms. And consistent with Hypothesis 1, is positive and statistically significant for both
small and large firms. For small firms a contraction of credit from the 10th percentile to the 90th
percentile is associated with about a 15 percentage point increase in the probability to borrow
from a foreign bank.
In columns IV to VI, the previous results for non-investment grade firms are verified when we
restrict the sample to real investment purpose loans, whatever their size, low-credit quality firms
shift to foreign loans. And the fact that the estimates are not altered when we control for the
stance of monetary policy abroad suggests that the increased reliance on foreign loans is caused
by an increase in the demand for credit by credit-constrained firms rather than an increase in the
supply of credit by foreign lenders.
The estimated difference in the shift to foreign debt between high credit quality and low credit
quality firms is robust to including country*quarter fixed effects. And to using as dependent
variable the (prorated) proportion of the amount of debt extended by foreign lenders.
In order to strengthen our interpretation of the results we next turn to the estimation of equation
(2).
c. Competing interpretation: flight to quality or search for yield
The results are reported in Table 6. The dependent variable is the cost (spread) of new debt issued
in a given quarter and for three samples: the full sample, the sample of real investment purpose
debt, and the sample of non-real investment purpose debt.

23
In columns I and II we report the estimates for the spread on the full sample of debt issued and
for the sample of real investment purpose debt. As predicted is positive and
is negative but none of these estimates are significant statistically. Now if we focus on the sample
of non-real investment purpose debt for which we found the shift to bonds to be most significant,
we find that is positive, large, and statistically significant. Further we find that both
and are statistically insignificant consistent with Holmstrom and
Tirole (1997) who predict that credit crunches increase the interest rate spread between
intermediated debt and market debt. They further demonstrate that when both intermediary
capital and firm capital contract, the sign of the change in the interest rate depends crucially on
the change in the relative amounts of capital. Our estimates indicate that bonds become cheaper
than loans for investment grade borrowers and the contrary for non-investment grade borrowers.
In columns IV to VI, we re-run the regressions allowing the coefficients to be different for small
firms for which we found the shift to bonds to be weaker and the shift to foreign debt to be
stronger. Our findings are confirmed. In addition we find that the increase in the cost of domestic
bank debt is higher for small non-investment grade firms compared with small investment grade
firms during the credit crunch. In other words, firms that suffer most from the credit crunch are
small low-credit quality firms.
Importantly, with this additional tests we are not able to exclude the hypothesis that investment-
grade borrowers switch to bonds due to a flight to quality in bonds rather than due to a decline in
bank credit. Instead we can more firmly state that non-investment grade borrowers switch to
foreign loans because they are financially constrained rather than because foreign loans become
more attractive due to heightened search for yield.
Next we provide evidence through the estimation of equation (3) that foreign banks lend less in
the borrower home currency especially when the cost of funding in the borrower home currency
increases relative to the cost of funding in the lender home currency.
d. Currency risk transfer channel
Estimates of equation (3) are reported in Table 7. In column 1, we find that foreign banks
increasingly lend in their home currency (rather than the borrower home currency) when the
borrower home currency risk premium increases. Consistent with Hypothesis 3, an increase in the

24
Euro risk premium from the 10th to the 90th percentile is associated with a 26 percentage point
higher probability that a foreign bank loan is denominated in foreign currency. In columns II we
confirm that borrowers that have a natural hedge against currency risk are more willing to assume
the exchange rate risk. In column III the currency risk transfer channel remains significant if we
control for the interest differential between Eurozone and US. Here interestingly we confirm the
prediction of Aghion et al. (2004) and find that risky borrowers who deal with a foreign bank
increase their borrowing in dollar when the interest differential rises but not safe borrowers. In
column IV we find that the results are robust to the inclusion of country*year-quarter fixed
effects. In column V we test Hypothesis 4 using the currency basis instead of the interbank
premium. Here we find as expected that domestic banks reduce their supply of dollars to
exporters, in other words a domestic bank is less likely to lend in dollar to a borrower that has a
natural hedge against currency risk (an exporter) when the cost of synthetic dollar funding
increases. This effect is positive if the lender is a foreign bank (it is significant in column IV, but
not in column V). Further we find that exporters tap the currency swap market less (they borrow
more in dollar from foreign banks) as the currency basis rises. Instead when the currency basis is
zero they prefer borrowing from banks in Euro and exchanging the euro loan against dollars in
the swap market to benefit from a lower cost of dollar borrowing.
All in all, we find supporting evidence that foreign banks lend less in the borrower home
currency as the cost of funding in the borrower home currency increases so that a greater reliance
on foreign banks is increasingly associated with higher borrowing in foreign currency.
e. Robustness checks
In Table 8 we report two additional robustness checks. First we verify whether the shift to foreign
banks is driven by US banks being subject to Basel I regulation. Basel I does not attribute a risk
weight higher for risky corporates than for non-risky corporates potentially incentivizing US
banks to load onto risky corporate debt. To do that we first exclude loans extended by other
foreign banks from the sample and then loans extended by US banks for comparison. The results
are reported in columns I and II. For both samples we find the shift to US and non-US foreign
25
banks to be significant, however it is larger and more significant for non-US foreign banks which
indicates that the US banks are not driving our results.
Next, since most (95%) of the foreign currency lending is in dollar, we check whether the
currency risk transfer effect is driven by US banks; non-US foreign banks and domestic banks
being equally vulnerable to the dollar shortage. To do that we separate out the effect of the
increase in the Euro-risk premium and the currency basis for US and non-US foreign banks. The
results are reported in columns III and IV. In column III, we find that an increase in the Euro-risk
premium leads to a higher probability that a foreign bank lends in foreign currency (mostly
dollar) when the foreign bank is a US bank but not when it is a non-US foreign bank. The results
are robust if we exclude from the sample the few non-USD loans but become slightly weaker due
to small sample size. In column IV we confirm that an increase in the cost of synthetic dollar
funding affects non-US foreign banks and domestic banks similarly, both group of banks reduce
dollar lending when the basis rises (albeit not to exporters for the non-US foreign banks). In sum,
the currency risk transfer effect is mostly attributable to US banks’ lending more in dollar.
Next, irrespective of the currency in which foreign banks lend, we want to assess whether the
increased reliance of Eurozone corporates on foreign banks has real effects i.e. whether it has
contributed to mitigate the consequence of the credit crunch on employment and investment.
f. Foreign banking alleviates firms’ financial constraints
In Table 9 we report estimates of equation (5) when the dependent variable is either employment
growth (columns I and II) or investment growth (columns III and IV) between 2007 and 2009. In
columns I and III, we report estimates for the sample of firms without a foreign bank relationship
and in columns II and IV for the sample of firms with a foreign bank relationship. In line with
Hypothesis 5, low-credit quality firms do not downsize and do not cut investment more than high
credit quality firms in the sample of firms with a foreign bank relationship, but they do cut
investment more in the sample of firms without a foreign bank relationship. And the difference
between low and high-credit quality firms is economically significant if we compare the
estimates with mean investment growth (-1.452). Interestingly, we find that in the sample of
firms with a foreign bank relationship, firms downsize more if they contracted a credit line rather
than a term loan or a bond to cover their liquidity needs during the credit crunch but not in the

26
sample of firms without a foreign bank relationship (the estimate in column I is significantly
lower than in column II). This might suggest that foreign banks are more likely than domestic
banks to revoke credit lines in a crisis.19 Other results (unreported) indicate that in the full sample
firms which have a higher cash buffer in 2007 downsize less. Also, firms with access to the bond
market reduce investment less (column IV). This effect is not statistically different between the
samples of firms with and without a foreign bank relationship.
Importantly, we allow that transmission of the credit crunch to employment and investment to
vary for firms with and without a natural hedge against exchange rate risk. Consistent with
Hypothesis 6 we find that financially constrained firms (i.e. low-credit quality firms) downsize
more than other firms during the credit crunch when they have no natural hedge against currency
risk (column I). The difference in the coefficients between hedged and unhedged firms is
statistically significant. This may be attributable also to the fact that exporters have a larger
(global) client base and are therefore less vulnerable to local shocks. What is of more interest is
therefore the difference between firms with and without a foreign bank relationship. When the
dependent variable is employment, the difference in (equation 5) between column I and II is
not statistically significant. However when we turn to a more flexible adjustment variable,
investment growth, the difference in between column III and IV is insignificant for unhedged
firms but significant for hedged firms. Since foreign banks lend more in foreign currency than
domestic banks, the real benefit of having a relationship with a foreign bank is more important
for firms that have a natural hedge against currency risk. Arguably, employment is a less flexible
adjustment variable than investment due to labor market protection laws and hiring and firing
costs which may explain why this results holds only for investment growth.
In sum, the real consequences of the domestic credit crunch are weaker for low-credit quality
(exposed) firms that have a relationship with a foreign bank and for firms belonging to export
intensive sectors that would supposedly have a weaker mismatch between foreign-currency debt
and revenues. This is consistent with the theoretical prediction that risk-averse banks would cut
credit in foreign currency (or at least not augment it) when currency risk is transformed into
19 Acharya et al (2013) argue that credit lines are a less reliable form of finance in a crisis since banks retain the right
to revoke them when a firm is in financial distress.

27
credit risk rather than transferred to borrowers who can assume it (Shapiro, 1985). Further, the
additional cost of having to borrow in foreign currency is larger for firms without a natural hedge
against currency risk and this can eventually weigh on employment and investment growth.
Cowan (2006) predicts that if a bank knows that a firm is mismatched, it will pass on the
corresponding expected default costs immediately.
5. Conclusion
We have uncovered new mechanisms that explain cross-sectional and time-series variations in
foreign currency borrowing at the firm level. The existing literature emphasizes the role of
demand side factors in determining the currency denomination of debt, mainly the borrower’s
export intensity or foreign currency income and the interest rate differential between domestic
and foreign currency loans. In this paper we have shown that during liquidity crises supply side
factors matter more for low-credit quality firms: the lenders’ cost of funding in domestic currency
which alters both the supply of credit by domestic lenders and the currency risk management
strategy of foreign lenders (more precisely their willingness to assume currency risk or transfer it
to the borrower) is key in explaining higher foreign currency borrowing. By shifting attention to
funding issues as the constraint on bank lending, we have been able to explain changes in the
currency composition of debt. This could not be explained by a shock to bank capital alone as
such shock would tend to cause a reduction in credit across the board.
Our analysis also deliverers new results on the stabilizing role of foreign banks during crises. We
have shown that the real benefit of foreign banking is significant for foreign currency earners
(exporters). This suggests enhanced international risk sharing through global entrepreneurship
combined with global banking. While Eurozone banks have been the principal contributor to the
observed aggregate decline in international banking flows, non-Eurozone banks have experienced
the opposite trend taking advantage of the opportunity offered by the retreat of Eurozone banks
and increasing their share in cross-border credit including credit to Eurozone firms.

28
Finally, by showing that low-credit quality firms increasingly rely on foreign banks, we confirm
the theoretical prediction that the category of borrowers who suffer most from a credit crunch are
better served by financial intermediaries than by markets. Bond markets did not act as shock
absorbers for financially constrained corporates. The depth and duration of the great recession in
Europe is often explained by the over reliance of European corporates on bank finance and the
“underdevelopment” of the capital market. Multiple calls have been voiced to create better
conditions for firms to turn to markets when banks are distressed which culminated with
Commissioner Jean-Claude Junker’s idea to establish a so called capital markets union. 20 Our
analysis demonstrates that the bond market served firms that were least in need of finance, which
explains its timid role in mitigating the transmission of the credit crunch to the real economy. In
contrast, foreign banks proved to be more flexible due to monitoring, ease of renegotiation, and
their ability to diversify risk internationally. Foreign banking effectively contributed to alleviate
the financial constraint of poorly capitalized firms.
References
Acharya V. V., H. Almeida, F. Ippolito, and A. Perez (2013). Credit Lines as Monitored
Liquidity Insurance: Theory and Evidence. Journal of Financial Economics, 112 (3), 287-319.
Acharya V.V., T. Eisert, C. Enger, and C. Hirsch (2014). Real Effects of the Sovereign Debt
Crisis in Europe: Evidence from Syndicated Loans. Working paper NYU Stern
Acharya V. V. and O. Merrouche (2013). Precautionary Hoarding of Liquidity and the Interbank
Markets: Evidence from the Sub-Prime Crisis. Review of Finance 17, (1), 107-160
Acharya V. V. and N. Mora (2015). A Crisis of Banks as Liquidity Providers. Journal of
Finance, Volume 70, Issue 1, pages 1–43
20 “Political Guidelines for the Next European Commission”, Opening Remarks, Jean-Claude Junker, European Parliament, 15 July 2014. See also Financial Times, « Europe needs a more flexible financial market”, September 2014; Steven Majoor, “Capital Markets Union: building competitive, efficient capital markets trusted by investors”, President, European Securities and Markets Authority November 2014; Reuters, “A capital markets union could kick start growth in Europe”, October 2014.
29
Aghion, Ph., Bacchetta, Ph., and Banerjee, A. (2004). A Corporate Balance-sheet Approach to
Currency Crises, Journal of Economic Theory 119, 6–30.
Almeida, H., I. Cunha, and M. Ferriera, 2014. The Real Effects of Credit Ratings: The Sovereign
Ceiling Channel. Working paper
Angrist, J. and J. Pischke (2009). Mostly Harmless Econometrics, Princeton University Press
Baba, Noahiko, Frank Packer and Teppei Nagano, 2008, “The Spillover of Money Market
Turbulence to FX Swap and Cross-Currency Swap Markets,” BIS Quarterly Review (Basel,
March).
Becker, B. and Ivashina, V. (2014). Cyclicality of Credit Supply: Firm Level Evidence. Journal
of Monetary Economics, 62, 76-93.
Bentolila S., Jansen M., Jiménez G., and Ruano S. (2013). When Credit Dries Up: Job Losses in
the Great Recession. Working paper CEMFI
Bernanke, B. (1983). Nonmonetary Effects of the Financial Crisis in the Propagation of the Great
Depression. American Economic Review, 73 (3), 257-276
Broner, F., Didier, T., Erce, A., Schmukler, S. (2013). Gross Capital Flows: Dynamics and
Crises. Journal of Monetary Economics 60, 113-133.
Bruno V. and R. Hauswald (2013). The Real Effect of Foreign Banks. Working paper American
University
Buch M. and J. Suarez (2010). Deposit insurance and money market freezes. Journal ofMonetary
Economics, 57 (2010), 45-61
Burnside, C., Eichenbaum, M. and Rebelo S. (2004). Government Guarantees and Self-Fulfilling
Speculative Attacks. Journal of Economic Theory 119, 31-63.
Chodorow-Reich G. (2013). The Employment Effect of Credit Market Disruptions: Firm-Level
Evidence from the 2008-9 Financial Crisis. The Quarterly Journal of Economics, October PP 1-
59

30
Cingano F., F. Manaresi, E. Sette (2013). Does Credit Crunch Investments Down? New Evidence
on the Real Effects of the Bank-Lending Channel. Working paper Bank of Italy
Cowan K. (2006). Firm Level Determinants of Dollar Debt?. (Central Bank of Chile, Santiago),
Mimeo
Diamond D. (1991). Monitoring and Reputation: The Choice between Bank Loans and Directly
Placed Debt. The Journal of Political Economy, 99 (4), 689-721
Duchin, R. and Sosyura D. (2014), Safer Ratios, Riskier Portfolios: Banks’ Response to
Government Aid. Journal of Financial Economics (113), 1-28
Giannetti, M and Laeven, L. (2012). The Flight Home Effect: Evidence from the Syndicated
Loan Market during Financial Crises. Journal of Financial Economics, 104 (1), 23-43
Giannetti, M. and Laeven, L. (2012b). Flight Home, Flight Abroad, and International Credit
Cycles. American Economic Review 102, 219-224.
Haltenhof S. , L. Seung Jung, and V. Stebunovs (2014). The Credit Crunch and Fall in
Employment during the Great Recession. Journal of Economic Dynamics and Control, vol. 43,
pp. 31-57
Haselmann R. and P. Wachtel 2011. Foreign Banks in Syndicated Loan Markets. Journal of
Banking and Finance, Volume 35, pp 2679-2689
Holmstrom B. and J. Tirole (1997). Financial Intermediation, Loanable Funds, and the Real
Sector. The Quarterly Journal of Economics, 112 (3), pp 663-691
Horracea W.C. and R. L. Oaxacab (2006). Results on the Bias and Inconsistency of Ordinary
Least Squares for the Linear Probability Model. Economics Letters, Volume 90, Issue 3, p 321–
327
Ivashina, Victoria, David S. Scharfstein, and Jeremy C. Stein. (2012). Dollar Funding and the
Lending Behavior of Global Banks. NBER Working Paper No. 18528.

31
Jeanne, O. (2005). Why Do Emerging Economies Borrow in Foreign Currency? in Other
People’s Money, B. Eichengreen and R. Hausmann eds., Chicago: University of Chicago Press,
pp. 190-217.
Keloharju, M. and M. Niskanen (2001). Why Do Firms Raise Foreign Currency Denominated
Debt? Evidence from Finland. European Financial Management 7, 481-496.
Laeven L. and F. Valencia (2013). The Real Effects of Financial Sector Interventions during
Crisis. Journal of Money, Credit, and Banking, Volume 45, Issue 1.
McCauley, Robert N., Patrick McGuire, and Vladyslav Sushko (2015). Global Dollar Credit:
Links to US Monetary Policy and Leverage. BIS Working Paper No. 483.
Milesi-Ferretti, G.-M. and Tille, C. (2011). The Great Retrenchment: International Capital Flows
during the Global Financial Crisis. Economic Policy 66, 289–346.
Rose, A., Wieladek, T. (2014). Financial Protectionism: The First Tests. Journal of Finance 69,
2127-2149.
Schneider, M. and Tornell, A. (2004). Balance Sheet Effects, Bailout Guarantees and Financial
Crises. Review of Economic Studies 71, 883-913.
Shapiro A. (1985). Currency Risk and Country Risk in International Banking. Journal of Finance,
Volume 40, Issue 3, pages 881–891
Sufi A. (2007). Bank Lines of Credit in Corporate Finance: An Empirical Analysis. The Review
of Financial Studies. 22 (3), pp 1057-1088
Uhlig H. and De Fiore F. (2013). Corporate Debt Structure and the Financial Crisis. Working
paper ECB
Williamson S. (1987). Costly Monitoring, Loan Contracts, and Equilibrium Credit Rationing.
The Quarterly Journal of Economics, 102 (1), pp 135-146.

32
Table 1. Summary statistics SDC Platinum sample
This table reports the number of firm-quarter observations with positive debt issuance (column I), means (column II) and percentiles (columns III-V) for the variables used in our regressions reported in Tables 4, 5, and 6. In column VI we report the mean for debt issued for real investment purposes only. Panel A covers the sample of firms that have issued at least one bond in the sample period 2003-Q1 to 2013-Q3 and Panel B the sample of firms that have issued syndicated loans at least once with a foreign bank (headquartered outside the Eurozone) as lead bank. Panel C covers the sample of firms that issue both domestic and foreign currency denominated loans. Risky is a dummy that indicates whether a firm is rated non-investment grade. The Credit Contraction Index (CCI) is from the ECB bank lending survey and gives the net percentage of banks that report having tightened credit standards to large firms in the previous 3 months. Share of bond debt is the percentage of debt issued in the form of bonds. Share of foreign bank debt is the percentage of debt that is issued in the form of a syndicated loan for which at least one of the lead bank is a foreign bank. The Euro (Dollar) premium is the spread between the 3 month Euribor (Libor USD) and equal maturity Euro (Dollar) OIS. The Basis is the difference between the FX-swap implied dollar rate and the USD Libor 3 month, a measure of the cost of hedging against EUR/USD
exchange rate risk. The FX-swap implied dollar rate is calculated as 1 3 to which we add a spread
which we assume to equal the difference between USD Libor 3 M and Euro OIS 3 month. is the ratio between the
EUR/USD 1 year forward exchange rate and the spot rate. Rates and exchange rate data are downloaded from Reuters.
A. Sample of Firms with Bond Market Access
I II III IV V VI VARIABLES N Mean
All debtp10 p50 p90 Mean
Real Investment purpose debt
Risky 5,379 0.317 0 0 1 0.231 Credit Contraction Index (CCI) 387 11.610 -7 6 39.2 Fed funds target 43 1.76 0.23 1 5.22 Share of bond debt 5,379 19.77 0 0 100 46.96 Spread to benchmark 4,572 150.2 0 40 392.0 106.8 Maturity in months 4,227 87.54 36 70.13 132 89.07 Share of foreign bank debt 5,379 61.41 0 100 100 41.12 Issue size in USD billion 5,379 1.095 0.085 0.478 2.328 0.910

33
B. Sample of Firms with a Foreign Bank Relationship
C. Sample of Firms which issue both domestic and foreign currency denominated loans
(1) (2) (3) (4) (5) VARIABLES N Mean p10 p50 p90 Risky 1,118 0.264 0 0 1 Share of foreign bank debt 1,118 0.742 0 1 1 Euro premium 43 0.303 0.055 0.126 0.727 Dollar premium 40 0.312 0.073 0.135 0.750 Basis 43 0.239 -0.003 0.109 0.729 Share of foreign currency loans 1,118 0.670 0 1 1
I II III IV V VI VARIABLES N Mean
All debt p10 p50 p90 Mean
Real Investment
purpose debt
Risky 3,666 0.333 0 0 1 0.338 Credit Contraction Index (CCI) 387 11.610 -7 6 39.2 Fed funds target 43 1.76 0.23 1 5.22 Share of bond debt 3,666 63.08 0 100 100 80.21 Spread to benchmark 2,886 130.4 0 41.06 365 118.9 Maturity in months 2,792 94.24 39 72 131 104.7 Share of foreign bank debt 3,666 26.98 0 0 100 13.80 Issue size in USD billion 3,666 1.392 0.118 0.654 3 0.944

34
Table 2. Sample composition by country
This table reports the composition of our SDC platinum sample by country. The sample period is 2003-Q1 to 2013-Q3. Loans include both credit lines and term loans. Bonds are non-convertible bonds. We exclude also mortgage backed securities and preference shares which are listed as bonds in SDC. In column I we report the number of firm-quarters with positive debt issuance including only firms that issued at least one bond during the sample period; column II gives the number of bonds as a percentage of the total number of debt issuance; column III the number of firm-quarters with positive debt issuance including only firms that have a foreign bank relationship during the sample period (i.e. they borrowed at least once from a foreign lead bank); column IV the number of loans subscribed by a least one foreign lead bank as a percentage of the total number of debt issuance; and column V the amount of foreign bank loans prorated by the number of banks in a syndicate as a percentage of the total debt issued.
Country Firms with bond access Bond debt share
Firms with foreign bank relationship
Foreign bank share
Foreign bank share prorated
I II III IV V
Austria 156 64% 89 59% 23% Belgium 213 38% 205 74% 31% Finland 188 34% 290 72% 46% France 1197 51% 1605 63% 25% Germany 683 28% 1216 78% 36% Greece 108 57% 141 67% 38% Ireland 118 44% 147 67% 41% Italy 267 39% 394 71% 27% Luxembourg 131 61% 156 64% 34% Netherlands 646 68% 727 76% 44% Portugal 92 80% 70 77% 28%
Spain 376 60% 975 90% 34%
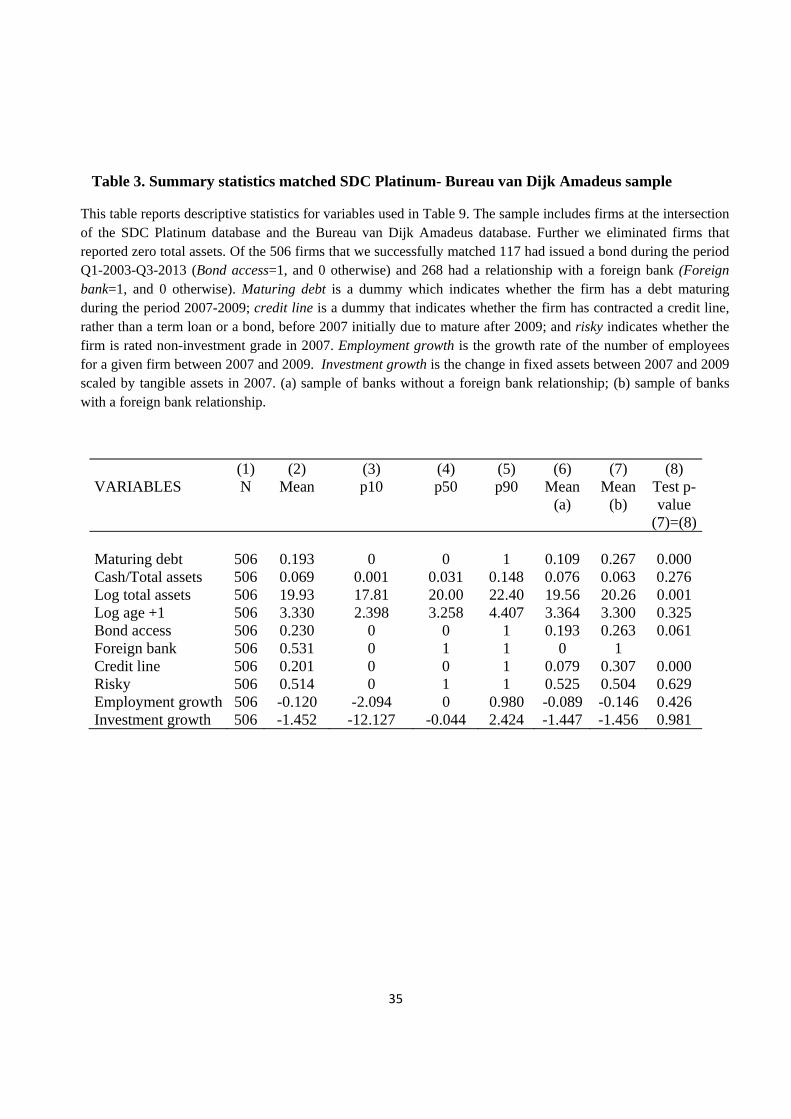
35
Table 3. Summary statistics matched SDC Platinum- Bureau van Dijk Amadeus sample
This table reports descriptive statistics for variables used in Table 9. The sample includes firms at the intersection of the SDC Platinum database and the Bureau van Dijk Amadeus database. Further we eliminated firms that reported zero total assets. Of the 506 firms that we successfully matched 117 had issued a bond during the period Q1-2003-Q3-2013 (Bond access=1, and 0 otherwise) and 268 had a relationship with a foreign bank (Foreign bank=1, and 0 otherwise). Maturing debt is a dummy which indicates whether the firm has a debt maturing during the period 2007-2009; credit line is a dummy that indicates whether the firm has contracted a credit line, rather than a term loan or a bond, before 2007 initially due to mature after 2009; and risky indicates whether the firm is rated non-investment grade in 2007. Employment growth is the growth rate of the number of employees for a given firm between 2007 and 2009. Investment growth is the change in fixed assets between 2007 and 2009 scaled by tangible assets in 2007. (a) sample of banks without a foreign bank relationship; (b) sample of banks with a foreign bank relationship.
(1) (2) (3) (4) (5) (6) (7) (8) VARIABLES N Mean p10 p50 p90 Mean
(a) Mean
(b) Test p-value
(7)=(8) Maturing debt 506 0.193 0 0 1 0.109 0.267 0.000 Cash/Total assets 506 0.069 0.001 0.031 0.148 0.076 0.063 0.276 Log total assets 506 19.93 17.81 20.00 22.40 19.56 20.26 0.001 Log age +1 506 3.330 2.398 3.258 4.407 3.364 3.300 0.325 Bond access 506 0.230 0 0 1 0.193 0.263 0.061 Foreign bank 506 0.531 0 1 1 0 1 Credit line 506 0.201 0 0 1 0.079 0.307 0.000 Risky 506 0.514 0 1 1 0.525 0.504 0.629 Employment growth 506 -0.120 -2.094 0 0.980 -0.089 -0.146 0.426 Investment growth 506 -1.452 -12.127 -0.044 2.424 -1.447 -1.456 0.981

36
Table 4. The shift to bonds
The dependent variable is a dummy which takes value 100 if the firm issues a bond and 0 if it issues a loan. Risky indicates whether a firm is rated non-investment grade. CCI is the credit supply contraction index i.e. the net percentage of banks reporting having tightened lending standards to large firms in the previous 3 months. A firm is classified as Large if its average issue size over the sample period is at least 1 billion; Medium if it is below 1 billion and above 500 million; Small if it is 500 million or below. GIIPS indicates whether the firm is headquartered in Italy, Ireland, Spain or Portugal. Standard errors reported in parentheses are heteroskedasticity-robust and clustered by country*year. All columns include firm fixed effects and year-quarter fixed effects. We exclude firm-quarters with zero debt issuance and firms that never issued a bond during the sample period. + p<0.1; * p<0.05; ** p<0.01
I II III IV V VI
All Debt Real Investment Purpose Debt
Risky 41.991 41.813 42.201 36.248 36.259 36.225 (2.429)** (2.426)** (2.437)** (2.507)** (2.520)** (2.525)**
CCI*Not Risky 0.163 0.070 (0.064)* (0.088) CCI*Risky -0.171 -0.267 (0.100)+ (0.102)* CCI*Not Risky*Large 0.177 0.033 (0.087)* (0.118) CCI*Not Risky*Medium 0.211 0.145 (0.078)** (0.104) CCI*Not Risky*Small -0.052 -0.173 (0.099) (0.132) CCI*Risky*Large -0.318 -0.585 (0.182)+ (0.244)* CCI*Risky*Medium -0.123 -0.251 (0.124) (0.129)+ CCI*Risky*Small -0.090 -0.056 (0.157) (0.158) CCI*Not Risky*Not GIIPS 0.230 0.104 (0.069)** (0.091)
CCI*Risky*Not GIIPS -0.104 -0.254 (0.108) (0.109)*
CCI*Not Risky*GIIPS -0.033 -0.034 (0.118) (0.167)
CCI*Risky*GIIPS -0.398 -0.313 (0.199)* (0.288)
R2 0.16 0.16 0.16 0.19 0.20 0.19 N 3,666 3,666 3,666 2,015 2,015 2,015
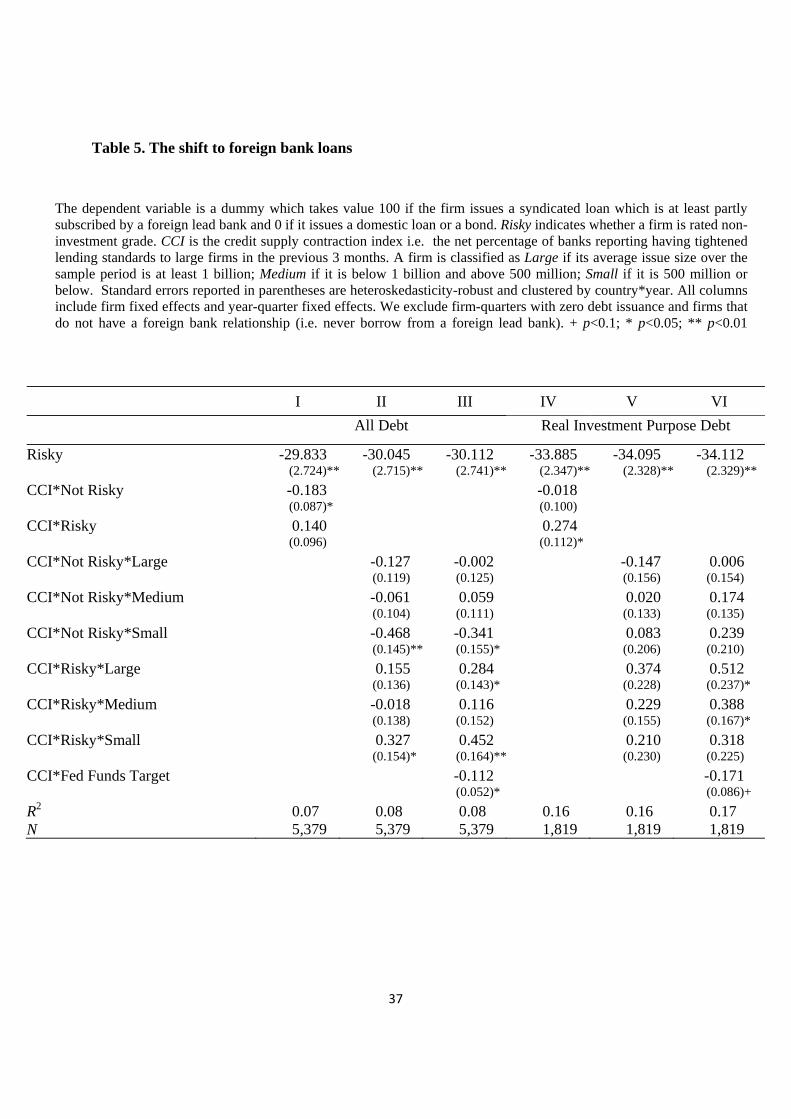
37
Table 5. The shift to foreign bank loans
The dependent variable is a dummy which takes value 100 if the firm issues a syndicated loan which is at least partly subscribed by a foreign lead bank and 0 if it issues a domestic loan or a bond. Risky indicates whether a firm is rated non-investment grade. CCI is the credit supply contraction index i.e. the net percentage of banks reporting having tightened lending standards to large firms in the previous 3 months. A firm is classified as Large if its average issue size over the sample period is at least 1 billion; Medium if it is below 1 billion and above 500 million; Small if it is 500 million or below. Standard errors reported in parentheses are heteroskedasticity-robust and clustered by country*year. All columns include firm fixed effects and year-quarter fixed effects. We exclude firm-quarters with zero debt issuance and firms that do not have a foreign bank relationship (i.e. never borrow from a foreign lead bank). + p<0.1; * p<0.05; ** p<0.01
I II III IV V VI
All Debt Real Investment Purpose Debt
Risky -29.833 -30.045 -30.112 -33.885 -34.095 -34.112 (2.724)** (2.715)** (2.741)** (2.347)** (2.328)** (2.329)**
CCI*Not Risky -0.183 -0.018 (0.087)* (0.100) CCI*Risky 0.140 0.274 (0.096) (0.112)* CCI*Not Risky*Large -0.127 -0.002 -0.147 0.006 (0.119) (0.125) (0.156) (0.154)
CCI*Not Risky*Medium -0.061 0.059 0.020 0.174 (0.104) (0.111) (0.133) (0.135)
CCI*Not Risky*Small -0.468 -0.341 0.083 0.239 (0.145)** (0.155)* (0.206) (0.210)
CCI*Risky*Large 0.155 0.284 0.374 0.512 (0.136) (0.143)* (0.228) (0.237)*
CCI*Risky*Medium -0.018 0.116 0.229 0.388 (0.138) (0.152) (0.155) (0.167)*
CCI*Risky*Small 0.327 0.452 0.210 0.318 (0.154)* (0.164)** (0.230) (0.225)
CCI*Fed Funds Target -0.112 -0.171 (0.052)* (0.086)+
R2 0.07 0.08 0.08 0.16 0.16 0.17 N 5,379 5,379 5,379 1,819 1,819 1,819
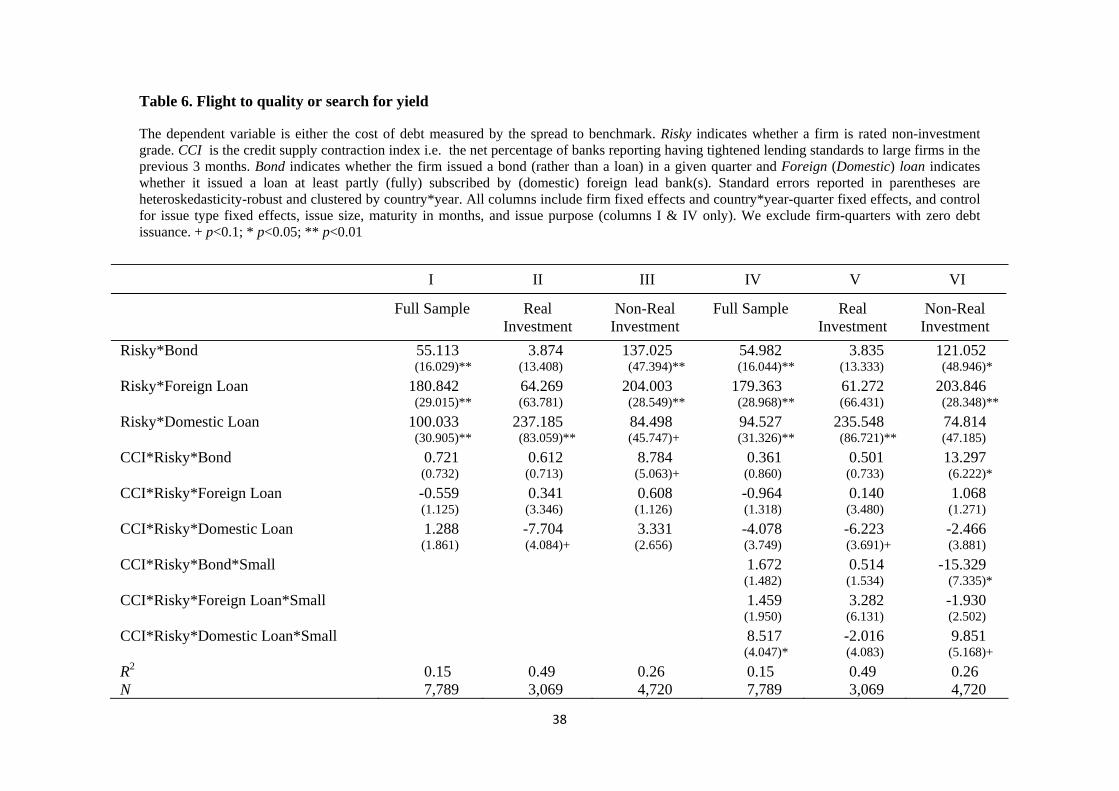
38
Table 6. Flight to quality or search for yield
The dependent variable is either the cost of debt measured by the spread to benchmark. Risky indicates whether a firm is rated non-investment grade. CCI is the credit supply contraction index i.e. the net percentage of banks reporting having tightened lending standards to large firms in the previous 3 months. Bond indicates whether the firm issued a bond (rather than a loan) in a given quarter and Foreign (Domestic) loan indicates whether it issued a loan at least partly (fully) subscribed by (domestic) foreign lead bank(s). Standard errors reported in parentheses are heteroskedasticity-robust and clustered by country*year. All columns include firm fixed effects and country*year-quarter fixed effects, and control for issue type fixed effects, issue size, maturity in months, and issue purpose (columns I & IV only). We exclude firm-quarters with zero debt issuance. + p<0.1; * p<0.05; ** p<0.01
I II III IV V VI
Full Sample Real Investment
Non-Real Investment
Full Sample Real Investment
Non-Real Investment
Risky*Bond 55.113 3.874 137.025 54.982 3.835 121.052 (16.029)** (13.408) (47.394)** (16.044)** (13.333) (48.946)* Risky*Foreign Loan 180.842 64.269 204.003 179.363 61.272 203.846 (29.015)** (63.781) (28.549)** (28.968)** (66.431) (28.348)** Risky*Domestic Loan 100.033 237.185 84.498 94.527 235.548 74.814 (30.905)** (83.059)** (45.747)+ (31.326)** (86.721)** (47.185) CCI*Risky*Bond 0.721 0.612 8.784 0.361 0.501 13.297 (0.732) (0.713) (5.063)+ (0.860) (0.733) (6.222)* CCI*Risky*Foreign Loan -0.559 0.341 0.608 -0.964 0.140 1.068 (1.125) (3.346) (1.126) (1.318) (3.480) (1.271) CCI*Risky*Domestic Loan 1.288 -7.704 3.331 -4.078 -6.223 -2.466 (1.861) (4.084)+ (2.656) (3.749) (3.691)+ (3.881) CCI*Risky*Bond*Small 1.672 0.514 -15.329 (1.482) (1.534) (7.335)* CCI*Risky*Foreign Loan*Small 1.459 3.282 -1.930 (1.950) (6.131) (2.502) CCI*Risky*Domestic Loan*Small 8.517 -2.016 9.851 (4.047)* (4.083) (5.168)+ R2 0.15 0.49 0.26 0.15 0.49 0.26 N 7,789 3,069 4,720 7,789 3,069 4,720

39
Table 7. Currency risk transfer
The dependent variable is a dummy that takes value 1 for foreign currency loans and 0 for domestic currency loans. Risky indicates whether a firm is rated non-investment grade. Foreign bank is a dummy which indicates whether one of the lead bank is a foreign bank. ERP is the Euro risk premium (the difference between 3 month Euribor and equal maturity OIS Euro) and DRP is the Dollar risk premium (the difference between 3 month Libor USD and equal maturity OIS USD). Idiff is the difference between Euribor 3 month and USD Libor 3 month. Basis is the Euro-Dollar currency basis. Hedged (Unhedged) indicates whether the borrower (does not) belong(s) to an export intensive sector. Standard errors reported in parentheses are heteroskedasticity-robust and clustered by country*year. All columns include firm fixed effects and quarter fixed effects. Columns (IV) and (VI) include country*year*quarter fixed effects. We exclude firm-quarters with zero issuance and firms that never borrow in foreign currency. + p<0.1; * p<0.05; ** p<0.01
I II III IV V VI
Risky -0.002 -0.002 -0.171 -0.201 -0.122 -0.120 (0.050) (0.050) (0.102)+ (0.149) (0.100) (0.152) Foreign Bank 0.031 0.021 0.025 0.053 0.180 0.256 (0.067) (0.067) (0.110) (0.200) (0.092)+ (0.159) ERP*Foreign Bank 0.391 (0.233)+ DRP*Foreign Bank -0.378 (0.116)** ERP*Foreign Bank*Hedged 0.565 0.980 1.020 (0.246)* (0.272)** (0.543)+ ERP*Foreign Bank*Unhedged 0.252 0.555 0.670 (0.252) (0.279)* (0.551) DRP*Foreign Bank*Hedged -0.467 -0.607 -0.793 (0.128)** (0.140)** (0.310)* DRP*Foreign Bank*Unhedged -0.302 -0.420 -0.480 (0.127)* (0.137)** (0.275)+ Foreign Bank*Hedged -0.238 -0.238 -0.320 -0.476 (0.131)+ (0.210) (0.128)* (0.202)* Foreign Bank*Risky 0.218 0.221 0.210 0.195 (0.114)+ (0.160) (0.112)+ (0.160) Idiff*Risky -0.215 -0.224 -0.237 -0.254 (0.074)** (0.106)* (0.071)** (0.098)* Idiff*Foreign Bank*Risky 0.228 0.288 0.260 0.333 (0.090)* (0.132)* (0.084)** (0.127)* Idiff*Foreign Bank -0.148 -0.160 -0.108 -0.146 (0.044)** (0.086)+ (0.045)* (0.083)+ Basis*Foreign Bank*Hedged 0.576 0.838 (0.153)** (0.264)** Basis*Hedged -0.323 -0.819 (0.156)* (0.253)** Basis*Foreign Bank -0.305 -0.310 (0.145)* (0.256) R2 0.10 0.11 0.13 0.47 0.13 0.48 N 1,048 1,048 1,048 1,048 1,118 1,118

40
Table 8. US banks versus other foreign banks
In columns I and II the dependent variable is a dummy that takes value 100 if the firm issues a foreign loan rather than a domestic loan or a bond. In columns III and IV the dependent variable is a dummy that takes value 1 for foreign currency loans and 0 for domestic currency loans. Risky indicates whether a firm is rated non-investment grade. US bank (Other foreign) is a dummy which indicates whether one of the lead bank is a US (non-US foreign) bank. ERP is the Euro risk premium (the difference between 3 month Euribor and equal maturity OIS Euro) and DRP is the Dollar risk premium (the difference between 3 month Libor USD and equal maturity OIS USD). Basis is the Euro currency basis. Hedged (Unhedged) indicates whether the borrower (does not) belong(s) to an export intensive sector. Regressions III and IV control for all relevant partial terms and the Eurozone-US interest differential and its double and triple interactions with Risky, US bank or Other foreign. Standard errors are heteroskedasticity-robust and clustered by country*year. All columns include firm fixed effects and quarter fixed effects. + p<0.1; * p<0.05; ** p<0.01
I II III IV
US banks Other foreign banks
Risky -24.401 -23.253 -0.160 -0.158 (2.801)** (2.267)** (0.113) (0.110) CCI -0.135 -0.005 (0.099) (0.118) CCI*Risky 0.187 0.339 (0.110)+ (0.121)** US bank -0.138 0.020 (0.091) (0.107)Other foreign -0.011 0.291 (0.087) (0.093)** ERP*US bank 0.867 (0.273)** ERP*Other foreign 0.528 (0.290)+ DRP*US bank -0.589 (0.146)** DRP*Other foreign -0.409 (0.144)** Basis*US bank -0.189 (0.152) Basis*Other foreign -0.549 (0.156)** Basis*US bank*Hedged 0.556 (0.183)** Basis*Other foreign*Hedged 0.828 (0.172)** Basis*Hedged -0.381 (0.142)** R2 0.09 0.05 0.12 0.13 N 3,309 4,145 1,048 1,118

41
Table 9. Employment and investment growth during the credit-crunch, foreign banking, and currency risk exposure
The dependent variable in columns I & II (III & IV) is employment growth (investment growth) for a given firm between 2007 and 2009. This table reports separate regressions for the sample of firms with and without a foreign bank relationship. Hedged (Unhedged) indicates firms belonging to sector with higher (lower) than medium export sales to total sales. Of the 506 firms 117 had issued a bond during the period Q1-2003-Q3-2013 (Bond access=1, and 0 otherwise). Maturing debt is a dummy which indicates whether the firm has a debt maturing during the period 2007-2009; credit line is a dummy that indicates whether the firm has contracted a credit line, rather than a term loan or a bond, before 2007 initially due to mature after 2009; Risky indicates whether the firm is rated non-investment grade in 2007. All regressions include 1-digit SIC code fixed effects and country fixed effects. Errors are clustered by country. + p<0.1; * p<0.05; ** p<0.
Without a foreign bank relationship
With a foreign bank relationship
Without a foreign bank relationship
With a foreign bank relationship
I II III IV Lagged dependent variable -0.128 -0.105 -0.900 -0.889 (0.060)+ (0.018)** (0.083)** (0.131)**
Risky*Hedged -0.003 0.005 -0.933 0.788 (0.074) (0.140) (0.217)** (0.316)*
Risky*Unhedged -0.321 -0.286 -0.562 0.187 (0.073)** (0.286) (0.202)* (0.521)
Bond Access -0.022 -0.008 1.264 0.257 (0.116) (0.105) (0.579)+ (0.449)
Cash 0.509 0.813 -1.090 1.111 (0.320) (0.462) (1.048) (0.962)
Credit Line -0.049 -0.202 0.891 0.110 (0.109) (0.080)* (0.471)+ (0.792)
Maturing Debt 0.101 -0.039 0.732 -0.616 (0.155) (0.132) (0.321)+ (0.353)
Log Total Assets -0.001 0.005 -0.210 -0.067 (0.027) (0.018) (0.104)+ (0.054)
Log Age +1 -0.162 -0.010 0.065 0.364 (0.063)* (0.078) (0.197) (0.237)
R2 0.18 0.12 0.43 0.35 N 238 268 238 268
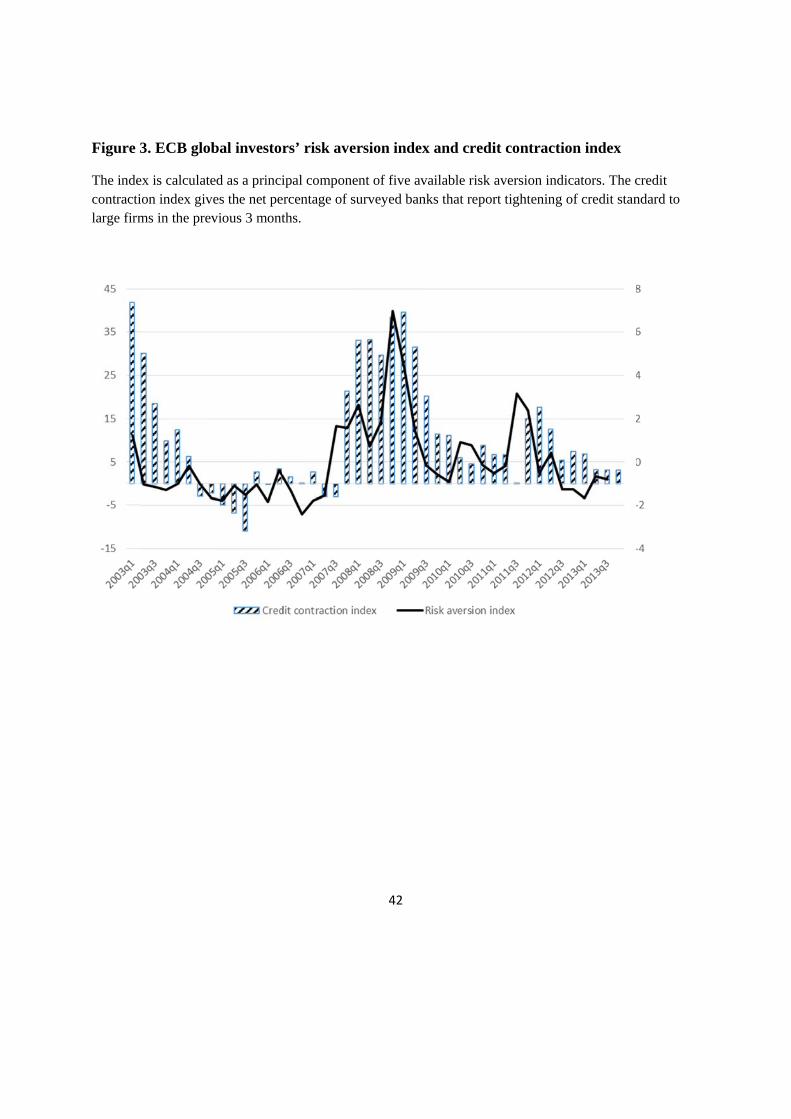
Figure 3
The indecontractilarge firm
3. ECB glob
ex is calculateon index giv
ms in the prev
bal investor
ed as a princives the net pevious 3 mont
rs’ risk ave
ipal componeercentage of sths.
42
ersion index
ent of five avsurveyed ban
x and credi
vailable risk anks that repor
it contracti
aversion indirt tightening
on index
icators. The cof credit stan
credit ndard to
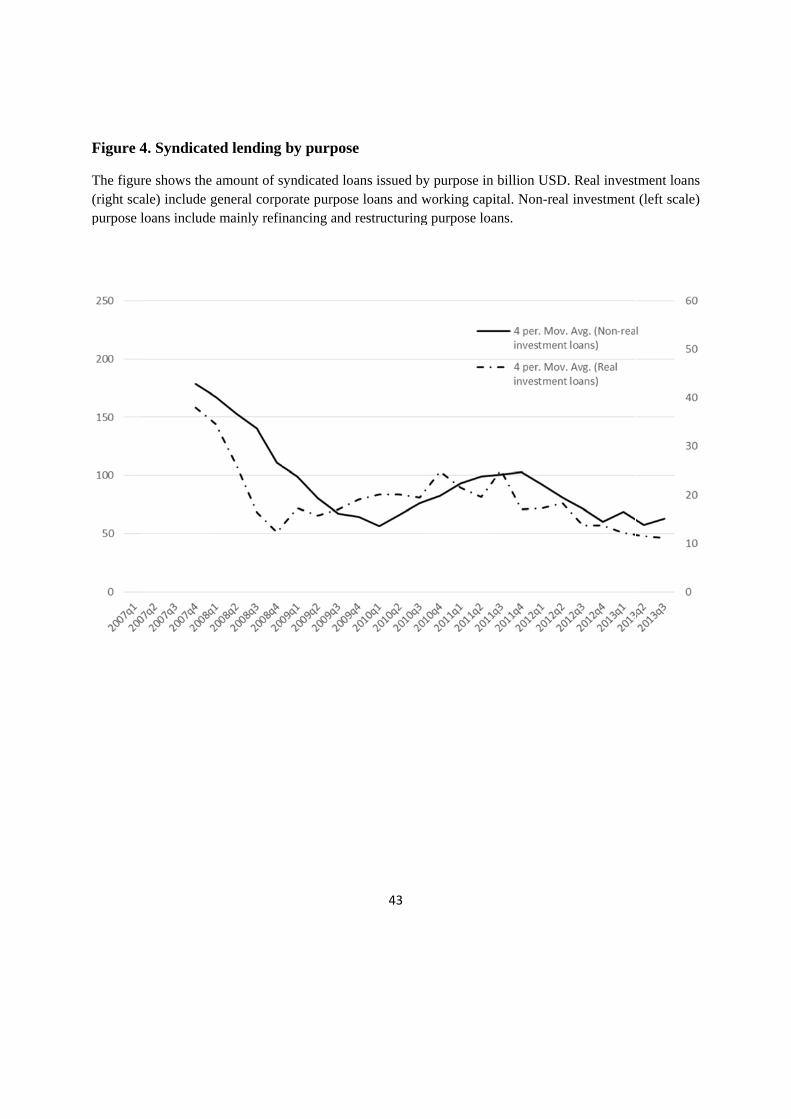
Figure 4
The figur(right scapurpose l
4. Syndicat
re shows theale) include gloans include
ted lending
amount of sgeneral corpoe mainly refin
by purpose
syndicated loorate purposenancing and
43
e
ans issued bye loans and wrestructuring
y purpose in working capig purpose loa
billion USDital. Non-reaans.
D. Real investl investment
tment loans (left scale)

Figure 5
The data platinum
5. Number of
are from Bum data.
f employees
ureau van Dji
per firm in
ink Amadeus
44
logarithm
s for the sampple of Eurozoone firms witth matched SSDC