GLOBAL CHINESE SHOPPERS - Fung Business Intelligence Shoppers... · SEPTEMBER 22, 2015 GLOBAL...
33
SEPTEMBER 22, 2015 GLOBAL CHINESE SHOPPERS THE $200 BILLION OPPORTUNITY DEBORAH WEINSWIG Executive Director—Head of Global Retail & Technology Fung Business Intelligence Centre [email protected] New York: 646.839.7017 • Chinese tourists are now the biggest global spenders and the momentum will continue, reflecting the expanding Chinese middle class and a growing base of passport holders. • The typical Chinese traveler spends around US$1,678 on retail purchases per overseas trip. The farther they travel, the more they shop. • Total overseas spending by Chinese tourists will jump 23% to US$229 billion in 2015, and by 2020, FBIC Global Retail & Technology projects US$422 billion. • The most popular overseas shopping categories are clothing, footwear and accessories (bought by 56% of travelers), fragrances and beauty products (52%) and electronics (32%). • Total outbound passenger journeys will double by 2020, to approximately 234 million annually.
Transcript of GLOBAL CHINESE SHOPPERS - Fung Business Intelligence Shoppers... · SEPTEMBER 22, 2015 GLOBAL...

SEPTEMBER 22, 2015
GLOBAL CHINESE SHOPPERS THE $200 BILLION OPPORTUNITY
D E B O R A H W E I N S W I G E x e c u t i v e D i r e c t o r — H e a d o f G l o b a l R e t a i l & T e c h n o l o g y F u n g B u s i n e s s I n t e l l i g e n c e C e n t r e d e b o r a h w e i n s w i g @ f u n g 1 9 3 7 . c o m N e w Y o r k : 6 4 6 . 8 3 9 . 7 0 1 7
• Chinese tourists are now the biggest global spenders and the momentum will continue, reflecting the expanding Chinese middle class and a growing base of passport holders.
• The typical Chinese traveler spends around US$1,678 on retail purchases per overseas trip. The farther they travel, the more they shop.
• Total overseas spending by Chinese tourists will jump 23% to US$229 billion in 2015, and by 2020, FBIC Global Retail & Technology projects US$422 billion.
• The most popular overseas shopping categories are clothing, footwear and accessories (bought by 56% of travelers), fragrances and beauty products (52%) and electronics (32%).
• Total outbound passenger journeys will double by 2020, to approximately 234 million annually.

2
SEPTEMBER 22, 2015
DEBORAH WEINSWIG, EXECUTIVE DIRECTOR–HEAD OF GLOBAL RETAIL & TECHNOLOGY [email protected] US: 917.655.6790 HK: 852.6119.1779 CN: 86.186.1420.3016 Copyright © 2015 The Fung Group. All rights reserved.
TABLE OF CONTENT
EXECUTIVE SUMMARY 3
KEY FINDINGS 4
GLOBAL CHINESE SHOPPERS 6
THE MARKET: TRAVELER NUMBERS AND THEIR VALUE 17
MARKET FACTORS 21
FOCUSING ON THE HIGH END: RESHAPING LUXURY SHOPPING 24
RECENT EFFORTS TO COURT THE CHINESE TOURIST 27
IN CONCLUSION: HOW TO TAP A FAST-‐CHANGING MARKET 30
APPENDIX 32
3
SEPTEMBER 22, 2015
DEBORAH WEINSWIG, EXECUTIVE DIRECTOR–HEAD OF GLOBAL RETAIL & TECHNOLOGY [email protected] US: 917.655.6790 HK: 852.6119.1779 CN: 86.186.1420.3016 Copyright © 2015 The Fung Group. All rights reserved.
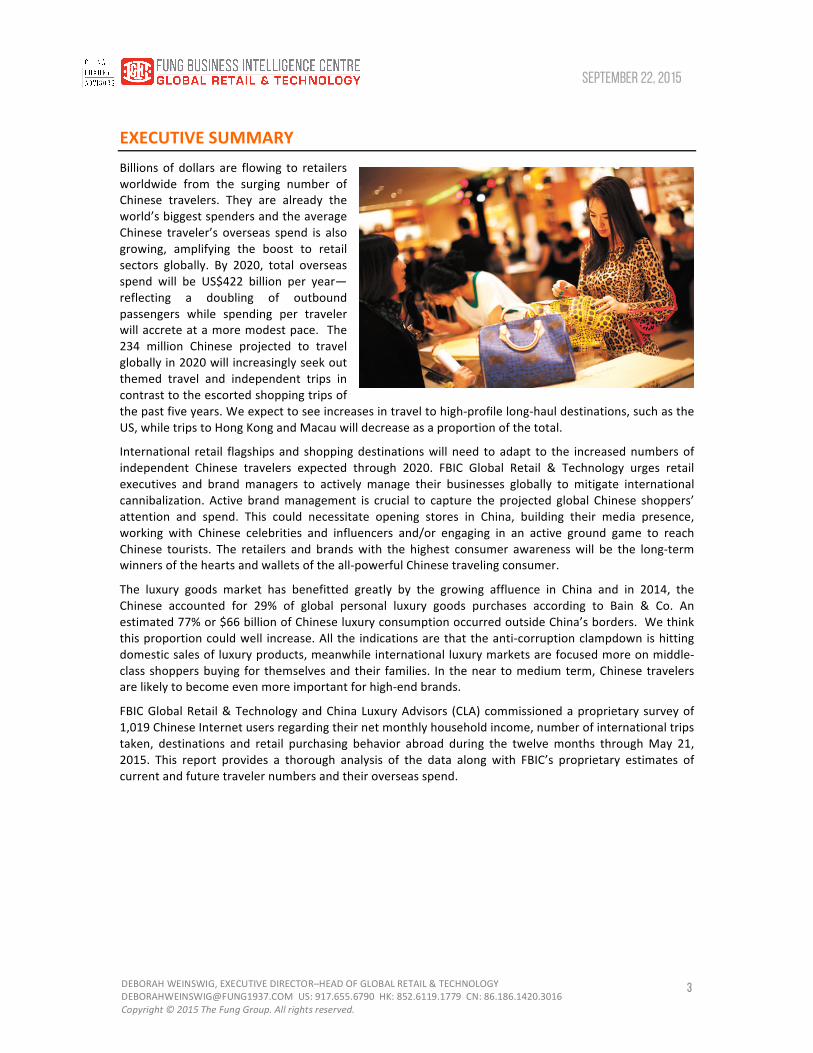
EXECUTIVE SUMMARY Billions of dollars are flowing to retailers worldwide from the surging number of Chinese travelers. They are already the world’s biggest spenders and the average Chinese traveler’s overseas spend is also growing, amplifying the boost to retail sectors globally. By 2020, total overseas spend will be US$422 billion per year—reflecting a doubling of outbound passengers while spending per traveler will accrete at a more modest pace. The 234 million Chinese projected to travel globally in 2020 will increasingly seek out themed travel and independent trips in contrast to the escorted shopping trips of the past five years. We expect to see increases in travel to high-‐profile long-‐haul destinations, such as the US, while trips to Hong Kong and Macau will decrease as a proportion of the total.
International retail flagships and shopping destinations will need to adapt to the increased numbers of independent Chinese travelers expected through 2020. FBIC Global Retail & Technology urges retail executives and brand managers to actively manage their businesses globally to mitigate international cannibalization. Active brand management is crucial to capture the projected global Chinese shoppers’ attention and spend. This could necessitate opening stores in China, building their media presence, working with Chinese celebrities and influencers and/or engaging in an active ground game to reach Chinese tourists. The retailers and brands with the highest consumer awareness will be the long-‐term winners of the hearts and wallets of the all-‐powerful Chinese traveling consumer.
The luxury goods market has benefitted greatly by the growing affluence in China and in 2014, the Chinese accounted for 29% of global personal luxury goods purchases according to Bain & Co. An estimated 77% or $66 billion of Chinese luxury consumption occurred outside China’s borders. We think this proportion could well increase. All the indications are that the anti-‐corruption clampdown is hitting domestic sales of luxury products, meanwhile international luxury markets are focused more on middle-‐class shoppers buying for themselves and their families. In the near to medium term, Chinese travelers are likely to become even more important for high-‐end brands.
FBIC Global Retail & Technology and China Luxury Advisors (CLA) commissioned a proprietary survey of 1,019 Chinese Internet users regarding their net monthly household income, number of international trips taken, destinations and retail purchasing behavior abroad during the twelve months through May 21, 2015. This report provides a thorough analysis of the data along with FBIC’s proprietary estimates of current and future traveler numbers and their overseas spend.

4
SEPTEMBER 22, 2015
DEBORAH WEINSWIG, EXECUTIVE DIRECTOR–HEAD OF GLOBAL RETAIL & TECHNOLOGY [email protected] US: 917.655.6790 HK: 852.6119.1779 CN: 86.186.1420.3016 Copyright © 2015 The Fung Group. All rights reserved.
KEY FINDINGS
Understanding the Overseas Shopper • Consumer research undertaken exclusively for FBIC Global Retail & Technology and China Luxury
Advisors found two-‐thirds of Chinese Internet users traveled overseas in the May 2014-‐May 2015 period.
• Hong Kong (with 12.9% of respondents visiting during the survey period), Thailand (10.3%), South Korea (9.5%) and Japan (7.3%) were the most popular destinations. During the survey period, 3.2% visited the US and 2.0% visited the UK.
• When we asked travelers how much they spent on shopping on their last trip, the most popular spending bands were US$407–US$815 and US$815–US$1,222, while 3% spent more than US$6,516 on retail purchases on their last trip abroad.
• The typical Chinese traveler currently spends around US$1,678 on retail purchases per overseas trip and the greater the distance, the more he/she spends. Average per-‐visitor retail spend in Europe or the US is double the spending level in nearby Hong Kong.
• The most popular overseas shopping categories are clothing, footwear and accessories (purchased by 56% of travelers), fragrances and beauty products (52%), electronics (32%), health supplements or vitamins (23%) and watches (20%).
• Our research suggests those Chinese travelers purchasing clothing, footwear and accessories or fragrance/beauty products overseas, tend to be lower-‐spending international shoppers. Those buying watches or jewelry overseas tend to spend more. To a significant degree, we believe this reflects differing price points of the categories.
A $229 Billion Market this Year, and $422 Billion by 2020 • Total overseas spending by Chinese tourists is expected to jump 23% in 2015 to US$229 billion.
• Chinese travelers in the aggregate are now the world’s biggest overseas spenders, and the gap with second-‐place US travelers is widening. This gap will only expand in the coming years.
• By 2020, we estimate, total overseas spend will reach US$422 billion—a projected 13% five-‐year CAGR.
• We believe spending in some high-‐profile long-‐haul destinations, such as the US, to grow at an even faster pace. Hong Kong and Macao will decrease as a proportion of overall Chinese tourist spending, as more travelers venture farther afield in Asia and around the world.
• An estimated 136 million international passenger journeys will originate in China in 2015, up 16% year over year. This comes after a 19.5% rise in journeys in 2014 to 117 million Chinese outbound international trips. Total outbound passenger journeys will double between 2014 and 2020, to approximately 234 million.
Future Travel Trends • We expect overall spending by Chinese tourists to maintain rapid growth, but we think growth in the
average spend per tourist will moderate in the coming years, reflecting the increased number of middle-‐income tourists travelling overseas.
• Tour groups will make up a diminishing proportion of Chinese overseas travel as a greater number of tourists feel confident about independent travel.
• Chinese tourists will increasingly visit smaller cities, and natural destinations such as national parks and nature preserves will see higher traffic from Chinese tourists.
5
SEPTEMBER 22, 2015
DEBORAH WEINSWIG, EXECUTIVE DIRECTOR–HEAD OF GLOBAL RETAIL & TECHNOLOGY [email protected] US: 917.655.6790 HK: 852.6119.1779 CN: 86.186.1420.3016 Copyright © 2015 The Fung Group. All rights reserved.
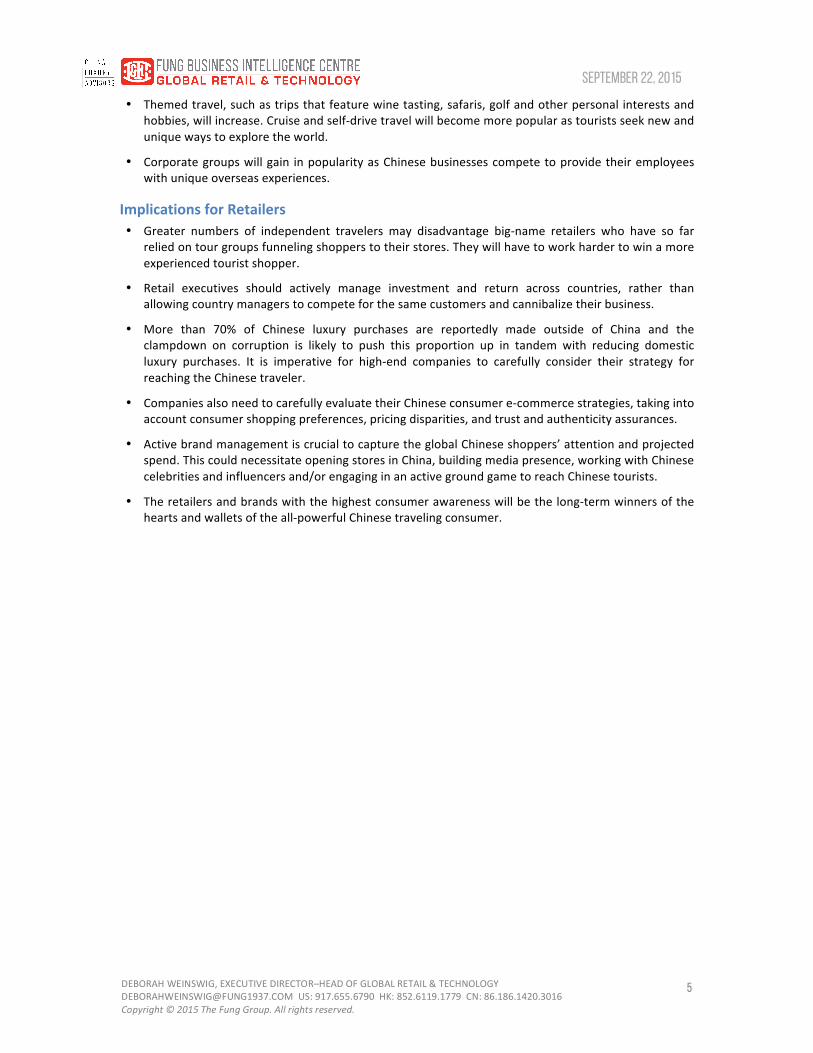
• Themed travel, such as trips that feature wine tasting, safaris, golf and other personal interests and hobbies, will increase. Cruise and self-‐drive travel will become more popular as tourists seek new and unique ways to explore the world.
• Corporate groups will gain in popularity as Chinese businesses compete to provide their employees with unique overseas experiences.
Implications for Retailers • Greater numbers of independent travelers may disadvantage big-‐name retailers who have so far
relied on tour groups funneling shoppers to their stores. They will have to work harder to win a more experienced tourist shopper.
• Retail executives should actively manage investment and return across countries, rather than allowing country managers to compete for the same customers and cannibalize their business.
• More than 70% of Chinese luxury purchases are reportedly made outside of China and the clampdown on corruption is likely to push this proportion up in tandem with reducing domestic luxury purchases. It is imperative for high-‐end companies to carefully consider their strategy for reaching the Chinese traveler.
• Companies also need to carefully evaluate their Chinese consumer e-‐commerce strategies, taking into account consumer shopping preferences, pricing disparities, and trust and authenticity assurances.
• Active brand management is crucial to capture the global Chinese shoppers’ attention and projected spend. This could necessitate opening stores in China, building media presence, working with Chinese celebrities and influencers and/or engaging in an active ground game to reach Chinese tourists.
• The retailers and brands with the highest consumer awareness will be the long-‐term winners of the hearts and wallets of the all-‐powerful Chinese traveling consumer.

6
SEPTEMBER 22, 2015
DEBORAH WEINSWIG, EXECUTIVE DIRECTOR–HEAD OF GLOBAL RETAIL & TECHNOLOGY [email protected] US: 917.655.6790 HK: 852.6119.1779 CN: 86.186.1420.3016 Copyright © 2015 The Fung Group. All rights reserved.
GLOBAL CHINESE SHOPPERS
Our Exclusive Consumer Survey What are the most popular destinations for Chinese travelers? How much do they spend on shopping overseas? And what product categories do Chinese travelers buy overseas?
To answer these questions and more, FBIC Global Retail & Technology and China Luxury Advisors commissioned an exclusive survey of Chinese consumers.
This section analyzes the results of our proprietary survey data to provide insight into the characteristics and behaviors of Chinese shoppers abroad. We have layered in demographic and income analysis where applicable.
Reading the Data The survey results show the percentage of respondents who have selected a certain response. All figures should be read as percentages of the respondent base.
The figures cited are representative of the online population of China. Subsamples of fewer than 50 respondents have not been charted because they are too small to include with accuracy. The fieldwork period for the research was May 18 to 21, 2015.
For our 2015 spend estimates based on our consumer data, we used an FX average rate for 1 Jan 2015-‐28 May 2015, from OANDA.com, resulting in an FX rate of 6.1387 RMB to US$1.00; or one RMB=US$0.169.
A Demographic Profile Of Survey Respondents
Figure 1. Net Monthly Household Income
Base: 1,019 Chinese Internet users aged 18+. Source: FBIC Global Retail & Technology and China Luxury Advisors
2%
7%
18%
18%
13%
19%
11%
5%
0% 5% 10% 15% 20%
$8,143 +
$4,072 -‐ $8,143
$2,443 -‐ $4,072
$1,629 -‐ $2,443
$1,303 -‐ $1,629
$644 -‐ $1,303
$326 -‐ $651
< $326 77% survey respondents had net monthly household income US$644 or more.
This equates to net annual household income US$7,728 or more.
The greatest number of survey respondents (19%) is in the US$644 –US$1,288 income band.
…followed closely by the US$1,610–US$2,415 and the US$2,415–US$4,025 income bands, tied in second place at 18%.

7
SEPTEMBER 22, 2015
DEBORAH WEINSWIG, EXECUTIVE DIRECTOR–HEAD OF GLOBAL RETAIL & TECHNOLOGY [email protected] US: 917.655.6790 HK: 852.6119.1779 CN: 86.186.1420.3016 Copyright © 2015 The Fung Group. All rights reserved.
Who Is Traveling And Where Do They Go?
Figure 2. Any Overseas Trip During the Survey Period, by Net Monthly Household Income (%)
Base: 1,019 Chinese Internet users aged 18+. Source: FBIC Global Retail & Technology and China Luxury Advisors
Figure 3. Any Overseas Trip During the Survey Period, by Age Group
Base: 1,019 Chinese Internet users aged 18+. Source: FBIC Global Retail & Technology and China Luxury Advisors
92% 94% 88%
74%
58% 55% 48%
37% 47%
$4,072 +
$3,257 -‐ $4,0702
$2,443 -‐ $3,257
$1,629 -‐ $2,443
$1,303-‐ $
1,629
$977 -‐ $1,303
$651 -‐ $977
$488 -‐ $651
< $488
46
74 76 68 67
18–24 25–34 35–44 45–54 55+
We began by asking respondents if they had been abroad in the past 12 months. If they had, what was their most recent overseas travel destination? Business trips as well as leisure travel are included and day trips were excluded.
Two-‐Thirds Traveled Abroad in the 12 Months Ended May, 2015
This average figure masks large differences in rates of overseas travel by affluence.
Participation in international travel increases in tandem with increases in household income, except at the two tails of income distribution.
Overseas travel is highest among 25-‐ to 44-‐year-‐olds at about 75%.
Professionals and young families likely contribute to this peak age.
A substantial two-‐thirds of the 45+ age group traveled abroad in the 12 months ended May 21, 2015.

8
SEPTEMBER 22, 2015
DEBORAH WEINSWIG, EXECUTIVE DIRECTOR–HEAD OF GLOBAL RETAIL & TECHNOLOGY [email protected] US: 917.655.6790 HK: 852.6119.1779 CN: 86.186.1420.3016 Copyright © 2015 The Fung Group. All rights reserved.
Figure 4. Most Recent Overseas Destinations Visited in During the Survey Period
* Total of UK, Italy, France, Germany, Spain and “Another European country.” Base: 1,019 Chinese Internet users aged 18+. Source: FBIC Global Retail & Technology and China Luxury Advisors
Higher-‐Income Consumers Travel Greater Distances Higher-‐income consumers are more likely to travel. 70% of our survey respondents have monthly household income in excess of $977 and accounted for 80% of Chinese international travelers. Our research also shows that more affluent consumers tend to travel farther.
In Southeast Asia:
• Hong Kong and Taiwan appeal to a relatively broad range of visitors by income, reflecting these countries’ historic ties to the People’s Republic as well as proximity.
• By contrast, countries such as Japan and Thailand see greater peaks and troughs: both tend to be more popular among relatively affluent consumers.
Note that, throughout this section, we chart demographic breaks only for selected countries and regions due to small subsample sizes.
34.2
7.0
7.5
0.4
0.7
0.4
1.0
1.4
1.5
2.0
2.1
3.2
5.7
7.3
9.5
10.3
12.9
0 10 20 30 40
No overseas trip/vacaqon in past 12 months
Any European country*
Another country
Russia
Another European country
Spain
Germany
France
Italy
UK/Great Britain
Macau
USA
Taiwan
Japan
South Korea
Thailand
Hong Kong
%
Next we looked at destinations according to their popularity.
Southeast Asia Remains Most Popular
With 12.9% of respondents visiting Hong Kong in the 12 months ended May 21, 2015, Hong Kong is the most popular destination for Chinese travelers.
The US is the top country destination outside of the Asia/Pacific region capturing 3% of Chinese travelers.
Europe, in total, draws more than twice as many travelers as the US at 7%.
The UK is the most frequently visited European destination for Chinese travelers at 2%.

9
SEPTEMBER 22, 2015
DEBORAH WEINSWIG, EXECUTIVE DIRECTOR–HEAD OF GLOBAL RETAIL & TECHNOLOGY [email protected] US: 917.655.6790 HK: 852.6119.1779 CN: 86.186.1420.3016 Copyright © 2015 The Fung Group. All rights reserved.
Figure 5. Most Recent Overseas Destinations Visited During the Survey Period (Selected Countries), by Net Monthly Household Income (US$)
Base: 1,019 Chinese Internet users aged 18+. Source: FBIC Global Retail & Technology and China Luxury Advisors
Figure 6. Percentage of Respondents Within Stated Monthly Household Income Brackets Who Visited Europe During the Survey Period
Base: 1,019 Chinese Internet users aged 18+. Source: FBIC Global Retail & Technology and China Luxury Advisors
0
5
10
15
20
25
30
< $651 $652 -‐ $977 $978 -‐ $1,303 $1,304 -‐ $1,629 $1,630 -‐ $2,443 $2,443 -‐ $3,257 $3,258 -‐ $4,072 $ 4,072 +
%
Hong Kong Thailand South Korea Japan Taiwan
11% 11% 10%
9%
4% 5%
4%
1%
$4,072 +
$3,257 -‐ $4,072
$2,443 -‐ $3,257
$1,629 -‐ $2,443
$1,303-‐ $
1,629
$977 -‐ $1,303
$651 -‐ $977
< $651
Farther afield, Europe sees a reasonably steady increase in visiting levels as income increases,
but still remains a destination for only 7% of those surveyed.
Those with monthly incomes greater than US$1,629 had a significantly greater propensity to travel to Europe than those with monthly incomes below US$1,629; a differential of 400 to 500 basis points.

10
SEPTEMBER 22, 2015
DEBORAH WEINSWIG, EXECUTIVE DIRECTOR–HEAD OF GLOBAL RETAIL & TECHNOLOGY [email protected] US: 917.655.6790 HK: 852.6119.1779 CN: 86.186.1420.3016 Copyright © 2015 The Fung Group. All rights reserved.
Figure 7. Breakdown of Respondents Who Visited Europe During the Survey Period, Sorted by Net Monthly Household Income
Base: 1,019 Chinese Internet users aged 18+.
Source: FBIC Global Retail & Technology and China Luxury Advisors
5%
12%
27%
24%
7%
12%
9%
2%
$8,143 +
$4,072 -‐ $8,143
$3,257 -‐ $4,072
$2,443 -‐ $3,257
$1,629 -‐ 2,443
$651 -‐ $1,629
$326 -‐ $651
< $326
Of those Chinese travelers who visited Europe in the twelve months ended May 21, 2015,
• 24% had net monthly household income in the US$1,610 to US$2,415 range,
• 17% had net monthly household income in the US$2,415 to US$3,220 range,
• 10% had net monthly household income in the US$3,220 to US$4,025 range, and
• 81% had net monthly household income in excess of US$966.
Chinese travelers to Europe skew to a higher income profile
• Compared to all survey participants, 27% of Chinese travelers to Europe have net monthly household income in the US$2,415 to US$4,025 range versus 18% of all survey participants
• At the US$1.610 to US$2,415 range income level, 24% of travelers to Europe were in this income band versus the 18% of all survey respondents.

11
SEPTEMBER 22, 2015
DEBORAH WEINSWIG, EXECUTIVE DIRECTOR–HEAD OF GLOBAL RETAIL & TECHNOLOGY [email protected] US: 917.655.6790 HK: 852.6119.1779 CN: 86.186.1420.3016 Copyright © 2015 The Fung Group. All rights reserved.
How Much Do They Spend? We asked respondents who had been abroad during the survey period how much they spent on retail purchases (i.e., shopping) on their last overseas trip. We asked them to exclude spending on services such as eating and drinking out.
Figure 8. Amount Spent on Retail Purchases During Most Recent Overseas Trip During the Survey Period
Base: 671 Chinese Internet users aged 18+ who have been on an overseas trip during the survey period. Source: FBIC Global Retail & Technology and China Luxury Advisors
Figure 9. Estimated Per Capita, Per-‐Trip Retail Spend by Chinese Travelers, by Destination, 2015
Data not available for all countries due to small subsample sizes in the survey.
Source: FBIC Global Retail & Technology and China Luxury Advisors
3%
3%
6%
8%
13%
13%
17%
20%
13%
$6,516 +
$4,887 -‐ $6,516
$3,258 -‐ $4,887
$2,444 -‐ $3,258
$1,629 -‐ $2,444
$1,222 -‐ $1,629
$815 -‐ $1,222
$407 -‐ $815
< $407
$1,678
$2,555 $2,548 $2,270
$1,922 $1,696
$1,290 $1,256
0
500
1,000
1,500
2,000
2,500
3,000
Glob
al
average US
Europe
total
Japan
South
Korea
Taiwan
Thailand
Hong Kon
g
Average Traveler Spends Nearly $1,700 on Retail
Our survey confirms the scale of shopping by Chinese travelers: fully 99% made a retail purchase on their last trip.
While the most popular spending range for Chinese travelers is US$407–US$1,222, a sizable proportion is spending more. In total, just over one in five Chinese travelers spent more than US$2,444 on retail purchases on their last overseas trip.
Based on our survey data, FBIC estimates that the typical Chinese traveler currently spends around US$1,678 on retail purchases per overseas trip.
The farther they travel, the more they spend on retail purchases. This reflects length of stay and purchasing opportunities along with income levels.
Our survey shows the average per-‐visitor retail spend in Europe or the US is twice the spending total of a visit to Hong Kong.
• Chinese visitors to the US spend the most on retail purchases; at $2,555, they spend 52% more than the $1,678 global average.
• Spending in Europe is a mere $7 less than spending in the US, at $2,548 and 52% more than the global average.
• Japan ranks third in spending per trip by Chinese visitors, at $2,270, 35% higher than the global average.
• Travelers to Hong Kong are,

12
SEPTEMBER 22, 2015
DEBORAH WEINSWIG, EXECUTIVE DIRECTOR–HEAD OF GLOBAL RETAIL & TECHNOLOGY [email protected] US: 917.655.6790 HK: 852.6119.1779 CN: 86.186.1420.3016 Copyright © 2015 The Fung Group. All rights reserved.
How Much They Spend, by Where They Visit
Below, we chart the raw survey data behind our regional per-‐visitor estimates: retail spending on the last trip abroad for each income band.
• The highest spending band, above CNY40,000 per visit, ranges from a low of 2% of Chinese travelers to South Korea and Thailand to a high of 6%, by visitors to Japan and Europe. Visitors to Hong Kong peak at CNY30,001 to CNY40,000 (US$4,888–US$6,516) spent per trip (by 2% of Chinese visitors).
• Among travelers to Europe, the most popular spending band is CNY15,001 to CNY20,000 (US$2,444–US$3,258), a full 4 to 6 times as much as the overall most popular spend band of CNY2,500 to CNY5,000 (US$407–US$815).
Figure 10. Amount Spent (CNY) on Retail Purchases During Most Recent Overseas Trip During the Survey Period, by Selected Destination
Base: 671 Chinese Internet users aged 18+ who have been on an overseas trip during the survey period. Data not charted for all countries due to small subsample sizes. Source: FBIC Global Retail & Technology and China Luxury Advisors
0
5
10
15
20
25
30
35
Hong Kong South Korea Thailand Taiwan Japan Europe total
%
Less than 2,500 2,500 to 5,000 5,001 to 7,500 7,501 to 10,000 10,001 to 15,000 15,001 to 20,000 20,001 to 30,000 30,001 to 40,000 More than 40,000

13
SEPTEMBER 22, 2015
DEBORAH WEINSWIG, EXECUTIVE DIRECTOR–HEAD OF GLOBAL RETAIL & TECHNOLOGY [email protected] US: 917.655.6790 HK: 852.6119.1779 CN: 86.186.1420.3016 Copyright © 2015 The Fung Group. All rights reserved.
How Much They Spend by Household Income
Larger incomes equate to higher spending abroad.
As we move up the income scale, we see spend levels shift away from the lower end of the spectrum (e.g., less than CNY2,500) and much greater numbers spending larger amounts (e.g., more than CNY40,000).
• 5% of the households with monthly income in the CNY15,001 to CNY20,000 range spent more than CNY40,000;
• 6% of the households with monthly income in the CNY20,001 to CNY25,000 range spent more than CNY40,000;
• 13% of the households with monthly income greater than CNY25,001 spent more than CNY40,000.
Figure 11. Amount Spent (CNY) on Retail Purchases During Most Recent Overseas Trip During the Survey Period, by Monthly Household Income (CNY)
Base: 671 Chinese Internet users aged 18+ who have been on an overseas trip during the survey period.
Source: FBIC Global Retail & Technology and China Luxury Advisors
0
5
10
15
20
25
30
35
6,000 or less
6,001 to 8,000 8,001 to 10,000
10,001 to 15,000
15,001 to 20,000
20,001 to 25,000
25,001 or more
%
Less than 2,500 2,500 to 5,000 5,001 to 7,500
7,501 to 10,000 10,001 to 15,000 15,001 to 20,000
20,001 to 30,000 30,001 to 40,000 More than 40,000
Amount Spent:
Household Income:

14
SEPTEMBER 22, 2015
DEBORAH WEINSWIG, EXECUTIVE DIRECTOR–HEAD OF GLOBAL RETAIL & TECHNOLOGY [email protected] US: 917.655.6790 HK: 852.6119.1779 CN: 86.186.1420.3016 Copyright © 2015 The Fung Group. All rights reserved.
What Do They Buy? We asked our survey respondents which types of products they had purchased on their most recent overseas trip.
Figure 12. Categories Bought During Most Recent Overseas Trip During the Survey Period
Base: 666 Chinese Internet users aged 18+ who have made a retail purchase on an overseas trip during the survey period.
Source: FBIC Global Retail & Technology and China Luxury Advisors
2%
10%
31%
16%
18%
19%
20%
23%
32%
52%
56%
Don’t know/can't recall
Other products
Other food or drink products
Alcoholic drinks
Jewelry
Tobacco products
Watches
Health supplements/vitamins
Electronics (e.g., smartphone, tablet computer, etc.)
Fragrances/beauty products
Clothing/footwear/accessories (e.g., handbags)
Apparel Leads in Popularity, Followed Closely by Beauty
Clothing, footwear and accessories comprise the most popular category, and beauty products rank a close second. More than half of the travelers bought items from these categories on their most recent overseas travels.
Luxury and prestigious brands are not the only popular shopping targets. Purchasing health supplements or vitamins abroad is highly popular, our survey confirms: nearly one-‐quarter of travelers bought this category on their latest trip.

15
SEPTEMBER 22, 2015
DEBORAH WEINSWIG, EXECUTIVE DIRECTOR–HEAD OF GLOBAL RETAIL & TECHNOLOGY [email protected] US: 917.655.6790 HK: 852.6119.1779 CN: 86.186.1420.3016 Copyright © 2015 The Fung Group. All rights reserved.
Product Category Drives Average Spend
Clothing/accessories and beauty shoppers tend to be among the lower-‐spending groups.
Figure 13 and Figure 14 chart how much respondents spent by what categories they bought:
Figure 13. Amount Spent (CNY) by Category During Most Recent Overseas Trip During the Survey Period
Base: 666 Chinese Internet users aged 18+ who have made a retail purchase on an overseas trip during the survey period. Source: FBIC Global Retail & Technology and China Luxury Advisors • Those buying clothing or beauty products tend to be at the lower end of the spending scale, with the
most popular spending band for these shoppers being US$815–US$1,222, perhaps because these categories dominate among midmarket consumers.
• Electronics buyers tend to register slightly higher average peak spending of US$1,629–US$2,444.
• Shoppers buying watches or alcoholic beverages (second graph below) tend to be spread across lower-‐ and higher-‐spending bands, possibly reflecting the types of categories more affluent shoppers are buying.
Figure 14. Amount Spent (CNY) by Category During Most Recent Overseas Trip During the Survey Period
Base: 666 Chinese Internet users aged 18+ who have made a retail purchase on an overseas trip during the survey period. Source: FBIC Global Retail & Technology and China Luxury Advisors
0
5
10
15
20
25
Clothing/footwear/ accessories
Fragrances/beauty products
Electronics
Health supplements/ vitamins
Watches
%
Less than 2,500 2,500 to 5,000 5,001 to 7,500 7,501 to 10,000 10,001 to 15,000 15,001 to 20,000 20,001 to 30,000 30,001 to 40,000 More than 40,000
0
5
10
15
20
25
30
35
Tobacco products Jewelry Alcoholic drinks Other food or drink products
Other products
%
Less than 2,500 2,500 to 5,000 5,001 to 7,500 7,501 to 10,000 10,001 to 15,000
15,001 to 20,000 20,001 to 30,000 30,001 to 40,000 More than 40,000

16
SEPTEMBER 22, 2015
DEBORAH WEINSWIG, EXECUTIVE DIRECTOR–HEAD OF GLOBAL RETAIL & TECHNOLOGY [email protected] US: 917.655.6790 HK: 852.6119.1779 CN: 86.186.1420.3016 Copyright © 2015 The Fung Group. All rights reserved.
Popular Shopping Destinations by Category
We analyzed what respondents bought on their last trip in conjunction with the destination visited:
• Hong Kong and Japan are popular for electronics.
• South Korea sees a higher-‐than-‐average proportion of clothing and beauty shoppers.
• Europe sees a much more even spread of shopping across categories, with higher shopping levels for categories such as tobacco and alcoholic beverages than many Southeast Asian countries. Clothing and beauty are purchased by 55% and 62% respectively of those surveyed who visited Europe.
Figure 15. Categories Bought, by Most Recent Overseas Destination During the Survey Period
Base: 666 Chinese Internet users aged 18+ who have made a retail purchase on an overseas trip during the survey period. Data not charted for all countries due to small subsample sizes. Source: FBIC Global Retail & Technology and China Luxury Advisors
0
20
40
60
80
Hong Kong Thailand South Korea Japan Taiwan Europe total
%
Clothing/footwear/accessories Fragrances/beauty products Watches
Jewelry Tobacco products Alcoholic drinks
Electronics Health supplements/vitamins Other food or drink products
Other products
17
SEPTEMBER 22, 2015
DEBORAH WEINSWIG, EXECUTIVE DIRECTOR–HEAD OF GLOBAL RETAIL & TECHNOLOGY [email protected] US: 917.655.6790 HK: 852.6119.1779 CN: 86.186.1420.3016 Copyright © 2015 The Fung Group. All rights reserved.
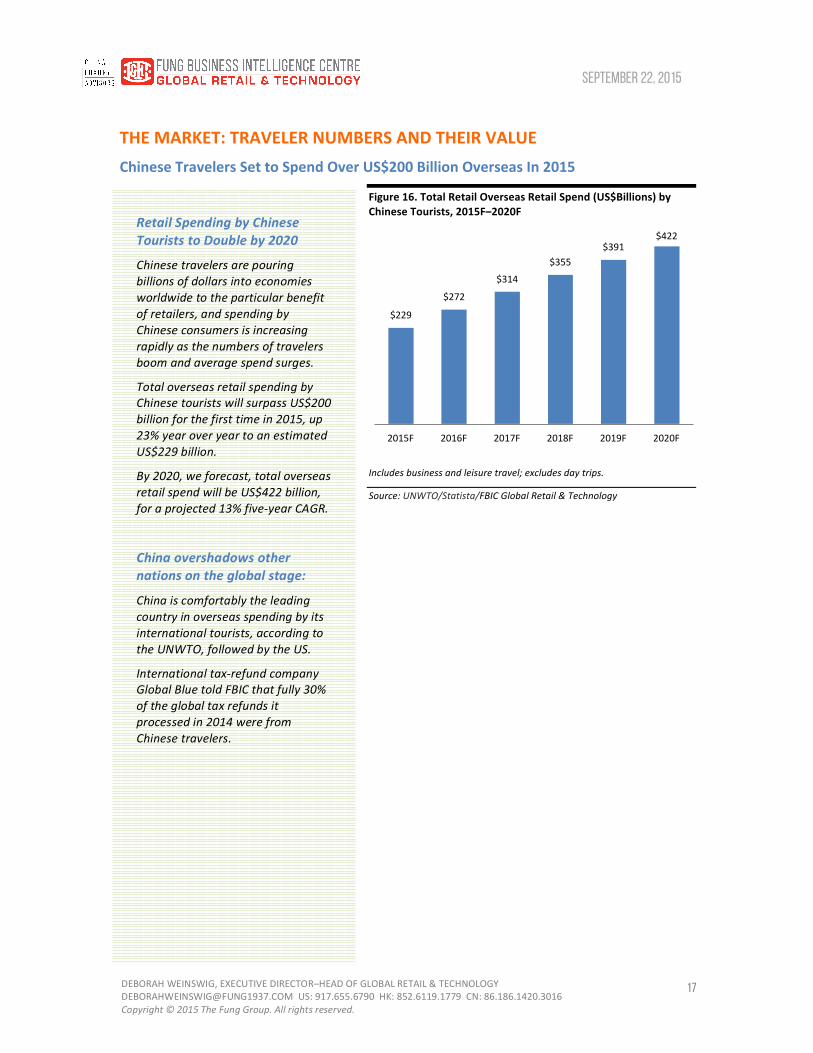
THE MARKET: TRAVELER NUMBERS AND THEIR VALUE Chinese Travelers Set to Spend Over US$200 Billion Overseas In 2015
Figure 16. Total Retail Overseas Retail Spend (US$Billions) by Chinese Tourists, 2015F–2020F
Includes business and leisure travel; excludes day trips.
Source: UNWTO/Statista/FBIC Global Retail & Technology
$229
$272
$314
$355 $391
$422
2015F 2016F 2017F 2018F 2019F 2020F
Retail Spending by Chinese Tourists to Double by 2020
Chinese travelers are pouring billions of dollars into economies worldwide to the particular benefit of retailers, and spending by Chinese consumers is increasing rapidly as the numbers of travelers boom and average spend surges.
Total overseas retail spending by Chinese tourists will surpass US$200 billion for the first time in 2015, up 23% year over year to an estimated US$229 billion.
By 2020, we forecast, total overseas retail spend will be US$422 billion, for a projected 13% five-‐year CAGR.
China overshadows other nations on the global stage:
China is comfortably the leading country in overseas spending by its international tourists, according to the UNWTO, followed by the US.
International tax-‐refund company Global Blue told FBIC that fully 30% of the global tax refunds it processed in 2014 were from Chinese travelers.

18
SEPTEMBER 22, 2015
DEBORAH WEINSWIG, EXECUTIVE DIRECTOR–HEAD OF GLOBAL RETAIL & TECHNOLOGY [email protected] US: 917.655.6790 HK: 852.6119.1779 CN: 86.186.1420.3016 Copyright © 2015 The Fung Group. All rights reserved.
Figure 17. Chinese GDP Per Capita 2010-‐2020E
Source: IMF
For 2015 we’ve extrapolated the survey-‐derived average spending figure of $1,678 for the 12 months ended May 21, 2015 and used this as the average per capita spending for all of 2015 for Chinese outbound travelers. This results in a total market spend of $229 billion. These figures compare with estimates from the UNWTO/China National Tourism Administration of average per capita overseas spending of $1,405 in 2014, or $165 billion. (See Appendix). The FBIC/CLA survey generates retail spending about 20% higher than the UNWTO/China National Tourism Administration data. We feel this can be explained by the exclusion of day trips and the inclusion of business trips within the FBIC/CLA data.
Another source, Visa, just released its Visa Global Travel Intentions Study 2015, prepared by Millward Brown, which has Chinese traveler as #3 in terms of the top spending nationality when travelling abroad. At a $4,780 level projected for 2015, the Chinese only trail the Saudis, at $5,866 and Egyptians, at $4,917. According to Visa’s report, Chinese tourist spending increased 25% between 2013 and 2015, which puts China in fifth place in terms of the pace of tourism spending growth.
Regardless of which figure chosen, it is clear, the Chinese traveler is important to retailers worldwide.
$4,437
$5,429
$6,194
$6,959
$7,589
$8,154
$8,659
$9,259
$9,936
$10,662
$11,449
0 2,000 4,000 6,000 8,000 10,000 12,000
2010
2011
2012
2013
2014
2015
2016
2017
2018
2019
2020
Per Capita Retail Spending Growth to Moderate Through 2020
To derive our forecasts, we looked at historic Chinese GDP growth and its relation to the number of international visitors. We used IMF estimated Chinese GDP growth through 2020 and assume an expanding middle class eager to travel abroad, and likely muting growth in average per capita spend.
Chinese GDP per capita is set to exceed US$8,000 in 2015, according to the IMF’s World Economic Outlook(Figure 17). This is the tipping point at which outbound tourism sees accelerated growth, reflecting improved affordability and consumers’ ability to pursue desires as their basic needs have been met. A look back at Japan, Korea and Taiwan reveals impressive outbound growth when per-‐capita GDP met the $8,000 benchmark. (According to CLSA’s Global Tourism report, both Korea and Taiwan saw outbound travel increase six-‐fold, and Japan, 21x, when the US$8,000 level was attained.)

19
SEPTEMBER 22, 2015
DEBORAH WEINSWIG, EXECUTIVE DIRECTOR–HEAD OF GLOBAL RETAIL & TECHNOLOGY [email protected] US: 917.655.6790 HK: 852.6119.1779 CN: 86.186.1420.3016 Copyright © 2015 The Fung Group. All rights reserved.
What to Watch For in Future Years
In forecasting Chinese tourism spending in the years ahead, we accounted for the following factors:
• Increases in the overall volume of Chinese tourists traveling overseas, among first-‐time travelers as well as repeat travelers who are becoming more savvy and traveling farther abroad.
• Greater propensity for businesses to sponsor incentive trips for their employees, including recent high-‐profile groups in Europe and the United States. With employers picking up their employees’ travel costs, individuals will have a greater propensity to spend money on shopping.
• Even with a potentially lower price difference between China and abroad, and with increased access to overseas goods online, Chinese consumers still want to purchase luxury goods overseas for cachet, better experiences, increased levels of trust and access to limited-‐edition items and merchandise that are hard to find China.
But there are also factors that could dampen estimates of future market growth:
• Major brands are beginning to take measures to decrease the price differential between markets, providing fewer incentives to stock up when traveling.
• E-‐commerce is making it easier for Chinese shoppers to buy the brands they want at overseas prices without leaving the country. Alibaba’s TMall recently launched this service, and we expect other e-‐commerce platforms to do the same as China’s e-‐commerce players seek market share for the gray or daigou market, in which individuals purchase products overseas and sell them on their Taobao storefronts in China.
• Rising middle-‐class incomes will have millions of Chinese poised to take their first overseas trips, joining group tours and visiting the world’s biggest cities and most popular destinations. Per capital spending growth is likely to moderate with the expected increase in middle-‐income tourists.
Because of these trends, we think average spend per tourist could decrease in coming years. We do not think this will happen in the immediate future—but our forecasts factor in a slowing of per capita spending growth in the years to 2020.
Figure 18. Estimated Per Capita, Per-‐Trip Retail Spend by Chinese Travelers, 2014–2016F
Source: FBIC Global Retail & Technology
$1,591
$1,678
$1,745
2014 2015 2016F
Retail Spend Per Traveler Nears $1,700
Our FBIC/CLA consumer survey suggests that the average Chinese traveler currently spends US$1,678 on shopping per overseas trip. Our estimates include business travelers as well as tourists.
In general, the farther consumers travel, the more they spend on shopping. Chinese visitors to Europe spend twice as much on shopping per trip as visitors to Hong Kong, based on responses to the FBIC/CLA survey.

20
SEPTEMBER 22, 2015
DEBORAH WEINSWIG, EXECUTIVE DIRECTOR–HEAD OF GLOBAL RETAIL & TECHNOLOGY [email protected] US: 917.655.6790 HK: 852.6119.1779 CN: 86.186.1420.3016 Copyright © 2015 The Fung Group. All rights reserved.
Spend in Context: How Many Travel? Traveler Numbers to Double by 2020
In addition to increasing per capita spend, an explosion in traveler numbers from China is underpinning the boom in overseas spending. Despite China’s impressive outbound-‐tourism growth in the last decade, it is still in a nascent stage with a penetration level of 7% (outbound tourists as a percent of total population). If we exclude Hong Kong and Macau, China’s outbound travel penetration is an even lower 3%.
A 19.5% rise in outbound passenger numbers took the total above 100 million journeys for the first time in 2014, according to part-‐year data from China’s National Tourism Administration. FBIC estimates total journey numbers will grow 16% to 136 million in 2015 and total outbound passenger journeys will double by 2020, reaching 234 million.
This projection is supported by the continued growth of the Chinese domestic economy and this growth lifting millions of Chinese into the middle class. Improved affordability, easing travel restrictions and the desire to travel support an incremental 100 million Chinese outbound travelers by 2020.
Figure 19. Total Outbound Chinese Journey Numbers, 2005–2020F
Includes non-‐tourists such as business travelers. Source: China Statistical Yearbook/China National Tourism Administration/FBIC Global Retail & Technology
Figure 20. Outbound Chinese Journey Numbers: Hong Kong and Macao vs. Rest of the World, 2013 and 2012
Source: China National Tourism Administration/Statista/FBIC Global Retail & Technology
31
35
41
46
48 57 70 83 98 117 136 15
6 176 19
5 215 234
0
50
100
150
200
250
2005
2006
2007
2008
2009
2010
2011
2012
2013
2014E
2015F
2016F
2017F
2018F
2019F
2020F
56.5 Million
65.5 Million
26.7 Million
32.6 Million
0% 20% 40% 60% 80% 100%
2012
2013
Hong Kong and Macao Rest of the World
A Look Back to Look Ahead
Looking at economic expansions in other regions, accelerated outbound tourism occurs when real per capital income hits the US$8,000 threshold. In Japan, Korea and Taiwan outbound tourism expanded significantly (sixfold to 21x) for these regions when hitting the per capita US$8,000 threshold. If the Chinese economy continues its 7% per annum growth, by 2020, most provinces will hit this threshold and the next stage of outbound tourism growth will begin.
Hong Kong and Macao Account for Majority of Journeys
Local journeys currently dominate Chinese outbound travel. In 2013 (latest available data), Hong Kong and Macao made up almost two-‐thirds of total Chinese outbound journeys.

21
SEPTEMBER 22, 2015
DEBORAH WEINSWIG, EXECUTIVE DIRECTOR–HEAD OF GLOBAL RETAIL & TECHNOLOGY [email protected] US: 917.655.6790 HK: 852.6119.1779 CN: 86.186.1420.3016 Copyright © 2015 The Fung Group. All rights reserved.
Figure 21. Total Outbound Journey Numbers: Top Five Countries of Departure, 2013
* Figures do not sum due to rounding.
Source: Euromonitor/China National Tourism Administration/UNWTO/FBIC Global Retail & Technology
MARKET FACTORS Visa Restrictions on Hong Kong Visits New regulations introduced in April 2015 restrict residents of the southern Chinese area of Shenzhen to just one visit per week to Hong Kong. The move by the Chinese government is intended to reduce the number of day-‐trippers, including parallel traders, undertaking cross-‐border shopping visits to Hong Kong.
Lower-‐value, everyday items make up the bulk of purchases on these local shopping trips, according to Goldman Sachs, with cosmetics, food, alcoholic beverages and tobacco the most popular categories for local cross-‐border shoppers. Concern about the quality and safety of such everyday goods in China is the principal driver.
Visitor numbers from China to Hong Kong jumped by 16% to 47 million in 2014, as more shoppers sought out products from the territory. Hong Kong officials expect the new rule to depress visits from China by 4.6 million in 2015.
The impact: Chinese day-‐trippers currently account for around 15% of retail spending in Hong Kong, according to the Australia & New Zealand Banking Group. Because of the new rules, the bank expects Hong Kong retail sales to stagnate in 2015. Goldman Sachs forecasts that Hong Kong could see a 5% fall in tourist spending for 2015 due to the restrictions.
51
56
62
94
HK/Macao, 66
Rest of World, 33
0 20 40 60 80 100 120
Russia
UK
US
Germany
China 98*
China Now the World’s Number One Outbound Visitor Nation
By 2013, China was only slightly ahead of Germany in total number of outbound journeys. (If we exclude visits to the Special Administrative Regions of Hong Kong and Macao, the global outbound total is significantly lower, at 32.6 million.
China’s population (1.36 billion in 2014) is 17 times Germany’s (80.8 million in 2014), underlining the huge potential for growth in Chinese outbound visitor numbers.
For data on where Chinese travelers go, what they buy and what they spend per trip, see the section “Global Chinese Shoppers”.
22
SEPTEMBER 22, 2015
DEBORAH WEINSWIG, EXECUTIVE DIRECTOR–HEAD OF GLOBAL RETAIL & TECHNOLOGY [email protected] US: 917.655.6790 HK: 852.6119.1779 CN: 86.186.1420.3016 Copyright © 2015 The Fung Group. All rights reserved.
It would be too optimistic to expect this to boost shopping at alternative international destinations, given that residents can still visit Hong Kong weekly and the bias toward lower-‐value purchases.
However, not all product markets are likely to take a hit. Luxury goods are more likely to be bought by longer-‐term visitors to Hong Kong than by day-‐trippers, according to Goldman Sachs. FBIC believes the restrictions are unlikely to have a great impact on high-‐end retail.
Ten-‐Year Visas
Chinese tourists will now be able to take multiple visits to the US and Canada under new ten-‐year visas. In a reciprocal arrangement, Chinese visitors can use one visa for multiple visits during the period covered by the visa. This does not affect how long they can stay during any one visit.
The impact: Easing visa restrictions can only provide a boost for visitor spending, with more repeat visits and travel to new destinations in the US. As visitors become more comfortable with the destination, they also are more likely to travel individually and not as part of a group. For similar reasons, the UK government has been seeking to align its more restrictive visa regime with the EU’s Schengen visa. Increasing Paid Time Off
Paid time off for Chinese workers is among the lowest in the world: the minimum requirement is just five days of paid leave annually, excluding 11 paid public holidays. (Additional days accrue after working for more than ten years.)
Since 2013, the government has been seeking to boost leisure spending by encouraging companies to offer more paid leave as an employee benefit. Although the minimum will not change, the government has stepped up supervision of its implementation with the aim of boosting tourism and leisure spending by 2020.
The impact: In the absence of further legislation, employers’ willingness to offer extra leave will largely depend on the job market: a tighter market will make companies work harder to attract employees, in turn making rewards more prominent and boosting paid time off.
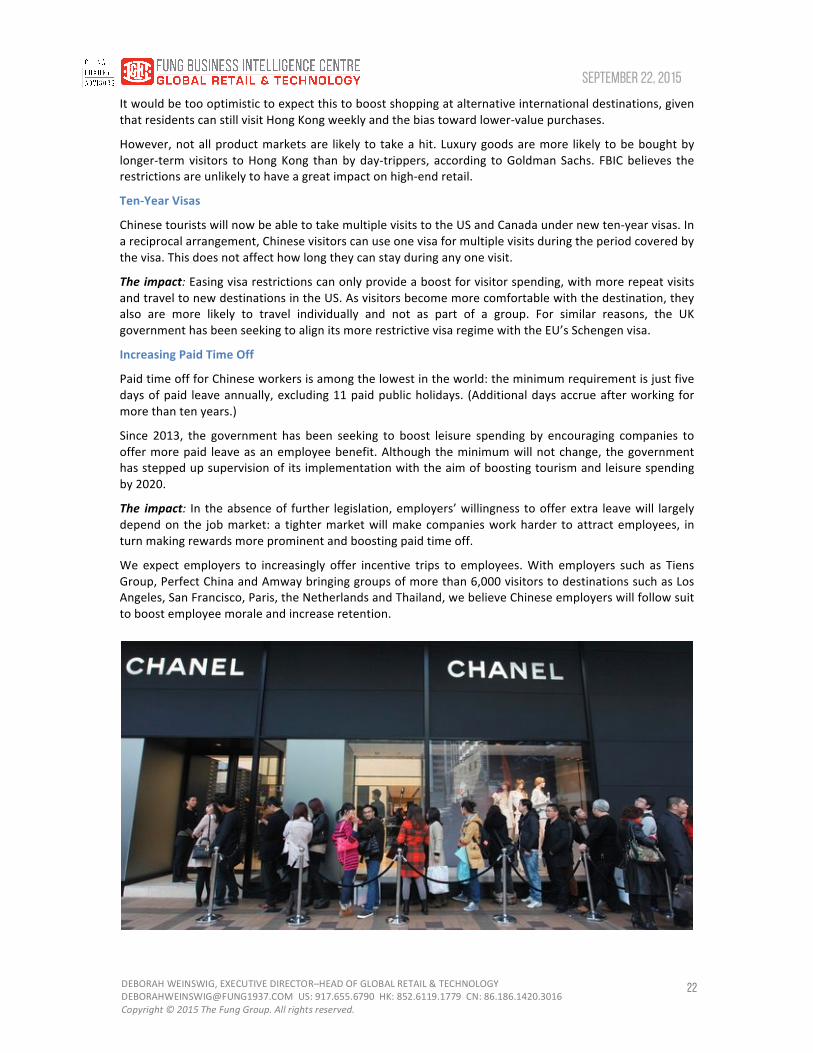
We expect employers to increasingly offer incentive trips to employees. With employers such as Tiens Group, Perfect China and Amway bringing groups of more than 6,000 visitors to destinations such as Los Angeles, San Francisco, Paris, the Netherlands and Thailand, we believe Chinese employers will follow suit to boost employee morale and increase retention.

23
SEPTEMBER 22, 2015
DEBORAH WEINSWIG, EXECUTIVE DIRECTOR–HEAD OF GLOBAL RETAIL & TECHNOLOGY [email protected] US: 917.655.6790 HK: 852.6119.1779 CN: 86.186.1420.3016 Copyright © 2015 The Fung Group. All rights reserved.
Pricing Disparities
A key driver for international shopping is the disparity in pricing between overseas markets (including Hong Kong) and mainland China.
Brands may be starting to cater to Chinese shoppers at home by eliminating these differences. Chanel, for instance, has slashed prices in China and Hong Kong and boosted them in Europe in an effort to reduce price differentials. Currency fluctuations—a weakening euro and a strengthening yuan—has other luxury brands considering global pricing strategies.
Although currency shifts can happen quickly, moves to standardize pricing may gain traction if shoppers begin to expect that companies will reduce or eliminate these price differences.
The impact: This is clearly a threat to overseas retail sales. For brand owners, though, a sale is a sale wherever it is made. The threat is more acute for shopping centers and multibrand retailers that rely on
tourism to sustain their revenues.
Parent Tourism
Growing numbers of Chinese students attend colleges and universities abroad. Some 459,800 students moved abroad to study in 2014, according to the Chinese Ministry of Education. The majority, 423,000 students—and their families—funded these trips, suggesting a degree of affluence.
This in itself can boost international retail sales, not least because friends and family in China may give shopping lists to students, who send their purchases home.
It also provides a second boost of outbound travel flows as parents visit their children abroad.
The impact: At the end of 2014, a total of 1.7 million Chinese were studying abroad, suggesting a substantial potential market of relatives and friends travelling to visit overseas students.
Figure 22. Ctrip Travel Agency Revenues: YoY Growth by Revenue Type
Source: Ctrip
15 18
29 24
30 28
36 34
45
36
13
40
Accomodaqon Transportaqon qckeqng
Packaged tour Corporate travel
2012 2013 2014
More Options for Independent Travelers
As more Chinese consumers become experienced travelers, the shape of the bookings market will change.
• Tour groups are likely to lose out to independent trips.
• Travel agencies could lose share to travelers building their own trips.
Data from major travel agency Ctrip already suggests a boom in standalone transportation and accommodation bookings and a decline in packages.
At the same time, newer businesses like internet pure plays and peer-‐to-‐peer booking sites such as Airbnb provide even more options for travelers seeking to make their own bookings.
The impact: A greater proportion of independent travelers may disadvantage big-‐name retailers who have so far relied on tour groups funneling shoppers to their stores. They will have to work harder to win a more experienced tourist shopper, including tailoring their marketing campaigns to the consumer market in order to attract individuals rather than tour organizers that are incentivized by commissions.

24
SEPTEMBER 22, 2015
DEBORAH WEINSWIG, EXECUTIVE DIRECTOR–HEAD OF GLOBAL RETAIL & TECHNOLOGY [email protected] US: 917.655.6790 HK: 852.6119.1779 CN: 86.186.1420.3016 Copyright © 2015 The Fung Group. All rights reserved.
FOCUSING ON THE HIGH END: RESHAPING LUXURY SHOPPING Anti-‐corruption measures, currency shifts, retooled pricing strategies and changes to China’s import tax regulations could reshape the global luxury market in the second half of 2015 and into 2016.
Three-‐Quarters of Chinese Luxury Spend Goes Abroad
Chinese shoppers made up fully 29% of the global market for personal luxury goods in 2014, according to Bain & Company. Out of a total luxury market worth US$296 billion, this means Chinese consumers spent US$86 billion on personal luxury goods.
Yet just US$20 billion was spent on such purchases in China, Bain reports. That means US$66 billion, or 77%, of Chinese consumption of luxury goods was overseas in 2014.
And we think this proportion could well increase. All the indications are that the anti-‐corruption clampdown is hitting domestic sales of luxury products. The international market for luxury is focused more on middle-‐class shoppers buying for themselves and their families, rather than for corporate gifting.
In July 2015, the two luxury conglomerates, LVMH and Kering, cited strong growth in sales to Chinese tourists in Europe and Asia as drivers to a pickup in their businesses. Burberry specifically called out France, Italy and Spain benefitting from tourism generally and the Chinese tourist specifically.
So in the short to medium term, Chinese travelers are likely to become even more important for high-‐end brands.
Figure 23. Historical Euro/CNY Exchange Rate
Source: Bloomberg
While prices for luxury goods have long been 30 to 40% higher on average than in Europe, currency fluctuations currently translate to a price differential of 60 to 80%. This encourages more purchases not only for personal use, but also for China’s thriving parallel trade (gray or daigou) market, in which Chinese consumers purchase items outside of China for resale within China.
Currency shifts have also had an effect on the luxury market in Switzerland. In January 2015, the Swiss National Bank dropped its minimum exchange rate policy, causing a significant jump in value for the Swiss franc, a move that raised prices for Swiss luxury goods in China.
In addition, over the course of the first half of 2015, market weakness in the US led the Federal Reserve to postpone an increase in lending rates, which caused a drop in the value of the US dollar. After reaching peak exchange rate of US$1.04 in March, the dollar has now lost almost 9% against the euro, currently standing at US$1.14. To date, there have been no obvious signs that US currency fluctuations have had an effect on Chinese tourist spending in the United States.
6
6.5
7
7.5
8
8.5
9
7/2/2012 7/2/2013 7/2/2014 7/2/2015
Currency
Enticed by a weaker euro, Chinese tourists have continued to travel and spend heavily in Europe in 2015. Chinese tourist spending in Europe rose 122% year over year in March 2015 following a 52% increase in February, according to Global Blue. These strong increases coincided with the continued slide of the euro in the first half of 2015, particularly in March. This exacerbated an already high price differential between stores in the EU and in mainland China.

25
SEPTEMBER 22, 2015
DEBORAH WEINSWIG, EXECUTIVE DIRECTOR–HEAD OF GLOBAL RETAIL & TECHNOLOGY [email protected] US: 917.655.6790 HK: 852.6119.1779 CN: 86.186.1420.3016 Copyright © 2015 The Fung Group. All rights reserved.
With respect to China, there is another side of the equation that many firms have underestimated: the renminbi (CNY). A housing bubble, the slowing economy and continued capital flight mean the Chinese currency remains a relative wild card on global exchanges. An unexpected devaluation of the CNY in 2015 could be a negative for luxury firms, particularly those that that have overextended themselves through aggressive retail expansion and investment in China.
Pricing
In response to the weakening euro and the subsequent influx of Chinese tourist-‐shoppers in search of relative bargains, in March 2015 Chanel launched an effort to unify prices worldwide. This initiative, rolled out in advance of an e-‐commerce launch, saw the French luxury house raise prices in Europe around 20% while dropping them 20% in mainland China and Hong Kong. In response to Chanel’s moves, other Western brands—among them Burberry and Tag Heuer—revised their pricing in China in an attempt to address the soaring price differential between Europe and mainland China.
In May 2015, China Luxury Advisors conducted a sentiment analysis across Chinese social media platforms to measure and observe the reaction of Chinese consumers to Chanel’s announcement. Discussion was lively, and a hashtag appeared on Weibo equivalent to #Chanelpricedecrease. While about 40% of consumers spoke positively of the price decrease, close to 60% had a negative reaction. Some welcomed the decision, saying they intended to buy quickly, but more consumers said Chanel “shouldn’t forget LV”—meaning the brand was at risk of overexposure—and others asked, “Where’s the exclusivity?” Chinese consumers engaged in gray-‐market sales (daigou) worried that “lower prices will leave us overseas buyers with less profit.”
Despite some prominent signs—notably photographs of customers lined up at Chanel stores in mainland China— that Chinese consumers could be enticed to buy locally through lower prices, the price differential between mainland China and Europe or the US remains significant, exacerbated by China’s high import taxes.
Taxes
After years of calls for action from consumers and high-‐profile businesspeople such as Wang Jianlin of Dalian Wanda, on June 1 China’s Ministry of Finance launched a pilot program to decrease import taxes for certain consumer goods. The effect will be big cuts in import taxes for suits, fur garments, footwear, cosmetics and disposable diapers.
However, a drop in the import tax is unlikely to cause a luxury sales boom within mainland China in 2015, given that the move affects only one of several taxes on high-‐value imports in China. The country’s value-‐added tax of 17% will remain intact, as will personal item postal taxes and consumption taxes. Overall, a drop in the import tax alone will do little to lessen overall prices for imported consumer goods, according to Jonathan Qiang Li of BorderX Labs. The effect on domestic luxury spending is expected to remain muted, and the Ministry of Finance has set no timeline on an expansion of the program to include other high-‐value consumer goods categories such as handbags, accessories or watches and jewelry.
What Lies Ahead for Luxury
Despite the shifting sands of currency fluctuations, changes in tax policy and luxury brand pricing strategies, the fundamental factors motivating Chinese consumers to purchase luxury goods outside of mainland China remain intact. This is unlikely to change in 2015, absent a major unforeseen economic downtown in China. Price is only one motivator among several, including
1. greater prestige,
2. more options,
3. better customer service, and
4. rising popularity of “experiential” travel.
For the traveling mainland Chinese, shopping and tourism are inextricably linked.

26
SEPTEMBER 22, 2015
DEBORAH WEINSWIG, EXECUTIVE DIRECTOR–HEAD OF GLOBAL RETAIL & TECHNOLOGY [email protected] US: 917.655.6790 HK: 852.6119.1779 CN: 86.186.1420.3016 Copyright © 2015 The Fung Group. All rights reserved.
Despite moves to address pricing discrepancies to boost sales in China, Europe will remain an aspirational travel and shopping destination for Chinese travelers, particularly those on packaged group tours, in 2015. However, a significant percentage of sales to Chinese consumers in Europe will most likely continue to be to those engaged in parallel trade. By some estimates, the gray market currently accounts for 20% to 40% of luxury sales in mainland China.
The move in November 2014 by the US to extend tourist visas for Chinese travelers from one to ten years will most likely cause a strong increase in the number of tourist arrivals, which have risen rapidly in recent years. In 2014, the United States saw 2.19 million mainland Chinese arrivals, a 21% year-‐over-‐year increase, and the rising popularity of investing in education, real estate and travel experiences in the US will likely positively impact luxury spending by Chinese non-‐residents in 2015.
In Hong Kong, the effects of China’s ongoing anticorruption crackdown and negative sentiment among local residents toward mainland Chinese tourist-‐shoppers are likely to continue to crimp sales for most major luxury brands. Luxury sales in Hong Kong fell 14% year over year in 2014, marking the city’s first decrease in annual luxury sales in 11 years, and total spend by mainland Chinese visitors dropped nearly 15% year over year in January 2015.
As wealthier mainland Chinese travel more frequently to Europe, Japan or the US for tourist experiences as well as shopping, a rising percentage of Chinese spending in the city will go toward lower-‐priced consumer goods such as powdered milk, diapers, household items and electronics. This creates a challenging situation for luxury brands such as Burberry, which saw profits in Hong Kong drop through June 2015. CLA Insight: “Chicken Little” Shrugs, Goes Shopping
Sage Brennan, Co-‐Founder
Recent data shows that in July 2015 — even as Xi Jinping was reportedly ordering China’s stock market regulators to propel its indexes upward ahead of an international diplomatic mission, and hedge fund managers were swooning in the wake of rumored economic weakness — Chinese travelers nonetheless intensified their gleeful assault on popular tourism destinations around the world.
America’s National Travel & Tourism Office (NTTO) reported last week that overall inbound passenger growth from China to the U.S. was up 25.7% year-‐over-‐year in July. Demand for travel to key gateways like Los Angeles, New York, San Francisco, and Chicago continues to grow, and Chinese carriers have answered the call, increasing overall capacity by 38% year-‐over year. The NTTO estimated total capacity on non-‐stop flights from China to the U.S. in July was 379,600 seats, up 27.7%.
Another key destination in the Chinese tourism universe, France, reported an even more impressive 50% gain in the first quarter of 2015. Many European retailers in our regular polls have seen order-‐of-‐magnitude sales growth from Chinese travelers this summer.
For several years, as much as 70% of spending on luxury goods by China’s citizens has been transacted outside its borders. Decades of pent-‐up demand for international travel and global shopping among Chinese consumers has driven overall travel volumes in both leisure and business segments, and spending levels continue to increase.
Across all sectors of the Chinese international travel industry, we continue to track expansion of tourism to a broader diversity of destinations, with independent travelers venturing further afield in search of unique experiences and shopping bargains.
CC Zhuang, CEO of leading travel booking site Qunar.com, feels that his company is “immune” to the economic downturn, saying during an earnings conference call on August 25, “Based on empirical evidence…leisure travel, our primary focus area, has been quite immune…July stats indicated that our growth momentum continued to be very strong across business lines.”
Added Zhuang, “We are also well positioned for any potential macro headwinds.”
Zhuang also outlined Qunar’s plans to launch an Expedia-‐like prepaid hotel option for customers this fall, taking on additional inventory risk with an eye to increasing lucrative five-‐star hotel bookings. This is a sure sign that the top end of hotel demand from China is expanding rapidly, while luxury bookers will “trade up” if they are given the option on a trusted Chinese booking platform.

27
SEPTEMBER 22, 2015
DEBORAH WEINSWIG, EXECUTIVE DIRECTOR–HEAD OF GLOBAL RETAIL & TECHNOLOGY [email protected] US: 917.655.6790 HK: 852.6119.1779 CN: 86.186.1420.3016 Copyright © 2015 The Fung Group. All rights reserved.
RECENT EFFORTS TO COURT THE CHINESE TOURIST
Spain: Long overshadowed as an aspirational destination by neighboring France, Spain is coming into its own among experiential Chinese tourists. Although Spain’s 288,000 mainland Chinese visits last year were a small fraction of France’s 2 million, Spain did see an impressive 14 percent year-‐over-‐year leap in 2014, according to Turespaña. More important for Spanish retailers, Chinese tourists have become the biggest foreign spenders in Spain, according to Turespaña, supplanting Russians last year for the first time and accounting for nearly one-‐third of total tourist revenue.
El Corte Inglés is Spain’s (and Portugal’s) only department store chain, and it has long focused on international travelers. The company was quick to recognize the potential of the Chinese traveler and in recent years began actively engaging and catering to that customer base.
El Corte Inglés focused its efforts on its flagship store in Madrid, Castellana, and has made strong progress in a short time. In addition to its initiatives to appeal to all international tourists, which include offering them a 10% discount, El Corte Inglés has made the following investments to increase business with Chinese tourists:
• The retailer renovated the ground floor of its flagship store to incorporate popular international brands such as Hermès, Louis Vuitton, Dior, Gucci and Bvlgari; unique brands that are made in Spain, such as Loewe; and Spanish gourmet products and souvenirs.
• Also in its flagship store, El Corte Inglés opened a high-‐end Chinese restaurant to provide more familiar dining options to Chinese customers and created a dedicated tax-‐free area for Chinese customers to reduce waiting time and provide more personalized service.
• The company has engaged in active outreach to the Chinese community and media, both in Spain and via frequent trips to China.
• It partnered with the Chinese bank-‐card issuer China UnionPay to offer payment options to Chinese customers.
• El Corte Inglés developed a Chinese-‐language website and launched Weibo and Weixin accounts to further engage with Chinese consumers, both in China and when they travel.
• The retailer executes multifaceted Chinese New Year campaigns each year, including an exhibition by Chinese fashion designers in 2014 and a collaboration with Chinese actress Liu Yan and ELLE China in 2015.
• It offers Chinese-‐language versions of its marketing and in-‐store materials, including signage, company information and history, gift guides and the company magazine.
The results of the program have been tremendous, the company says, with stronger brand recognition and traffic among Chinese customers visiting Spain over the past year.

28
SEPTEMBER 22, 2015
DEBORAH WEINSWIG, EXECUTIVE DIRECTOR–HEAD OF GLOBAL RETAIL & TECHNOLOGY [email protected] US: 917.655.6790 HK: 852.6119.1779 CN: 86.186.1420.3016 Copyright © 2015 The Fung Group. All rights reserved.
US: BEVERLY CENTER
The high-‐end shopping mall Beverly Center in Los Angeles, California, launched its China Ready Program in 2013 and has since reported double-‐digit increases in the number of customers from China. Chinese tourists now account for an overwhelming majority of the Los Angeles mall’s international tourist traffic as well as spending.
China is the number one overseas market for Los Angeles, which attracted 686,000
Chinese visitors in 2014, a 20% increase from 2013, according to the Los Angeles Tourism and Convention Board. LA Tourism projects that China will replace Canada as the city’s second-‐largest international market in 2015, only trailing Mexico.
To capitalize on the opportunity presented by Chinese tourism, Beverly Center offers features such as:
• Dedicated In-‐House Advisors: Advisors for Chinese consumer and partnership outreach actively support, manage and execute Beverly Center’s strategies and commitment to this market.
• Specialized Guest Services: Mandarin-‐speaking staff members provide assistance at the Guest Services information booth (concierge), and translation services are available.
• Passport to Shopping: Beverly Center offers discounts and special offers, presented in a “passport” booklet, to shoppers who live more than 50 miles away. The program (previously called By Invitation Only) has been an integral part of the mall’s visitor amenities for more than eight years.
• Student Outreach Program: The mall targets Chinese students living in Los Angeles with back-‐to-‐school and graduation shopping shuttles, professional networking mixers and VIP shopping events and promotions curated for this trendy group.
• China UnionPay: Most of Beverly Center’s merchants accept China UnionPay, the Chinese global bank card. Spending by China UnionPay cardholders nearly doubled in 2014 over 2013.
• Chinese Social Media: Beverly Center uses Sina Weibo and WeChat to communicate with Chinese customers in the US and in China.
Beverly Center designed the following events and promotions to appeal to Chinese tourists:
• My Rainbow Valentine with Alibaba: Beverly Center partnered with China’s largest e-‐commerce platform, Alibaba subsidiary Taobao, to host 10 LGBT couples who traveled to Los Angeles in June to get married. The couples won an online contest hosted by Taobao by submitting stories and short videos that showcased their love and commitment. Beverly Center held a pre-‐wedding session with celebrity stylist Joe Zee for the couples.
• Lunar New Year Promotion with UnionPay: During Lunar New Year in 2014, Beverly Center customers shopping with a qualified UnionPay debit or credit card could receive a gift when they spent $500 or more. Los Angeles Laker star Jeremy Lin appeared at the mall to hang his Lunar New Year wish on Beverly Center’s stylish Wishing Tree.
As additional flights connect China and Los Angeles, Chinese tourism is expected to continue to increase. Because word of mouth is one of the most important ways to influence Chinese tourists, we expect long-‐term strategies like Beverly Center’s to produce returns for retailers for years to come.

29
SEPTEMBER 22, 2015
DEBORAH WEINSWIG, EXECUTIVE DIRECTOR–HEAD OF GLOBAL RETAIL & TECHNOLOGY [email protected] US: 917.655.6790 HK: 852.6119.1779 CN: 86.186.1420.3016 Copyright © 2015 The Fung Group. All rights reserved.
UK:
Sixty miles northwest of London, Bicester Village outlet shopping center is home to off-‐price boutiques of premium and high-‐end brands, from Agent Provocateur to Zwilling J.A. Henckels.
Bicester’s point of difference from off-‐price stores and discount malls has long been its aspirational environment and upmarket atmosphere—it offers discount shopping without the discount feel. The environment encourages upscale brands and high-‐spending shoppers alike.
The reward is among the highest sales densities in the world, according to media reports.
With around two-‐thirds of visitors to Bicester Village reported to be foreign visitors, the center has become a major destination for Chinese visitors to the UK.
Bicester caters to international consumers. Some of its options for shoppers offer best-‐practice lessons for retailers seeking to chase the affluent Chinese tourist:
• The center has a currency exchange shop that offers instant tax refunds.
• International shipping of purchases is available.
• Frequent-‐flyer programs like Lufthansa’s Miles & More, Etihad Guest and Virgin Atlantic Flying Club award points for purchases.
• Many shop notices are translated into Mandarin, and some employees speak the language.
• Users have the option to view BicesterVillage.com in Chinese (and Russian and Brazilian Portuguese) as well as English.
• Chauffeur services offer the option of VIP travel from and to London and other nearby areas.
• Luxury motor coaches ferry customers from and to London (for a £28 fee).
• On-‐site food-‐service providers include Pan Chai, an Asian cuisine brand.
The Chinese shopper is so important to Bicester’s owner, Value Retail, that the company now caters to them at home. In 2014, it expanded into China with a similar outlet center, a 35,000 sq. m. village at Suzhou; to the company forecast 10 million visitors in its first year.

30
SEPTEMBER 22, 2015
DEBORAH WEINSWIG, EXECUTIVE DIRECTOR–HEAD OF GLOBAL RETAIL & TECHNOLOGY [email protected] US: 917.655.6790 HK: 852.6119.1779 CN: 86.186.1420.3016 Copyright © 2015 The Fung Group. All rights reserved.
IN CONCLUSION: HOW TO TAP A FAST-‐CHANGING MARKET As the number of Chinese tourists continues to grow, the landscape will also change. To conclude this report, we round up what we think will be the largest shifts and what we believe retailers must do to continue to serve this valuable consumer.
Who Is Currently Shopping Abroad? Luxury purchases overseas continue to grow, but this does not mean that high-‐net-‐worth individuals dominate international shopping. Most tourist traffic from China is middle-‐class consumers, and they are valuable customers.
Trade sources have suggested to FBIC Global Retail & Technology that personal affluence is not typically a direct indicator of tourist retail spending for overseas retailers—in other
words, lower income does not equate to lower spend. Chinese tourists are not simply buying for themselves. They bring shopping lists from family and friends and thus represent more than their own personal purchase potential. Additionally, high savings rates in China and a relatively lower day-‐to-‐day cost of living further complicate the income-‐to-‐shopping ratio when comparing this metric to other developed countries.
We believe that one reason overseas luxury sales have not declined as domestic luxury sales have fallen is that China’s clampdown on gifting and corruption has a more modest impact (if at all) on middle-‐class consumers buying abroad for personal consumption than for those buying inside the country for gifting reasons. In addition, even consumers who are affected by the corruption crackdown are more likely to make purchases overseas where there is less scrutiny and oversight.
For higher-‐end retailers, then, reacting to recent challenges is not as simple as pursuing the high-‐net-‐worth shopper. Retailers need to cater to midmarket consumers buying high-‐end goods, as well as to high-‐net-‐worth consumers. For many luxury retailers, this requires training staff members to assess buying potential in new and different ways.
The Changing Tourism Landscape As the number of Chinese tourists continues to grow, the landscape is also changing. With middle-‐class incomes rising, millions of Chinese are poised to take their first overseas trips, joining group tours and visiting the world’s biggest cities and most popular destinations.
Meanwhile, the number of experienced overseas travelers will continue to increase as Chinese travelers take their second, third and fourth trips overseas—and in the process, become more confident traveling on their own and seek unique and personalized experiences. These experienced travelers are more likely to travel on their own, eschewing typical Chinese group tours. Those who do participate in group tours are more likely to seek out small groups that cater to their interests or traveling style.
As this landscape changes, we expect to see the following trends in Chinese tourism preferences:
• Chinese tourists will increasingly visit smaller cities and a greater number of off-‐the-‐beaten-‐track destinations.
• Natural destinations and national parks and preserves will see higher traffic from Chinese tourists.
• Themed travel, such as trips that feature wine tasting, safaris, golf, driving and other personal interests and hobbies, will increase.

31
SEPTEMBER 22, 2015
DEBORAH WEINSWIG, EXECUTIVE DIRECTOR–HEAD OF GLOBAL RETAIL & TECHNOLOGY [email protected] US: 917.655.6790 HK: 852.6119.1779 CN: 86.186.1420.3016 Copyright © 2015 The Fung Group. All rights reserved.
• Corporate incentive groups will gain in popularity as Chinese businesses compete to provide their employees with unique overseas experiences.
• Cruise and self-‐drive travel will become more popular as tourists seek new and enjoyable ways to explore the world.
• Ongoing environmental and health concerns will spur medical tourism and continued interest in natural and organic lifestyles, experiences and products.
• Affluent Chinese will continue to spend overseas on big-‐ticket items such as education, real estate, diamonds, watches, art and liquor as investment vehicles and to preserve their capital.
• Increased overseas investment by Chinese companies will spur business tourism and spending.
• Multigenerational family trips will continue to increase.
As a result of these trends, we expect both group travel and individual travel to increase in absolute numbers, with individual travelers accounting for a greater percentage of the total.
We expect overall spending by Chinese tourists to maintain rapid growth, but we think average spend per tourist could start to decrease in the years ahead as more middle-‐income tourists travel overseas.
Implications for Global Brands As purchasing patterns evolve, retailers and brands need to evaluate their Chinese consumer strategy from a global standpoint. Investment in brand building with Chinese consumers can produce gains on a global basis, not just in China.
Senior management needs to actively direct investment and return across countries, rather than allowing country managers to compete for the same customers. The Chinese consumer is a global shopper, comparing merchandise and pricing across borders. Today’s global brands and retailers need to adapt their strategies to account for a new type of customer that transcends typical country P&Ls.
These strategic considerations span marketing as well as retail strategy. If more than 70% of Chinese luxury purchases are made outside of China, companies must carefully consider their mainland China retail strategy. This is particularly true given the high demand for prime retail locations, high rents and intense competition.
Brands also need to carefully evaluate their Chinese consumer e-‐commerce strategies, taking into account consumer shopping preferences, pricing disparities, and trust and authenticity assurances. They should closely watch trends in overseas e-‐commerce and monitor pricing and availability across channels.
Implications for Overseas Retailers Overseas retailers need to carefully map their store locations to the latest trends in Chinese tourist travel patterns and habits. They should be evaluating the following potential implications:
• The funneling of tour groups to big department stores will be threatened as travelers start to peel away from group tours and seek out shopping locations on their own.
• Retailers in top-‐tier destinations could lose out on shopping spend if travelers seek out alternative locations.
• The decision-‐making power will increasingly shift from group tour leaders and travel agents to individual travelers, requiring new strategies and tactics to reach these mobile individuals.
The Chinese customer has emerged as the most powerful and motivated in the world, especially in the luxury sector. With most of the world’s top brands actively marketing to Chinese shoppers, competition for their spending is fierce. For retailers looking to stand out, an active approach is crucial, whether that means opening stores in China, building their media presence, working with Chinese celebrities and influencers or engaging in an active ground game to reach Chinese tourists.
The retailers and brands with the highest consumer awareness will be the long-‐term winners of the hearts and wallets of the all-‐powerful Chinese traveling consumer.

32
SEPTEMBER 22, 2015
DEBORAH WEINSWIG, EXECUTIVE DIRECTOR–HEAD OF GLOBAL RETAIL & TECHNOLOGY [email protected] US: 917.655.6790 HK: 852.6119.1779 CN: 86.186.1420.3016 Copyright © 2015 The Fung Group. All rights reserved.
APPENDIX
Total Overseas Spend by Chinese Tourists, 2010–2014
Excludes spend by non-‐tourists such as business travelers. Includes all overseas tourism spend with the exception of international air transportation.
Source: China National Tourism Administration/UNWTO/Statista/FBIC Global Retail & Technology
$55
$73
$102
$129
$165
25.6%
32.2%
40.5%
26.2% 28.0%
0
5
10
15
20
25
30
35
40
45
$0
$30
$60
$90
$120
$150
$180
2010 2011 2012 2013 2014
YoY % Cha
nge
$ Billion

33
SEPTEMBER 22, 2015
DEBORAH WEINSWIG, EXECUTIVE DIRECTOR–HEAD OF GLOBAL RETAIL & TECHNOLOGY [email protected] US: 917.655.6790 HK: 852.6119.1779 CN: 86.186.1420.3016 Copyright © 2015 The Fung Group. All rights reserved.
About Fung Business Intelligence Centre—Global Retail & Technology
The Fung Business Intelligence Centre (FBIC) Global Retail & Technology research team, based in New York, London, and Hong Kong, is a think tank that follows emerging retail and tech trends, specializing in the ways retail and technology intersect, and building collaborative communities.
The team, led by Deborah Weinswig, former top Wall Street and retail tech analyst and start up advisor, publishes ongoing thematic and global market research on topics such as Internet of Things, digital payments, omni-‐channel retail, luxury and fashion trends, and disruptive technologies.
FBIC Global Retail & Technology and China Luxury Advisors would like to express their gratitude to Teresa Lam and Christy Li for their contributions to this report.
Deborah Weinswig, CPA Executive Director—Head of Global Retail & Technology Fung Business Intelligence Centre New York: 917.655.6790 Hong Kong: +852 6119 1779 [email protected] Filippo Battaini [email protected]
Marie Driscoll, CFA [email protected]
John Harmon, CFA [email protected]
Aragorn Ho [email protected]
John Mercer [email protected]
Shoshana Pollack [email protected]
Kiril Popov [email protected]
Jing Wang [email protected]
Steven Winnick [email protected]
About China Luxury Advisors
China Luxury Advisors is a boutique consultancy that helps brands, retailers, tourism organizations and destinations to increase their business with Chinese customers. Visit www.chinaluxuryadvisors.com for more information or contact:
Los Angeles: Renee Hartmann at [email protected]: +1-‐415-‐448-‐7179
Los Angeles: Sage Brennan at [email protected]: +1-‐415-‐448-‐7179
Los Angeles: Charlie Gu at [email protected]: +1-‐323-‐434-‐2480
New York City: Avery Booker at [email protected]: +1-‐210-‐414-‐5656
Paris: Philip Guarino at [email protected]: +33-‐6-‐9954-‐9816
HONG KONG: 10th Floor, LiFung Tower 888 Cheung Sha Wan Road, Kowloon Hong Kong Tel: 852 2300 2470 NEW YORK: 1359 Broadway, 9th Floor New York, NY 10018 Tel: 646 839 7017 LONDON: 242-‐246 Marylebone Road London, NW1 6JQ United Kingdom Tel: 44 (0)20 7616 8988
FBICGROUP.COM