GROWING BRANDS BY UNDERSTANDING WHAT CHINESE … · rowing brands by understanding what Chinese...
28
GROWING BRANDS BY UNDERSTANDING WHAT CHINESE SHOPPERS REALLY DO China Shopper Report 2013, Vol. 1
Transcript of GROWING BRANDS BY UNDERSTANDING WHAT CHINESE … · rowing brands by understanding what Chinese...
GROWING BRANDS BY UNDERSTANDING WHAT CHINESE SHOPPERS REALLY DO
China Shopper Report 2013, Vol. 1

Copyright © 2013 Bain & Company, Inc. and Kantar WorldpanelAll rights reserved.
Growing brands by understanding what Chinese shoppers really do, Vol. 1 | Bain & Company, Inc. | Kantar Worldpanel
Page 1
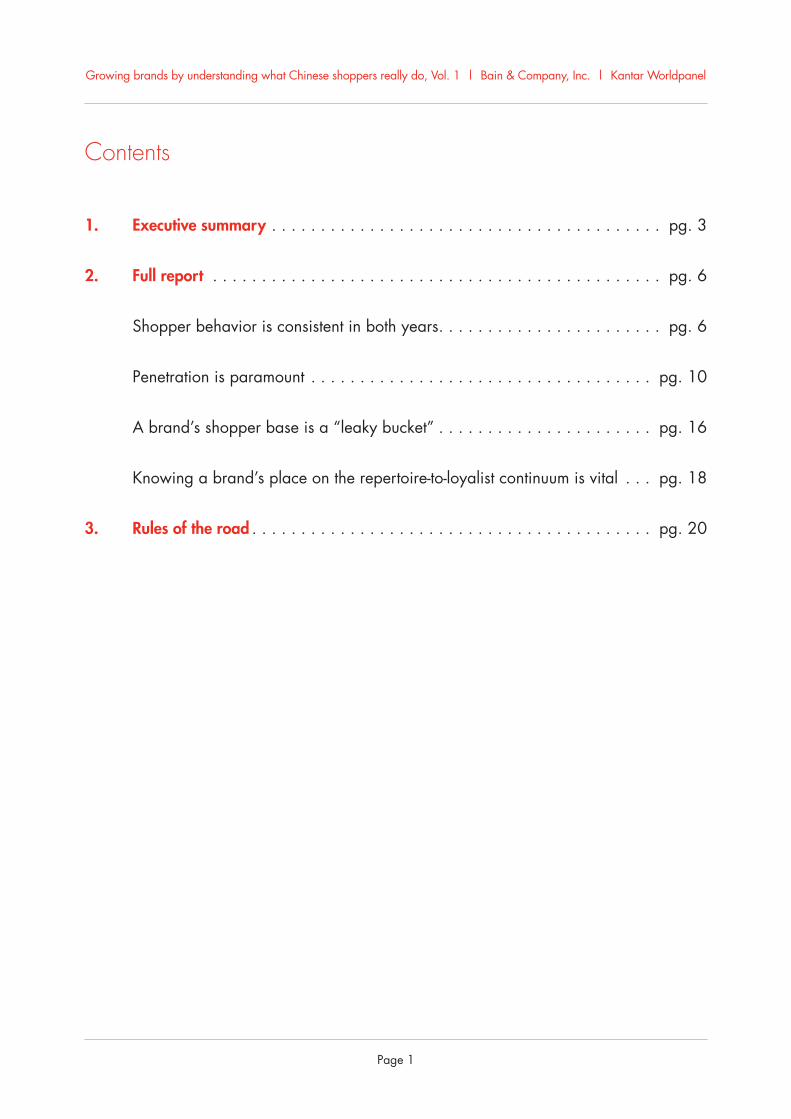
Contents
1. Executive summary . . . . . . . . . . . . . . . . . . . . . . . . . . . . . . . . . . . . . . . . pg. 3
2. Full report . . . . . . . . . . . . . . . . . . . . . . . . . . . . . . . . . . . . . . . . . . . . . . pg. 6
Shopper behavior is consistent in both years . . . . . . . . . . . . . . . . . . . . . . . pg. 6
Penetration is paramount . . . . . . . . . . . . . . . . . . . . . . . . . . . . . . . . . . . pg. 10
A brand’s shopper base is a “leaky bucket” . . . . . . . . . . . . . . . . . . . . . . pg. 16
Knowing a brand’s place on the repertoire-to-loyalist continuum is vital . . . pg. 18
3. Rules of the road . . . . . . . . . . . . . . . . . . . . . . . . . . . . . . . . . . . . . . . . . pg. 20
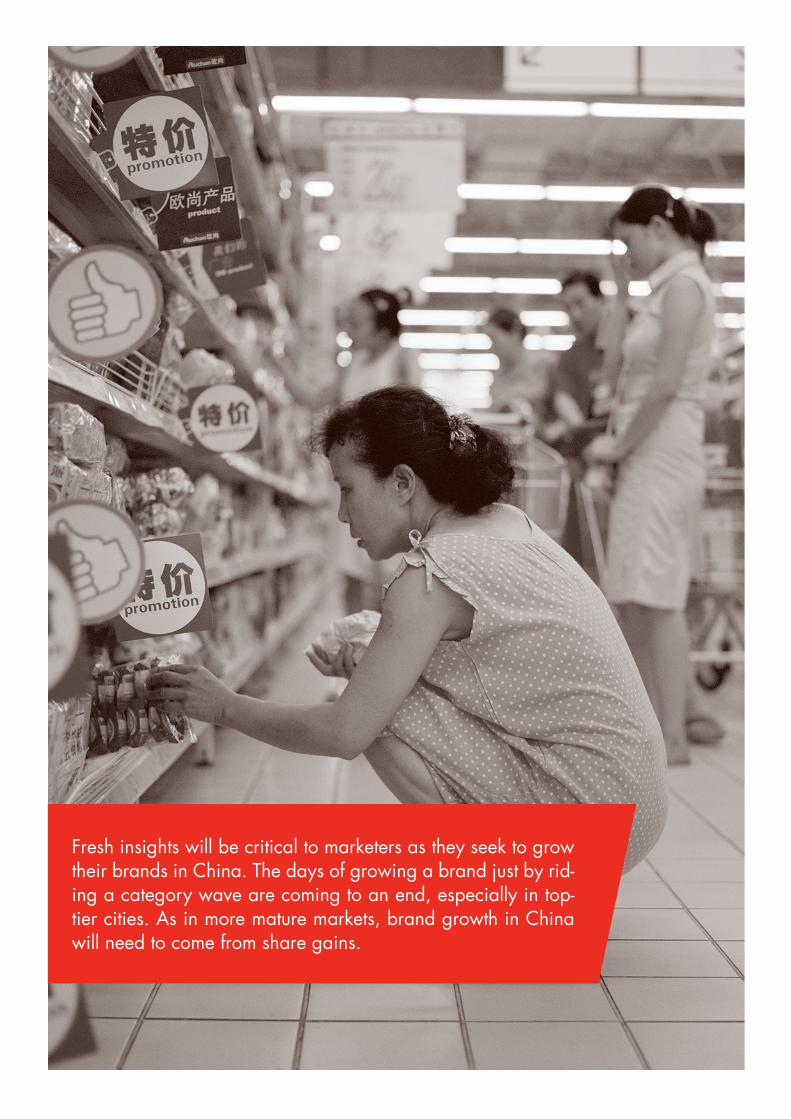
Fresh insights will be critical to marketers as they seek to grow their brands in China. The days of growing a brand just by rid-ing a category wave are coming to an end, especially in top-tier cities. As in more mature markets, brand growth in China will need to come from share gains.
Growing brands by understanding what Chinese shoppers really do, Vol. 1 | Bain & Company, Inc. | Kantar Worldpanel
Page 3
market characterized by an economic slowdown and increasing competition. The days of growing a brand just by riding a category wave are coming to an end, especially in top-tier cities. As in more mature mar-kets, brand growth in China will need to come from share gains.
Among the key findings:
• Shoppers showed similar behaviors from year to year across the 26 categories in terms of purchase frequency and number of brands purchased.
– In most situations, shoppers who buy more frequently in a category also tend to buy more brands in that category—choosing different brands for the same occasion or need. We call this tendency “repertoire behavior.” Reper-toire behavior prevails in China, but in some product categories shoppers are more loyal—they repeatedly buy one brand for a specific need or occasion.
Executive summary
In 2012, Bain & Company, in partnership with Kantar Worldpanel, presented its groundbreaking research on the behavior of Chinese shoppers. We discussed the insights we gained from a rare look at what shoppers really do at the point of sale, as opposed to what they say they do. The findings provided a starting point for consumer goods companies to determine the best strategy for growth and profit in the world’s second largest marketplace for their products.
This year we present a second look. We again partnered with Kantar Worldpanel to study the shopping habits of 40,000 Chinese households in the 26 important consumer goods categories we studied the previous year (see Figure 1). Our 2013 analysis allowed us to confirm and refine our previous findings, and provid-ed additional invaluable insights into how shoppers make purchases. These insights will be critical to mar-keters as they seek to grow their brands in a Chinese
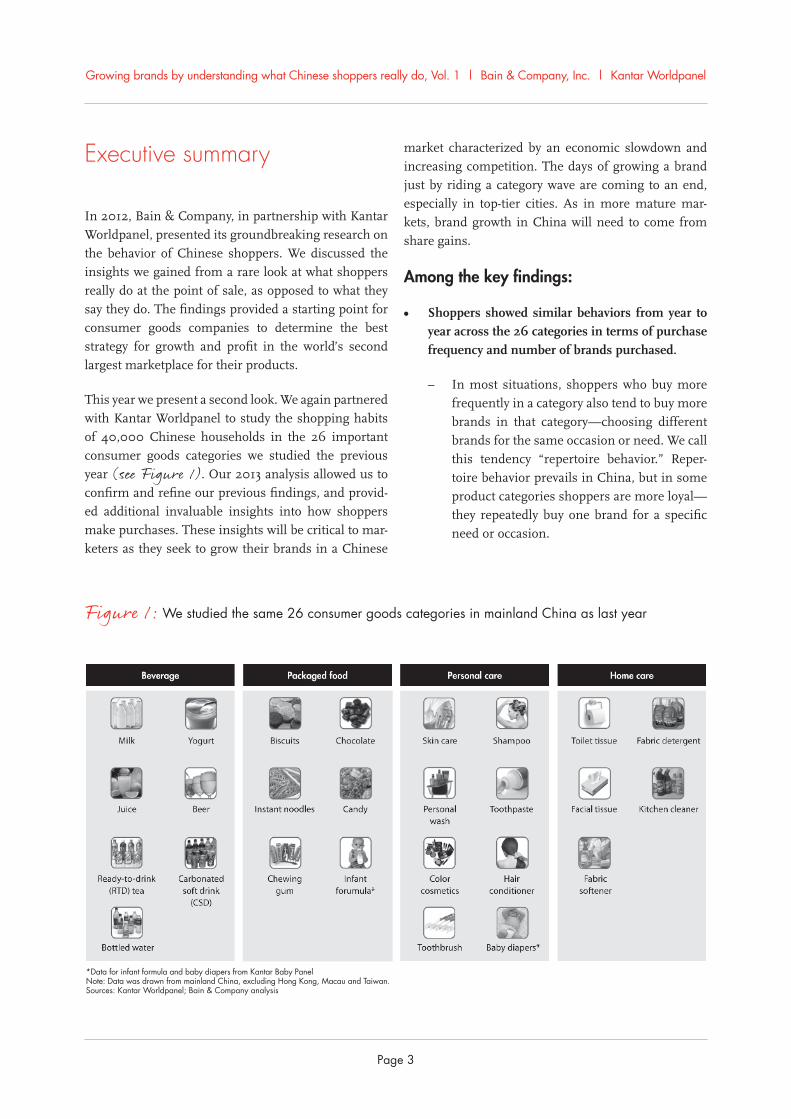
Figure 1: We studied the same 26 consumer goods categories in mainland China as last year
*Data for infant formula and baby diapers from Kantar Baby PanelNote: Data was drawn from mainland China, excluding Hong Kong, Macau and Taiwan.Sources: Kantar Worldpanel; Bain & Company analysis
Growing brands by understanding what Chinese shoppers really do, Vol. 1 | Bain & Company, Inc. | Kantar Worldpanel
Page 4
shoppers in the hope that they will become heavy or loyal buyers—shoppers don’t behave this way. Instead, to build a big brand companies need to sell to as many shoppers as possible.
• Penetration is the most important driver of mar-ket share for each of the 26 categories, regardless of where it falls on the continuum from repertoire to loyalist.
– We found that the leading brand in a category had a penetration rate that is approximately 3 to 10 times higher than the average penetra-tion rate of the category’s top 20 brands. The difference in penetration rates is significantly larger than the difference in purchase fre-quency and repurchase rate for the leading and top 20 brands in the same categories.
– We again found a continuum of categories ranging from “heavy repertoire” to “more loy-alist.” Indeed, each of the 26 categories earned the same placement along the contin-uum that it had in the analysis for the 2012 report. Brand strategy should be based on an understanding of where a category falls along the continuum from repertoire to loyalist.
– Although Chinese shoppers buy multiple brands in every category, they display very pre-dictable buying patterns across all categories. This is consistent with the behavior of shop-pers in other parts of the world.1
– Given that Chinese shoppers are inclined to buy multiple brands, it is not possible to create big brands by targeting and selling to only a few
1 The patterns we observed are consistent with the theories developed by Professor Andrew Ehrenberg in the late 1950s and have been demonstrated to hold true in a broad variety of categories and markets. These patterns are currently being further studied and refined by the Ehrenberg-Bass Institute for Marketing Science.
Growing brands by understanding what Chinese shoppers really do, Vol. 1 | Bain & Company, Inc. | Kantar Worldpanel
Page 5
replace its lost shoppers with new ones. Be-cause most shoppers have very low engage-ment with a brand in terms of purchase fre-quency and repurchase rate, a company needs to find ways to recruit them again each time they go shopping.
The implications of our research are again far-reach-ing, providing insights that will help marketers shape strategic decisions. The route to success begins with an understanding of a brand category’s position on the continuum from heavy repertoire to more loyal-ist. Marketers can use this understanding to deter-mine how to increase penetration for their brands. As we will discuss in greater detail, the most effective approach to building penetration depends on wheth-er the category skews toward heavy repertoire or more loyalist:
• Advertising should adjust its focus on the basis of the skew: raising consideration in repertoire catego-ries and increasing preference in loyalist categories.
• The main goal of innovation in repertoire catego-ries is to create new consumption occasions and reach new consumer groups. In loyalist categories, innovation should seek to introduce more premi-um products to entice consumers to trade up.
• Store displays and activations for repertoire cate-gories should be focused on increasing visibility throughout the store. For loyalist categories, the focus should be on maintaining good visibility on the main shelf.
– In most categories, brands with higher pene-tration rates also tend to have higher purchase frequency and repurchase rates. Our analysis found that a category’s leading brand invari-ably has the highest purchase frequency and repurchase rate. This finding suggests that “niche brands” (brands having a small shop-per base that displays an exceptionally high loyalty or buying frequency) don’t exist—the brands that have a small shopper base are simply small brands, whose buyers usually buy less frequently and churn more often. Be-cause products can’t succeed as niche brands, marketers should avoid investing in elaborate consumer segmentation efforts.
– In this study, we chose to apply a particular focus on 10 categories to understand the dis-tribution of purchase frequency for leading and smaller brands. Our in-depth analysis confirmed the importance of penetration over purchase frequency for driving market share. Importantly, it also showed that the majority of shoppers have very low purchase frequency—for both large and small brands.
• The shopper base experiences a high level of churn for all the brands we studied, regardless of a brand’s size.
– On average, the top five brands in a category lose 30% to 60% of their shopper base every year, and these percentages are even higher for small brands. Although brands’ shopper bases and revenues appear stable, this overall stability conceals the fact that a significant number of shoppers are lost and recruited each year.
– Because a brand’s shopper base is a “leaky bucket,” a brand seeking to grow must not only attract new shoppers each year but also
Growing brands by understanding what Chinese shoppers really do, Vol. 1 | Bain & Company, Inc. | Kantar Worldpanel
Page 6
consumer goods groups, which account for more than 80% of China’s consumer goods market. And the brands we studied represent more than 50% of these four groups in China.
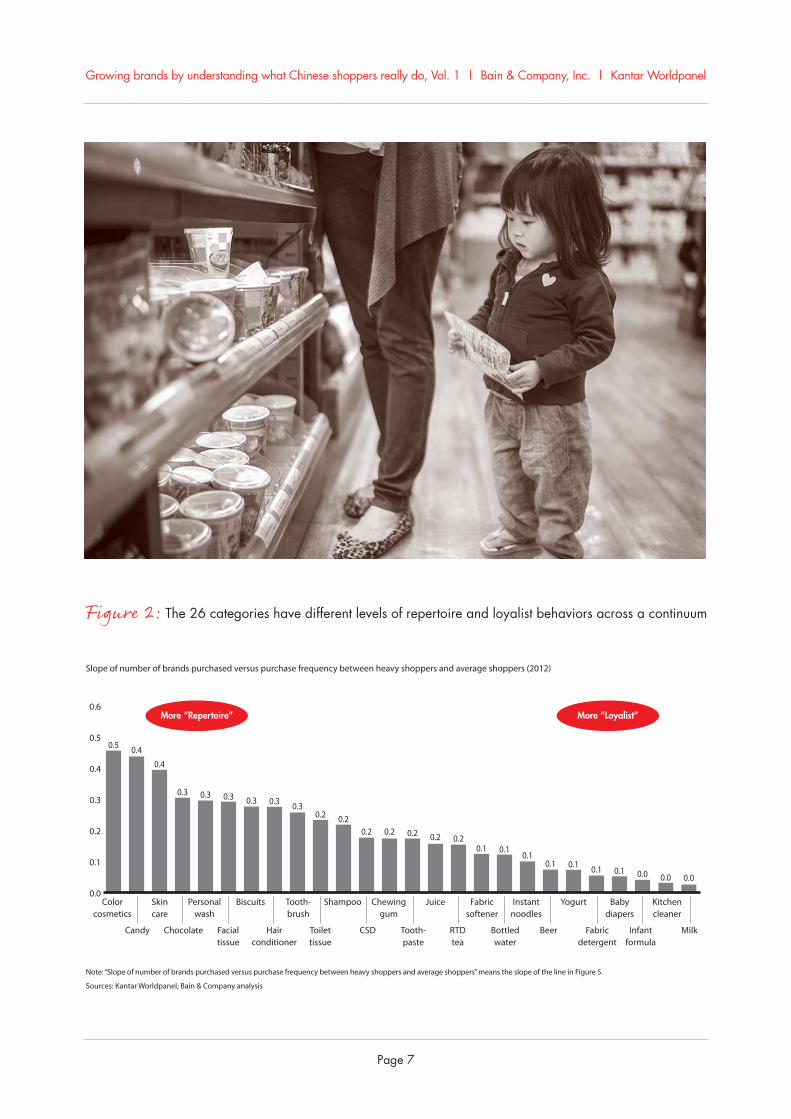
In our 2013 report on Chinese shoppers, we confirmed and expanded our insights regarding their behavior, once again finding that the 26 categories lie along a continuum from “heavy repertoire” to “more loyalist” (see Figure 2). (The 2013 report analyzed data col-lected in 2012, whereas the 2012 report analyzed data collected in 2011.)
Shoppers exhibit repertoire behavior when they choose multiple brands within a category for the same occa-sion or need. The more frequently that shoppers buy in a repertoire category, the more brands they tend to buy in that category. And heavy shoppers of a particular brand tend to be heavy shoppers of other brands in that category. Strong repertoire categories include skin care, biscuits and chocolate.
In contrast, shoppers demonstrate loyalist behavior when they frequently buy one brand in a category for a specific need or occasion. They tend to buy the same brands even when they buy more frequently in a category. And heavy shoppers of a particular brand are not heavy shoppers of other brands in that category. Strong loyalist categories include infant formula, baby diapers and milk.
Understanding where a category falls along the con-tinuum from repertoire to loyalist should be at the cen-ter of any brand strategy.
Shopper behavior is consistent in both years
Although brands are important to Chinese shoppers, these shoppers don’t think about one brand very often. Across the 26 categories we studied, the average purchase frequency of any particular brand is very low: less than five times per year. Even at the category level, the average pur-chase frequency rarely exceeds once per month. Shoppers’
Full report
This report presents a second in-depth look at Chinese shoppers, bringing their purchasing behaviors into even sharper focus. For consumer goods makers in search of growth, the findings once again help fill a serious void, providing detailed data and in-depth analysis of shopper behavior—information that has been limited until now.
Our studies provide much richer analysis and sharper in-sights into shopper behavior than traditional market re-search allows. Instead of simply asking questions about past purchases and future intentions, Kantar Worldpanel armed shoppers (again in 40,000 households) with in-home scanners that tracked their actual purchases in real time. Together, we again looked at detailed records in the same 26 selected consumer goods categories. For the first time this year, we augmented this overall research with a refined analysis of 10 categories we deemed worthy of fur-ther focus. This fine-tuning allowed us to reach several important—and at times, surprising—conclusions.
The comprehensive 2013 report covers all Chinese city tiers and life stages. Shoppers from 373 cities in 20 provinces and four major municipalities participated. 2
The cities reflect the vast range of shopping options available in China today, from the modern trade that flourishes in Tier-1 cities (hypermarkets, supermarkets and convenience stores) to the traditional trade that is common in smaller modern cities (mom-and-pop gro-cery shops, specialty stores and department stores). Also included in the study: China’s young but burgeon-ing e-commerce market. The study had a broad scope—for example, we tracked older, married shop-pers buying shampoo in the aisles of a Guangzhou hy-permarket and young students purchasing chewing gum in tiny mom-and-pop stores in cities like Lijiang.
The categories we analyzed span beverages, packaged foods, personal care and home care—the four largest
2 Kantar Worldpanel’s city-tier definitions are based on China’s administrative definitions. Beijing, Shanghai and Guangzhou are Tier 1 cities; 24 provincial capitals and a handful of prosperous prefecture cities, such as Shenzhen, Dalian, Chongqing and Qingdao, are Tier 2 cities; 228 prefecture cities are Tier 3 cities; 322 city-associated districts and county-level cities are Tier 4 cities; and 1,300 counties are Tier 5, without coverage in Inner Mongolia, Ningxia, Gansu, Qinghai, Tibet, Xinjiang and Hainan provinces. The 373 cities in the study are a repre-sentative sample of all 1,877 cities.
Growing brands by understanding what Chinese shoppers really do, Vol. 1 | Bain & Company, Inc. | Kantar Worldpanel
Page 7
Figure 2: The 26 categories have different levels of repertoire and loyalist behaviors across a continuum
Note: “Slope of number of brands purchased versus purchase frequency between heavy shoppers and average shoppers” means the slope of the line in Figure 5.
Sources: Kantar Worldpanel; Bain & Company analysis
0.0
0.4
0.3
0.2
0.1
0.5
0.6
Colorcosmetics
0.5 0.4
Skincare
0.4
0.3
Personalwash
0.3 0.3
Biscuits
0.3 0.3
Tooth-brush
0.30.2
Shampoo
0.20.2
Chewinggum
Juice
0.2 0.2 0.2 0.2
Instantnoodles
0.1 0.1
Yogurt
0.10.1
Babydiapers
0.1 0.1
Kitchencleaner
0.1 0.0 0.0 0.0
Candy Chocolate Facialtissue
Hairconditioner
Toilettissue
CSD RTDtea
Bottledwater
Fabricsoftener
Beer Fabricdetergent
Infantformula
Milk
Slope of number of brands purchased versus purchase frequency between heavy shoppers and average shoppers (2012)
Tooth-paste
More “Loyalist”More “Repertoire”
Growing brands by understanding what Chinese shoppers really do, Vol. 1 | Bain & Company, Inc. | Kantar Worldpanel
Page 8
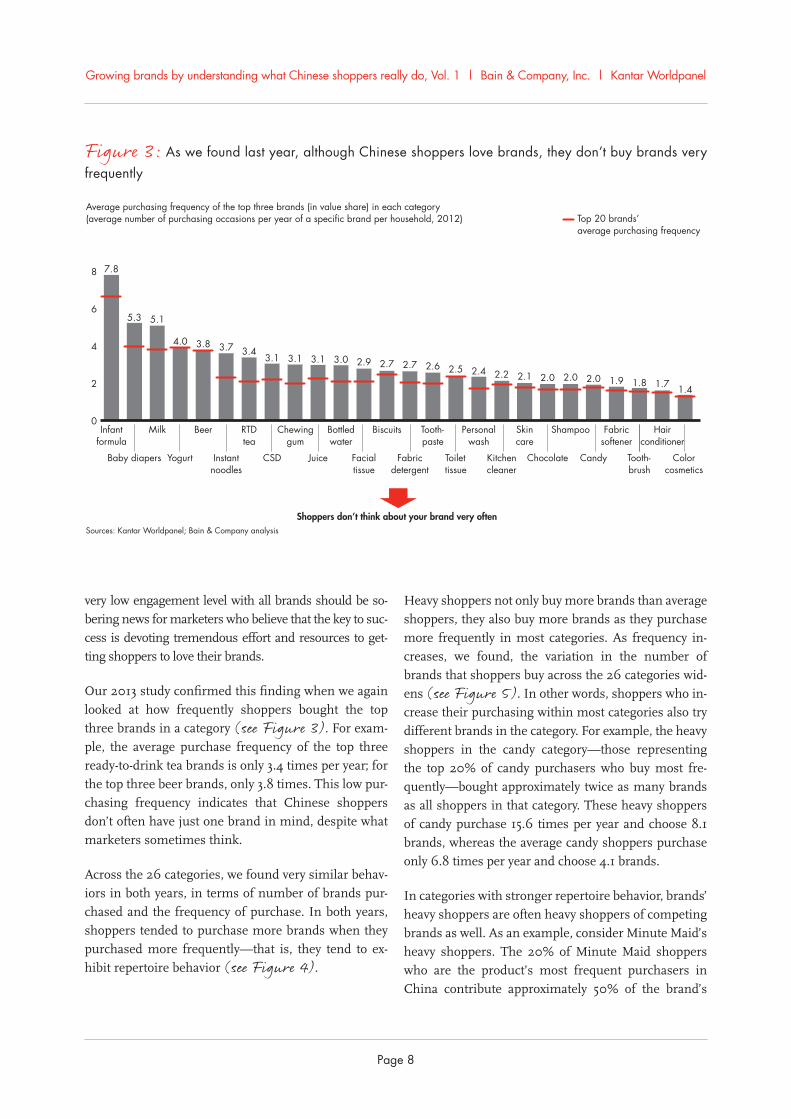
Figure 3: As we found last year, although Chinese shoppers love brands, they don’t buy brands very frequently
Shoppers don’t think about your brand very often
0
2
4
8
6
Infantformula
7.8
5.3
Milk
5.1
4.0
Beer
3.8 3.7
RTDtea
3.43.1
Chewinggum
3.1 3.1
Bottledwater
3.0 2.9
Biscuits
2.7 2.7
Tooth-paste
2.6 2.5
Personalwash
2.4 2.2
Skincare
2.1 2.0
Shampoo
2.0 2.0
Fabricsoftener
1.9 1.8 1.7 1.4
Baby diapers Yogurt Instantnoodles
CSD Juice Facialtissue
Fabricdetergent
Toilettissue
Kitchencleaner
Chocolate Candy Tooth-brush
Top 20 brands’average purchasing frequency
Average purchasing frequency of the top three brands (in value share) in each category(average number of purchasing occasions per year of a specific brand per household, 2012)
Sources: Kantar Worldpanel; Bain & Company analysis
Hairconditioner
Colorcosmetics
very low engagement level with all brands should be so-bering news for marketers who believe that the key to suc-cess is devoting tremendous effort and resources to get-ting shoppers to love their brands.
Our 2013 study confirmed this finding when we again looked at how frequently shoppers bought the top three brands in a category (see Figure 3). For exam-ple, the average purchase frequency of the top three ready-to-drink tea brands is only 3.4 times per year; for the top three beer brands, only 3.8 times. This low pur-chasing frequency indicates that Chinese shoppers don’t often have just one brand in mind, despite what marketers sometimes think.
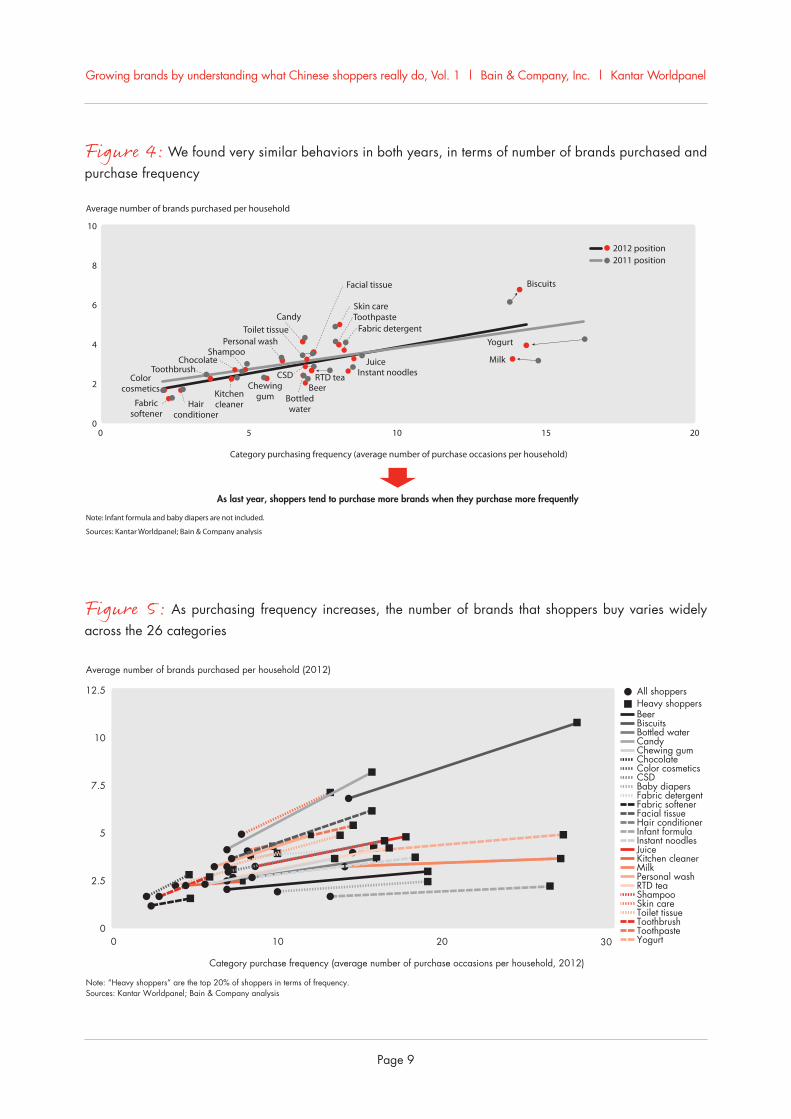
Across the 26 categories, we found very similar behav-iors in both years, in terms of number of brands pur-chased and the frequency of purchase. In both years, shoppers tended to purchase more brands when they purchased more frequently—that is, they tend to ex-hibit repertoire behavior (see Figure 4).
Heavy shoppers not only buy more brands than average shoppers, they also buy more brands as they purchase more frequently in most categories. As frequency in-creases, we found, the variation in the number of brands that shoppers buy across the 26 categories wid-ens (see Figure 5). In other words, shoppers who in-crease their purchasing within most categories also try different brands in the category. For example, the heavy shoppers in the candy category—those representing the top 20% of candy purchasers who buy most fre-quently—bought approximately twice as many brands as all shoppers in that category. These heavy shoppers of candy purchase 15.6 times per year and choose 8.1 brands, whereas the average candy shoppers purchase only 6.8 times per year and choose 4.1 brands.
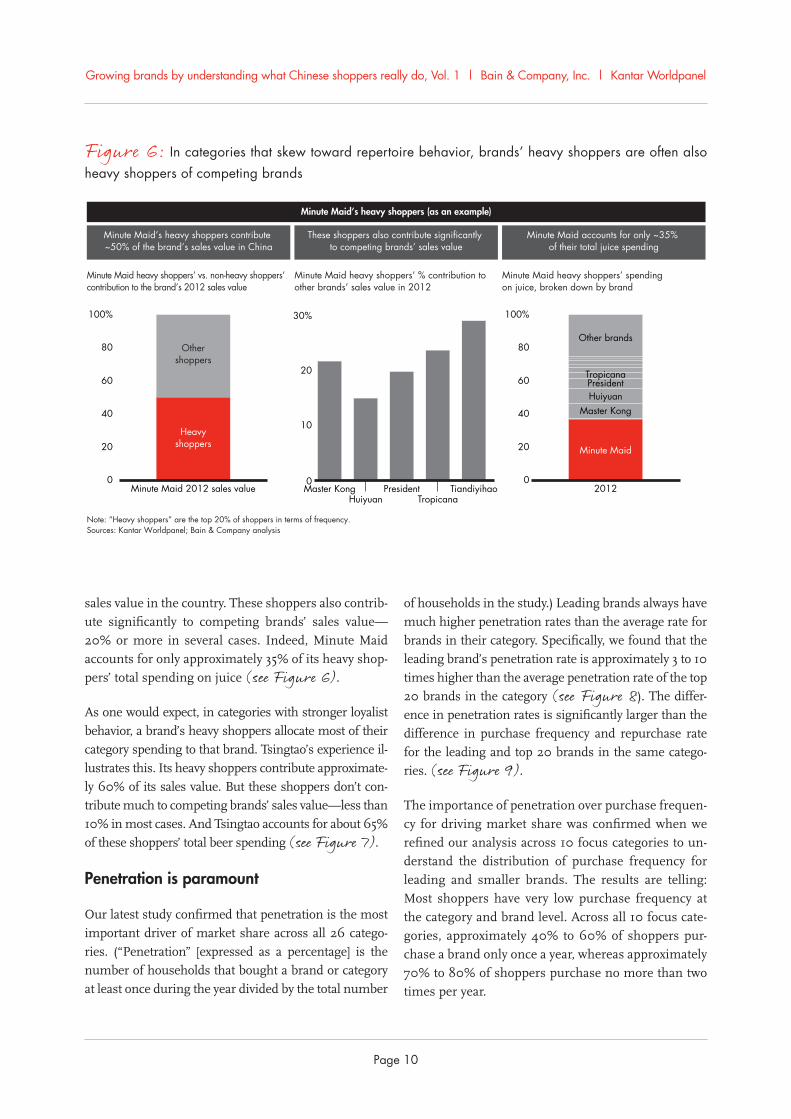
In categories with stronger repertoire behavior, brands’ heavy shoppers are often heavy shoppers of competing brands as well. As an example, consider Minute Maid’s heavy shoppers. The 20% of Minute Maid shoppers who are the product’s most frequent purchasers in China contribute approximately 50% of the brand’s
Growing brands by understanding what Chinese shoppers really do, Vol. 1 | Bain & Company, Inc. | Kantar Worldpanel
Page 9
Figure 5: As purchasing frequency increases, the number of brands that shoppers buy varies widely across the 26 categories
Figure 4: We found very similar behaviors in both years, in terms of number of brands purchased and purchase frequency
0
2.5
5
7.5
10
12.5
0 10 20 30
Note: “Heavy shoppers” are the top 20% of shoppers in terms of frequency.Sources: Kantar Worldpanel; Bain & Company analysis
Average number of brands purchased per household (2012)
Category purchase frequency (average number of purchase occasions per household, 2012)
All shoppersHeavy shoppersBeerBiscuitsBottled waterCandyChewing gumChocolateColor cosmeticsCSDBaby diapersFabric detergentFabric softenerFacial tissueHair conditionerInfant formulaInstant noodlesJuiceKitchen cleanerMilkPersonal washRTD teaShampooSkin careToilet tissueToothbrushToothpasteYogurt
0
2
4
6
10
8
0 5 10 15 20
Yogurt
Skin care
MilkJuice
Biscuits
Toothpaste
Toothbrush
Toilet tissue
Shampoo
Kitchencleaner
Instant noodles
Hairconditioner
Facial tissue
Fabricsoftener
Fabric detergent
CSDColorcosmetics
Chocolate
Chewinggum
Candy
Bottledwater
Beer
Personal wash
Average number of brands purchased per household
As last year, shoppers tend to purchase more brands when they purchase more frequently
Note: Infant formula and baby diapers are not included.
Sources: Kantar Worldpanel; Bain & Company analysis
Category purchasing frequency (average number of purchase occasions per household)
2012 position2011 position
RTD tea
Growing brands by understanding what Chinese shoppers really do, Vol. 1 | Bain & Company, Inc. | Kantar Worldpanel
Page 10
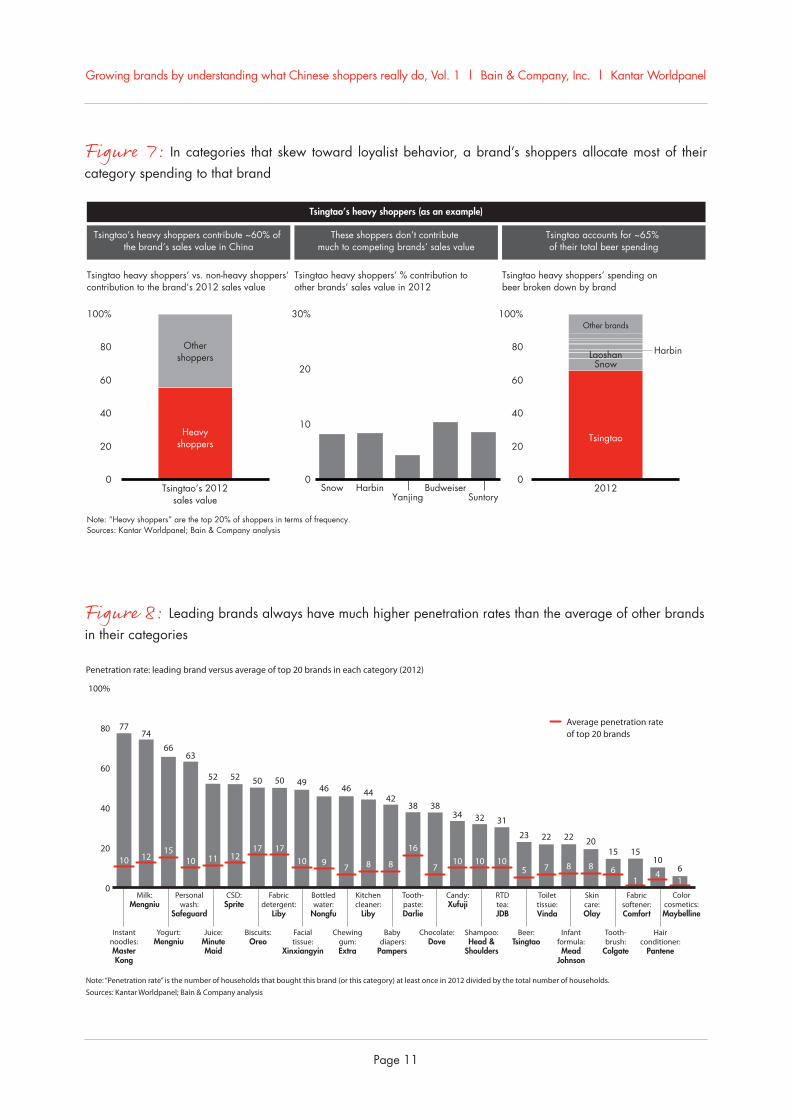
of households in the study.) Leading brands always have much higher penetration rates than the average rate for brands in their category. Specifically, we found that the leading brand’s penetration rate is approximately 3 to 10 times higher than the average penetration rate of the top 20 brands in the category (see Figure 8). The differ-ence in penetration rates is significantly larger than the difference in purchase frequency and repurchase rate for the leading and top 20 brands in the same catego-ries. (see Figure 9).
The importance of penetration over purchase frequen-cy for driving market share was confirmed when we refined our analysis across 10 focus categories to un-derstand the distribution of purchase frequency for leading and smaller brands. The results are telling: Most shoppers have very low purchase frequency at the category and brand level. Across all 10 focus cate-gories, approximately 40% to 60% of shoppers pur-chase a brand only once a year, whereas approximately 70% to 80% of shoppers purchase no more than two times per year.
sales value in the country. These shoppers also contrib-ute significantly to competing brands’ sales value— 20% or more in several cases. Indeed, Minute Maid accounts for only approximately 35% of its heavy shop-pers’ total spending on juice (see Figure 6).
As one would expect, in categories with stronger loyalist behavior, a brand’s heavy shoppers allocate most of their category spending to that brand. Tsingtao’s experience il-lustrates this. Its heavy shoppers contribute approximate-ly 60% of its sales value. But these shoppers don’t con-tribute much to competing brands’ sales value—less than 10% in most cases. And Tsingtao accounts for about 65% of these shoppers’ total beer spending (see Figure 7).
Penetration is paramount
Our latest study confirmed that penetration is the most important driver of market share across all 26 catego-ries. (“Penetration” [expressed as a percentage] is the number of households that bought a brand or category at least once during the year divided by the total number
Figure 6: In categories that skew toward repertoire behavior, brands’ heavy shoppers are often also heavy shoppers of competing brands
Minute Maid 2012 sales value0
20
40
60
80
100%
Heavyshoppers
Othershoppers
20120
20
40
60
80
100%
Minute Maid
Master Kong PresidentTropicana
TiandiyihaoHuiyuan
Master Kong
PresidentTropicana
Other brands
Huiyuan
0
10
20
30%
Minute Maid’s heavy shoppers (as an example)
Note: “Heavy shoppers” are the top 20% of shoppers in terms of frequency. Sources: Kantar Worldpanel; Bain & Company analysis
Minute Maid’s heavy shoppers contribute ~50% of the brand’s sales value in China
These shoppers also contribute significantly to competing brands’ sales value
Minute Maid accounts for only ~35% of their total juice spending
Minute Maid heavy shoppers’ vs. non-heavy shoppers‘ contribution to the brand’s 2012 sales value
Minute Maid heavy shoppers’ % contribution toother brands’ sales value in 2012
Minute Maid heavy shoppers’ spendingon juice, broken down by brand
Growing brands by understanding what Chinese shoppers really do, Vol. 1 | Bain & Company, Inc. | Kantar Worldpanel
Page 11
Figure 7: In categories that skew toward loyalist behavior, a brand’s shoppers allocate most of their category spending to that brand
Tsingtao’s 2012sales value
0
20
40
60
80
100%
Heavyshoppers
Othershoppers
20120
20
40
60
80
100%
SnowYanjing
Harbin BudweiserSuntory
0
10
20
30%
Laoshan Harbin
Tsingtao
Snow
Tsingtao’s heavy shoppers (as an example)
Note: “Heavy shoppers” are the top 20% of shoppers in terms of frequency. Sources: Kantar Worldpanel; Bain & Company analysis
Tsingtao’s heavy shoppers contribute ~60% of the brand’s sales value in China
These shoppers don’t contribute much to competing brands’ sales value
Tsingtao accounts for ~65% of their total beer spending
Tsingtao heavy shoppers’ vs. non-heavy shoppers‘contribution to the brand’s 2012 sales value
Tsingtao heavy shoppers’ % contribution toother brands’ sales value in 2012
Tsingtao heavy shoppers’ spending on beer broken down by brand
Other brands
Figure 8: Leading brands always have much higher penetration rates than the average of other brandsin their categories
23
5
22
7
22
8
20
8
15
6
15
1
10
461
Average penetration rateof top 20 brands
Instantnoodles:MasterKong
Milk:Mengniu
Yogurt:Mengniu
Personalwash:
Safeguard
CSD:Sprite
Fabricdetergent:
Liby
Tooth-paste:Darlie
Juice:MinuteMaid
Facialtissue:
Xinxiangyin
Chewinggum:Extra
Biscuits:Oreo
Kitchencleaner:
Liby
Baby diapers:Pampers
Bottledwater:
Nongfu
Chocolate:Dove
Candy:Xufuji
RTDtea:JDB
Shampoo:Head &
Shoulders
Infantformula:Mead
Johnson
Beer:Tsingtao
Skincare:Olay
Tooth-brush:
Colgate
Toilettissue:Vinda
Fabricsoftener:Comfort
Hairconditioner:
Pantene
0
20
40
60
100%
80 7774
6663
49
1015
10
50
17
46
910
52
12
52
11
50
1712
46
7
44
8
42
8
38
16
38
7
34
10
32
10
31
10
Colorcosmetics:Maybelline
Note: “Penetration rate” is the number of households that bought this brand (or this category) at least once in 2012 divided by the total number of households.Sources: Kantar Worldpanel; Bain & Company analysis
Penetration rate: leading brand versus average of top 20 brands in each category (2012)
Growing brands by understanding what Chinese shoppers really do, Vol. 1 | Bain & Company, Inc. | Kantar Worldpanel
Page 12
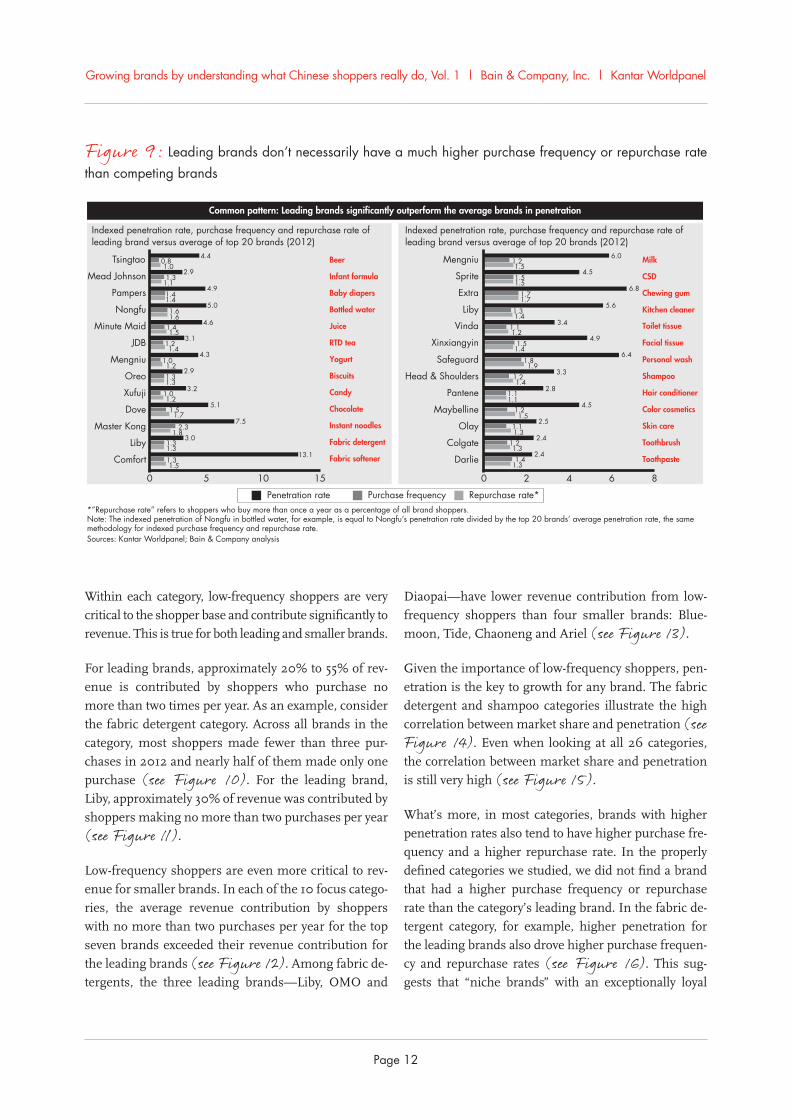
Figure 9: Leading brands don’t necessarily have a much higher purchase frequency or repurchase rate than competing brands
Penetration rate Purchase frequency Repurchase rate*
Common pattern: Leading brands significantly outperform the average brands in penetration
*”Repurchase rate” refers to shoppers who buy more than once a year as a percentage of all brand shoppers.Note: The indexed penetration of Nongfu in bottled water, for example, is equal to Nongfu’s penetration rate divided by the top 20 brands’ average penetration rate, the samemethodology for indexed purchase frequency and repurchase rate.Sources: Kantar Worldpanel; Bain & Company analysis
Bottled water
Beer
Infant formula
Baby diapers
Milk
CSD
Chewing gum
Juice
Instant noodles
Yogurt
Biscuits
Candy
Chocolate
RTD tea
Fabric detergent
Fabric softener
Kitchen cleaner
Skin care
Personal wash
Shampoo
Hair conditioner
Color cosmetics
Toothbrush
Toothpaste
0 5 10 151.5
1.313.1
1.82.3
7.51.7
1.55.1
1.21.0
3.2
1.31.3
3.0
1.41.2
3.1
1.21.0
4.3
1.31.3
2.9
1.51.4
4.61.61.6
5.01.41.4
4.9
1.00.8
4.4
1.11.3
2.9
1.31.4
2.4
1.31.1
2.51.5
1.24.5
1.11.1
2.8
1.31.2
2.4
1.41.5
4.9
1.91.8
6.4
1.41.2
3.3
1.21.1
3.41.41.3
5.61.71.7
6.8
1.51.2
6.0
1.51.5
4.5
Nongfu
Minute Maid
Master Kong
Mengniu
Mengniu
Sprite
Extra
Oreo
Xufuji
Dove
Tsingtao
Mead Johnson
Pampers
JDB
Comfort
Indexed penetration rate, purchase frequency and repurchase rate ofleading brand versus average of top 20 brands (2012)
0 2 4 6 8
Liby
Liby
Facial tissueXinxiangyin
Toilet tissueVinda
Safeguard
Head & Shoulders
Pantene
Maybelline
Olay
Colgate
Darlie
Indexed penetration rate, purchase frequency and repurchase rate ofleading brand versus average of top 20 brands (2012)
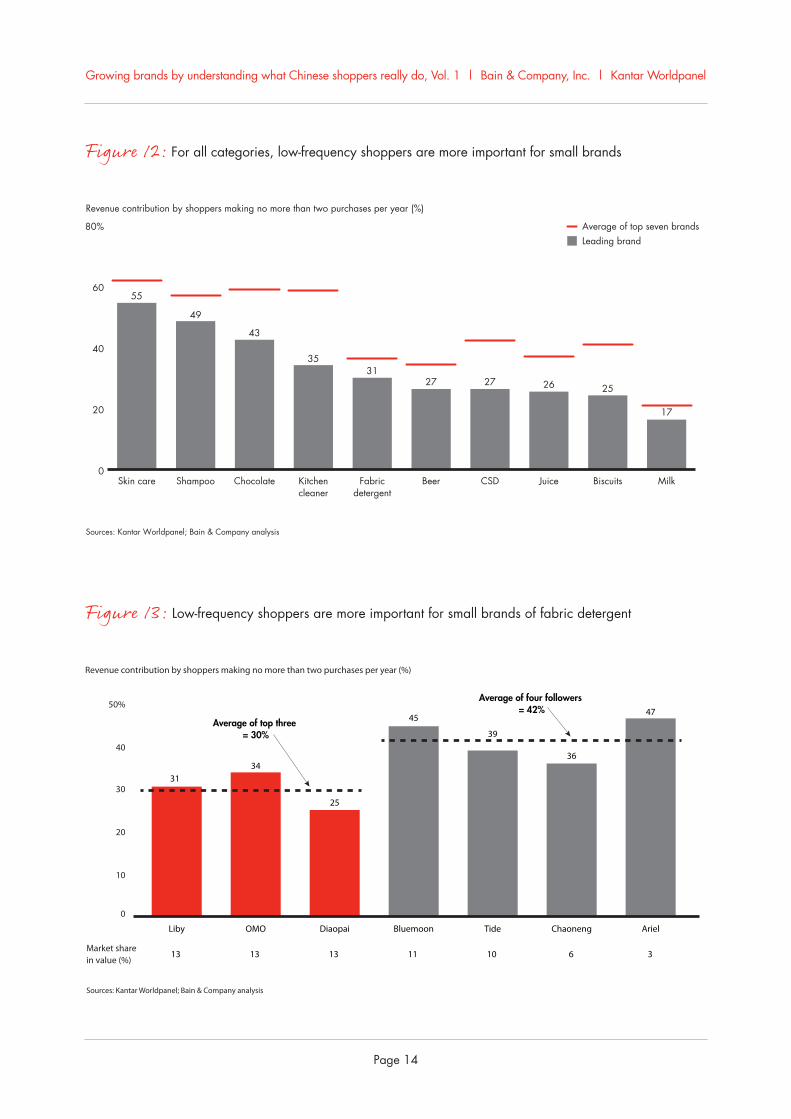
Diaopai—have lower revenue contribution from low-frequency shoppers than four smaller brands: Blue-moon, Tide, Chaoneng and Ariel (see Figure 13).
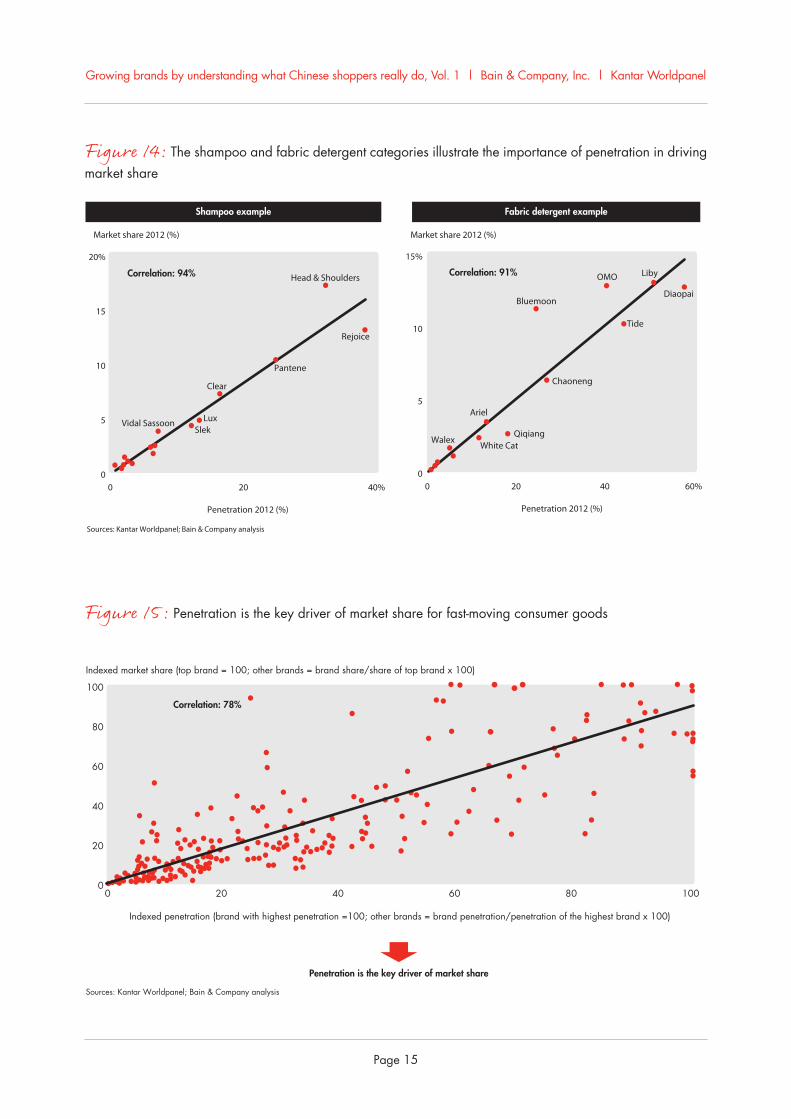
Given the importance of low-frequency shoppers, pen-etration is the key to growth for any brand. The fabric detergent and shampoo categories illustrate the high correlation between market share and penetration (see Figure 14). Even when looking at all 26 categories, the correlation between market share and penetration is still very high (see Figure 15).
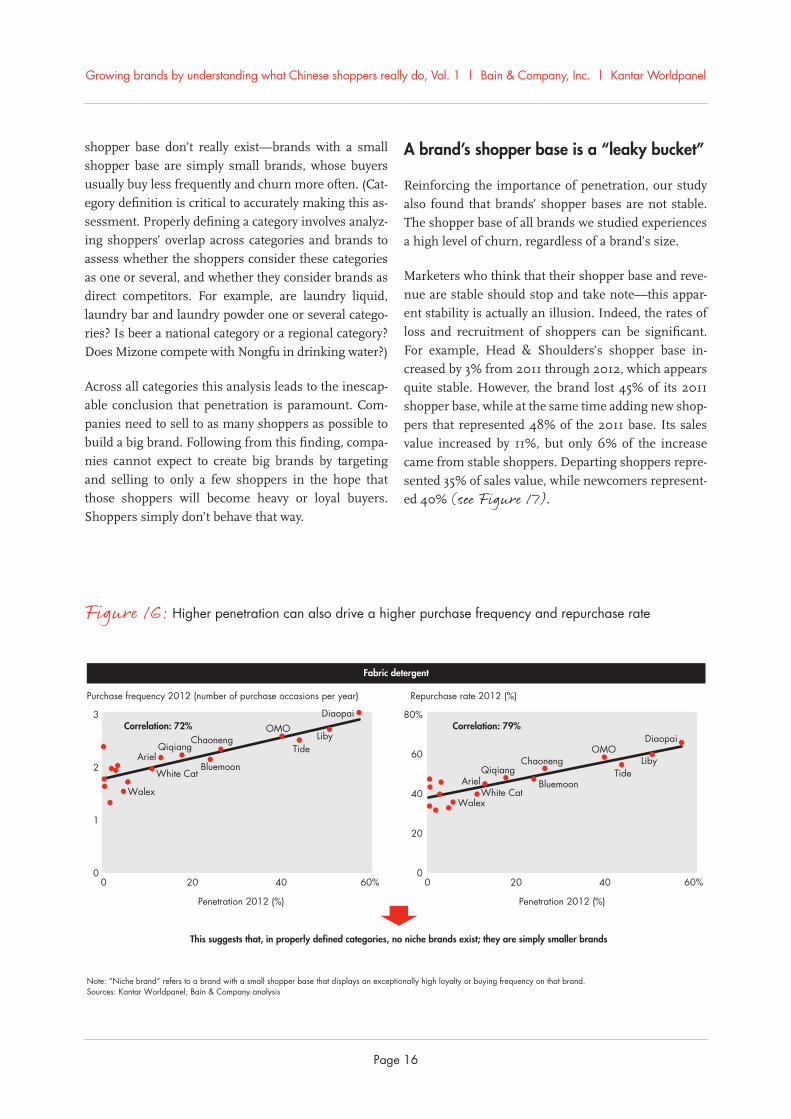
What’s more, in most categories, brands with higher penetration rates also tend to have higher purchase fre-quency and a higher repurchase rate. In the properly defined categories we studied, we did not find a brand that had a higher purchase frequency or repurchase rate than the category’s leading brand. In the fabric de-tergent category, for example, higher penetration for the leading brands also drove higher purchase frequen-cy and repurchase rates (see Figure 16). This sug-gests that “niche brands” with an exceptionally loyal
Within each category, low-frequency shoppers are very critical to the shopper base and contribute significantly to revenue. This is true for both leading and smaller brands.
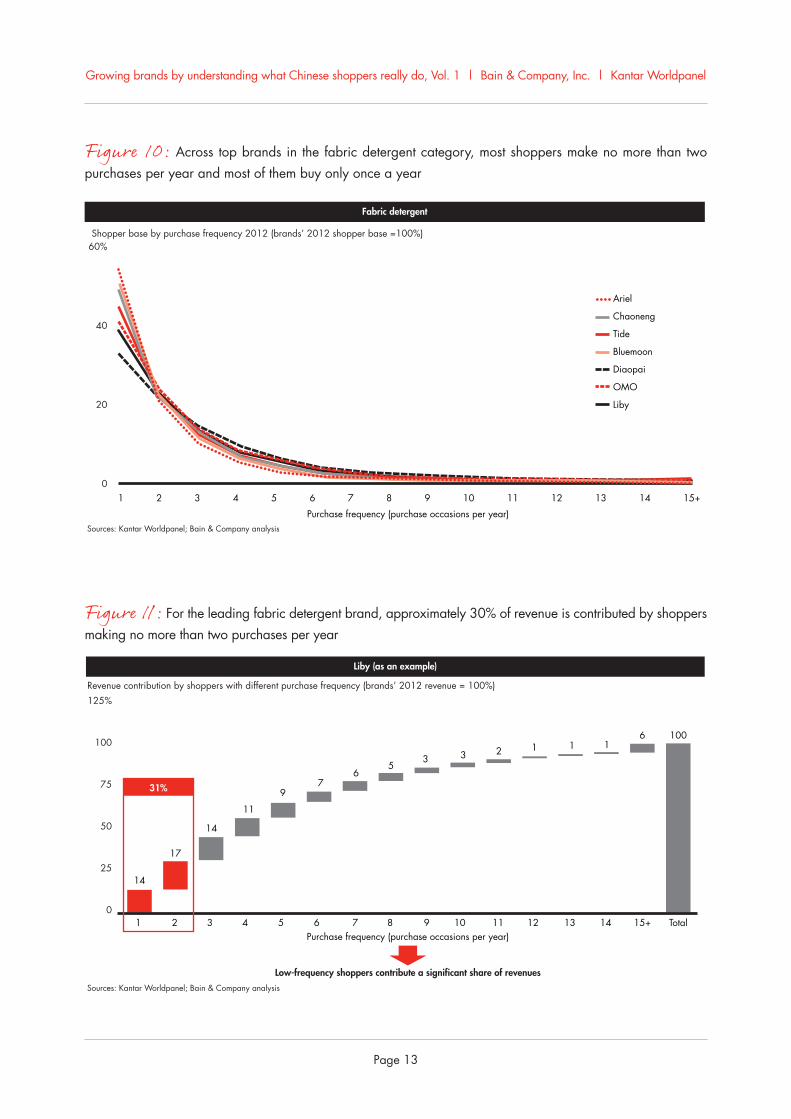
For leading brands, approximately 20% to 55% of rev-enue is contributed by shoppers who purchase no more than two times per year. As an example, consider the fabric detergent category. Across all brands in the category, most shoppers made fewer than three pur-chases in 2012 and nearly half of them made only one purchase (see Figure 10). For the leading brand, Liby, approximately 30% of revenue was contributed by shoppers making no more than two purchases per year (see Figure 11).
Low-frequency shoppers are even more critical to rev-enue for smaller brands. In each of the 10 focus catego-ries, the average revenue contribution by shoppers with no more than two purchases per year for the top seven brands exceeded their revenue contribution for the leading brands (see Figure 12). Among fabric de-tergents, the three leading brands—Liby, OMO and
Growing brands by understanding what Chinese shoppers really do, Vol. 1 | Bain & Company, Inc. | Kantar Worldpanel
Page 13
Figure 10: Across top brands in the fabric detergent category, most shoppers make no more than two purchases per year and most of them buy only once a year
Liby
Diaopai
OMO
Tide
Bluemoon
Chaoneng
Ariel
1 2 15+4 53 6 7 8
Purchase frequency (purchase occasions per year)
9 10 11 12 13 14
Sources: Kantar Worldpanel; Bain & Company analysis
Shopper base by purchase frequency 2012 (brands’ 2012 shopper base =100%)60%
40
20
0
Fabric detergent
Figure 11: For the leading fabric detergent brand, approximately 30% of revenue is contributed by shoppers making no more than two purchases per year
6111233
56
79
11
14
31%
17
14
100
Sources: Kantar Worldpanel; Bain & Company analysis
Revenue contribution by shoppers with different purchase frequency (brands’ 2012 revenue = 100%)125%
75
100
50
25
0
Low-frequency shoppers contribute a significant share of revenues
1 2 15+ Total4 53 6 7 8 9 10 11 12 13 14
Liby (as an example)
Purchase frequency (purchase occasions per year)
Growing brands by understanding what Chinese shoppers really do, Vol. 1 | Bain & Company, Inc. | Kantar Worldpanel
Page 14
Figure 12: For all categories, low-frequency shoppers are more important for small brands
Figure 13: Low-frequency shoppers are more important for small brands of fabric detergent
Average of top seven brandsLeading brand
0
40
20
60
80%
Skin care
55
49
Chocolate
43
35
Fabricdetergent
3127
CSD
27 26
Biscuits
25
17
Shampoo Kitchencleaner
Beer Juice Milk
Sources: Kantar Worldpanel; Bain & Company analysis
Revenue contribution by shoppers making no more than two purchases per year (%)
Liby
3134
DiaopaiOMO
25
TideBluemoon Chaoneng
45Average of top three = 30%
Average of four followers = 42%
39
36
47
Ariel
13 31313 11 10 6
Sources: Kantar Worldpanel; Bain & Company analysis
Revenue contribution by shoppers making no more than two purchases per year (%)
Market sharein value (%)
50%
40
30
20
10
0
Growing brands by understanding what Chinese shoppers really do, Vol. 1 | Bain & Company, Inc. | Kantar Worldpanel
Page 15
Figure 14: The shampoo and fabric detergent categories illustrate the importance of penetration in driving market share
0
5
10
15%
0 4020 60%0
10
5
15
20%
0 20 40%
Shampoo example Fabric detergent example
Sources: Kantar Worldpanel; Bain & Company analysis
Market share 2012 (%) Market share 2012 (%)
Penetration 2012 (%)
Pantene
Clear
SlekLuxVidal Sassoon
Rejoice
Head & Shoulders
Diaopai
OMO
Tide
Bluemoon
Walex
Chaoneng
QiqiangWhite Cat
Ariel
Liby
Penetration 2012 (%)
Correlation: 94% Correlation: 91%
Figure 15: Penetration is the key driver of market share for fast-moving consumer goods
0
40
20
60
80
100
0 20 40 60 10080
Indexed market share (top brand = 100; other brands = brand share/share of top brand x 100)
Penetration is the key driver of market share
Correlation: 78%
Sources: Kantar Worldpanel; Bain & Company analysis
Indexed penetration (brand with highest penetration =100; other brands = brand penetration/penetration of the highest brand x 100)
Growing brands by understanding what Chinese shoppers really do, Vol. 1 | Bain & Company, Inc. | Kantar Worldpanel
Page 16
A brand’s shopper base is a “leaky bucket”
Reinforcing the importance of penetration, our study also found that brands’ shopper bases are not stable. The shopper base of all brands we studied experiences a high level of churn, regardless of a brand’s size.
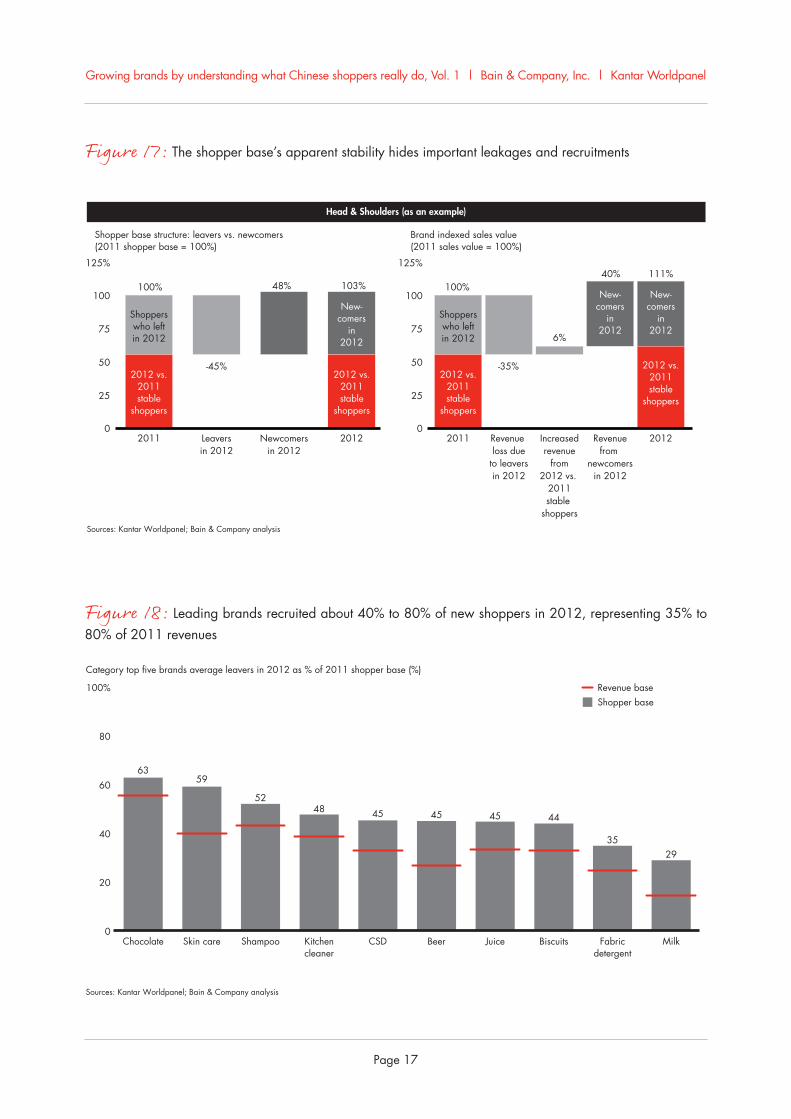
Marketers who think that their shopper base and reve-nue are stable should stop and take note—this appar-ent stability is actually an illusion. Indeed, the rates of loss and recruitment of shoppers can be significant. For example, Head & Shoulders’s shopper base in-creased by 3% from 2011 through 2012, which appears quite stable. However, the brand lost 45% of its 2011 shopper base, while at the same time adding new shop-pers that represented 48% of the 2011 base. Its sales value increased by 11%, but only 6% of the increase came from stable shoppers. Departing shoppers repre-sented 35% of sales value, while newcomers represent-ed 40% (see Figure 17).
shopper base don’t really exist—brands with a small shopper base are simply small brands, whose buyers usually buy less frequently and churn more often. (Cat-egory definition is critical to accurately making this as-sessment. Properly defining a category involves analyz-ing shoppers’ overlap across categories and brands to assess whether the shoppers consider these categories as one or several, and whether they consider brands as direct competitors. For example, are laundry liquid, laundry bar and laundry powder one or several catego-ries? Is beer a national category or a regional category? Does Mizone compete with Nongfu in drinking water?)
Across all categories this analysis leads to the inescap-able conclusion that penetration is paramount. Com-panies need to sell to as many shoppers as possible to build a big brand. Following from this finding, compa-nies cannot expect to create big brands by targeting and selling to only a few shoppers in the hope that those shoppers will become heavy or loyal buyers. Shoppers simply don’t behave that way.
Figure 16: Higher penetration can also drive a higher purchase frequency and repurchase rate
0
20
40
60
80%
0 4020 60%0
1
2
3
0 20 40 60%
Fabric detergent
Note: “Niche brand” refers to a brand with a small shopper base that displays an exceptionally high loyalty or buying frequency on that brand.Sources: Kantar Worldpanel; Bain & Company analysis
Purchase frequency 2012 (number of purchase occasions per year) Repurchase rate 2012 (%)
Penetration 2012 (%)
OMO
Tide
Bluemoon
Walex
White Cat
White Cat
Chaoneng
Ariel
Liby
Diaopai
DiaopaiOMO
TideBluemoon
Walex
ChaonengQiqiang
Qiqiang
Ariel
Liby
Penetration 2012 (%)
This suggests that, in properly defined categories, no niche brands exist; they are simply smaller brands
Correlation: 72% Correlation: 79%
Growing brands by understanding what Chinese shoppers really do, Vol. 1 | Bain & Company, Inc. | Kantar Worldpanel
Page 17
Figure 18: Leading brands recruited about 40% to 80% of new shoppers in 2012, representing 35% to 80% of 2011 revenues
Revenue baseShopper base
0
40
20
60
100%
80
Chocolate
6359
Shampoo
5248
CSD
45 45
Juice
45 44
Fabricdetergent
3529
Skin care Kitchencleaner
Beer Biscuits Milk
Sources: Kantar Worldpanel; Bain & Company analysis
Category top five brands average leavers in 2012 as % of 2011 shopper base (%)
Figure 17: The shopper base’s apparent stability hides important leakages and recruitments
0
25
50
75
100
125%
0
25
50
75
100
125%
2011 Leaversin 2012
Newcomersin 2012
2012 2011 Revenue loss due
to leaversin 2012
Increasedrevenue
from2012 vs.
2011stable
shoppers
Revenuefrom
newcomersin 2012
2012
Head & Shoulders (as an example)
Sources: Kantar Worldpanel; Bain & Company analysis
Shopper base structure: leavers vs. newcomers (2011 shopper base = 100%)
Brand indexed sales value(2011 sales value = 100%)
2012 vs.2011stable
shoppers
2012 vs.2011stable
shoppers
Shopperswho leftin 2012
-45% -35%
100% 100%
6%
40% 111%48% 103%
New-comers
in2012
2012 vs.2011stable
shoppers
2012 vs.2011stable
shoppers
Shopperswho leftin 2012
New-comers
in2012
New-comers
in2012
Growing brands by understanding what Chinese shoppers really do, Vol. 1 | Bain & Company, Inc. | Kantar Worldpanel
Page 18
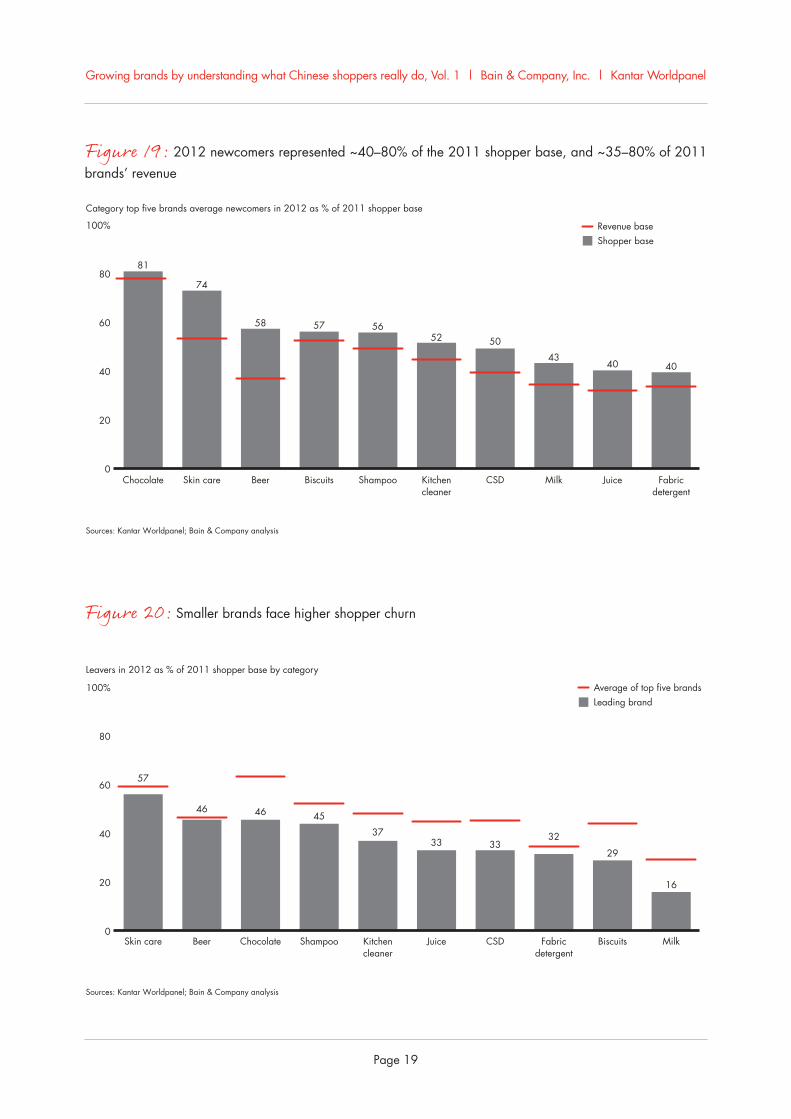
low engagement with a brand (in terms of purchase frequency and repurchase rate), a company needs to find ways to recruit potential buyers again each time they go shopping.
Knowing a brand’s place on the repertoire-to-loyalist continuum is vital
Our findings demonstrate that across all categories, whether characterized by heavy repertoire or more loy-alist behaviors, the most important factor in growing brands is to drive penetration. By applying the right ways to build penetration, companies can capture rev-enue from the low-frequency shoppers who represent the bulk of any brand’s revenue base. They can also regularly recruit new shoppers to refill the base’s “leaky bucket.” And they can drive higher rates of fre-quency and repurchase among the shopper base.
A major implication is that marketers must identify the barriers to penetration and address a key question: “Why are shoppers not buying my brand?” To provide an answer to this question, we believe that shopper re-search should focus on those who have yet to purchase a brand rather than the brand’s existing shoppers.
On average, the top five brands in each of our 10 focus categories lost 30% to 60% of their shopper base in 2012 compared with 2011. These lost shoppers repre-sented, on average, 20% to 50% of the top five brands’ revenues in 2011 (see Figure 18). Similarly, we found that, on average, the top five brands recruited new shoppers amounting to 40% to 80% of their shopper base. Sales to these new shoppers represented, on aver-age, 35% to 80% of the brands’ 2011 revenues (see Figure 19).
We also found that smaller brands tend to have higher churn rates than leading brands. This rein-forces the view that niche brands do not exist in China (see Figure 20). Small brands simply have fewer buyers, who buy less frequently and who churn more often. As one might expect, we also found that the churn rate in loyalist categories, on average, ap-pears to be lower than in repertoire categories.
This analysis demonstrates that a brand’s shopper base is like a “leaky bucket.” For a brand to grow, a company needs to recruit new shoppers every year to compen-sate for those it loses, further emphasizing the impor-tance of penetration. Because most shoppers have very
Growing brands by understanding what Chinese shoppers really do, Vol. 1 | Bain & Company, Inc. | Kantar Worldpanel
Page 19
Figure 20: Smaller brands face higher shopper churn
Average of top five brandsLeading brand
0
40
20
60
100%
80
Skin care
57
46
Chocolate
46 45
Kitchencleaner
3733
CSD
3332
Biscuits
29
16
Beer Shampoo Juice Fabricdetergent
Milk
Sources: Kantar Worldpanel; Bain & Company analysis
Leavers in 2012 as % of 2011 shopper base by category
Figure 19: 2012 newcomers represented ~40–80% of the 2011 shopper base, and ~35–80% of 2011 brands’ revenue
Revenue baseShopper base
Chocolate
81
74
Beer
58 57
Shampoo
5652
CSD
50
43
Juice
40 40
Skin care Biscuits Kitchencleaner
Milk Fabricdetergent
Sources: Kantar Worldpanel; Bain & Company analysis
Category top five brands average newcomers in 2012 as % of 2011 shopper base
0
40
20
60
100%
80
Growing brands by understanding what Chinese shoppers really do, Vol. 1 | Bain & Company, Inc. | Kantar Worldpanel
Page 20
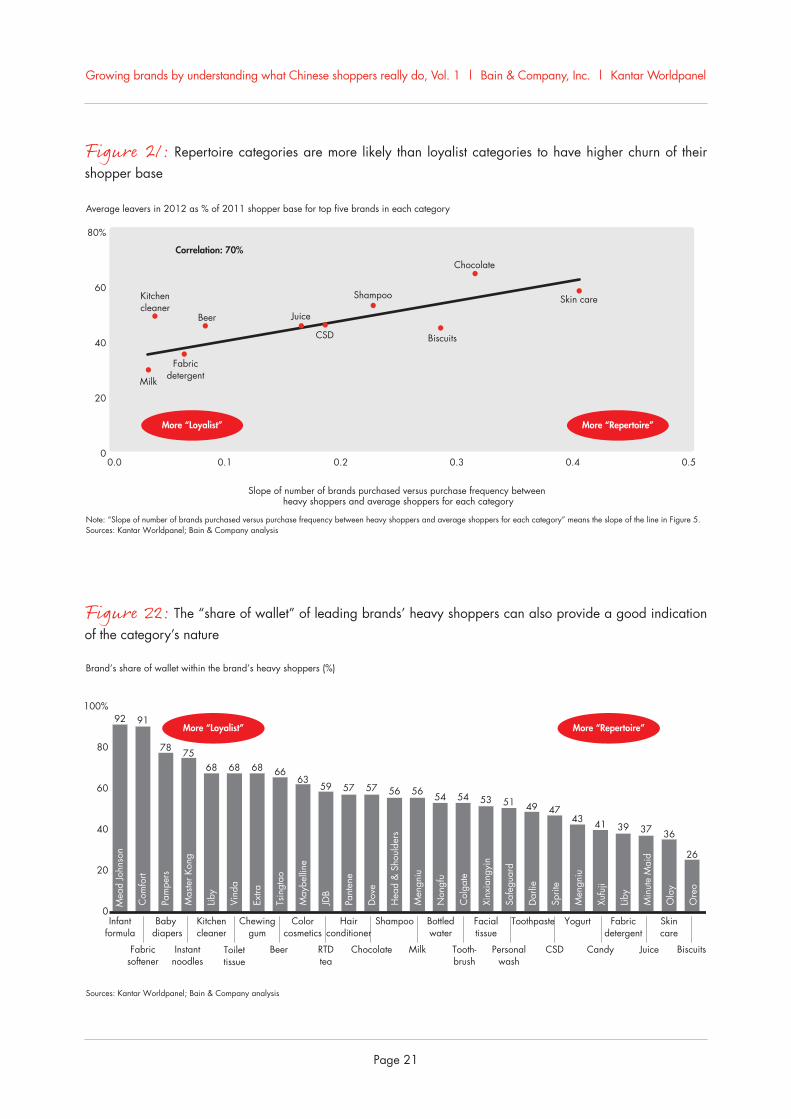
stronger loyalist category and that biscuits is a heavier repertoire category, consistent with the first analysis of the continuum. The share of wallet for Sprite, the lead-ing CSD player, suggests that this category skews to-ward repertoire behavior (see Figure 22).
Rules of the road
Armed with an understanding of a brand category’s position on the continuum, marketers can choose the right approach to building penetration.
In categories with stronger repertoire behavior, market-ers can drive penetration by taking the following actions:
• Build consideration first. Repertoire category shoppers consider multiple brands when they shop. A company must ensure that its brand is one of the brands that shoppers consider. This can be achieved by investing in the right “above the line” marketing (like TV commercials), focusing on distinctive brand assets and making the brand top-of-mind for specific needs and occasions. For example, Head & Shoulders has consistently in-vested heavily in above-the-line marketing to pro-mote the concept of “dandruff control” and to build strong consideration.
• Achieve perfect in-store execution, so that con-sideration translates into penetration. Because shoppers buy so infrequently, wide distribution across channels is important. High levels of “be-low the line” marketing (like in-store sales pro-motions) and trade spending are also needed to ensure “constant confrontation” with the shop-pers at the point of sale. The in-store focus should be on superior visibility and distinctive-ness. This often means that the brand needs to be present in multiple locations in the store, not just on the main shelf. Store “hot spots,” such as shelf ends and check-out counters, should be pri-mary location targets.
Recognizing the importance of penetration for all types of categories is just the starting point for success. To build on it, companies must understand that the differ-ences between repertoire and loyalist categories create the need for different approaches to increasing pene-tration. That means a company must identify a brand category’s position on the continuum between “heavy repertoire” and “more loyalist” before deciding how to grow penetration for that brand.
To determine whether a category tends to skew more toward repertoire or loyalist behavior, we used the data from the analysis shown in Figure 5 (the number of brands purchased versus the purchase frequency for heavy and average shoppers) to compare the 26 catego-ries. The slope of the curve for a category in this analy-sis can be used to assess the degree of repertoire behav-ior for the category relative to the other categories. A steeper slope indicates that a category is “heavy reper-toire” (for example, candy), whereas a flatter slope indi-cates that a category is “more loyalist” (for example, yogurt) (see Figure 2 on page 7).
To confirm the analysis shown in Figure 2, we com-pared the results for the 10 focus categories with the level of churn in each category’s shopper base. As we expected, the categories we identified as most heavy repertoire were also more likely to have a higher level of churn (see Figure 21).
In some cases, the degree of repertoire behavior for a category may be unclear after these two analyses. In the second analysis, for example, the kitchen cleaner category (a stronger loyalist category in the first analy-sis) has a higher churn rate than the biscuits category (one of the heavier repertoire categories). What’s more, the carbonated soft drink (CSD) category falls in the middle of the continuum in both analyses.
To clarify a category’s nature, marketers can analyze share of wallet for heavy shoppers of the category’s lead-ing brand. (“Share of wallet” is the percentage of a shopper’s spending in a category that’s devoted to a given brand.) A leading brand’s share of wallet for heavy shoppers is typically higher for loyalist categories. For example, this analysis shows that kitchen cleaner is a
Growing brands by understanding what Chinese shoppers really do, Vol. 1 | Bain & Company, Inc. | Kantar Worldpanel
Page 21
Figure 21: Repertoire categories are more likely than loyalist categories to have higher churn of their shopper base
0
40
20
60
80%
0.0 0.1 0.2
Kitchencleaner
Beer Juice
Shampoo
Chocolate
Milk
Fabricdetergent
CSD Biscuits
Skin care
0.3 0.50.4
Average leavers in 2012 as % of 2011 shopper base for top five brands in each category
Correlation: 70%
Note: “Slope of number of brands purchased versus purchase frequency between heavy shoppers and average shoppers for each category” means the slope of the line in Figure 5.Sources: Kantar Worldpanel; Bain & Company analysis
Slope of number of brands purchased versus purchase frequency between heavy shoppers and average shoppers for each category
More “Loyalist” More “Repertoire”
Figure 22: The “share of wallet” of leading brands’ heavy shoppers can also provide a good indication of the category’s nature
More “Loyalist” More “Repertoire”
0
20
40
60
80
100%
Infantformula
92 91
Baby diapers
78 75
Kitchencleaner
68 68
Chewinggum
68 6663
59
Hairconditioner
57 57
Shampoo Bottledwater
56 56
Toilettissue
54 54
Facialtissue
53 51
Toothpaste
49 47
Yogurt
43 41
Fabricdetergent
Skincare
39 37 36
26
Fabricsoftener
Instantnoodles
Beer RTDtea
Chocolate Milk Tooth-brush
Personalwash
CSD Candy Juice
Colorcosmetics
Com
fort
Mea
d Jo
hnso
n
Mas
ter K
ong
Pam
pers
Vind
a
Liby
Tsin
gtao
Extra
JDB
May
belli
ne
Dov
e
Pant
ene
Men
gniu
Hea
d &
Sho
ulde
rs
Col
gate
Non
gfu
Safe
guar
d
Xinx
iang
yin
Sprit
e
Dar
lie
Xufu
ji
Men
gniu
Min
ute
Mai
d
Liby
Ore
o
Ola
yBrand’s share of wallet within the brand’s heavy shoppers (%)
Sources: Kantar Worldpanel; Bain & Company analysis
Biscuits
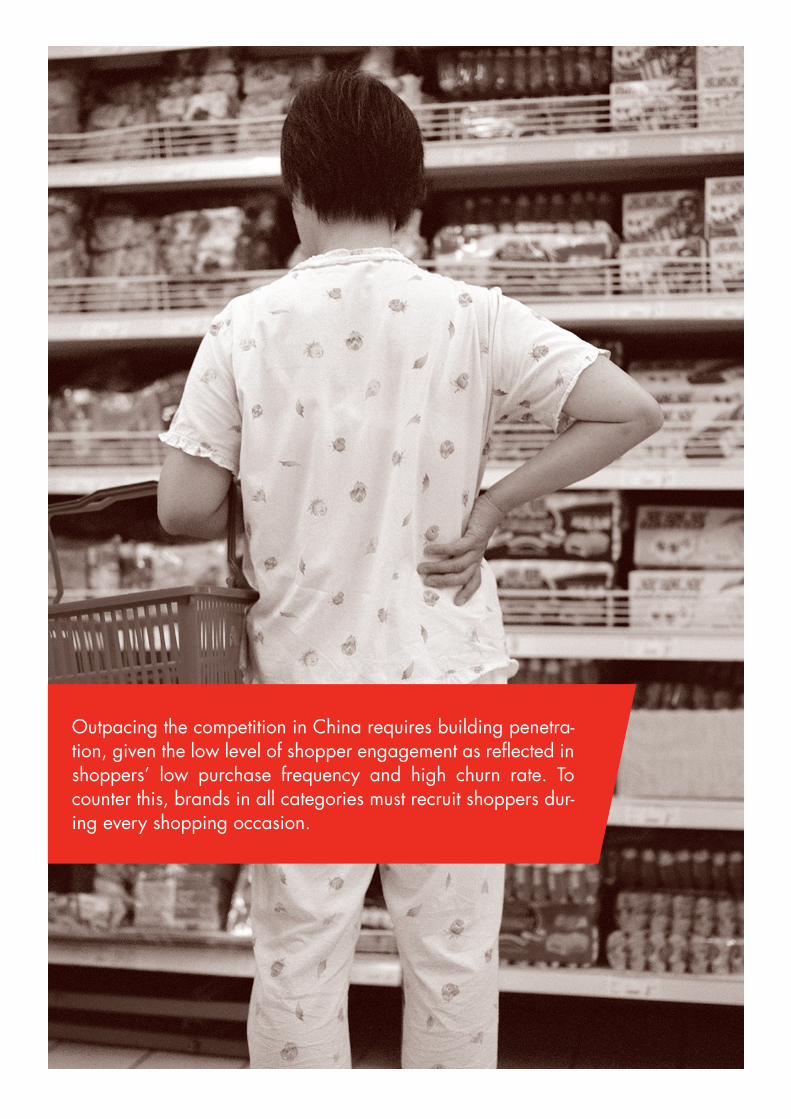
Outpacing the competition in China requires building penetra-tion, given the low level of shopper engagement as reflected in shoppers’ low purchase frequency and high churn rate. To counter this, brands in all categories must recruit shoppers dur-ing every shopping occasion.
Growing brands by understanding what Chinese shoppers really do, Vol. 1 | Bain & Company, Inc. | Kantar Worldpanel
Page 23
• Use innovations in products and packaging to cre-ate new consumption occasions and allow the brand to reach new consumer groups. Examples include promotion packs, seasonal packs and prod-ucts available on other parts of the shelf. Oreo has pursued this approach by offering multiple formats of its biscuit (sandwich, wafer and mini) and mul-tiple price packs.
In categories with stronger loyalist behavior, marketers can drive penetration in the following ways:
• Build preference, not just consideration. Market-ers should strive to make a brand the preferred brand for shoppers and to create high switching costs. This can be accomplished through above-the-line marketing, as well as through specific shopper recruitment programs involving free tri-als for a period of time.
• Be visible and dominant on the main shelf. For loy-alist brands, it is not necessary to activate shoppers continually or to be present outside the main shelf. Shoppers can be expected to find the brand they pre-fer. For example, Pampers, the baby diapers catego-ry’s leading brand, always has dominant shelf space with very good in-store visibility on the main shelf.
• Use innovations to get shoppers to trade up to pre-mium offerings. By keeping a step ahead of the competition with product innovations, companies can use shoppers’ loyalty as the foundation for driv-ing higher revenue through purchases of more ex-pensive products. For example, Bright has success-fully launched a premium-priced, ambient yogurt (called Momchilovtsi) based on imported lactoba-cillus to address the needs of consumers for high-quality products.
In all categories, marketers can apply Bain & Compa-ny’s effective approach to growing brands, developed on the basis of our extensive research in China and other markets:
• Identify the rules of the category. This entails under-standing the category definition based on repertoire versus loyalist behavior, profit pool dynamics and an
analysis of the drivers of share gains and losses across the category’s brands.
• Pick the right “battles” based on the category’s rules. Decide where to play (for example, in terms of brands, needs and occasions, price tiers, channels and locations), the targets for revenue and profits, the resource requirements and the business model. It is also critical to define where not to play—for example, which brands to deprioritize—and to ac-cept the resource allocation implications. Too often, we see companies decide to deprioritize a brand but then continue to make marketing investments and set high revenue-growth targets.
• Define the right offer. The concept for the brand should be defined on the basis of dimensions such as saliency, hierarchy, identity, price positioning, the optimal SKU range and the role of innovation.
• Design the winning activation model for the offer. Develop insight-based strategies for the mix of above-the-line and below-the-line marketing and activation levers. These include media and trade spending, shelf locations, promotional activities and guidelines for perfect in-store execution.
Transitioning from opacity to clarity in your under-standing of Chinese shoppers will be critical to de-veloping a strategy that will help your brands grow and gain share. Outpacing the competition in China requires building penetration, given the low level of shopper engagement as reflected in shoppers’ low purchase frequency and high churn rate. To counter this, brands in all categories must recruit shoppers during every shopping occasion—at the very least to replace the shoppers inevitably lost through churn. With a solid understanding of a category’s position on the continuum from repertoire to loyalist, mar-keters can take the right steps to attract new shop-pers to their brand. These findings from our 2013 groundbreaking study of Chinese shoppers provide valuable insights to executives seeking the route to success in this complex market, which faces slowing growth and intensifying competition.
Growing brands by understanding what Chinese shoppers really do, Vol. 1 | Bain & Company, Inc. | Kantar Worldpanel
Page 24
About the authors
Bruno Lannes is a partner in Bain’s Shanghai office and leads the firm’s Consumer Products and Retail practices for Greater China. You may contact him by email at [email protected]
Kevin Chong is a partner in Bain’s Shanghai office. You may contact him by email at [email protected]
James Root is a partner in Bain’s Hong Kong office. You may contact him by email at [email protected]
Fiona Liu is a manager in Bain’s Shanghai office. You may contact her by email at [email protected]
Mike Booker is a partner in Bain’s Singapore office and leads the firm’s Consumer Products and Retail practices for Asia. You may contact him by email at [email protected]
Guy Brusselmans is a partner in Bain’s Brussels office. You may contact him by email at [email protected]
Marcy Kou is CEO at Kantar Worldpanel Asia. You may contact her by email at [email protected]
Jason Yu is General Manager at Kantar Worldpanel China. You may contact him by email at [email protected]
Please direct questions and comments about this report via email to the authors.
Acknowledgments
This report is a joint effort between Bain & Company and Kantar Worldpanel. The authors extend gratitude to all who contributed to this report, in particular Chen Chen from Bain & Company and Vincent Shao and Lydia Wang from Kantar Worldpanel.

Shared Ambition, True Results
Bain & Company is the management consulting firm that the world’s business leaders come to when they want results.Bain advises clients on strategy, operations, technology, organization, private equity and mergers and acquisitions. We
develop practical, customized insights that clients act on and transfer skills that make change stick. Founded in 1973,
Bain has 48 offices in 31 countries, and our deep expertise and client roster cross every industry and economic sector.
Our clients have outperformed the stock market 4 to 1.
What sets us apartWe believe a consulting firm should be more than an adviser. So we put ourselves in our clients’ shoes, selling
outcomes, not projects. We align our incentives with our clients by linking our fees to their results and collaborate to
unlock the full potential of their business. Our Results Delivery® process builds our clients’ capabilities, and our True
North values mean we do the right thing for our clients, people and communities—always.
Bain in Greater ChinaBain was the first strategic consulting firm to set up an office in Beijing in 1993. Since then Bain has worked with both
multinationals and local clients across more than 30 industries. We have served our clients in more than 40 cities in
China. There are now three offices in the Greater China region, covering Beijing, Shanghai and Hong Kong. There are
about 150 consultants currently working in Greater China, with extensive Chinese and global working experiences.
Kantar Worldpanel—high definition inspiration™, a CTR service in ChinaKantar Worldpanel is the world leader in continuous consumer panels. Our global team of consultants apply tailored
research solutions and advanced analytics to bring you unrivaled sharpness and clarity of insight to both the big picture
and the fine detail. We help our clients understand what people buy, what they use and the attitudes behind shopper
and consumer behavior.
We use the latest data collection technologies best matched to the people and the environment we are measuring.
Our expertise is rooted in hard, quantitative evidence—evidence that has become the market currency for local and
multinational FMCG brand and private label manufacturers, fresh food suppliers, retailers, market analysts and
government organizations. We are not limited to the grocery sector; we have a wide range of panels in fields as diverse
as entertainment, communications, petrol, fashion, personal care, beauty, baby and food on-the-go.
It’s what we do with our data that sets us apart. We apply hindsight, insight, foresight and advice to make a real
difference to the way you see your world and inspire the actions you take for a more successful business.
We have more than 40 years’ experience in helping companies shape their strategies and manage their tactical
decisions; we understand shopper and retailer dynamics; we explore opportunities for growth in terms of products,
categories, regions and within trade environments. Together with our partner relationships, we are present in more
than 50 countries—in most of which we are market leaders—which means we can deliver inspiring insights on a local,
regional and global scale. Kantar Worldpanel was formerly known as TNS Worldpanel.