Glaucoma A Novel Method for the Induction of … 2011.pdfA Novel Method for the Induction of...
5
A Novel Method for the Induction of Experimental Glaucoma Using Magnetic Microspheres Paulina A. Samsel, 1 Lilian Kisiswa, 1 Jonathan T. Erichsen, 1 Stephen D. Cross, 1 and James E. Morgan 1,2 PURPOSE. The development of a method for the sustained ele- vation of intraocular pressure in experimental glaucoma based on the anterior chamber injection of paramagnetic microbeads. METHODS. Unilateral glaucoma was induced in adult male Nor- wegian Brown rats by the injection of paramagnetic polysty- rene microspheres. A handheld 0.45 Tesla magnet was used to draw the beads into the iridocorneal angle to impede aqueous drainage via the trabecular meshwork. RESULTS. Elevated intraocular pressures (IOPs) were induced in 61 rats, resulting in a mean elevation of 5.8 mm Hg 1.0 (SEM) relative to the contralateral control eye. The mean duration of sustained IOP elevation (defined as 5 mm Hg relative to the control eye for at least 7 consecutive days) after a single injection was 12.8 days 0.9 (SEM, maximum duration 27 days). In all eyes, the visual axis remained clear from the time of injection, with minimal inflammation after injection. Retinal ganglion cell loss was determined in 21 animals (mean integral IOP, 194.5 mm Hg days 87.5 [SEM]) as 36.4% 2.4 (SEM) compared with the contralateral, untreated eye. CONCLUSIONS. The use of paramagnetic microbeads for the oc- clusion of the iridocorneal angle produces a sustained eleva- tion of IOP with fewer injections and avoids the risk of visual axis occlusion. It represents a simple and effective method for the induction of experimental glaucoma. (Invest Ophthalmol Vis Sci. 2011;52:1671–1675) DOI:10.1167/iovs.09-3921 C onsiderable advances have been made in our understand- ing of the pathophysiology of glaucoma, helped in part by the availability of cost-effective models of disease based on rodents, such as the rat and mouse. 1,2 Although spontaneous genetic models of glaucoma exist, 3 the use of models in which the precise onset of glaucoma can be determined is important for grading diseases and the evaluation of novel therapies. A variety of methods have been developed for the elevation of intraocular pressure (IOP), each with advantages and disad- vantages. For example, cautery of episcleral vessels, 4–7 per- haps the simplest method, runs the risk that it might create venous drainage of the choroid and therefore induce retinal effects unrelated to the elevation of IOP. Other methods, such as episcleral vein sclerosis with hypertonic saline IOP 8 –10 , limit the outflow of aqueous at the level of the trabecular meshwork to produce stable and moderate elevations of IOP with a low risk of choroidal damage. 11 However, the injections can be technically challenging. As a result of these considerations, alternative methods have been sought to induce experimental glaucoma in rodents. Laser occlusion of the episcleral ves- sels 12–16 can be effective but works best with albino animals and requires use of a laser facility. More recently, methods based on obstruction of the trabecular meshwork with micro- scopic beads have been used, 7,17 after successful application of this technique in primates. 18 The injection of microbeads into the anterior chamber is straightforward, does not require spe- cialist equipment, and can be applied to a range of species with only minor modification. Furthermore, the IOP elevation can be modulated with subsequent injections. The principal disad- vantage is that beads can be difficult to retain after injection, resulting in a variable increase in IOP. The location of the beads within the anterior chamber can also be difficult to control; if beads locate to the pupillary zone, they can compromise fun- doscopic monitoring of optic nerve damage. To address these issues, we have developed a novel tech- nique for the induction of ocular hypertension using paramag- netic microbeads. The beads have the advantage that they can be directed to the iridocorneal angle in the rodent eye to optimize occlusion of the trabecular meshwork and facilitate visualization of the fundus. Subsequent injections can be given, as required, to further modulate the elevation in IOP. MATERIALS AND METHODS Induction of Elevated IOP All experimental procedures complied with Home Office (UK) regula- tions and the ARVO Statement for the Use of Animals in Ophthalmic and Vision Research. Sixty-one retired male breeder Brown Norway rats were housed in a constant low-light environment (40 – 60 lux) to minimize diurnal fluctuations in IOP, with food and water provided ad libitum. IOPs were measured three times before injection and daily or every 2 to 3 days after injection using a rebound tonometer (TonoLab; Tiolat, Oy, Finland) calibrated for use with the rat eye. 19 All measure- ments were made in awake animals in which the cornea was anesthe- tized using topical 0.4% oxybuprocaine hydrochloride eye drops (Chauvin, Kingston-Upon-Thames, UK). The IOP was taken as the mean and SD of five readings. In each animal, the IOP was elevated in the left eye by injecting a sterile balanced salt solution (BSS; Alcon UK, Hemel Hempstead, UK) containing 30 mg/mL ferro-magnetic microspheres (Corpuscular Inc, Cold Spring, NY; bead diameter, 5 m) into the anterior chamber of the left eye. Microspheres were sterilized by -irradiation (Gammacell 1000 Elite Caesium Source, 22 TBq; Nordon International, Inc., On- tario, Canada). All injections were made under isoflurane anesthesia, with topical chloramphenicol (0.5%) administered pre- and post-injec- tion (Chauvin). Approximately 10 –20 L was injected into the anterior chamber of the left eye, delivering approximately 0.3– 0.6 mg of beads. The right eye acted as an unoperated control. Injections were made From the Schools of 1 Optometry and Vision Sciences and 2 Medi- cine, Cardiff University, Cardiff, United Kingdom. Supported by the National Eye Research Centre UK Grant No. SCIAD050. Submitted for publication April 27, 2009; revised January 6, March 19, and July 23, 2010; accepted August 2, 2010. Disclosure: P.A. Samsel, None; L. Kisiswa, None; J.T. Erichsen, None; S.D. Cross, None; J.E. Morgan, Pfizer (F) Corresponding author: James E. Morgan, School of Optometry and Vision Sciences, Cardiff University, Maindy Road, Cardiff CF24 4LU, UK; [email protected]. Glaucoma Investigative Ophthalmology & Visual Science, March 2011, Vol. 52, No. 3 Copyright 2011 The Association for Research in Vision and Ophthalmology, Inc. 1671
Transcript of Glaucoma A Novel Method for the Induction of … 2011.pdfA Novel Method for the Induction of...
A Novel Method for the Induction of ExperimentalGlaucoma Using Magnetic Microspheres
Paulina A. Samsel,1 Lilian Kisiswa,1 Jonathan T. Erichsen,1 Stephen D. Cross,1
and James E. Morgan1,2
PURPOSE. The development of a method for the sustained ele-vation of intraocular pressure in experimental glaucoma basedon the anterior chamber injection of paramagnetic microbeads.
METHODS. Unilateral glaucoma was induced in adult male Nor-wegian Brown rats by the injection of paramagnetic polysty-rene microspheres. A handheld 0.45 Tesla magnet was used todraw the beads into the iridocorneal angle to impede aqueousdrainage via the trabecular meshwork.
RESULTS. Elevated intraocular pressures (IOPs) were induced in61 rats, resulting in a mean elevation of 5.8 mm Hg � 1.0 (SEM)relative to the contralateral control eye. The mean duration ofsustained IOP elevation (defined as �5 mm Hg relative to thecontrol eye for at least 7 consecutive days) after a singleinjection was 12.8 days � 0.9 (SEM, maximum duration 27days). In all eyes, the visual axis remained clear from the timeof injection, with minimal inflammation after injection. Retinalganglion cell loss was determined in 21 animals (mean integralIOP, 194.5 mm Hg days � 87.5 [SEM]) as 36.4% � 2.4 (SEM)compared with the contralateral, untreated eye.
CONCLUSIONS. The use of paramagnetic microbeads for the oc-clusion of the iridocorneal angle produces a sustained eleva-tion of IOP with fewer injections and avoids the risk of visualaxis occlusion. It represents a simple and effective method forthe induction of experimental glaucoma. (Invest OphthalmolVis Sci. 2011;52:1671–1675) DOI:10.1167/iovs.09-3921
Considerable advances have been made in our understand-ing of the pathophysiology of glaucoma, helped in part by
the availability of cost-effective models of disease based onrodents, such as the rat and mouse.1,2 Although spontaneousgenetic models of glaucoma exist,3 the use of models in whichthe precise onset of glaucoma can be determined is importantfor grading diseases and the evaluation of novel therapies.
A variety of methods have been developed for the elevationof intraocular pressure (IOP), each with advantages and disad-vantages. For example, cautery of episcleral vessels,4–7 per-haps the simplest method, runs the risk that it might createvenous drainage of the choroid and therefore induce retinaleffects unrelated to the elevation of IOP. Other methods, suchas episcleral vein sclerosis with hypertonic saline IOP8–10, limitthe outflow of aqueous at the level of the trabecular meshwork
to produce stable and moderate elevations of IOP with a lowrisk of choroidal damage.11 However, the injections can betechnically challenging. As a result of these considerations,alternative methods have been sought to induce experimentalglaucoma in rodents. Laser occlusion of the episcleral ves-sels12–16 can be effective but works best with albino animalsand requires use of a laser facility. More recently, methodsbased on obstruction of the trabecular meshwork with micro-scopic beads have been used,7,17 after successful application ofthis technique in primates.18 The injection of microbeads intothe anterior chamber is straightforward, does not require spe-cialist equipment, and can be applied to a range of species withonly minor modification. Furthermore, the IOP elevation canbe modulated with subsequent injections. The principal disad-vantage is that beads can be difficult to retain after injection,resulting in a variable increase in IOP. The location of the beadswithin the anterior chamber can also be difficult to control; ifbeads locate to the pupillary zone, they can compromise fun-doscopic monitoring of optic nerve damage.
To address these issues, we have developed a novel tech-nique for the induction of ocular hypertension using paramag-netic microbeads. The beads have the advantage that they canbe directed to the iridocorneal angle in the rodent eye tooptimize occlusion of the trabecular meshwork and facilitatevisualization of the fundus. Subsequent injections can be given,as required, to further modulate the elevation in IOP.
MATERIALS AND METHODS
Induction of Elevated IOP
All experimental procedures complied with Home Office (UK) regula-tions and the ARVO Statement for the Use of Animals in Ophthalmicand Vision Research. Sixty-one retired male breeder Brown Norwayrats were housed in a constant low-light environment (40–60 lux) tominimize diurnal fluctuations in IOP, with food and water provided adlibitum. IOPs were measured three times before injection and daily orevery 2 to 3 days after injection using a rebound tonometer (TonoLab;Tiolat, Oy, Finland) calibrated for use with the rat eye.19 All measure-ments were made in awake animals in which the cornea was anesthe-tized using topical 0.4% oxybuprocaine hydrochloride eye drops(Chauvin, Kingston-Upon-Thames, UK). The IOP was taken as themean and SD of five readings.
In each animal, the IOP was elevated in the left eye by injecting asterile balanced salt solution (BSS; Alcon UK, Hemel Hempstead, UK)containing 30 mg/mL ferro-magnetic microspheres (Corpuscular Inc,Cold Spring, NY; bead diameter, 5 �m) into the anterior chamber ofthe left eye. Microspheres were sterilized by �-irradiation (Gammacell1000 Elite Caesium Source, 22 TBq; Nordon International, Inc., On-tario, Canada). All injections were made under isoflurane anesthesia,with topical chloramphenicol (0.5%) administered pre- and post-injec-tion (Chauvin). Approximately 10–20 �L was injected into the anteriorchamber of the left eye, delivering approximately 0.3–0.6 mg of beads.The right eye acted as an unoperated control. Injections were made
From the Schools of 1Optometry and Vision Sciences and 2Medi-cine, Cardiff University, Cardiff, United Kingdom.
Supported by the National Eye Research Centre UK Grant No.SCIAD050.
Submitted for publication April 27, 2009; revised January 6, March19, and July 23, 2010; accepted August 2, 2010.
Disclosure: P.A. Samsel, None; L. Kisiswa, None; J.T. Erichsen,None; S.D. Cross, None; J.E. Morgan, Pfizer (F)
Corresponding author: James E. Morgan, School of Optometry andVision Sciences, Cardiff University, Maindy Road, Cardiff CF24 4LU,UK; [email protected].
Glaucoma
Investigative Ophthalmology & Visual Science, March 2011, Vol. 52, No. 3Copyright 2011 The Association for Research in Vision and Ophthalmology, Inc. 1671
using a 32- or 33-gauge needle (Hamilton Corporation, Bonaduz, Swit-zerland; and WPI Ltd, Stevenage, UK, respectively) inserted parallel tothe iris. The 33-gauge needles were beveled on three sides to facilitateinjection through the cornea and provided the easiest transit throughthe corneal stroma. A tunneled injection was made with the needlerunning parallel to the anterior surface of the iris to minimize the risk
of iris trauma. Since the beads tended to settle in the syringe under theinfluence of gravity, the syringe and needle were agitated using avortex stirrer immediately before injection to resuspend the beads inBSS. The minimum period between subsequent injections was 1 week.
Once the injection of beads was completed, the needle was kept inposition to ensure maintenance of anterior chamber depth, and thebeads then drawn away from the injection site using a small handheldmagnet (0.45 Tesla), thereby minimizing the egress of beads from theinjection track. The magnet was then used to distribute the micro-spheres around the iridocorneal angle to reduce the outflow of aque-ous humor via the trabecular meshwork. Immediate increases in IOPcould be moderated by allowing the leakage of aqueous around theinjection cannula as it was withdrawn from the eye. Attempts to do thiswithout redirection of beads resulted in the loss of beads via theinjection site. Microsphere injections were performed up to threetimes in the left eye, depending on the required level and duration ofthe IOP elevation. For the purposes of control studies, five rats wereinjected with 20 �L of magnetic microspheres without magnetic di-rection to the iridocorneal angle. Five rats received a vehicle injectionof 20 �L BSS (no beads) into the anterior chamber.
All rats were subsequently killed by an overdose of CO2 andselected retinas prepared as whole mounts for the quantification of cellloss in the retinal ganglion cell (RGC) layer. Anterior segment images ofthe beads distribution were taken as required with a camera (NikonCoolpix 4500; Nikon, Tokyo, Japan) attached to a slitlamp (Haag StreitUK Ltd, Harlow, UK). Cryosections (10 �m) of the anterior chambersprepared on gelatin-coated slides were stained with hematoxylin andeosin for bright-field microscopic imaging or mounted under DPX(Raymond A. Lamb) for DIC imaging. Section images were taken usinga bright-field microscope (Leica DMRA2; Leica Microsystems [UK] Ltd,Milton Keynes, UK) and associated software (Leica QWin v.3; Leica).
Neuron Nuclei Imaging
For the quantification of RGC loss, retinal whole mounts were stained(Hoechst 33342; Sigma-Aldrich, Gillingham, UK) and mounted in anti-
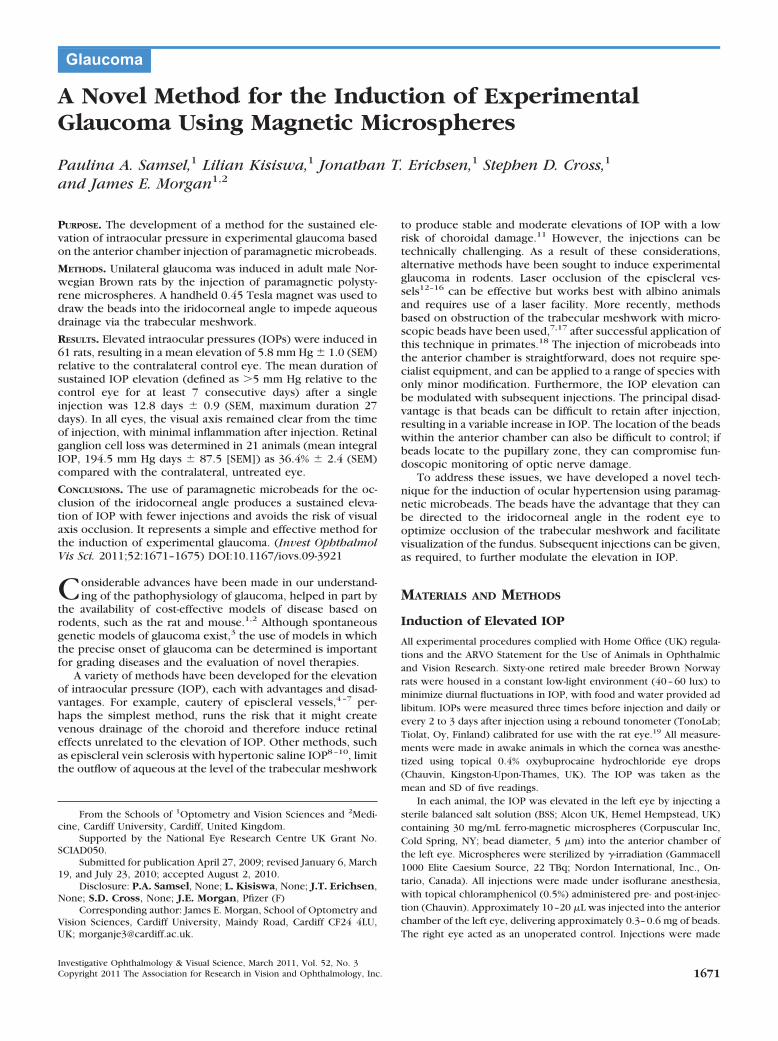
FIGURE 1. Magnet (large arrow) used to direct beads to the anteriorchamber angle. The smaller arrows show the location of beads in theiridocorneal angle. Arrow a indicates beads adjacent to the magnetthat are being drawn into the angle. Arrow b shows the location ofbeads contralateral to the magnet that were previously drawn into theangle and remain in situ. Scale bar, 1 cm.
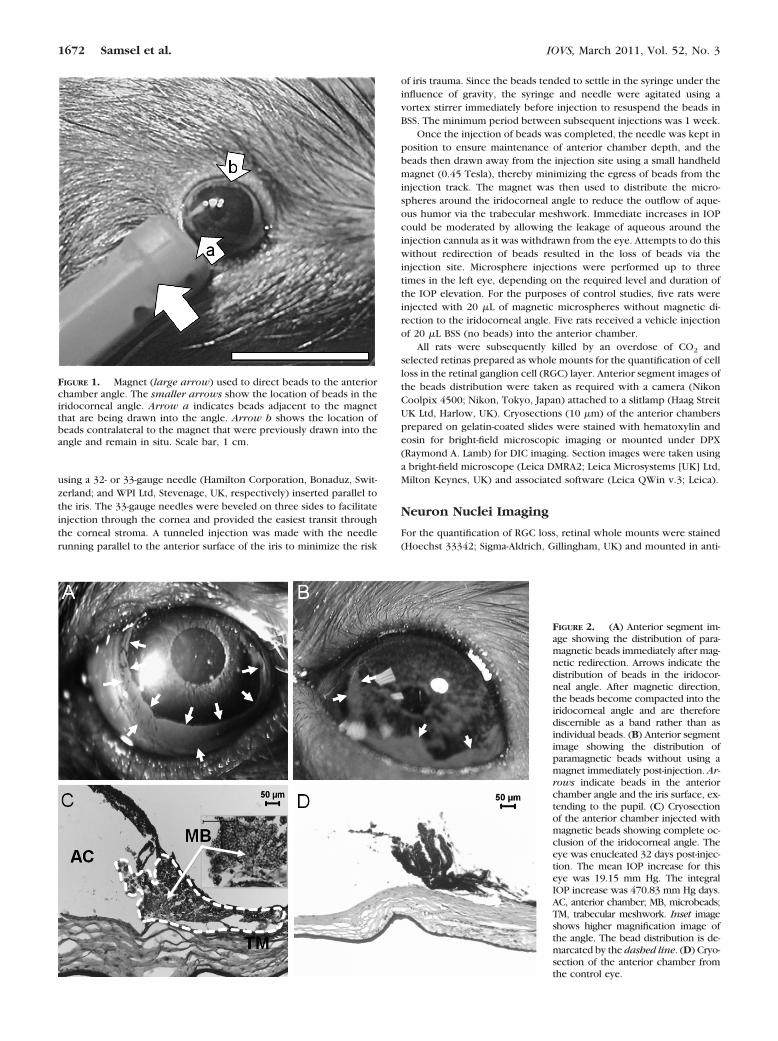
FIGURE 2. (A) Anterior segment im-age showing the distribution of para-magnetic beads immediately after mag-netic redirection. Arrows indicate thedistribution of beads in the iridocor-neal angle. After magnetic direction,the beads become compacted into theiridocorneal angle and are thereforediscernible as a band rather than asindividual beads. (B) Anterior segmentimage showing the distribution ofparamagnetic beads without using amagnet immediately post-injection. Ar-rows indicate beads in the anteriorchamber angle and the iris surface, ex-tending to the pupil. (C) Cryosectionof the anterior chamber injected withmagnetic beads showing complete oc-clusion of the iridocorneal angle. Theeye was enucleated 32 days post-injec-tion. The mean IOP increase for thiseye was 19.15 mm Hg. The integralIOP increase was 470.83 mm Hg days.AC, anterior chamber; MB, microbeads;TM, trabecular meshwork. Inset imageshows higher magnification image ofthe angle. The bead distribution is de-marcated by the dashed line. (D) Cryo-section of the anterior chamber fromthe control eye.
1672 Samsel et al. IOVS, March 2011, Vol. 52, No. 3
fade medium (ProLong Gold; Invitrogen Ltd, Paisley, UK). The numberof cells in the RGC layer was counted to provide an index of celldamage. Although amacrine cells would have been included in theanalysis,20,21 this has been validated in the mouse glaucoma model asa useful measure of RGC damage that avoids the variability associatedwith RGC labeling.22
Images of the RGC layer were obtained using a fluorescent micro-scope (Leica 6000B; Leica) linked to software (Stereo Investigator;MicroBrightField, Magdeburg, Germany). Retinal specimens wereplaced on a motorized stage, and the cells in the retinal ganglion celllayer (RGCL) were imaged with a �20 objective in 12 fields (samplearea, 11,3095 �m2) arranged in a grid centered on the optic nerve. Thenumber of labeled cells was counted manually (Cell Counter plug-in forImageJ; NIH Images, NIH, Bethesda, MD). Approximately 2.4% of thetotal retinal area was sampled to estimate neuronal loss when com-pared with the contralateral control eye. Standard morphologic criteriawere applied for discriminating nonneuronal cells (endothelial andglial cells) from neuronal cells.
Statistics
Statistical analysis was performed using standard statistical software(SPSS v.16.0 for Windows; SPSS, Chicago, IL). Normally distributeddata for the peak and integral IOP for the eyes with and withouthemorrhages were compared using independent-sample t-tests. IOPmeasurements for single animals were expressed as mean � SD (SD).Unless stated otherwise, group values were expressed as means andstandard errors of the mean (SEM). Pearson’s correlation coefficientwas used to test the correlation between peak IOP increase and cellloss and mean IOP elevation and cell loss. The RGC layer counts incontrol and experimental groups were compared using the indepen-dent-sample t-test. The degree of cell loss in different retinal regionswas compared using a one-way ANOVA. Normally distributed data forthe mean IOP of the injected and contralateral eyes were comparedusing independent-sample t-test.
RESULTS
IOP Elevation
Microbead injections were made in 61 rats. Figure 1 dem-onstrates the technique for directing the microspheres tothe iridocorneal angle with the handheld external magnet.The magnet strength was selected to exert local controlof the microbead distribution; beads lodged in the iridocornealangle opposite the magnet were not displaced. The typicalbead distribution after injection and redirection with the ex-ternal magnet is shown in Figure 2A. With sufficient anteriorchamber depth, the beads could easily be directed to provideuniform occlusion of the iridocorneal angle, a process facili-tated by retention of the cannula in the anterior chamberduring bead redistribution. Histologic examination of the ante-rior segment of the eye after a single intraocular bead injectionconfirmed sequestration of the beads within the trabecularmeshwork (Fig. 2C) in contrast with an uninjected contralat-eral eye (Fig. 2D).
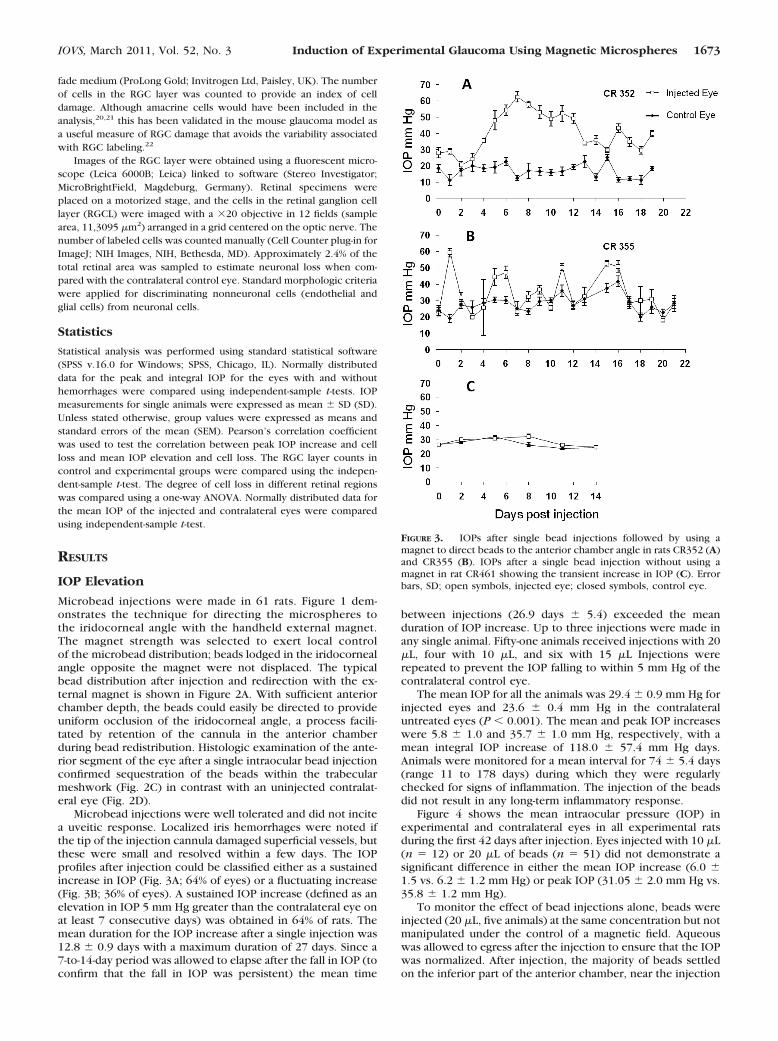
Microbead injections were well tolerated and did not incitea uveitic response. Localized iris hemorrhages were noted ifthe tip of the injection cannula damaged superficial vessels, butthese were small and resolved within a few days. The IOPprofiles after injection could be classified either as a sustainedincrease in IOP (Fig. 3A; 64% of eyes) or a fluctuating increase(Fig. 3B; 36% of eyes). A sustained IOP increase (defined as anelevation in IOP 5 mm Hg greater than the contralateral eye onat least 7 consecutive days) was obtained in 64% of rats. Themean duration for the IOP increase after a single injection was12.8 � 0.9 days with a maximum duration of 27 days. Since a7-to-14-day period was allowed to elapse after the fall in IOP (toconfirm that the fall in IOP was persistent) the mean time
between injections (26.9 days � 5.4) exceeded the meanduration of IOP increase. Up to three injections were made inany single animal. Fifty-one animals received injections with 20�L, four with 10 �L, and six with 15 �L Injections wererepeated to prevent the IOP falling to within 5 mm Hg of thecontralateral control eye.
The mean IOP for all the animals was 29.4 � 0.9 mm Hg forinjected eyes and 23.6 � 0.4 mm Hg in the contralateraluntreated eyes (P � 0.001). The mean and peak IOP increaseswere 5.8 � 1.0 and 35.7 � 1.0 mm Hg, respectively, with amean integral IOP increase of 118.0 � 57.4 mm Hg days.Animals were monitored for a mean interval for 74 � 5.4 days(range 11 to 178 days) during which they were regularlychecked for signs of inflammation. The injection of the beadsdid not result in any long-term inflammatory response.
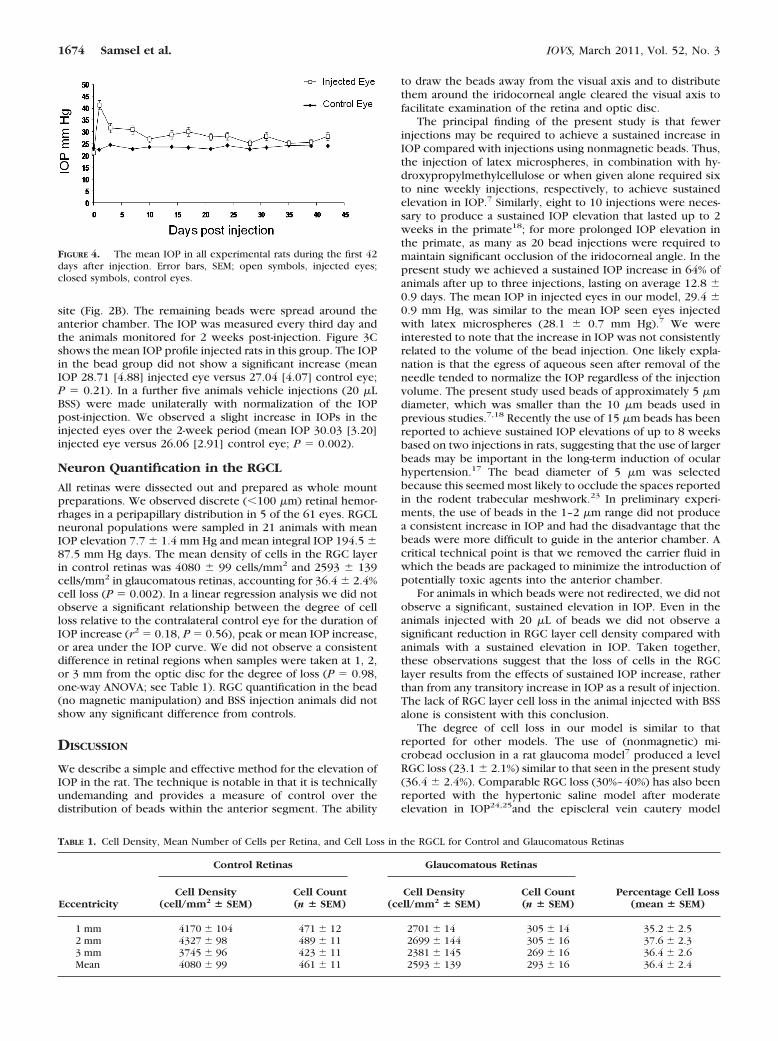
Figure 4 shows the mean intraocular pressure (IOP) inexperimental and contralateral eyes in all experimental ratsduring the first 42 days after injection. Eyes injected with 10 �L(n � 12) or 20 �L of beads (n � 51) did not demonstrate asignificant difference in either the mean IOP increase (6.0 �1.5 vs. 6.2 � 1.2 mm Hg) or peak IOP (31.05 � 2.0 mm Hg vs.35.8 � 1.2 mm Hg).
To monitor the effect of bead injections alone, beads wereinjected (20 �L, five animals) at the same concentration but notmanipulated under the control of a magnetic field. Aqueouswas allowed to egress after the injection to ensure that the IOPwas normalized. After injection, the majority of beads settledon the inferior part of the anterior chamber, near the injection
FIGURE 3. IOPs after single bead injections followed by using amagnet to direct beads to the anterior chamber angle in rats CR352 (A)and CR355 (B). IOPs after a single bead injection without using amagnet in rat CR461 showing the transient increase in IOP (C). Errorbars, SD; open symbols, injected eye; closed symbols, control eye.
IOVS, March 2011, Vol. 52, No. 3 Induction of Experimental Glaucoma Using Magnetic Microspheres 1673
site (Fig. 2B). The remaining beads were spread around theanterior chamber. The IOP was measured every third day andthe animals monitored for 2 weeks post-injection. Figure 3Cshows the mean IOP profile injected rats in this group. The IOPin the bead group did not show a significant increase (meanIOP 28.71 [4.88] injected eye versus 27.04 [4.07] control eye;P � 0.21). In a further five animals vehicle injections (20 �LBSS) were made unilaterally with normalization of the IOPpost-injection. We observed a slight increase in IOPs in theinjected eyes over the 2-week period (mean IOP 30.03 [3.20]injected eye versus 26.06 [2.91] control eye; P � 0.002).
Neuron Quantification in the RGCL
All retinas were dissected out and prepared as whole mountpreparations. We observed discrete (�100 �m) retinal hemor-rhages in a peripapillary distribution in 5 of the 61 eyes. RGCLneuronal populations were sampled in 21 animals with meanIOP elevation 7.7 � 1.4 mm Hg and mean integral IOP 194.5 �87.5 mm Hg days. The mean density of cells in the RGC layerin control retinas was 4080 � 99 cells/mm2 and 2593 � 139cells/mm2 in glaucomatous retinas, accounting for 36.4 � 2.4%cell loss (P � 0.002). In a linear regression analysis we did notobserve a significant relationship between the degree of cellloss relative to the contralateral control eye for the duration ofIOP increase (r2 � 0.18, P � 0.56), peak or mean IOP increase,or area under the IOP curve. We did not observe a consistentdifference in retinal regions when samples were taken at 1, 2,or 3 mm from the optic disc for the degree of loss (P � 0.98,one-way ANOVA; see Table 1). RGC quantification in the bead(no magnetic manipulation) and BSS injection animals did notshow any significant difference from controls.
DISCUSSION
We describe a simple and effective method for the elevation ofIOP in the rat. The technique is notable in that it is technicallyundemanding and provides a measure of control over thedistribution of beads within the anterior segment. The ability
to draw the beads away from the visual axis and to distributethem around the iridocorneal angle cleared the visual axis tofacilitate examination of the retina and optic disc.
The principal finding of the present study is that fewerinjections may be required to achieve a sustained increase inIOP compared with injections using nonmagnetic beads. Thus,the injection of latex microspheres, in combination with hy-droxypropylmethylcellulose or when given alone required sixto nine weekly injections, respectively, to achieve sustainedelevation in IOP.7 Similarly, eight to 10 injections were neces-sary to produce a sustained IOP elevation that lasted up to 2weeks in the primate18; for more prolonged IOP elevation inthe primate, as many as 20 bead injections were required tomaintain significant occlusion of the iridocorneal angle. In thepresent study we achieved a sustained IOP increase in 64% ofanimals after up to three injections, lasting on average 12.8 �0.9 days. The mean IOP in injected eyes in our model, 29.4 �0.9 mm Hg, was similar to the mean IOP seen eyes injectedwith latex microspheres (28.1 � 0.7 mm Hg).7 We wereinterested to note that the increase in IOP was not consistentlyrelated to the volume of the bead injection. One likely expla-nation is that the egress of aqueous seen after removal of theneedle tended to normalize the IOP regardless of the injectionvolume. The present study used beads of approximately 5 �mdiameter, which was smaller than the 10 �m beads used inprevious studies.7,18 Recently the use of 15 �m beads has beenreported to achieve sustained IOP elevations of up to 8 weeksbased on two injections in rats, suggesting that the use of largerbeads may be important in the long-term induction of ocularhypertension.17 The bead diameter of 5 �m was selectedbecause this seemed most likely to occlude the spaces reportedin the rodent trabecular meshwork.23 In preliminary experi-ments, the use of beads in the 1–2 �m range did not producea consistent increase in IOP and had the disadvantage that thebeads were more difficult to guide in the anterior chamber. Acritical technical point is that we removed the carrier fluid inwhich the beads are packaged to minimize the introduction ofpotentially toxic agents into the anterior chamber.
For animals in which beads were not redirected, we did notobserve a significant, sustained elevation in IOP. Even in theanimals injected with 20 �L of beads we did not observe asignificant reduction in RGC layer cell density compared withanimals with a sustained elevation in IOP. Taken together,these observations suggest that the loss of cells in the RGClayer results from the effects of sustained IOP increase, ratherthan from any transitory increase in IOP as a result of injection.The lack of RGC layer cell loss in the animal injected with BSSalone is consistent with this conclusion.
The degree of cell loss in our model is similar to thatreported for other models. The use of (nonmagnetic) mi-crobead occlusion in a rat glaucoma model7 produced a levelRGC loss (23.1 � 2.1%) similar to that seen in the present study(36.4 � 2.4%). Comparable RGC loss (30%–40%) has also beenreported with the hypertonic saline model after moderateelevation in IOP24,25and the episcleral vein cautery model
FIGURE 4. The mean IOP in all experimental rats during the first 42days after injection. Error bars, SEM; open symbols, injected eyes;closed symbols, control eyes.
TABLE 1. Cell Density, Mean Number of Cells per Retina, and Cell Loss in the RGCL for Control and Glaucomatous Retinas
Eccentricity
Control Retinas Glaucomatous Retinas
Percentage Cell Loss(mean � SEM)
Cell Density(cell/mm2 � SEM)
Cell Count(n � SEM)
Cell Density(cell/mm2 � SEM)
Cell Count(n � SEM)
1 mm 4170 � 104 471 � 12 2701 � 14 305 � 14 35.2 � 2.52 mm 4327 � 98 489 � 11 2699 � 144 305 � 16 37.6 � 2.33 mm 3745 � 96 423 � 11 2381 � 145 269 � 16 36.4 � 2.6Mean 4080 � 99 461 � 11 2593 � 139 293 � 16 36.4 � 2.4
1674 Samsel et al. IOVS, March 2011, Vol. 52, No. 3
(30%–40%).5,26,27 We did not observe a consistent variation inthe degree of cell loss as a function of retinal eccentricity in thesampled range (1–3 mm). By contrast, clustered RGC loss hasbeen reported in the rat vein cautery model.28 Other studieshave reported greater cell loss in the peripheral compared withcentral regions, but in animals with longer durations of IOP;4
this pattern of cell loss has been observed in a comparativestudy of bead injection, cautery, and hypertonic saline models,with the greatest effect seen with vein cautery.7
In summary, we present a simple method for the inductionof experimental glaucoma in the rodent eye. It has the princi-pal advantages over nonmagnetic microbead models in that thevisual axis is not obscured after injection and that completeocclusion of the iridocorneal angle can be achieved with asingle injection. We anticipate that it could be adapted withlittle modification for use in other species.
References
1. Morrison JC, Johnson E, Cepurna WO. Rat models for glaucomaresearch. Prog Brain Res. 2008;173:285–301.
2. John SW. Mechanistic insights into glaucoma provided by experi-mental genetics: the Cogan Lecture. Invest Ophthalmol Vis Sci.2005;46:2649–2661.
3. John SW, Anderson MG, Smith RS. Mouse genetics: a tool to helpunlock the mechanisms of glaucoma. J Glaucoma. 1999;8:400–412.
4. Laquis S, Chaudhary P, Sharma SC. The patterns of retinal ganglioncell death in hypertensive eyes. Brain Res. 1998;784:100–104.
5. Naskar R, Wissing M, Thanos S. Detection of early neuron degen-eration and accompanying microglial responses in the retina of arat model of glaucoma. Invest Ophthalmol Vis Sci. 2002;43:2962–2968.
6. Garcia-Valenzuela E, Shareef S, Walsh J, Sharma S. Programmed celldeath of retinal ganglion cells during experimental glaucoma. ExpEye Res. 1995;61:33–44.
7. Urcola JH, Hernandez M, Vecino E. Three experimental glaucomamodels in rats: comparison of the effects of intraocular pressureelevation on retinal ganglion cell size and death. Exp Eye Res.2006;83:429–437.
8. Nissirios N, Chanis R, Johnson E, et al. Comparison of anteriorsegment structures in two rat glaucoma models: an ultrasoundbiomicroscopic study. Invest Ophthalmol Vis Sci. 2008;49:2478–2482.
9. Morrison JC, Moore CG, Deppmeier LM, Gold BG, Meshul CK,Johnson EC. A rat model of chronic pressure-induced optic nervedamage. Exp Eye Res. 1997;64:85–96.
10. Morgan JE, Datta AV, Erichsen JT, Albon J, Boulton ME. Retinalganglion cell remodelling in experimental glaucoma. Adv Exp MedBiol. 2006;572:397–402.
11. Morrison JC. Elevated intraocular pressure and optic nerve injurymodels in the rat. J Glaucoma. 2005;14:315–317.
12. Levkovitch-Verbin H, Quigley HA, Martin KR, Valenta D, BaumrindLA, Pease ME. Translimbal laser photocoagulation to the trabecularmeshwork as a model of glaucoma in rats. Invest Ophthalmol VisSci. 2002;43:402–410.
13. Martin KR, Levkovitch-Verbin H, Valenta D, Baumrind L, Pease ME,Quigley HA. Retinal glutamate transporter changes in experimen-tal glaucoma and after optic nerve transection in the rat. InvestOphthalmol Vis Sci. 2002;43:2236–2243.
14. Siu AW, Leung MC, To CH, Siu FK, Ji JZ, So KF. Total retinal nitricoxide production is increased in intraocular pressure-elevated rats.Exp Eye Res. 2002;75:401–406.
15. Schori H, Kipnis J, Yoles E, et al. Vaccination for protection ofretinal ganglion cells against death from glutamate cytotoxicity andocular hypertension: implications for glaucoma. Proc Natl AcadSci U S A. 2001;98:3398–3403.
16. Chiu K, Chang R, So KF. Laser-induced chronic ocular hyperten-sion model on SD rats. J Vis Exp. 2007;10:549.
17. Sappington RM, Carlson BJ, Crish SD, Calkins DJ. The microbeadocclusion model: a paradigm for induced ocular hypertension inrats and mice. Invest Ophthalmol Vis Sci. 2010;51:207–216.
18. Weber AJ, Zelenak D. Experimental glaucoma in the primateinduced by latex microspheres. J Neurosci Methods. 2001;111:39 – 48.
19. Wang WH, Millar JC, Pang IH, Wax MB, Clark AF. Noninvasivemeasurement of rodent intraocular pressure with a reboundtonometer. Invest Ophthalmol Vis Sci. 2005;46:4617–4621.
20. Cowey A, Perry VH. The projection of the temporal retina in rats,studied by retrograde transport of horseradish peroxidase. ExpBrain Res. 1979;35:457–464.
21. Perry V. Evidence for an amacrine cell system in the ganglion celllayer of the rat retina. Neuroscience. 1981;6:931–944.
22. Jakobs TC, Libby RT, Ben Y, John SW, Masland RH. Retinal gan-glion cell degeneration is topological but not cell type specific inDBA/2J mice. J Cell Biol. 2005;171:313–325.
23. Smith RS, Zabaleta A, Savinova OV, John SW. The mouse anteriorchamber angle and trabecular meshwork develop without celldeath. BMC Dev Biol. 2001;1:3.
24. Hanninen VA, Pantcheva MB, Freeman EE, Poulin NR, GrosskreutzCL. Activation of caspase 9 in a rat model of experimental glau-coma. Curr Eye Res. 2002;25:389–395.
25. Fileta JB, Huang W, Kwon GP, et al. Efficient estimation of retinalganglion cell number: a stereological approach. J Neurosci Meth-ods. 2008;170:1–8.
26. Ahmed FA, Hegazy K, Chaudhary P, Sharma SC. Neuroprotectiveeffect of alpha(2) agonist (brimonidine) on adult rat retinal gan-glion cells after increased intraocular pressure. Brain Res. 2001;913:133–139.
27. Neufeld AH, Sawada A, Becker B. Inhibition of nitric-oxide syn-thase 2 by aminoguanidine provides neuroprotection of retinalganglion cells in a rat model of chronic glaucoma. Proc Natl AcadSci U S A. 1999;96:9944–9948.
28. Mittag TW, Danias J, Pohorenec G, et al. Retinal damage after 3 to4 months of elevated intraocular pressure in a rat glaucoma model.Invest Ophthalmol Vis Sci. 2000;41:3451–3459.
IOVS, March 2011, Vol. 52, No. 3 Induction of Experimental Glaucoma Using Magnetic Microspheres 1675