Glass Recycling - Life Cycle Carbon Dioxide Emissions · QUALITY CONTROL SHEET Publication title...
40
British Glass, 9 Churchill Way, SHEFFIELD, S35 2PY T: 0114 290 1850 F: 0114 290 1851 E: [email protected] www.britglass.co.uk Glass Recycling - Life Cycle Carbon Dioxide Emissions A Life Cycle Analysis Report Prepared for British Glass by Enviros Consulting Ltd November 2003
Transcript of Glass Recycling - Life Cycle Carbon Dioxide Emissions · QUALITY CONTROL SHEET Publication title...
British Glass, 9 Churchill Way, SHEFFIELD, S35 2PYT: 0114 290 1850 F: 0114 290 1851
E: [email protected] www.britglass.co.uk
Glass Recycling - Life Cycle Carbon Dioxide Emissions
A Life Cycle Analysis ReportPrepared for British Glass
by Enviros Consulting LtdNovember 2003
QUALITY CONTROL SHEET
Publication title Glass Recycling – Life Cycle Carbon Dioxide Emissions
CAN BR110 004
Volume number Volume 1 of 1
Version Final Report
Date February 2004
File Reference Final Report 191103.doc
Prepared under the management of:
Joe Flanagan – Project Manager
Directed, reviewed and approved by:
Mike Davies – Project Director
Client Address: British Glass Manufacturers Confederation
Public Affairs Committee 9 Churchill Way Sheffield S35 2PY
Dr Nick Kirk Tel +44 (0) 114 290 1801
Fax +44 (0) 114 268 1073 Email [email protected]
Enviros Contact Details: Enviros Consulting Ltd
Telegraphic House Waterfront Quay Salford Quays Manchester M50 3XW
Joe Flanagan, Consulting Group Manager Tel 0161 874 3655
Fax 0161 848 8181 Email [email protected] Web www.enviros.com
CONTENTS PAGE
EXECUTIVE SUMMARY 1
1. INTRODUCTION 4 1.1 Background to the Project 4 1.2 UK Waste Arisngs 4 1.3 The UK Climate Change Programme 5
2. THE LIFE CYCLE ANALYSIS APPROACH 7
3. CURRENT UK SITUATION 9 3.1 Transport Related Emissions 10 3.2 Transport Assumptions 12
4. BENEFITS OF GLASS RECYCLING 13 4.1 Glass Container Manufacture 13 4.2 Insulation Glass Fibre Manufacture 17 4.3 Aggregate Applications 18 4.4 Filtration Media 20 4.5 Brick Manufacturing 21 4.6 Shot Blast Abrasives 23 4.7 Summary 24
5. IMPLICATIONS FOR FUTURE GLASS RECYCLING POLICY 26 APPENDICES
1. ESTIMATION OF TRANSPORT DISTANCES FOR RECYCLED GLASS
2. SUMMARY OF DATA ANALYSIS FOR UK GLASS FURNACES
3. CALCULATION OF CARBON DIOXIDE EMISSIONS FROM SODA ASH PRODUCTION
4. GLOSSARY AND DEFINITIONS
GLASS RECYCLING – LIFE CYCLE CARBON DIOXIDE EMISSIONS
EXECUTIVE SUMMARY
Waste management and climate change are two major environmental issues. Government and EU policy is increasingly driving waste reduction and improved recycling. Both the landfill directive and the packaging regulations are designed to achieve these goals. Glass is a major packaging material and it is estimated that around 2.2 million tonnes of waste glass bottles and jars enter the waste stream every year. In 2002, 747,415 tonnes of this waste glass was recycled, representing a recycling rate of 34% which is quite poor compared to many other European countries that achieve recycling rates of over 80%. Future Government targets and legislation are likely to increase the pressure to recycle and it is likely that a UK glass packaging recycling target of 60% (equivalent to 1.32 million tonnes) will be set for 2006.
The traditional route for recycled container glass has been to use it as a feedstock in the manufacture of new glass containers. However, recent growth in recycling has been disappointing and the past 3 years has seen significant growth in ‘alternative’ uses for recycled glass. These applications are mainly using glass as an aggregate where it substitutes virgin quarried materials. In 2002, it was estimated that 150,000 tonnes of glass went to aggregate applications and much of this growth was attributed to high PRN values and the investment in commercial mixed glass collection provided by Valpak. There are a number of other possible applications for recycled glass including use as a filtration media and as a ‘fluxing’ agent in brick manufacture. The Waste Resources Action Programme (WRAP) has provided support for a number of R&D projects relating to these applications.
The main theme of this study is the link between glass recycling and climate change. As a result of increasing levels of greenhouse gases (GHGs) in the atmosphere the climate is generally warming up. The likely consequences of this warming are disrupted weather patterns and rising sea levels; both effects will have severe impacts on mankind. Carbon dioxide (CO2) is one of the principal GHGs accounting for 80% of UK GHG emissions. Under the Kyoto Protocol the UK is committed to reducing GHG emissions by 12.5% by 2010 and the Government has recently stated a longer term goal of reducing these emissions by 60% by 2060.
A methodology has been developed for calculating the ‘life cycle’ CO2 emissions for various glass recycling options which are:
1. Glass is manufactured from virgin raw materials and waste containers are disposed to landfill at the end of their life i.e. a base case of no glass recycling
2. Glass is recycled and used as a feedstock for the manufacture of new glass containers.
3. Glass is recycled and used as a feedstock for the manufacture of glass fibre insulation.
4. Glass is recycled and used as an aggregate substituting quarried materials.
5. Glass is recycled and used as a filtration media substituting quarried sand or gravel.
6. Glass is recycled and used as a shot blast abrasive.
7. Glass is recycled and used as an additive in clay brick manufacturing.
BRITISH GLASS MANUFACTURERS CONFEDERATION – PUBLIC AFFAIRS COMMITTEE
1
GLASS RECYCLING – LIFE CYCLE CARBON DIOXIDE EMISSIONS
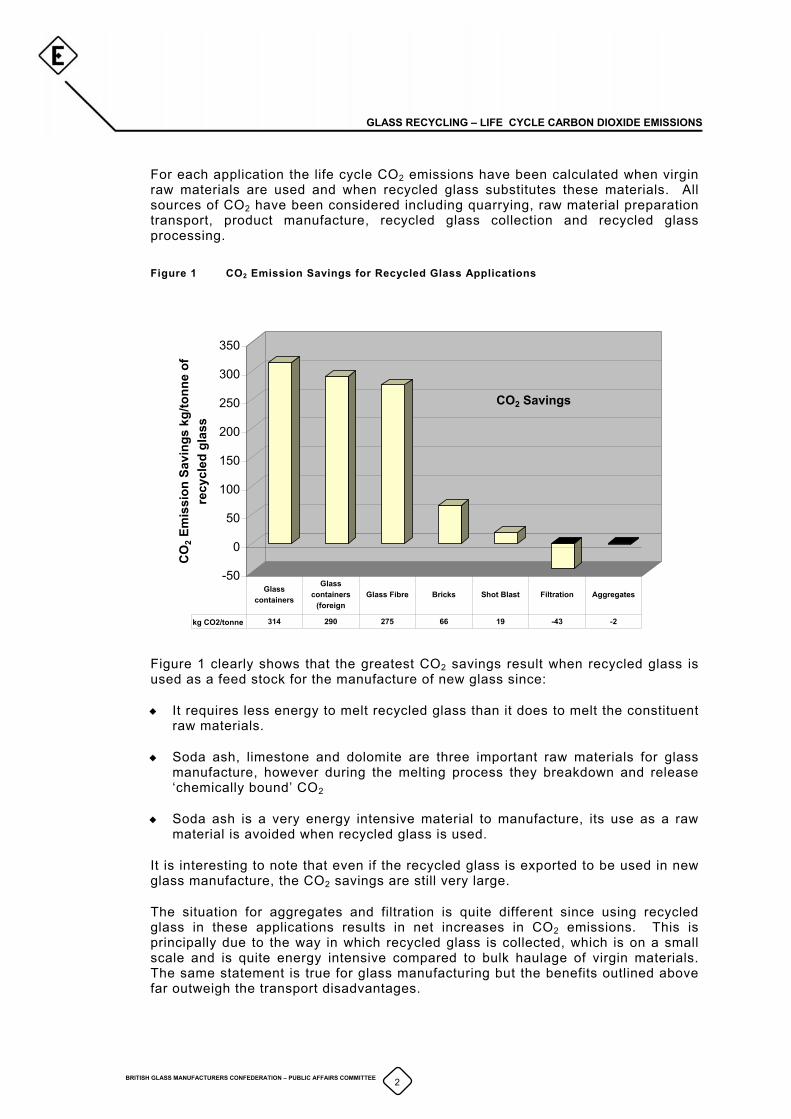
For each application the life cycle CO2 emissions have been calculated when virgin raw materials are used and when recycled glass substitutes these materials. All sources of CO2 have been considered including quarrying, raw material preparation transport, product manufacture, recycled glass collection and recycled glass processing.
Figure 1 CO2 Emission Savings for Recycled Glass Applications
-50
0
50
100
150
200
250
300
350
CO
2 Em
issi
on S
avin
gs k
g/to
nne
of
recy
cled
gla
ss
kg CO2/tonne 314 290 275 66 19 -43 -2
Glass containers
Glass containers
(foreign Glass Fibre Bricks Shot Blast Filtration Aggregates
CO2 Savings
Figure 1 clearly shows that the greatest CO2 savings result when recycled glass is used as a feed stock for the manufacture of new glass since:
It requires less energy to melt recycled glass than it does to melt the constituent raw materials.
Soda ash, limestone and dolomite are three important raw materials for glass manufacture, however during the melting process they breakdown and release ‘chemically bound’ CO2
Soda ash is a very energy intensive material to manufacture, its use as a raw material is avoided when recycled glass is used.
It is interesting to note that even if the recycled glass is exported to be used in new glass manufacture, the CO2 savings are still very large.
The situation for aggregates and filtration is quite different since using recycled glass in these applications results in net increases in CO2 emissions. This is principally due to the way in which recycled glass is collected, which is on a small scale and is quite energy intensive compared to bulk haulage of virgin materials. The same statement is true for glass manufacturing but the benefits outlined above far outweigh the transport disadvantages.
BRITISH GLASS MANUFACTURERS CONFEDERATION – PUBLIC AFFAIRS COMMITTEE
2
GLASS RECYCLING – LIFE CYCLE CARBON DIOXIDE EMISSIONS
Based upon current glass recycling it is calculated that the using of recycled glass is currently saving approximately 186,000 tonnes of CO2 emissions, of which 172,000 tonnes results from using the recycled glass to manufacture new glass.
If proposed recycling targets are achieved, then by 2006 there will be 1.32 million tonnes of recycled glass available. From the analysis presented in this report it is clear that the greatest environmental benefits would result if this glass was used as a feed stock in new glass manufacture. However, this is not possible due to the colour imbalance between recycled glass (which is mainly green) and the UK container manufacturers (who produce mainly clear glass). At this level of recycling the maximum use of recycled glass by the UK glass container sector is 920,000 tonnes and the glass fibre sector cannot absorb much more than the current levels around 15,000 tonnes/year. The remaining recycled glass would then be used in the other applications: aggregates, filtration, bricks and shot blast abrasives. Under this scenario the CO2 savings would increase from 186,000 tonnes/year to around 312,000 tonnes/year. However, if the glass is diverted to aggregate applications at the expense of glass manufacturing there will be little increase in the annual CO2 savings.
Taking a wider global view the preferred option for the surplus recycled glass must be to export to foreign glass manufacturers however if this recycled glass is to remain in the UK then he preferred option for the remaining 400,000 tonnes or so would be to use it in brick manufacture (provided this application proves to be technically and economically feasible).
This study has shown that if any increases in glass recycling are diverted towards glass manufacturers there is the potential to achieve significant reductions in CO2 emissions, perhaps up to 126,000 tonnes/year. This would be a helpful contribution towards the UK meeting its Kyoto commitments. Using recycled glass in aggregate or filtration applications results in a net increases in CO2 emissions and from a climate change perspective these applications should not be encouraged. Current Government recycling policy makes no distinction between the various end uses for recycled glass and therefore is somewhat at odds with climate change policy.
BRITISH GLASS MANUFACTURERS CONFEDERATION – PUBLIC AFFAIRS COMMITTEE
3
GLASS RECYCLING – LIFE CYCLE CARBON DIOXIDE EMISSIONS
1. INTRODUCTION
1.1 Background to the Project
Environmental concerns are becoming increasingly high profile issues and Government policy and legislation is increasingly being directed to encourage ‘sustainable development’. Many of the key environmental concerns are extremely complex and often interlinked. Often, policy designed to address a single issue has implications in other seemingly unrelated areas.
This project explores a very pertinent example of this interdependence between two very topical environmental concerns:
Recycling is a high profile issue and there are a number of regulatory drivers providing incentives to increase recycling rates. The ‘proximity principal’ which places emphasis on local uses for recycled materials has also been widely promoted.
Climate Change has less immediately obvious impacts but is probably the single most important environmental challenge currently facing mankind. Government policy is increasingly being directed towards this issue. Carbon dioxide (CO2) emissions, mainly derived from energy use, are the main source of Greenhouse Gases (GHGs)
Through adopting a Life Cycle Analysis (LCA) approach this study compares the energy use (and associated CO2 emissions) for the various options for glass recycling are compared. The baseline scenario for this work is where all glass containers are used once and then landfilled. This is compared to a number of uses for recycled glass:
A feedstock for the manufacture of new containers both in the UK and abroad.
A feedstock for the manufacture of new glass fibre insulation.
A filtration media.
A shot blast abrasive.
A fluxing agent in the manufacture of bricks.
1.2 UK Waste Arisngs
Every year over 400 million tonnes of waste are produced in the UK from households, commerce and industry. This vast quantity of material represents a major environmental challenge given the diminishing availability of suitable landfill sites. Although municipal waste only accounts for about 28 million tonnes of this total it is a major cause for concern as household waste is currently growing at around 3-4% per year1. At this rate of growth the total quantity will double in twenty years.
1 ‘Waste Not, Want Not’ - A Strategy for Tackling Municipal Waste in England (http://www.number-
10.gov.uk/su/waste/report/downloads/wastenot.pdf)
BRITISH GLASS MANUFACTURERS CONFEDERATION – PUBLIC AFFAIRS COMMITTEE
4
GLASS RECYCLING – LIFE CYCLE CARBON DIOXIDE EMISSIONS
Government and European policy is increasingly being directed to address this problem by encouraging recycling and reducing the quantities of waste consigned to landfill. The two major drivers in this area are:
The EU Landfill Directive which sets targets for recycling and recovery for household and municipal waste.
The EU Packaging and Waste Directive 2 that places recycling and recovery obligations upon all businesses in the packaging supply chain.
Every year some 2.2 million tonnes of glass packaging enters the waste stream of which only just over 30% is currently recycled. Compared to most European countries this recycling rate is quite poor with many countries achieving over 80%
1.3 The UK Climate Change Programme
During the 1990’s the World experienced seven of the ten warmest years since records began. It is accepted that the principal cause of this global warming are GHG emissions resulting from industrial activity. There are six principal GHGs which are carbon dioxide (CO2), methane, nitrous oxide, hydrofluorocarbons, perfluorocarbons and sulphur hexafluoride. Of these CO2 which is mainly produced by the burning of fossil fuels accounts for 80% of UK emissions.
The direct impact of global warming is a that average global temperatures could rise by as much as 6ºC over the next 100 years which will disrupt weather patterns and cause sea levels to rise. The economic and human consequences are likely to be severe.
Under the Kyoto Protocol which was agreed in 1997, the European Union is committed to reducing GHG emissions by 8% during the period 2008 to 2012 (based upon 1990 levels). Under a ‘burden sharing’ arrangement the UK’s contribution to this target is a 12.5% reduction. However, the recent Energy White Paper goes even further by setting a goal of cutting CO2 emissions (the principal greenhouse gas) by 60% by 2050. If economic development is to be maintained this is a very demanding target.
The industrial sector accounts for about 40% of total UK GHG emissions, most of which is CO2 from combustion processes. Government policy in this area is a mixture of information/awareness campaigns, support for R&D and fiscal measures. The Climate Change Levy (CCL) was introduced in 2001 and is a tax on energy consumption, with higher taxation paid on more carbon intensive fuels. All non-domestic consumers are liable for the CCL, but energy intensive consumers (defined as companies who operate processes that fall under the IPPC regulations) can obtain a rebate of up to 80% by signing up to a Climate Change Agreement with the Government in return for meeting agreed energy saving targets over the period 2001 to 2010.
2 The Producer Responsibility Obligations (Packaging Waste) Regulations 1997
(http://www.legislation.hmso.gov.uk/si/si1997/1970648.htm)
BRITISH GLASS MANUFACTURERS CONFEDERATION – PUBLIC AFFAIRS COMMITTEE
5
GLASS RECYCLING – LIFE CYCLE CARBON DIOXIDE EMISSIONS
The glass industry is classified as an energy intensive sector and is responsible for annual emissions of some 1,960,000 tonnes of CO2 as a result of energy consumption3. In addition, the breakdown of some of the raw materials (soda ash, limestone and dolomite) in the manufacturing process releases a further 378,000 tonnes/year. This is equivalent to about 1% of total industrial CO2 emissions which are around 215,000,000 tonnes/year4. Of the total figure of 2,338,000 tonnes of CO2 emitted by the glass industry the container manufacturing sector accounts for just under half at 1,131,000 tonnes CO2/year.
Under the Climate Change Agreement the glass industry has a target to improve its energy efficiency by approximately 9% over the period 2001 to 2010. This is a demanding target considering the progress the sector has made over the past twenty years and in many cases to achieve this magnitude of improvement will require large investment in new unproven technology.
3 UK Glass Manufacture – A Mass Balance Study Glass Technology Services, 2003 estimates the energy consumption of
the sector at 8,612 TWh. The following CO2 emission factors have been used: electricity 0.43kg/kWh, natural gas 0.19 kg/kWh; gas oil 0.25 kg/kWh; heavy fuel oil 0.26 kg/kWh
4 Economic Instruments and the Business Use of Energy, HM Treasury 1998
BRITISH GLASS MANUFACTURERS CONFEDERATION – PUBLIC AFFAIRS COMMITTEE
6
GLASS RECYCLING – LIFE CYCLE CARBON DIOXIDE EMISSIONS
2. THE LIFE CYCLE ANALYSIS APPROACH
Life Cycle Assessment (LCA) is a systematic approach for quantifying the inputs and outputs of a given product or service and the associated environmental impacts. In a LCA study the system being assessed is modelled using a ‘cradle to grave’ approach, with each step in the process linked to other industrial systems that supply, transport and dispose of all the environmental flows and releases to air water and land.
The results of a LCA on one system can form a baseline by which changes to the system or other systems can be compared and assessed for their relative impacts. In this way it is possible to quantify which system being considered has least environmental impact.
LCAs can be very complicated and the flows involved in a detailed LCA are often difficult to interpret. This study uses a simplified form of LCA in which the burdens associated with CO2 are calculated for each stage of the life cycle and only these releases to air are considered. In the same way that a full LCA approach would establish a baseline to which other scenarios could be compared, this approach calculates the CO2 burden associated with the manufacture and disposal of container glass and uses this as a baseline to assess the relative merits of recycling glass into different end uses.
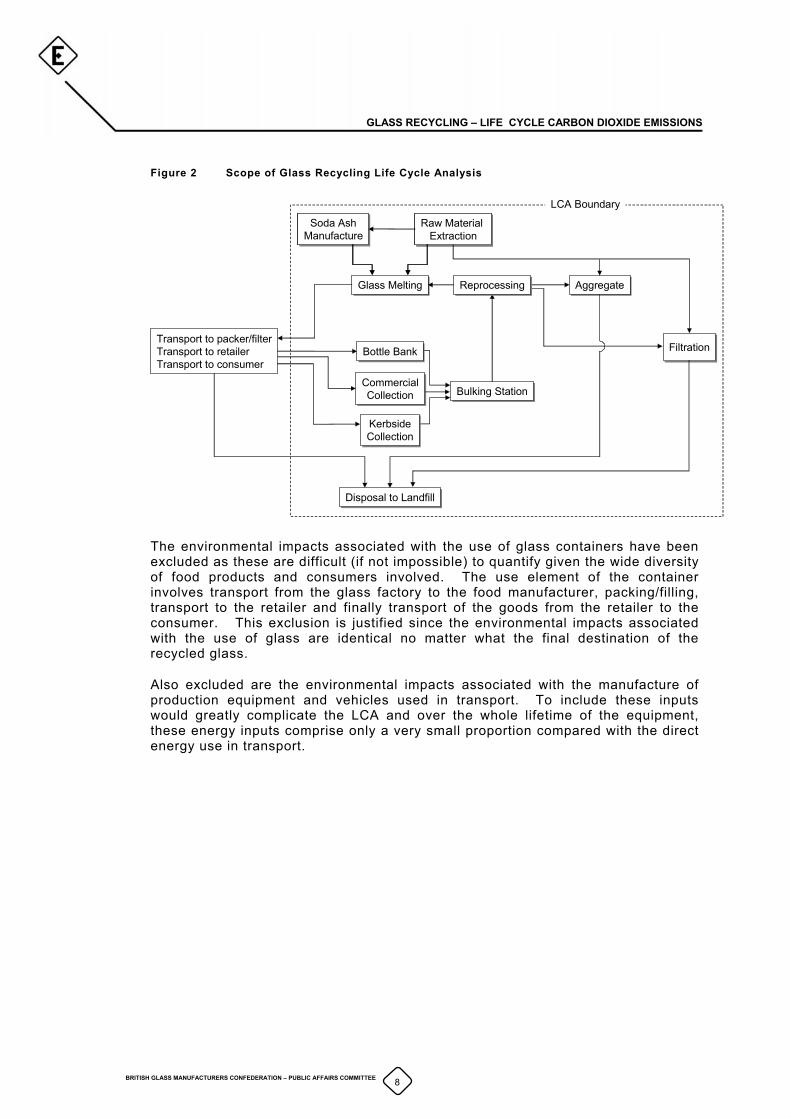
At some point the system boundaries have to be defined and for this study the focus is on the energy use and associated CO2 emissions. The scope of the study is defined as follows:
1. The extraction of raw materials and production of primary materials used in glass manufacture.
2. Transport of materials to point of use.
3. Manufacture of glass and other products that can use recycled glass as a raw material.
4. Collection of recycled glass (kerbside or bottle bank).
5. Transport to reprocessor.
6. Reprocessing the recycled glass.
This scope is represented schematically in Figure 2.
BRITISH GLASS MANUFACTURERS CONFEDERATION – PUBLIC AFFAIRS COMMITTEE
7
GLASS RECYCLING – LIFE CYCLE CARBON DIOXIDE EMISSIONS
Figure 2 Scope of Glass Recycling Life Cycle Analysis
Disposal to LandfillDisposal to Landfill
FiltrationFiltration
AggregateAggregate
Bulking StationBulking Station
Soda AshManufactureSoda Ash
ManufactureRaw Material
ExtractionRaw Material
ExtractionSoda Ash
ManufactureSoda Ash
ManufactureRaw Material
ExtractionRaw Material
Extraction
Glass MeltingGlass Melting
Bottle BankBottle Bank
KerbsideCollectionKerbsideCollection
Transport to packer/filterTransport to retailerTransport to consumer
ReprocessingReprocessing
LCA Boundary
CommercialCollection
CommercialCollection
The environmental impacts associated with the use of glass containers have been excluded as these are difficult (if not impossible) to quantify given the wide diversity of food products and consumers involved. The use element of the container involves transport from the glass factory to the food manufacturer, packing/filling, transport to the retailer and finally transport of the goods from the retailer to the consumer. This exclusion is justified since the environmental impacts associated with the use of glass are identical no matter what the final destination of the recycled glass.
Also excluded are the environmental impacts associated with the manufacture of production equipment and vehicles used in transport. To include these inputs would greatly complicate the LCA and over the whole lifetime of the equipment, these energy inputs comprise only a very small proportion compared with the direct energy use in transport.
BRITISH GLASS MANUFACTURERS CONFEDERATION – PUBLIC AFFAIRS COMMITTEE
8
GLASS RECYCLING – LIFE CYCLE CARBON DIOXIDE EMISSIONS
3. CURRENT UK SITUATION
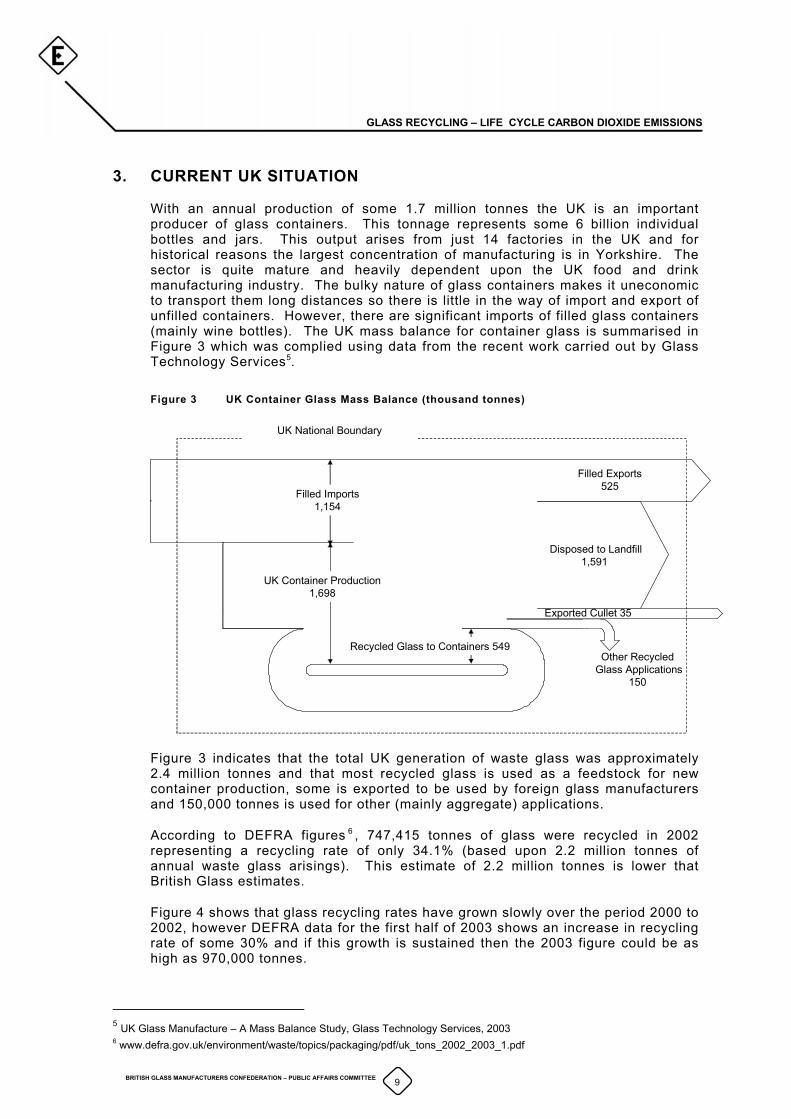
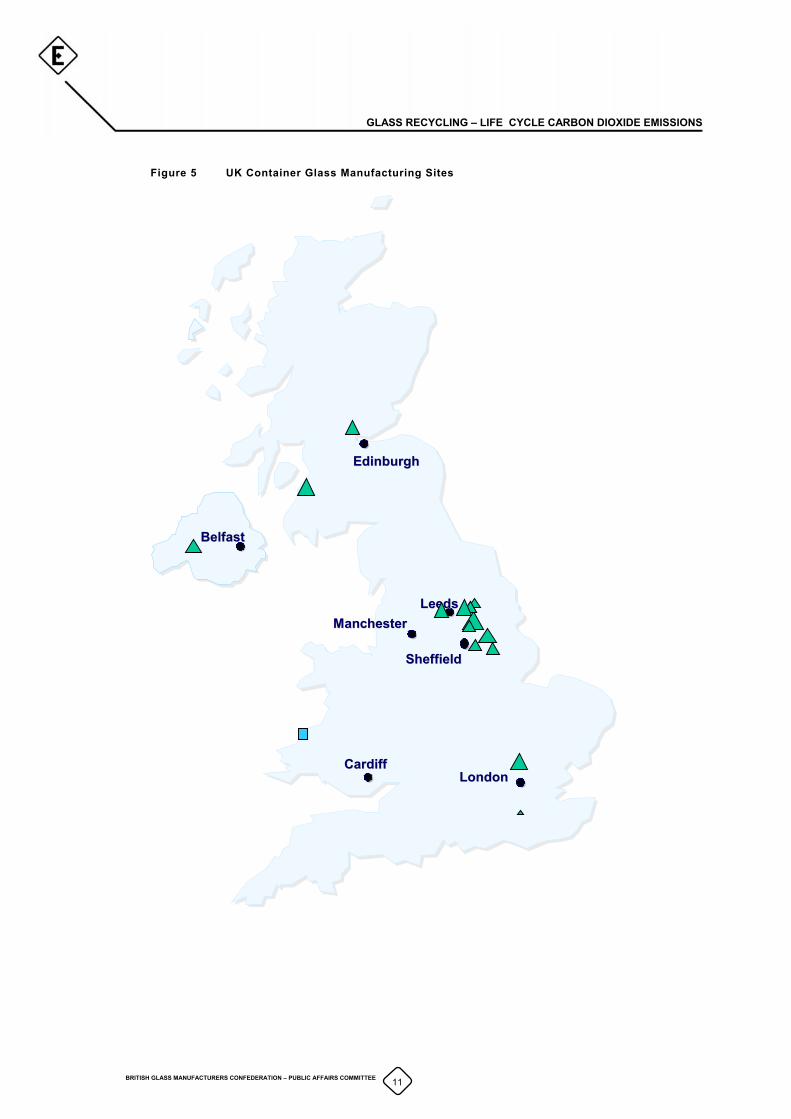
With an annual production of some 1.7 million tonnes the UK is an important producer of glass containers. This tonnage represents some 6 billion individual bottles and jars. This output arises from just 14 factories in the UK and for historical reasons the largest concentration of manufacturing is in Yorkshire. The sector is quite mature and heavily dependent upon the UK food and drink manufacturing industry. The bulky nature of glass containers makes it uneconomic to transport them long distances so there is little in the way of import and export of unfilled containers. However, there are significant imports of filled glass containers (mainly wine bottles). The UK mass balance for container glass is summarised in Figure 3 which was complied using data from the recent work carried out by Glass Technology Services5.
Figure 3 UK Container Glass Mass Balance (thousand tonnes)
Filled Exports525
Disposed to Landfill1,591
Other Recycled Glass Applications
150
Exported Cullet 35
UK Container Production1,698
Filled Imports1,154
Recycled Glass to Containers 549
UK National Boundary
Figure 3 indicates that the total UK generation of waste glass was approximately 2.4 million tonnes and that most recycled glass is used as a feedstock for new container production, some is exported to be used by foreign glass manufacturers and 150,000 tonnes is used for other (mainly aggregate) applications.
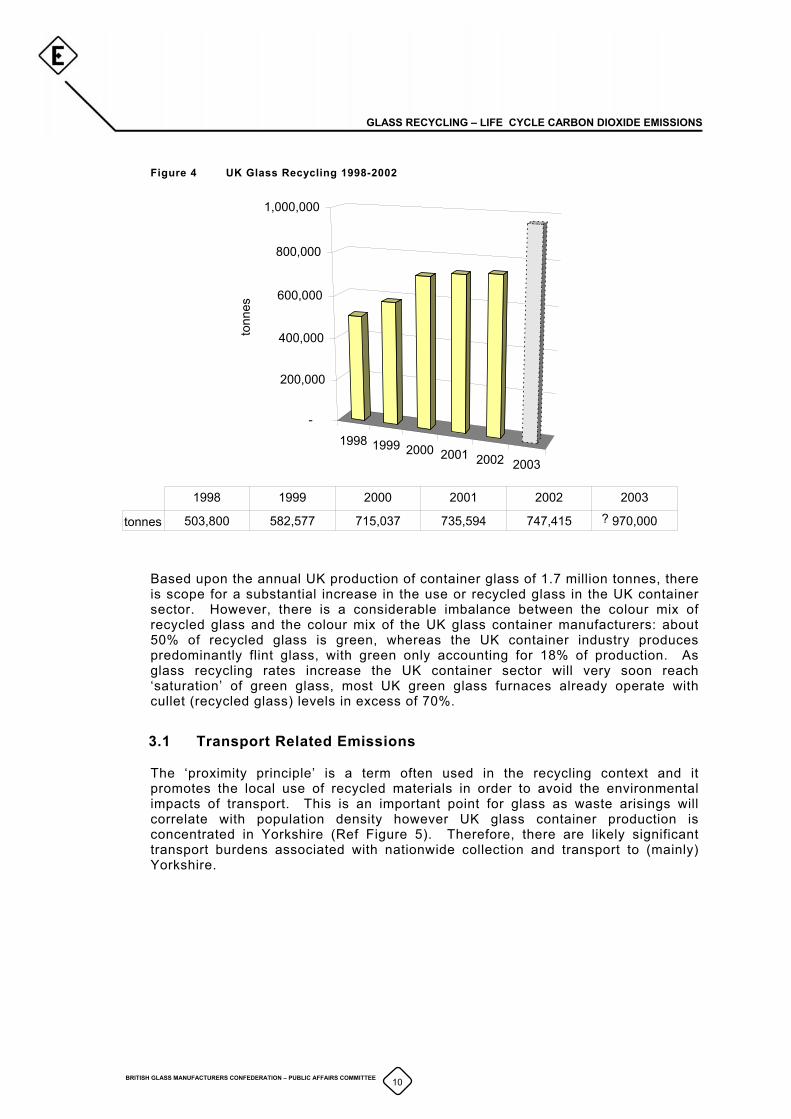
According to DEFRA figures 6 , 747,415 tonnes of glass were recycled in 2002 representing a recycling rate of only 34.1% (based upon 2.2 million tonnes of annual waste glass arisings). This estimate of 2.2 million tonnes is lower that British Glass estimates.
Figure 4 shows that glass recycling rates have grown slowly over the period 2000 to 2002, however DEFRA data for the first half of 2003 shows an increase in recycling rate of some 30% and if this growth is sustained then the 2003 figure could be as high as 970,000 tonnes.
5 UK Glass Manufacture – A Mass Balance Study, Glass Technology Services, 2003 6 www.defra.gov.uk/environment/waste/topics/packaging/pdf/uk_tons_2002_2003_1.pdf
BRITISH GLASS MANUFACTURERS CONFEDERATION – PUBLIC AFFAIRS COMMITTEE
9
GLASS RECYCLING – LIFE CYCLE CARBON DIOXIDE EMISSIONS
Figure 4 UK Glass Recycling 1998-2002
f container glass of 1.7 million tonnes, there scope for a substantial increase in the use or recycled glass in the UK container
sector. However, there is a considerable imbalance between the colour mix of
The ‘proximity principle’ is a term often used in the recycling context and it ials in order to avoid the environmental
impacts of transport. This is an important point for glass as waste arisings will
1998 1999 2000 2001 2002 2003
-
200,000
400,000
600,000
800,000
1,000,000
tonn
es
tonnes 503,800 582,577 715,037 735,594 747,415 970,000
1998 1999 2000 2001 2002 2003?
Based upon the annual UK production ois
recycled glass and the colour mix of the UK glass container manufacturers: about 50% of recycled glass is green, whereas the UK container industry produces predominantly flint glass, with green only accounting for 18% of production. As glass recycling rates increase the UK container sector will very soon reach ‘saturation’ of green glass, most UK green glass furnaces already operate with cullet (recycled glass) levels in excess of 70%.
3.1 Transport Related Emissions
promotes the local use of recycled mater
correlate with population density however UK glass container production is concentrated in Yorkshire (Ref Figure 5). Therefore, there are likely significant transport burdens associated with nationwide collection and transport to (mainly) Yorkshire.
BRITISH GLASS MANUFACTURERS CONFEDERATION – PUBLIC AFFAIRS COMMITTEE
10
GLASS RECYCLING – LIFE CYCLE CARBON DIOXIDE EMISSIONS
Figure 5 UK Container Glass Manufacturing Sites
ManchesterManchester
EdinburghEdinburgh
BelfastBelfast
CardiffCardiffLondonLondon
LeedsLeeds
SheffieldSheffield
BRITISH GLASS MANUFACTURERS CONFEDERATION – PUBLIC AFFAIRS COMMITTEE
11
GLASS RECYCLING – LIFE CYCLE CARBON DIOXIDE EMISSIONS
3.2 Transport Assumptions
There are three principal systems for the collection of recycled glass:
1. Bring sites or bottle banks.
2. Kerbside collections systems with glass generally collected with other recyclables (e.g. paper, cans and plastic).
3. Dedicated glass collections from commercial premises.
From each of these schemes the glass is commonly taken to a bulking station and then bulk hauled to the reprocessor.
There is very little statistical data on the fuel use for glass collection systems and we have assumed that on average 5 tonne loads will be taken to the bulking station by diesel truck. The average distance involved will be 15 miles (24 km) which equates to a 7.5 mile (12 km) journey with no return load. Assuming a vehicle fuel economy of 12 mpg (which is consistent with published data7) this gives an average CO2 emission of 3.06 kg CO2/tonne of recycled glass.
For bulk haulage of glass (and other materials) we have assumed 25 tonne loads on a diesel vehicle achieving 8 mpg. If this involves a trip of 200 miles i.e. a 100 mile trip to the reprocessor with no return load the CO2 emission will be 12 kg/tonne of recycled glass (Ref. Appendix 1).
This whole area of the transport distances and emissions requires further detailed investigation but we believe our estimates based on the ‘average’ UK situation are reasonable.
The scenario of exporting recycled glass to foreign glass manufacturers has also been considered. This involves some additional road transport and bulk shipping by sea. However, bulk shipping by sea is the most energy efficient transport mode resulting in the least CO2 emissions per tonne km. Typical emissions associated with sea freight range from 0.06 kg CO2/tonne km for a small ‘roll on roll off’ ferry to 0.007 kg CO2/tonne km for a large bulk carrier8.
7 Energy Consumption Guide 59 Fuel Consumption in Freight Haulage Fleets - FTA/Energy Efficiency Best Practice
Programme 8 Guidelines for Company Reporting on Greenhouse Gas Emissions, DEFRA
BRITISH GLASS MANUFACTURERS CONFEDERATION – PUBLIC AFFAIRS COMMITTEE
12
GLASS RECYCLING – LIFE CYCLE CARBON DIOXIDE EMISSIONS
4. BENEFITS OF GLASS RECYCLING
There are two environmental benefits common to all glass recycling applications:
Glass recycling removes a significant quantity of material from the waste stream that would otherwise go to landfill. If all UK container glass was recycled then this would avoid the disposal of some 2.2 million tonnes of waste glass.
In most cases recycled glass substitutes a virgin quarried material. There are the benefits associated with avoiding the environmental impacts of quarrying and processing the raw material.
For some applications there are also other important benefits that arise from the unique chemical and physical properties of glass. Principally, there are energy savings when recycled glass is used as a feedstock for glass container manufacture, similarly there are energy savings when glass is used in brick manufacture and there is a possibility of increased energy efficiency when it is used in water filtration applications.
Although the environmental benefits of using recycled glass are important, the principal reason for using the material is cost saving. However, the true costs of recycled glass are often distorted since the collection component of the supply chain is dominated by local authorities (who do not operate to the usual commercial guidelines) and prices can be distorted by the PRN system. Although, the intention of PRN revenue is to encourage investment in collection and processing infra-structure it does appear to have been used to subsidise collection and processing costs, artificially depressing the true cost of recycled glass.
4.1 Glass Container Manufacture
The environmental benefits of using recycled glass to manufacture new containers are:
Lower melting energy requirement for the glass.
Avoided use of carbonate raw materials which release ‘chemical’ CO2 during the glass melting process.
Avoided use of soda ash, which is one of the principal glass raw materials and is very energy intensive to manufacture.
Against these benefits has to be offset the transport energy involved in the collection, transport and reprocessing of recycled glass.
Glass manufacturers frequently use a rule of thumb that for every 10% of cullet added to the furnace raw material charge energy use will fall by 2.5%. A recent study by Eindhoven University of Technology 9 has confirmed this figure together with separate work by Glass Technology Services10. As part of this study we have analysed recent data from eleven furnaces currently operating in the UK. Using regression analysis techniques (Appendix 2) the average saving from this sample of furnaces is estimated at 2.8% for every 10% increase in cullet. However for the purposes of this model a conservative value of 2.5% has been adopted.
9 Beerkens R.C, Energy Efficiency Benchmarking of Glass Furnaces, 62nd Conference of Glass Problems, Illinois, 2001. 10 Private communication
BRITISH GLASS MANUFACTURERS CONFEDERATION – PUBLIC AFFAIRS COMMITTEE
13
GLASS RECYCLING – LIFE CYCLE CARBON DIOXIDE EMISSIONS
The manufacture of glass involves the reaction of a number of materials at high temperature to produce a molten glass which is then moulded to shape and cooled. The principal raw materials are silica sand, sodium carbonate (commonly known as soda ash) and limestone. To produce one tonne of glass will typically require:
700 kg of silica sand
192 kg of limestone and dolomite
207 kg of soda ash
71 kg of other minerals
This gives a total of 1.17 tonnes of raw materials; the 170 kg difference is accounted for by the loss of CO2 from the decomposition of soda ash, limestone and dolomite.
Of the major glass constituents, soda ash is a refined chemical product rather than a quarried product and its manufacture is very energy intensive resulting in estimated CO2 emissions of 244 kg/tonne of soda ash (Ref Appendix 3).
There is no statistical data available for the distances that recycled glass is moved across the UK. Many of the major reprocessors rely upon sub-contract haulage so we have no ready access to fuel use, trip distances and levels of ‘back haulage’. Using DEFRA data for current regional glass recycling rates and making some assumptions about the likely destination for each region’s glass the average trip distance from collection to reprocessor is 160 km giving an average emission of 12 kg CO2/tonne of recycled glass (Ref. Appendix 1). For this type of bulk haulage we have assumed that half of all vehicles operate with return loads.
To quantify the benefits of using recycled glass as a feedstock for glass manufacture two extreme scenarios are compared:
Production of glass containers from 100% virgin raw materials followed by disposal to landfill (or incineration) after use.
Production of glass containers from 100% recycled glass; after use containers are collected and reprocessed into a feedstock suitable for new glass container production.
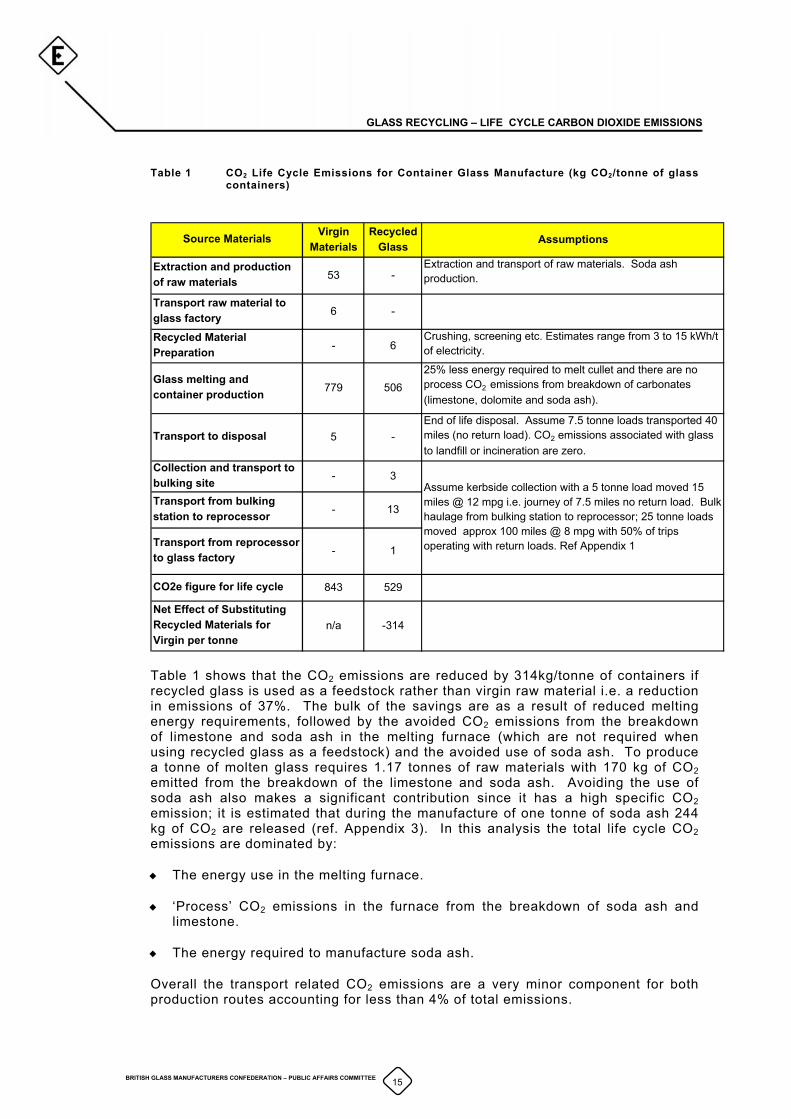
The CO2 emissions from these two production routes are summarised in Table 1.
BRITISH GLASS MANUFACTURERS CONFEDERATION – PUBLIC AFFAIRS COMMITTEE
14
GLASS RECYCLING – LIFE CYCLE CARBON DIOXIDE EMISSIONS
Table 1 CO2 Life Cycle Emissions for Container Glass Manufacture (kg CO2/tonne of glass containers)
Virgin Recycled
Materials Glass Assumptions
53 -Extraction and transport of raw materials. Soda ash production.
6 -
- 6Crushing, screening etc. Estimates range from 3 to 15 kWh/t of electricity.
779 50625% less energy required to melt cullet and there are no process CO2 emissions from breakdown of carbonates (limestone, dolomite and soda ash).
5 -End of life disposal. Assume 7.5 tonne loads transported 40 miles (no return load). CO2 emissions associated with glass to landfill or incineration are zero.
- 3
- 13
- 1
843 529
n/a -314
Assume kerbside collection with a 5 tonne load moved 15 miles @ 12 mpg i.e. journey of 7.5 miles no return load. Bulk haulage from bulking station to reprocessor; 25 tonne loads moved approx 100 miles @ 8 mpg with 50% of trips operating with return loads. Ref Appendix 1
Extraction and production of raw materials
Recycled Material Preparation
Transport raw material to glass factory
Source Materials
Net Effect of Substituting Recycled Materials for Virgin per tonne
Transport from bulking station to reprocessor
CO2e figure for life cycle
Glass melting and container production
Transport to disposal
Collection and transport to bulking site
Transport from reprocessor to glass factory
Table 1 shows that the CO2 emissions are reduced by 314kg/tonne of containers if recycled glass is used as a feedstock rather than virgin raw material i.e. a reduction in emissions of 37%. The bulk of the savings are as a result of reduced melting energy requirements, followed by the avoided CO2 emissions from the breakdown of limestone and soda ash in the melting furnace (which are not required when using recycled glass as a feedstock) and the avoided use of soda ash. To produce a tonne of molten glass requires 1.17 tonnes of raw materials with 170 kg of CO2 emitted from the breakdown of the limestone and soda ash. Avoiding the use of soda ash also makes a significant contribution since it has a high specific CO2 emission; it is estimated that during the manufacture of one tonne of soda ash 244 kg of CO2 are released (ref. Appendix 3). In this analysis the total life cycle CO2 emissions are dominated by:
The energy use in the melting furnace.
‘Process’ CO2 emissions in the furnace from the breakdown of soda ash and limestone.
The energy required to manufacture soda ash.
Overall the transport related CO2 emissions are a very minor component for both production routes accounting for less than 4% of total emissions.
BRITISH GLASS MANUFACTURERS CONFEDERATION – PUBLIC AFFAIRS COMMITTEE
15
GLASS RECYCLING – LIFE CYCLE CARBON DIOXIDE EMISSIONS
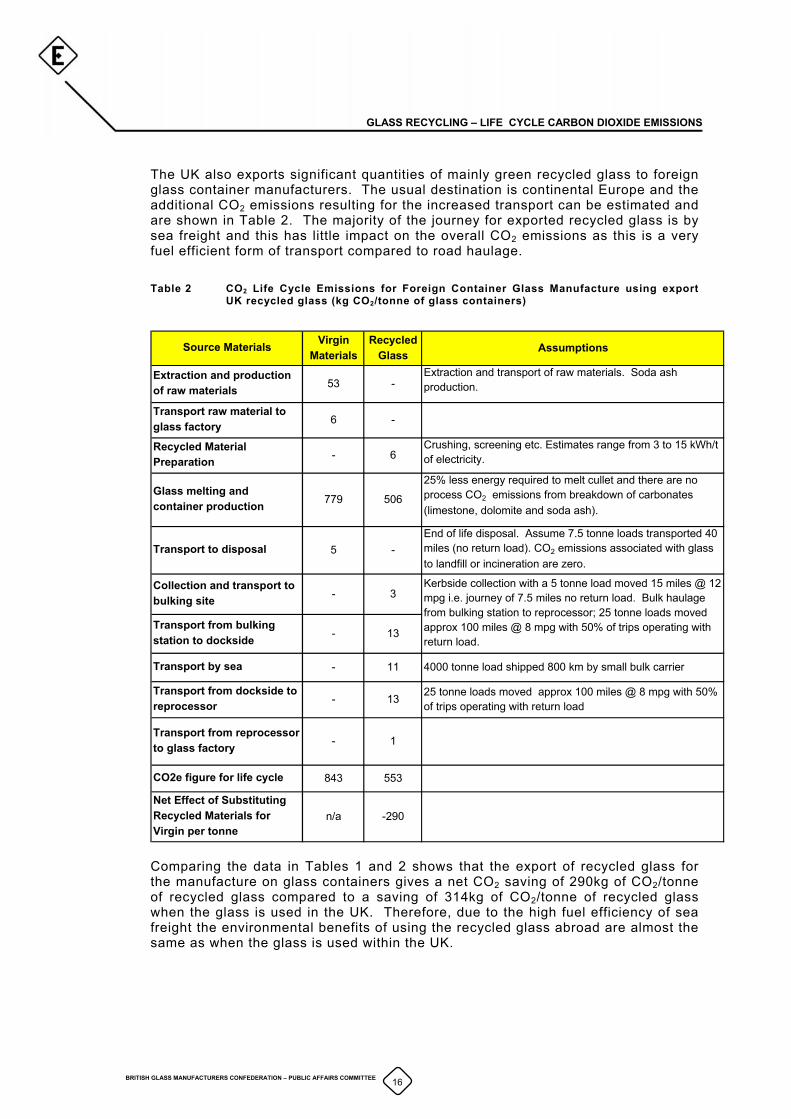
The UK also exports significant quantities of mainly green recycled glass to foreign glass container manufacturers. The usual destination is continental Europe and the additional CO2 emissions resulting for the increased transport can be estimated and are shown in Table 2. The majority of the journey for exported recycled glass is by sea freight and this has little impact on the overall CO2 emissions as this is a very fuel efficient form of transport compared to road haulage.
Table 2 CO2 Life Cycle Emissions for Foreign Container Glass Manufacture using export UK recycled glass (kg CO2/tonne of glass containers)
Virgin Materials
Recycled Glass Assumptions
53 -Extraction and transport of raw materials. Soda ash production.
6 -
- 6Crushing, screening etc. Estimates range from 3 to 15 kWh/t of electricity.
779 506
25% less energy required to melt cullet and there are no process CO2 emissions from breakdown of carbonates (limestone, dolomite and soda ash).
5 -End of life disposal. Assume 7.5 tonne loads transported 40 miles (no return load). CO2 emissions associated with glass to landfill or incineration are zero.
- 3
- 13
- 11 4000 tonne load shipped 800 km by small bulk carrier
- 13 25 tonne loads moved approx 100 miles @ 8 mpg with 50% of trips operating with return load
- 1
843 553
n/a -290Net Effect of Substituting Recycled Materials for Virgin per tonne
Transport from bulking station to dockside
CO2e figure for life cycle
Glass melting and container production
Transport to disposal
Collection and transport to bulking site
Transport from reprocessor to glass factory
Transport from dockside to reprocessor
Transport by sea
Kerbside collection with a 5 tonne load moved 15 miles @ 12 mpg i.e. journey of 7.5 miles no return load. Bulk haulage from bulking station to reprocessor; 25 tonne loads moved approx 100 miles @ 8 mpg with 50% of trips operating with return load.
Extraction and production of raw materials
Recycled Material Preparation
Transport raw material to glass factory
Source Materials
Comparing the data in Tables 1 and 2 shows that the export of recycled glass for the manufacture on glass containers gives a net CO2 saving of 290kg of CO2/tonne of recycled glass compared to a saving of 314kg of CO2/tonne of recycled glass when the glass is used in the UK. Therefore, due to the high fuel efficiency of sea freight the environmental benefits of using the recycled glass abroad are almost the same as when the glass is used within the UK.
BRITISH GLASS MANUFACTURERS CONFEDERATION – PUBLIC AFFAIRS COMMITTEE
16
GLASS RECYCLING – LIFE CYCLE CARBON DIOXIDE EMISSIONS
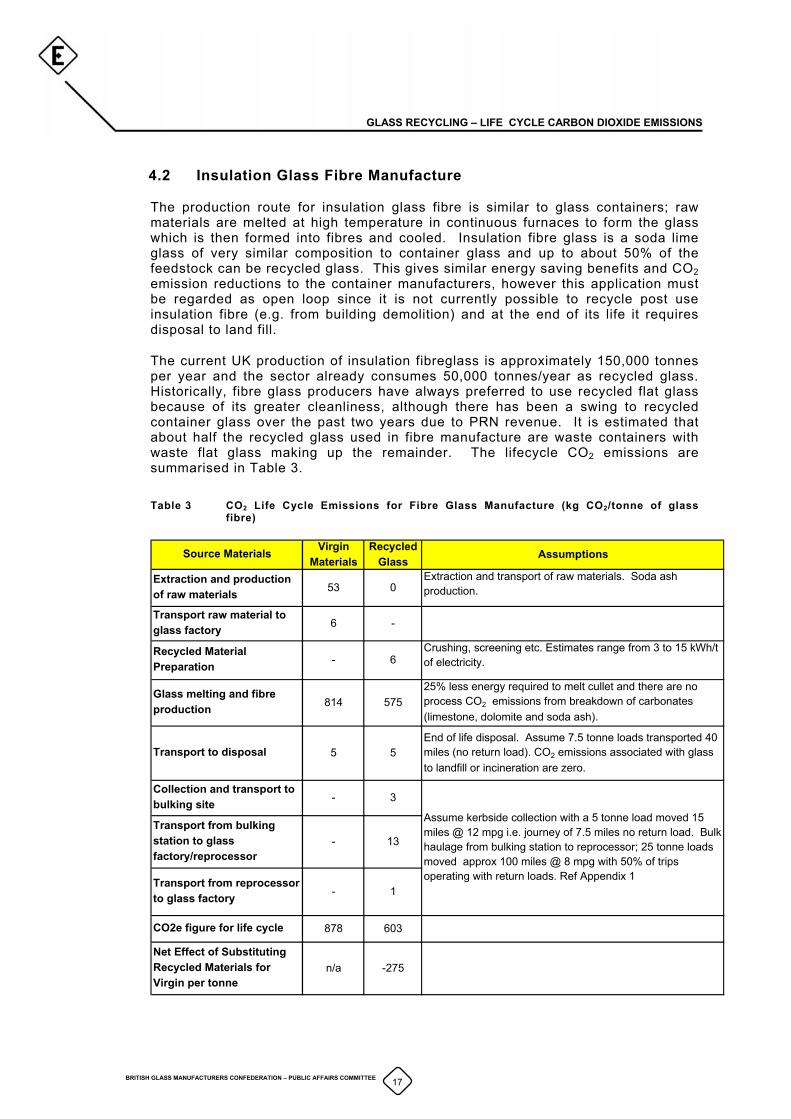
4.2 Insulation Glass Fibre Manufacture
The production route for insulation glass fibre is similar to glass containers; raw materials are melted at high temperature in continuous furnaces to form the glass which is then formed into fibres and cooled. Insulation fibre glass is a soda lime glass of very similar composition to container glass and up to about 50% of the feedstock can be recycled glass. This gives similar energy saving benefits and CO2 emission reductions to the container manufacturers, however this application must be regarded as open loop since it is not currently possible to recycle post use insulation fibre (e.g. from building demolition) and at the end of its life it requires disposal to land fill.
The current UK production of insulation fibreglass is approximately 150,000 tonnes per year and the sector already consumes 50,000 tonnes/year as recycled glass. Historically, fibre glass producers have always preferred to use recycled flat glass because of its greater cleanliness, although there has been a swing to recycled container glass over the past two years due to PRN revenue. It is estimated that about half the recycled glass used in fibre manufacture are waste containers with waste flat glass making up the remainder. The lifecycle CO2 emissions are summarised in Table 3.
Table 3 CO2 Life Cycle Emissions for Fibre Glass Manufacture (kg CO2/tonne of glass fibre)
Virgin Materials
Recycled Glass Assumptions
53 0Extraction and transport of raw materials. Soda ash production.
6 -
- 6Crushing, screening etc. Estimates range from 3 to 15 kWh/t of electricity.
814 57525% less energy required to melt cullet and there are no process CO2 emissions from breakdown of carbonates (limestone, dolomite and soda ash).
5 5End of life disposal. Assume 7.5 tonne loads transported 40 miles (no return load). CO2 emissions associated with glass to landfill or incineration are zero.
- 3
- 13
- 1
878 603
n/a -275
Extraction and production of raw materials
Transport raw material to glass factory
Source Materials
Net Effect of Substituting Recycled Materials for Virgin per tonne
Recycled Material Preparation
CO2e figure for life cycle
Glass melting and fibre production
Transport to disposal
Transport from bulking station to glass factory/reprocessor
Collection and transport to bulking site
Transport from reprocessor to glass factory
Assume kerbside collection with a 5 tonne load moved 15 miles @ 12 mpg i.e. journey of 7.5 miles no return load. Bulk haulage from bulking station to reprocessor; 25 tonne loads moved approx 100 miles @ 8 mpg with 50% of trips operating with return loads. Ref Appendix 1
BRITISH GLASS MANUFACTURERS CONFEDERATION – PUBLIC AFFAIRS COMMITTEE
17
GLASS RECYCLING – LIFE CYCLE CARBON DIOXIDE EMISSIONS
The same energy saving benefits for cullet additions are assumed for fibre glass and containers, however fibre glass manufacture is a more energy intensive process and a smaller proportion of the total energy use is consumed in the melting process. Table 3 shows that the benefits of using recycled glass in fibre glass manufacture are slightly less compared to those obtained in container manufacture.
It should be noted that this analysis does not take into account the life cycle benefits of using glass fibre as an insulation material in buildings; over the lifetime of a building the insulation will significantly reduce the CO2 emissions as a result of the reduced heating load for the building.
4.3 Aggregate Applications
Over 200 million tonnes of quarried rock, sand and gravel are extracted every year in the UK for the construction industry. Recent work has demonstrated that recycled glass can be used in a number of construction applications substituting the quarried materials. Last year it is estimated that some 150,000 tonnes of recycled glass was used in aggregate applications such as coarse bedding sand and in bound sub courses for roads.
In terms of processing, all the collected glass requires some processing prior to use. The minimum amount of processing required in, for example, the road base application is crushing down to 19 mm followed by screening to remove corks and closures. In this application the energy use and associated CO2 emissions for processing the glass will be very similar to those associated with the virgin aggregates.
For finer sized applications e.g. sand replacement there is a greater processing requirement. Day Aggregates who are one of the largest producers of recycled glass sand have a three stage operation; a primary crushing/screening operation followed by fine size production using a vertical shaft impact mill and finally washing. For this application, the energy use and associated CO2 emissions will be very much greater that those associated with the extraction of virgin sand and its processing
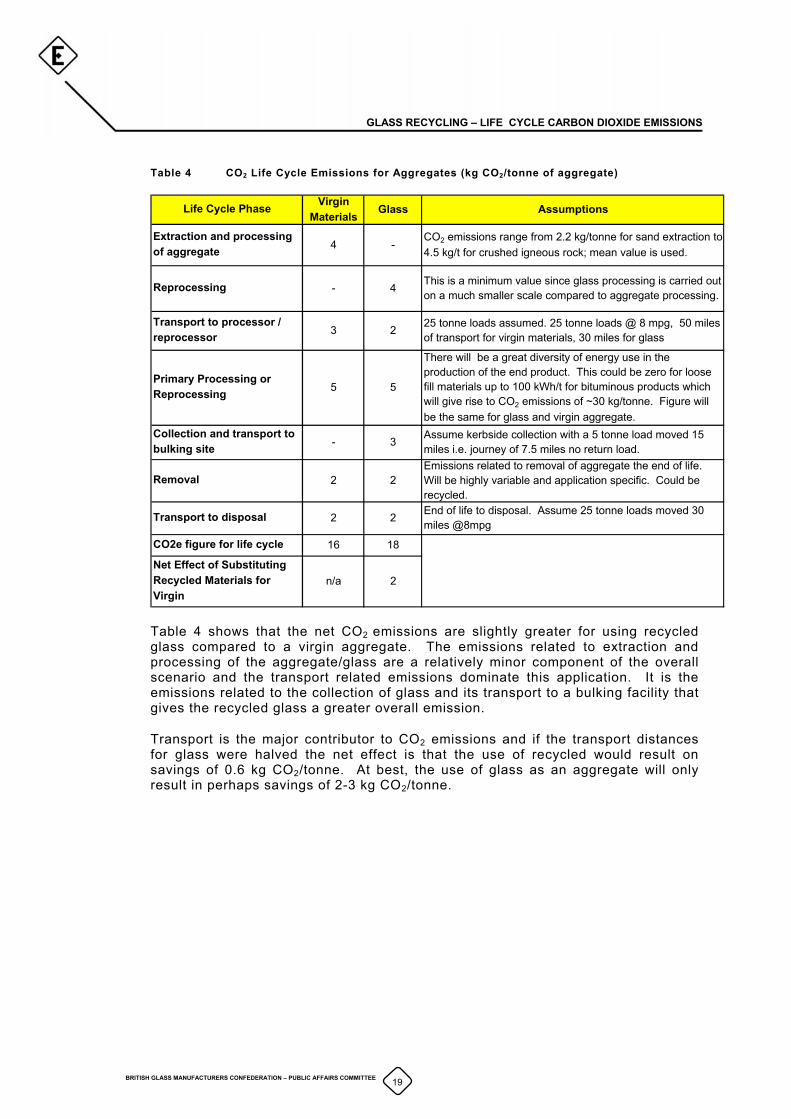
The CO2 emissions for typical virgin aggregates and recycled glass are compared in Table 4.
BRITISH GLASS MANUFACTURERS CONFEDERATION – PUBLIC AFFAIRS COMMITTEE
18
GLASS RECYCLING – LIFE CYCLE CARBON DIOXIDE EMISSIONS
Table 4 CO2 Life Cycle Emissions for Aggregates (kg CO2/tonne of aggregate)
Virgin Materials Glass Assumptions
4 -CO2 emissions range from 2.2 kg/tonne for sand extraction to 4.5 kg/t for crushed igneous rock; mean value is used.
- 4 This is a minimum value since glass processing is carried out on a much smaller scale compared to aggregate processing.
3 2 25 tonne loads assumed. 25 tonne loads @ 8 mpg, 50 miles of transport for virgin materials, 30 miles for glass
5 5
There will be a great diversity of energy use in the production of the end product. This could be zero for loose fill materials up to 100 kWh/t for bituminous products which will give rise to CO2 emissions of ~30 kg/tonne. Figure will be the same for glass and virgin aggregate.
- 3 Assume kerbside collection with a 5 tonne load moved 15 miles i.e. journey of 7.5 miles no return load.
2 2Emissions related to removal of aggregate the end of life. Will be highly variable and application specific. Could be recycled.
2 2 End of life to disposal. Assume 25 tonne loads moved 30 miles @8mpg
16 18
n/a 2Net Effect of Substituting Recycled Materials for Virgin
Transport to processor / reprocessor
CO2e figure for life cycle
Primary Processing or Reprocessing
Collection and transport to bulking site
Removal
Life Cycle Phase
Extraction and processing of aggregate
Transport to disposal
Reprocessing
Table 4 shows that the net CO2 emissions are slightly greater for using recycled glass compared to a virgin aggregate. The emissions related to extraction and processing of the aggregate/glass are a relatively minor component of the overall scenario and the transport related emissions dominate this application. It is the emissions related to the collection of glass and its transport to a bulking facility that gives the recycled glass a greater overall emission.
Transport is the major contributor to CO2 emissions and if the transport distances for glass were halved the net effect is that the use of recycled would result on savings of 0.6 kg CO2/tonne. At best, the use of glass as an aggregate will only result in perhaps savings of 2-3 kg CO2/tonne.
BRITISH GLASS MANUFACTURERS CONFEDERATION – PUBLIC AFFAIRS COMMITTEE
19
GLASS RECYCLING – LIFE CYCLE CARBON DIOXIDE EMISSIONS
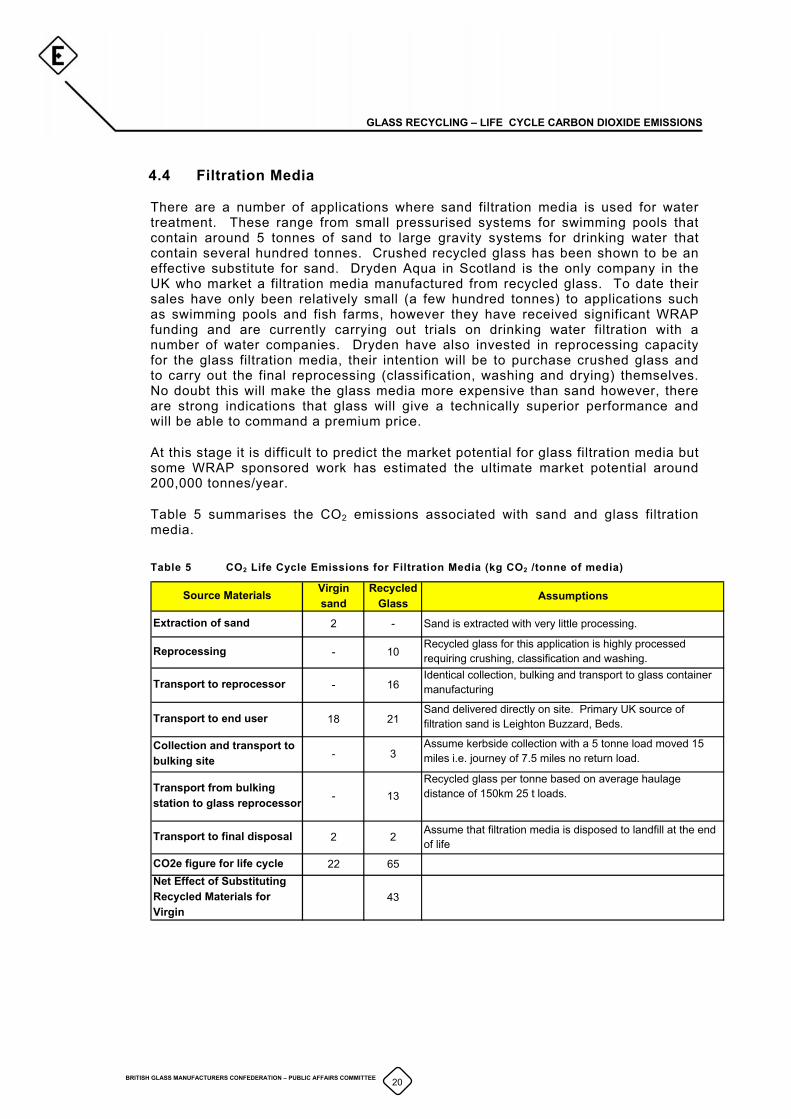
4.4 Filtration Media
There are a number of applications where sand filtration media is used for water treatment. These range from small pressurised systems for swimming pools that contain around 5 tonnes of sand to large gravity systems for drinking water that contain several hundred tonnes. Crushed recycled glass has been shown to be an effective substitute for sand. Dryden Aqua in Scotland is the only company in the UK who market a filtration media manufactured from recycled glass. To date their sales have only been relatively small (a few hundred tonnes) to applications such as swimming pools and fish farms, however they have received significant WRAP funding and are currently carrying out trials on drinking water filtration with a number of water companies. Dryden have also invested in reprocessing capacity for the glass filtration media, their intention will be to purchase crushed glass and to carry out the final reprocessing (classification, washing and drying) themselves. No doubt this will make the glass media more expensive than sand however, there are strong indications that glass will give a technically superior performance and will be able to command a premium price.
At this stage it is difficult to predict the market potential for glass filtration media but some WRAP sponsored work has estimated the ultimate market potential around 200,000 tonnes/year.
Table 5 summarises the CO2 emissions associated with sand and glass filtration media.
Table 5 CO2 Life Cycle Emissions for Filtration Media (kg CO2 /tonne of media)
Virgin sand
Recycled Glass Assumptions
2 - Sand is extracted with very little processing.
- 10Recycled glass for this application is highly processed requiring crushing, classification and washing.
- 16Identical collection, bulking and transport to glass container manufacturing
18 21Sand delivered directly on site. Primary UK source of filtration sand is Leighton Buzzard, Beds.
- 3Assume kerbside collection with a 5 tonne load moved 15 miles i.e. journey of 7.5 miles no return load.
- 13Recycled glass per tonne based on average haulage distance of 150km 25 t loads.
2 2 Assume that filtration media is disposed to landfill at the end of life
22 65
43Net Effect of Substituting Recycled Materials for Virgin
Transport to reprocessor
CO2e figure for life cycle
Transport to end user
Transport to final disposal
Collection and transport to bulking site
Reprocessing
Transport from bulking station to glass reprocessor
Source Materials
Extraction of sand
BRITISH GLASS MANUFACTURERS CONFEDERATION – PUBLIC AFFAIRS COMMITTEE
20
GLASS RECYCLING – LIFE CYCLE CARBON DIOXIDE EMISSIONS
Table 5 shows that there is a net increase in CO2 emissions from using recycled glass filtration media instead of sand resulting from the higher processing requirements for glass and the transport energy use associated with collection. However, this analysis does not take into account any potential life cycle benefits associated with a possibly superior performance of glass, which could be reduced pumping energy and reduced flocculent use. At this stage there is no information available on these possible benefits but they could be considerable; if a 10 tonne pressure filter requires 1 kW less pumping power, then over a 5 year period the associated reduction in CO2 emissions would be 1,830 kg of CO2/tonne of recycled glass which far outweighs the net increase shown in Table 5.
4.5 Brick Manufacturing
The UK brick industry produces around 3 billion bricks per year. The process involves forming the bricks, with clay as the principal raw material, followed by drying and firing at temperatures around 1050 ºC. Glass contains about 15% soda (Na2O) which is a powerful fluxing agent and can reduce the firing temperatures when small additions are made to bricks. Studies have shown that finely ground glass is required with a size range around 20-40µm and the optimum addition rate is approximately 5%, giving a reduction in firing energy requirement of around 5%. At this addition rate the maximum potential consumption of glass for this application would be 350,000 tonnes/year.
WRAP sponsored field trials are currently underway with a number of brick manufacturers and WRAP recently announced support to establish a fine ground processing capacity in the UK. To achieve the required fineness a two stage crushing and grinding process will be required for the glass; a primary size reduction followed by ball milling. To achieve the required economies of scale a relatively large plant will be required probably in the range 50,000 to 100,000 tonnes/year.
Table 6 shows the comparative CO2 emissions for brick manufacture with and without a 5% glass addition which shows that the glass addition reduces the CO2 emissions by some 4 kg/tonne of bricks.
BRITISH GLASS MANUFACTURERS CONFEDERATION – PUBLIC AFFAIRS COMMITTEE
21
GLASS RECYCLING – LIFE CYCLE CARBON DIOXIDE EMISSIONS
Table 6 CO2 Life Cycle Emissions for Brick Manufacture (kg CO2/tonne of bricks)
- <1 Same assumptions as containers.
2 1Principally clay extraction for virgin materials. For glass a figure of 40 kWh/tonne (electricity) is assumed
0 <1 Most brick factories have on-site clay extraction. For recycled glass assume 50 miles no return loads.
142 138 An addition of 5% glass to the bricks will give an energy reduction of 5% in the brick firing process.
2 2Emissions related to brick disposal at the end of building life. Could be recycled to aggregate applications.
2 2Assume 25 tonne loads moved 30 miles @8mpg from demolition site to landfill.
148 143
n/a -5
AssumptionsSource Materials
Transport to disposal
Virgin Materials
Extraction and production/reprocessing
Recycled glass collection and transport to reprocessing facility
With 5% Glass
Net effect of including 5% glass per tonne of bricks
Transport to brick works
CO2e figure for life cycle
Brick production
Removal and transport to disposal site
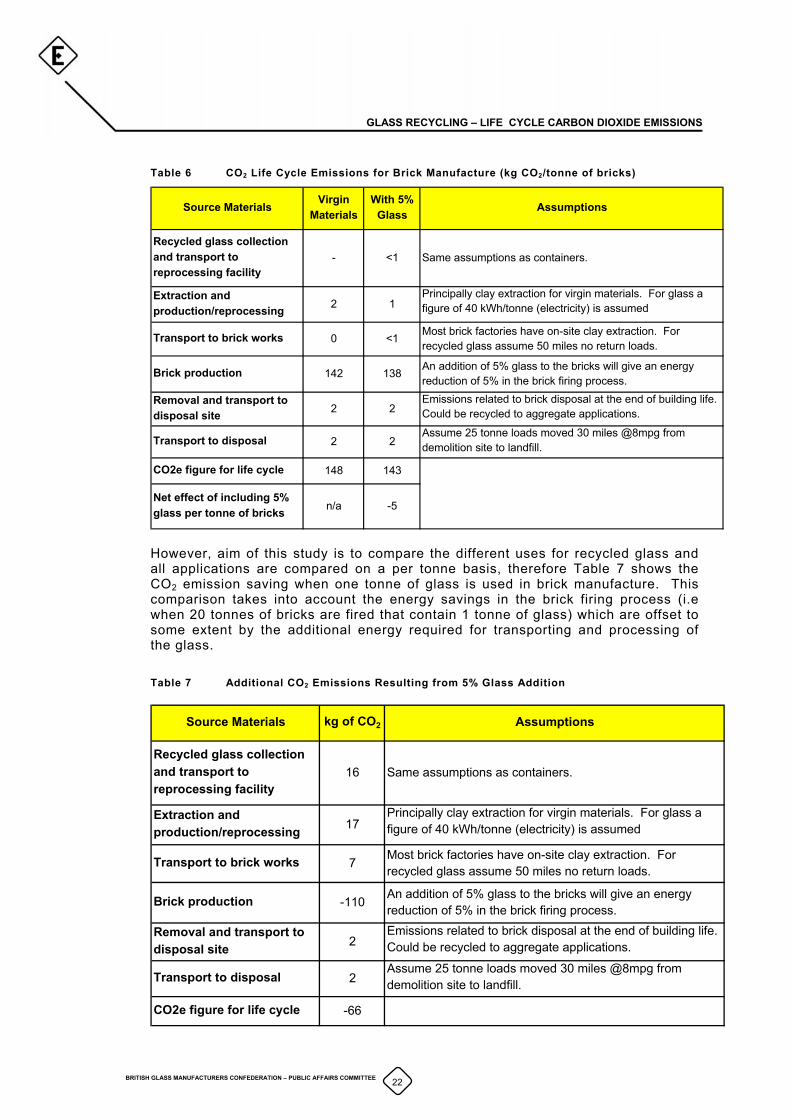
However, aim of this study is to compare the different uses for recycled glass and all applications are compared on a per tonne basis, therefore Table 7 shows the CO2 emission saving when one tonne of glass is used in brick manufacture. This comparison takes into account the energy savings in the brick firing process (i.e when 20 tonnes of bricks are fired that contain 1 tonne of glass) which are offset to some extent by the additional energy required for transporting and processing of the glass.
Table 7 Additional CO2 Emissions Resulting from 5% Glass Addition
16 Same assumptions as containers.
17Principally clay extraction for virgin materials. For glass a figure of 40 kWh/tonne (electricity) is assumed
7 Most brick factories have on-site clay extraction. For recycled glass assume 50 miles no return loads.
-110 An addition of 5% glass to the bricks will give an energy reduction of 5% in the brick firing process.
2Emissions related to brick disposal at the end of building life. Could be recycled to aggregate applications.
2Assume 25 tonne loads moved 30 miles @8mpg from demolition site to landfill.
-66
Recycled glass collection and transport to reprocessing facility
Transport to brick works
CO2e figure for life cycle
Brick production
Removal and transport to disposal site
kg of CO2 AssumptionsSource Materials
Transport to disposal
Extraction and production/reprocessing
BRITISH GLASS MANUFACTURERS CONFEDERATION – PUBLIC AFFAIRS COMMITTEE
22
GLASS RECYCLING – LIFE CYCLE CARBON DIOXIDE EMISSIONS
Table 7 shows that the net result of adding glass to bricks is a CO2 saving of 66kg/tonne of recycled glass.
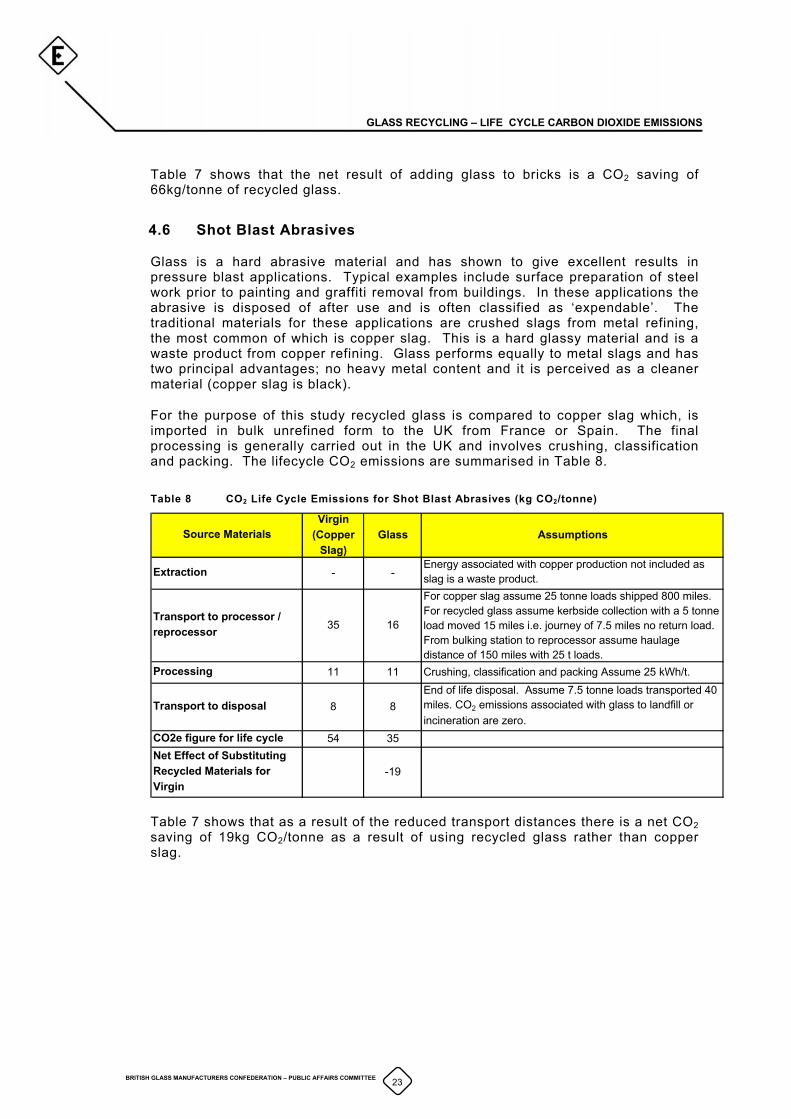
4.6 Shot Blast Abrasives
Glass is a hard abrasive material and has shown to give excellent results in pressure blast applications. Typical examples include surface preparation of steel work prior to painting and graffiti removal from buildings. In these applications the abrasive is disposed of after use and is often classified as ‘expendable’. The traditional materials for these applications are crushed slags from metal refining, the most common of which is copper slag. This is a hard glassy material and is a waste product from copper refining. Glass performs equally to metal slags and has two principal advantages; no heavy metal content and it is perceived as a cleaner material (copper slag is black).
For the purpose of this study recycled glass is compared to copper slag which, is imported in bulk unrefined form to the UK from France or Spain. The final processing is generally carried out in the UK and involves crushing, classification and packing. The lifecycle CO2 emissions are summarised in Table 8.
Table 8 CO2 Life Cycle Emissions for Shot Blast Abrasives (kg CO2/tonne)
Virgin (Copper
Slag)Glass Assumptions
- -Energy associated with copper production not included as slag is a waste product.
35 16
For copper slag assume 25 tonne loads shipped 800 miles. For recycled glass assume kerbside collection with a 5 tonne load moved 15 miles i.e. journey of 7.5 miles no return load. From bulking station to reprocessor assume haulage distance of 150 miles with 25 t loads.
11 11 Crushing, classification and packing Assume 25 kWh/t.
8 8End of life disposal. Assume 7.5 tonne loads transported 40 miles. CO2 emissions associated with glass to landfill or incineration are zero.
54 35
-19
Source Materials
Extraction
Net Effect of Substituting Recycled Materials for Virgin
Transport to processor / reprocessor
CO2e figure for life cycle
Processing
Transport to disposal
Table 7 shows that as a result of the reduced transport distances there is a net CO2 saving of 19kg CO2/tonne as a result of using recycled glass rather than copper slag.
BRITISH GLASS MANUFACTURERS CONFEDERATION – PUBLIC AFFAIRS COMMITTEE
23
GLASS RECYCLING – LIFE CYCLE CARBON DIOXIDE EMISSIONS
4.7 Summary
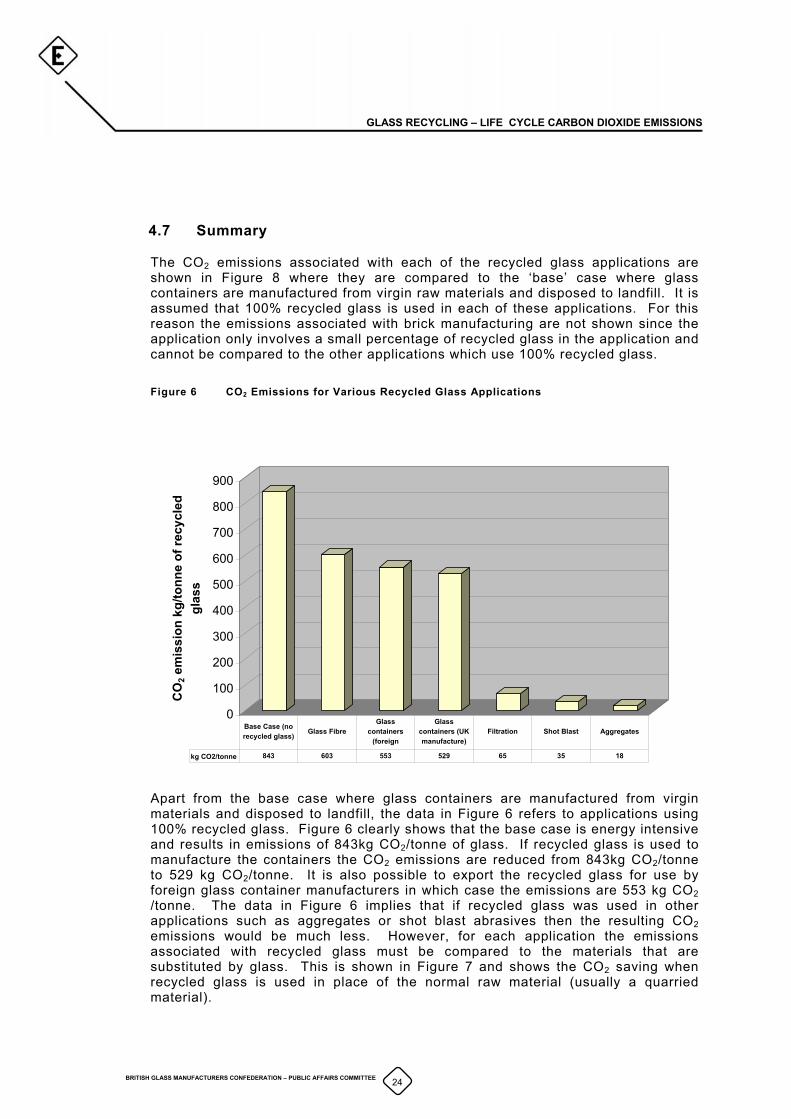
The CO2 emissions associated with each of the recycled glass applications are shown in Figure 8 where they are compared to the ‘base’ case where glass containers are manufactured from virgin raw materials and disposed to landfill. It is assumed that 100% recycled glass is used in each of these applications. For this reason the emissions associated with brick manufacturing are not shown since the application only involves a small percentage of recycled glass in the application and cannot be compared to the other applications which use 100% recycled glass.
Figure 6 CO2 Emissions for Various Recycled Glass Applications
0
100
200
300
400
500
600
700
800
900
CO
2 em
issi
on k
g/to
nne
of re
cycl
ed
glas
s
kg CO2/tonne 843 603 553 529 65 35 18
Base Case (no recycled glass) Glass Fibre
Glass containers
(foreign
Glass containers (UK manufacture)
Filtration Shot Blast Aggregates
Apart from the base case where glass containers are manufactured from virgin materials and disposed to landfill, the data in Figure 6 refers to applications using 100% recycled glass. Figure 6 clearly shows that the base case is energy intensive and results in emissions of 843kg CO2/tonne of glass. If recycled glass is used to manufacture the containers the CO2 emissions are reduced from 843kg CO2/tonne to 529 kg CO2/tonne. It is also possible to export the recycled glass for use by foreign glass container manufacturers in which case the emissions are 553 kg CO2 /tonne. The data in Figure 6 implies that if recycled glass was used in other applications such as aggregates or shot blast abrasives then the resulting CO2 emissions would be much less. However, for each application the emissions associated with recycled glass must be compared to the materials that are substituted by glass. This is shown in Figure 7 and shows the CO2 saving when recycled glass is used in place of the normal raw material (usually a quarried material).
BRITISH GLASS MANUFACTURERS CONFEDERATION – PUBLIC AFFAIRS COMMITTEE
24
GLASS RECYCLING – LIFE CYCLE CARBON DIOXIDE EMISSIONS
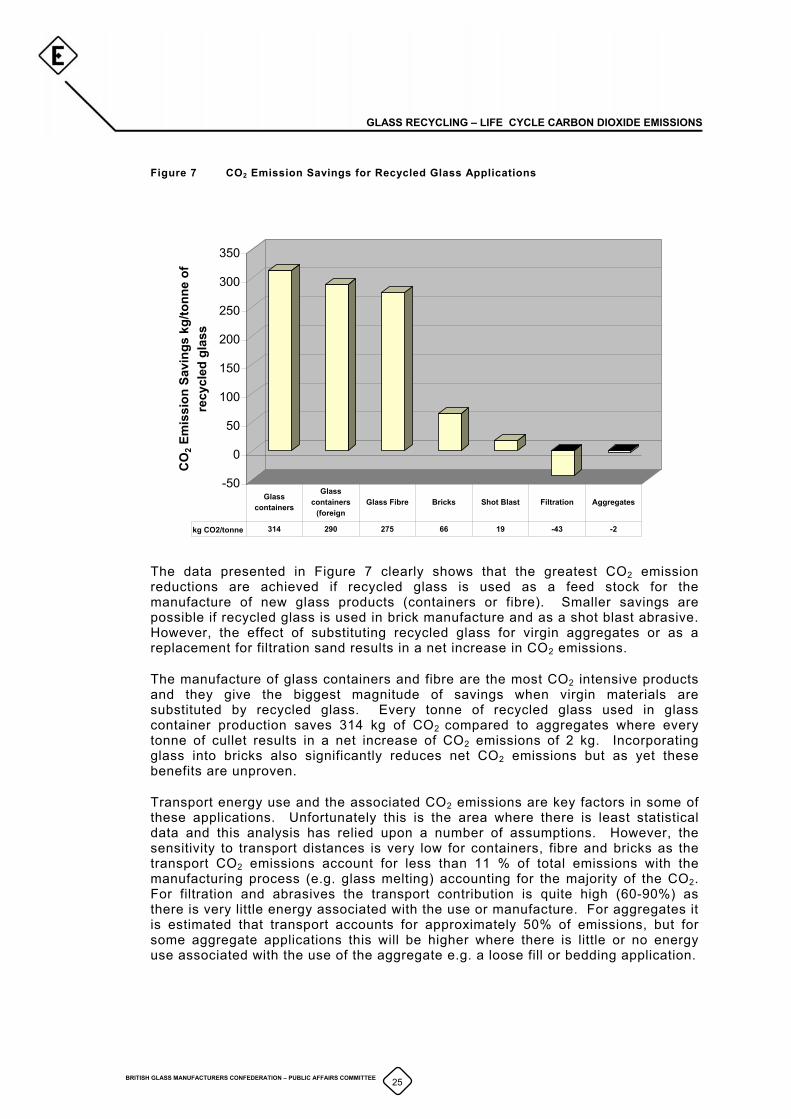
Figure 7 CO2 Emission Savings for Recycled Glass Applications
-50
0
50
100
150
200
250
300
350
CO
2 Em
issi
on S
avin
gs k
g/to
nne
of
recy
cled
gla
ss
kg CO2/tonne 314 290 275 66 19 -43 -2
Glass containers
Glass containers
(foreign Glass Fibre Bricks Shot Blast Filtration Aggregates
The data presented in Figure 7 clearly shows that the greatest CO2 emission reductions are achieved if recycled glass is used as a feed stock for the manufacture of new glass products (containers or fibre). Smaller savings are possible if recycled glass is used in brick manufacture and as a shot blast abrasive. However, the effect of substituting recycled glass for virgin aggregates or as a replacement for filtration sand results in a net increase in CO2 emissions.
The manufacture of glass containers and fibre are the most CO2 intensive products and they give the biggest magnitude of savings when virgin materials are substituted by recycled glass. Every tonne of recycled glass used in glass container production saves 314 kg of CO2 compared to aggregates where every tonne of cullet results in a net increase of CO2 emissions of 2 kg. Incorporating glass into bricks also significantly reduces net CO2 emissions but as yet these benefits are unproven.
Transport energy use and the associated CO2 emissions are key factors in some of these applications. Unfortunately this is the area where there is least statistical data and this analysis has relied upon a number of assumptions. However, the sensitivity to transport distances is very low for containers, fibre and bricks as the transport CO2 emissions account for less than 11 % of total emissions with the manufacturing process (e.g. glass melting) accounting for the majority of the CO2. For filtration and abrasives the transport contribution is quite high (60-90%) as there is very little energy associated with the use or manufacture. For aggregates it is estimated that transport accounts for approximately 50% of emissions, but for some aggregate applications this will be higher where there is little or no energy use associated with the use of the aggregate e.g. a loose fill or bedding application.
BRITISH GLASS MANUFACTURERS CONFEDERATION – PUBLIC AFFAIRS COMMITTEE
25
GLASS RECYCLING – LIFE CYCLE CARBON DIOXIDE EMISSIONS
5. IMPLICATIONS FOR FUTURE GLASS RECYCLING POLICY
The Producer Responsibility Obligation has been the principal policy instrument to
Another major driver to glass recycling is the Government funded WRAP
It is clear that using recycled glass as a feedstock for container or fibre glass
Based upon the findings of this study and the destination for recycled glass it is
The current situation is illustrated in Table 9 and shows that glass recycling in the
encourage glass recycling. The associated PRN system provides a financial incentive to recycle container glass but does not offer any incentives for any particular application. This project has shown that there are wide differences in the CO2 emission savings for each of the applications for recycled glass. It is clear that the greatest environmental benefits result from using the recycled glass as a feedstock for new glass manufacture and that there is a net increase in CO2 emissions when the recycled glass is used in aggregate and filtration applications. The current structure of the PRN system has encouraged the use of recycled glass in these applications with the net result of higher CO2 emissions compared to using the using the recycled glass as a feedstock for glass manufacture.
programme which over the past two years has provided considerable support towards the development of novel applications for recycled glass including concrete aggregates, water filtration and shot blast abrasive. The WRAP glass programme is driven by a number of targets, all related to increasing the overall glass recycling rates. However, the WRAP targets implicitly recognise the imbalance between the colour mix of recycled glass and UK container glass production, since their target to divert 200,000 tonnes towards aggregate applications specifically refers to green and mixed colour glass. The WRAP programme does not acknowledge the environmental benefits associated with export of recycled (green) glass to foreign glass manufacturers.
manufacture can produce significant CO2 savings which is in line with Government Climate Change policy which has the aim of reducing CO2 emissions; the recent Government White Paper sets out a long term goal of reducing GHG emissions by 60%. However, recycling policy in terms of the Producer Responsibility Obligation and the WRAP glass programmes appears to be at odds with climate change policy.
possible to quantify the current CO2 emission savings and to project the future savings.
UK results in estimated CO2 emission savings of approximately 186,000 tonnes/year.
BRITISH GLASS MANUFACTURERS CONFEDERATION – PUBLIC AFFAIRS COMMITTEE
26
GLASS RECYCLING – LIFE CYCLE CARBON DIOXIDE EMISSIONS
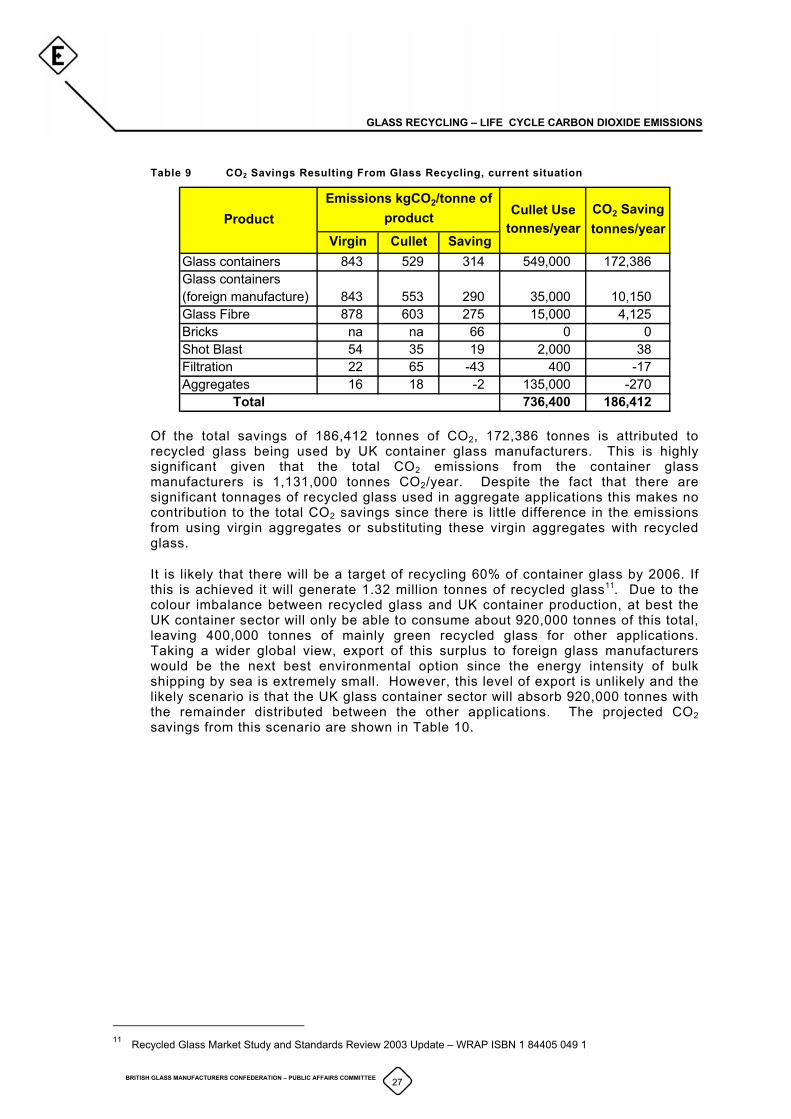
Table 9 CO2 Savings Resulting From Glass Recycling, current situation
Glass containers 843 529 314 549,000 172,386Glass containers (foreign manufacture) 843 553 290 35,000 10,150Glass Fibre 878 603 275 15,000 4,125Bricks na na 66 0 0Shot Blast 54 35 19 2,000 38Filtration 22 65 -43 400 -17Aggregates 16 18 -2 135,000 -270
Total 736,400 186,412
Cullet Use tonnes/year
CO2 Saving tonnes/year
ProductEmissions kgCO2/tonne of
productVirgin Cullet Saving
Of the total savings of 186,412 tonnes of CO2, 172,386 tonnes is attributed to recycled glass being used by UK container glass manufacturers. This is highly significant given that the total CO2 emissions from the container glass manufacturers is 1,131,000 tonnes CO2/year. Despite the fact that there are significant tonnages of recycled glass used in aggregate applications this makes no contribution to the total CO2 savings since there is little difference in the emissions from using virgin aggregates or substituting these virgin aggregates with recycled glass.
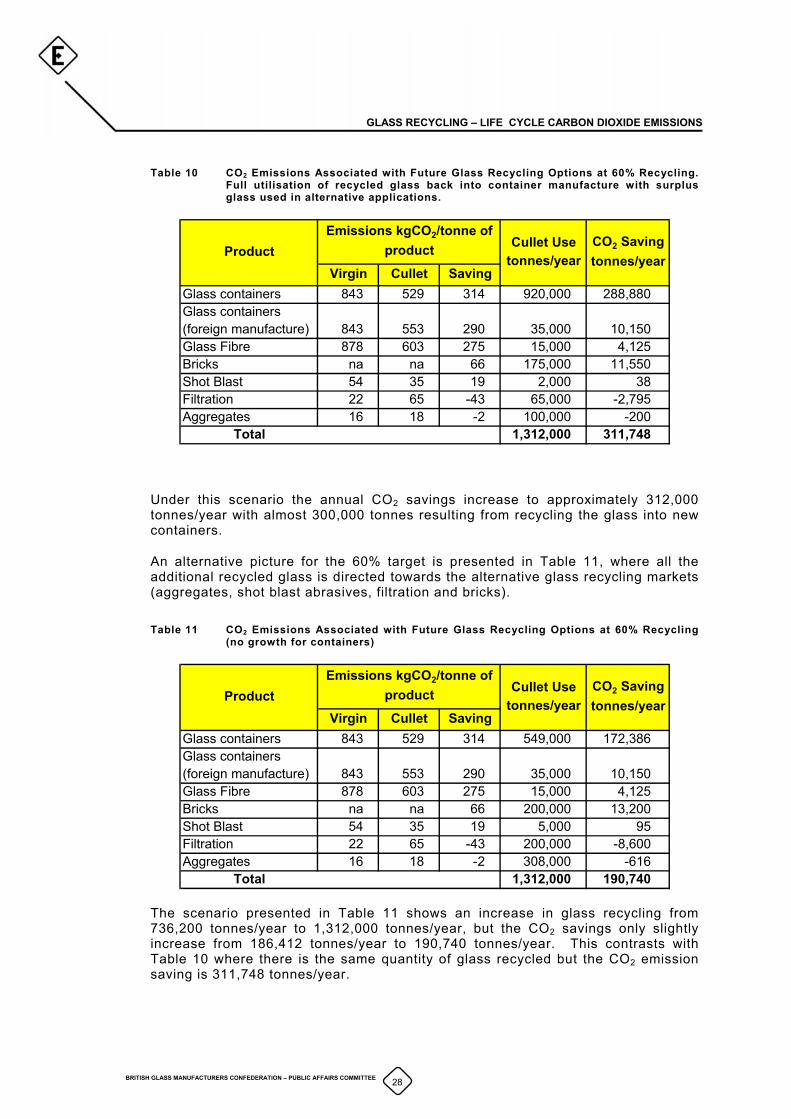
It is likely that there will be a target of recycling 60% of container glass by 2006. If this is achieved it will generate 1.32 million tonnes of recycled glass11. Due to the colour imbalance between recycled glass and UK container production, at best the UK container sector will only be able to consume about 920,000 tonnes of this total, leaving 400,000 tonnes of mainly green recycled glass for other applications. Taking a wider global view, export of this surplus to foreign glass manufacturers would be the next best environmental option since the energy intensity of bulk shipping by sea is extremely small. However, this level of export is unlikely and the likely scenario is that the UK glass container sector will absorb 920,000 tonnes with the remainder distributed between the other applications. The projected CO2 savings from this scenario are shown in Table 10.
11 Recycled Glass Market Study and Standards Review 2003 Update – WRAP ISBN 1 84405 049 1
BRITISH GLASS MANUFACTURERS CONFEDERATION – PUBLIC AFFAIRS COMMITTEE
27
GLASS RECYCLING – LIFE CYCLE CARBON DIOXIDE EMISSIONS
Table 10 CO2 Emissions Associated with Future Glass Recycling Options at 60% Recycling. Full utilisation of recycled glass back into container manufacture with surplus glass used in alternative applications.
Glass containers 843 529 314 920,000 288,880Glass containers (foreign manufacture) 843 553 290 35,000 10,150Glass Fibre 878 603 275 15,000 4,125Bricks na na 66 175,000 11,550Shot Blast 54 35 19 2,000 38Filtration 22 65 -43 65,000 -2,795Aggregates 16 18 -2 100,000 -200
Total 1,312,000 311,748
Virgin Cullet Saving
Cullet Use tonnes/year
CO2 Saving tonnes/year
ProductEmissions kgCO2/tonne of
product
Under this scenario the annual CO2 savings increase to approximately 312,000 tonnes/year with almost 300,000 tonnes resulting from recycling the glass into new containers.
An alternative picture for the 60% target is presented in Table 11, where all the additional recycled glass is directed towards the alternative glass recycling markets (aggregates, shot blast abrasives, filtration and bricks).
Table 11 CO2 Emissions Associated with Future Glass Recycling Options at 60% Recycling (no growth for containers)
Glass containers 843 529 314 549,000 172,386Glass containers (foreign manufacture) 843 553 290 35,000 10,150Glass Fibre 878 603 275 15,000 4,125Bricks na na 66 200,000 13,200Shot Blast 54 35 19 5,000 95Filtration 22 65 -43 200,000 -8,600Aggregates 16 18 -2 308,000 -616
Total 1,312,000 190,740
CO2 Saving tonnes/year
ProductEmissions kgCO2/tonne of
productVirgin Cullet
Cullet Use tonnes/year
Saving
The scenario presented in Table 11 shows an increase in glass recycling from 736,200 tonnes/year to 1,312,000 tonnes/year, but the CO2 savings only slightly increase from 186,412 tonnes/year to 190,740 tonnes/year. This contrasts with Table 10 where there is the same quantity of glass recycled but the CO2 emission saving is 311,748 tonnes/year.
BRITISH GLASS MANUFACTURERS CONFEDERATION – PUBLIC AFFAIRS COMMITTEE
28

GLASS RECYCLING – LIFE CYCLE CARBON DIOXIDE EMISSIONS
These projections clearly illustrate the environmental benefits of recycling glass into new containers (and glass fibre) compared to using the glass in aggregate and filtration applications. For the future a recycling policy that gives preference to the glass manufacturing sector would also make a significant contribution towards UK Government climate change targets.
BRITISH GLASS MANUFACTURERS CONFEDERATION – PUBLIC AFFAIRS COMMITTEE
29

GLASS RECYCLING – LIFE CYCLE CARBON DIOXIDE EMISSIONS
APPENDICES
BRITISH GLASS MANUFACTURERS CONFEDERATION – PUBLIC AFFAIRS COMMITTEE
GLASS RECYCLING – LIFE CYCLE CARBON DIOXIDE EMISSIONS
1. ESTIMATION OF TRANSPORT DISTANCES FOR RECYCLED GLASS
There are three components to transporting recycled glass for container manufacture:
1. From collection (either kerbside or bottle bank) to bulking station
2. From bulking station to reprocessor
3. From reprocessor to glass factory
From collection (either kerbside or bottle bank) to bulking station
Assume 5 tonne loads are moved 7.5 miles (total round trip 15miles) on a vehicle with a fuel consumption of 12 mpg. This gives a specific CO2 emission of 3.06 kg/tonne
From bulking station to reprocessor
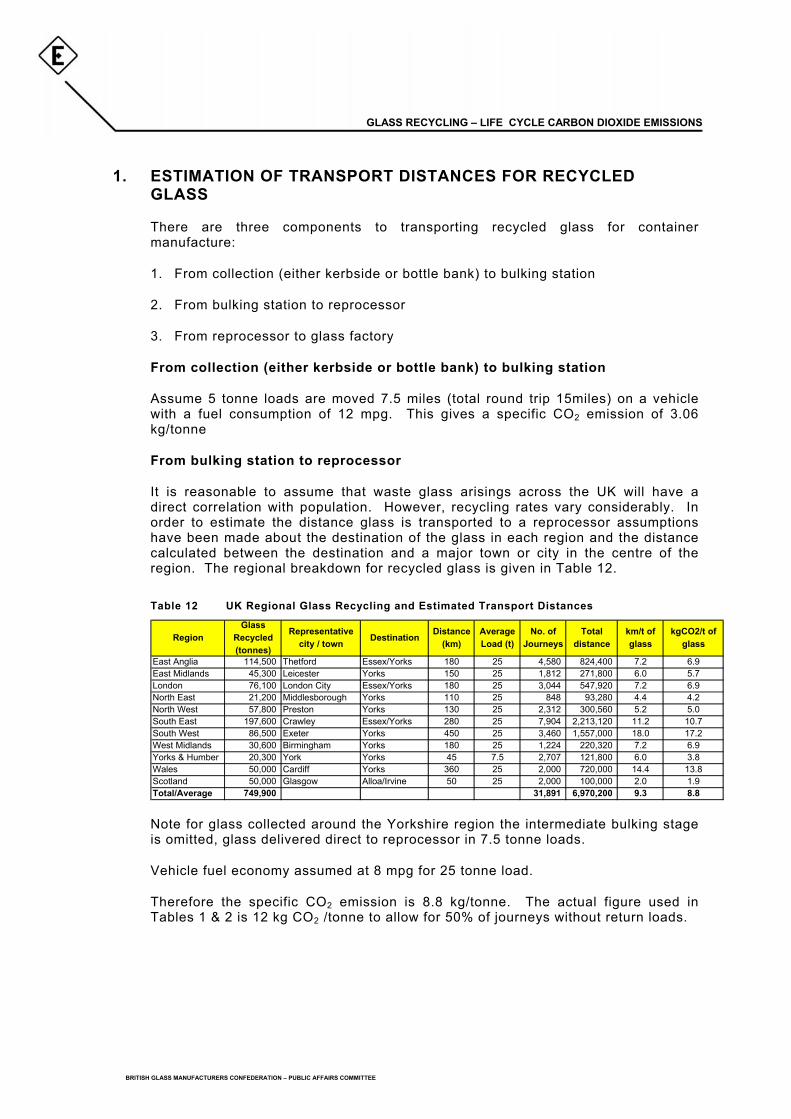
It is reasonable to assume that waste glass arisings across the UK will have a direct correlation with population. However, recycling rates vary considerably. In order to estimate the distance glass is transported to a reprocessor assumptions have been made about the destination of the glass in each region and the distance calculated between the destination and a major town or city in the centre of the region. The regional breakdown for recycled glass is given in Table 12.
Table 12 UK Regional Glass Recycling and Estimated Transport Distances
RegionGlass
Recycled (tonnes)
Representative city / town Destination Distance
(km)Average Load (t)
No. of Journeys
Total distance
km/t of glass
kgCO2/t of glass
East Anglia 114,500 Thetford Essex/Yorks 180 25 4,580 824,400 7.2 6.9East Midlands 45,300 Leicester Yorks 150 25 1,812 271,800 6.0 5.7London 76,100 London City Essex/Yorks 180 25 3,044 547,920 7.2 6.9North East 21,200 Middlesborough Yorks 110 25 848 93,280 4.4 4.2North West 57,800 Preston Yorks 130 25 2,312 300,560 5.2 5.0South East 197,600 Crawley Essex/Yorks 280 25 7,904 2,213,120 11.2 10.7South West 86,500 Exeter Yorks 450 25 3,460 1,557,000 18.0 17.2West Midlands 30,600 Birmingham Yorks 180 25 1,224 220,320 7.2 6.9Yorks & Humber 20,300 York Yorks 45 7.5 2,707 121,800 6.0 3.8Wales 50,000 Cardiff Yorks 360 25 2,000 720,000 14.4 13.8Scotland 50,000 Glasgow Alloa/Irvine 50 25 2,000 100,000 2.0 1.9Total/Average 749,900 31,891 6,970,200 9.3 8.8
Note for glass collected around the Yorkshire region the intermediate bulking stage is omitted, glass delivered direct to reprocessor in 7.5 tonne loads.
Vehicle fuel economy assumed at 8 mpg for 25 tonne load.
Therefore the specific CO2 emission is 8.8 kg/tonne. The actual figure used in Tables 1 & 2 is 12 kg CO2 /tonne to allow for 50% of journeys without return loads.
BRITISH GLASS MANUFACTURERS CONFEDERATION – PUBLIC AFFAIRS COMMITTEE
GLASS RECYCLING – LIFE CYCLE CARBON DIOXIDE EMISSIONS
From reprocessor to glass factory
The major glass reprocessing sites are situated close to the glass container factories. In some cases the reprocessor is on the glass site (e.g. Re-Use at Rockware Knottingley and Biffa at United Glass, Harlow).
An average distance of 5 miles in 25 tonne loads (10 mile return trip) at 8 mpg is assumed giving a specific CO2 emission of 0.61 kg/t.
Therefore the total CO2 emissions associated with glass collection and transport to the glass container factories is estimated at 16.9 kg/tonne.
BRITISH GLASS MANUFACTURERS CONFEDERATION – PUBLIC AFFAIRS COMMITTEE
GLASS RECYCLING – LIFE CYCLE CARBON DIOXIDE EMISSIONS
2. SUMMARY OF DATA ANALYSIS FOR UK GLASS FURNACES
Introduction
Previous studies have reported that by substituting recycled glass for virgin materials as the feed for glass manufacture significant savings in energy consumption are achieved. The savings are typically estimated to be around 2.5% of the total energy input for every 10% of virgin feed replaced by recycled glass.
To investigate whether such savings are achievable, daily energy use, feed and production data was collated for ten furnaces. This data was then analysed to identify patterns in energy consumption with variations in the amount of recycled glass being fed into each of the furnaces
Data Analysis Methodology
Multiple regression analysis was used to analyse the data. This is an extension of linear regression and is used to determine whether a relationship exists between a single y variable and more than one x variable. The analysis provides a y = b1x1 + b2x2 … + c relationship, with b1 and b2 being coefficients by which x1 and x2 must be multiplied and c being a fixed constant.
For this study, the focus of the analysis was to derive a relationship by which daily primary energy use (y) could be predicted for each furnace using the tonnage of virgin feed (x1) and recycled glass (x2) entering the furnace and its efficiency (x3). For reference, the term primary energy refers to the total energy input required to heat the furnace. It therefore includes both gas and electricity use.
Analysis Results
Due reasons of commercial confidentiality the results for individual furnaces cannot be published. However, data from 11 furnaces was analysed ranging in outputs from 170 tonnes/day to over 300 tonnes/day. The furnaces covered the complete range of glass colours and the average recycled glass content of the feedstock ranged from 29 to 66%. The combined output of the furnaces was approximately 830,000 tonnes of containers/year representing over half the UK output.
Conclusions
The results of the analysis predict that an average energy saving of 2.8% is achieved for every 10% of recycled glass substituted for virgin materials. This prediction corresponds well with previous findings, where energy savings in the region of 2.5% for every 10% of recycled glass used were reported.
BRITISH GLASS MANUFACTURERS CONFEDERATION – PUBLIC AFFAIRS COMMITTEE
GLASS RECYCLING – LIFE CYCLE CARBON DIOXIDE EMISSIONS
3. CALCULATION OF CARBON DIOXIDE EMISSIONS FROM SODA ASH PRODUCTION
Brunner Mond in Cheshire is the sole UK producer of soda ash in the UK and for reasons of commercial confidentiality do not publish data on specific CO2 emissions for soda ash. They operate the Solvay process that uses limestone and salt (sodium chloride) as the raw materials to produce soda ash (sodium carbonate) and calcium chloride. The process is energy intensive requiring large amounts of steam and electricity (which have associated CO2 emissions) and there is a calcinations process step where limestone is converted to lime using coke as a fuel.
Brunner Mond receive all their electricity and steam from an adjacent CHP plant operated by Powergen. This plant has an electrical output of 120 MW, of which Brunner Mond consumes approximately 25MW with the rest exported to the Grid. Brunner Mond makes uses all of the total steam output (approximately 300-400 MW) from the CHP plant. The CO2 emissions of the CHP are reported in the Environment Agency’s Pollution Inventory for 2002 as 726,000 tonnes12. Since the CHP plant ‘exports’ most of its electrical output it would be unfair to apportion all its associated CO2 emissions to Brunner Mond. If its is assumed that the CHP electricity ‘displaces’ conventionally generated electricity this would be equivalent to 359,000 tonnes of CO2 (based upon an annual generation of 835 million kWh). Therefore, the CO2 emission from the CHP plant that are associated with Brunner Mond’s power and steam use are estimated at 367,000 tonnes/year.
In addition to the 367,000 tonnes there are ‘process’ CO2 emissions which in 2002 totalled 120,341 tonnes according to the Pollution Inventory. Therefore, total CO2 emissions for Brunner Mond were 487,300 tonnes in 2002.
Annual production of soda ash is estimated to be 1 million tonnes together with a roughly similar amount of calcium chloride. Assuming that CO2 emissions can be apportioned equally to these two product streams the specific emissions for the production of soda ash is estimated at 244 kg CO2 /tonne of soda ash.
12 Environment Agency Pollution Inventory (www.environment-agency.gov.uk)
BRITISH GLASS MANUFACTURERS CONFEDERATION – PUBLIC AFFAIRS COMMITTEE
GLASS RECYCLING – LIFE CYCLE CARBON DIOXIDE EMISSIONS
4. GLOSSARY AND DEFINITIONS
Aggregates Tax
In April 2002 the Aggregates Tax was introduced which imposed a duty equivalent to £1.60/tonne on sand, gravel or crushed rock used as an aggregate. As the tax is only applied to virgin quarried materials it encourages the use of recycled materials. Given that the majority of aggregates are low cost materials sold at less than £10/tonne the tax is a significant driver to the use of recycled materials (including glass) for aggregate applications.
Closed Loop Recycling
Recycling application where the glass is recycled more than once as in glass container manufacturing where used glass containers may be remelted to produce new container ad-infinitum.
Climate Change Levy
In April 2001 the Climate Change Levy (CCL) was introduced, in effect this is an energy tax payable by all non-domestic energy users. Although the rates of tax appear quite small (0.43p/kWh for electricity and 0.15p/kWh for electricity) they represent about 15-20% of energy cost. The Government recognised the potentially damaging effect of the CCL on energy intensive industrial sectors (such as glass manufacturing) and introduced a number of ‘Negotiated Agreements. Under these agreements the relevant trade associations agreed to meet defined energy savings targets up to 2010 and in return for achieving these targets all their member companies received an 80% rebate of their CCL costs.
In glass manufacturing as the quantity of recycled glass in the feedstock increases less energy is required to melt the glass. Therefore, the increased use of ‘cullet’ in glass manufacturing is an important contributor to the sector achieving its energy saving targets and preserving the CCL rebate. Therefore the Climate Change Levy is an important driver to increased use of recycled glass within the glass manufacturing sector.
Cullet
The commonly employed term for recycled glass that has been processed in some manner, usually crushing and screening.
EU Landfill Directive
The Landfill Directive was adopted by the EU in April 1999, and the deadline for transposition into UK legislation was July 2001. The Directive is transposed into English and Welsh legislation though the Landfill (England and Wales) Regulations 2002, and is still to be introduced in Scotland and Northern Ireland. The overall aim of the Directive is to deal with the full social, environmental and economic impacts of landfill as a disposal option whilst generally improving waste management practices. The Directive also aims to reduce greenhouse gas emissions from landfill sites.
One of the main provisions of the Directive is the gradual reduction in biodegradable municipal solid waste going to landfill. The Directive promotes alternatives to landfill in order to manage the diverted waste and encourages initiatives to minimise the amount of biodegradable municipal waste being produced.
BRITISH GLASS MANUFACTURERS CONFEDERATION – PUBLIC AFFAIRS COMMITTEE
GLASS RECYCLING – LIFE CYCLE CARBON DIOXIDE EMISSIONS
Challenging targets and timescales have been established for the progressive diversion of biodegradable waste disposed of to landfill. The UK and other countries with high dependence on landfill have been granted a 4-year extension period to meet the targets imposed by the Directive. The amount of biodegradable municipal waste disposed of to landfill will need to be reduced to 75% by weight of 1995 levels by 2010 and eventually to 35% by 2020.
In response to the Landfill Directive, targets have been set for English and Welsh local authorities for recycling and recovery of household and municipal waste, as outlined in Government’s Waste Strategy 2000:
By 2005, the amount of industrial and commercial waste sent to landfill must be reduced to 85% of that land filled in 1998;
To recover value from 40% of municipal waste by 2005, 45% by 2010 and 67% by 2015 9 through recycling, composting, other forms of material recovery or energy recovery via waste combustion);
To recycle or compost at least 25% of household waste by 2005, 30% by 2010, and 33% by 2015.
For local authorities, the targets set in Waste Strategy 2000 will increase the need to establish collection and recycling systems for all recyclates, including glass.
The Landfill Directive will impact on waste producers mainly through increased disposal costs relating to the higher operating standards imposed on landfill sites and the need to use alternative waste management options for certain wastes. Increased costs will provide an incentive to recycle waste streams.
As an additional driver to reduce land filling, the Government has announced its intentions to increase landfill tax to from the current rate of £14 per tonne to £35 per tonne in the medium to long term. This increase will come into effect in 2005/06 when the current annual escalator of £1 per tonne per year will rise to £3, further adding to the cost of landfill.
Flint glass
The common industry term for clear glass.
Primary manufacture
The fundamental process step to produce a glass article e.g. the manufacture of glass containers or fibre glass
PRN
A Packaging Recovery Note is issued by an Accredited Reprocessor for every tonne of glass recycled. See Producer Responsibility Obligations.
Producer Responsibility Obligations (Packaging Waste) Regulations 1997
The Producer Responsibility Obligations (Packaging Waste) Regulations came into force in the UK in March 1997 and implement the EC Packaging and Packaging Waste Directive (91/62/EC). The objectives of the Directive are to reduce packaging waste and to encourage the re-use, recycle and recovery of packaging waste.
BRITISH GLASS MANUFACTURERS CONFEDERATION – PUBLIC AFFAIRS COMMITTEE
GLASS RECYCLING – LIFE CYCLE CARBON DIOXIDE EMISSIONS
The targets under the Directive cover overall packaging recovery and recycling targets and underlying material specific targets. As yet these targets have not been finalised but the overall target is likely be 60% recovery/recycling rate to be achieved by 2006. The material specific targets vary and are likely to be 20% for plastic up to 60% for glass.
The Regulations place legal obligations on businesses to recycle/recover a proportion of the packaging waste that they handle; the exact proportion to be recycled depends upon where a company sits within the packaging supply chain.
In Northern Ireland, legislation was introduced in 1999 under the Producer Responsibility Obligations (Packaging Waste) Regulations (NI) 1999. The regulations do not significantly differ from those for the rest of the UK, although the recovery and recycling targets do not necessarily follow those used elsewhere.
In practice very few companies actually undertake the recycling activities themselves but they provide evidence of the recycling activity through the purchase of Packaging Recovery Notes (PRNs). These are issued by accredited reprocessors who actually undertake the recycling activity, so there is an active market around the issue and purchase of PRNs. In response to this situation ‘compliance schemes’ have been established operate whereby obligated companies pay a fee to join and the compliance scheme then undertakes the purchase of PRNs to fulfil their members’ obligations. There are a number of compliance schemes the largest of which is Valpak.
The income derived from the sale of PRNs can only be used to fund development of recycling infra-structure or to cover the cost involved with the reprocessing activity. Since the inception of the scheme PRN revenue has been an important driver in glass recycling however PRN prices have proved to be quite volatile.
Open loop recycling – A recycling application where the glass can only be used once for example aggregate applications.
Reprocessor
Under the Packaging Waste Regulations only Accredited Reprocessors can issue PRNs. Generally the reprocessor is the company who converts the recycled glass into a new end product. All glass container manufacturers are accredited reprocessors, however the companies who supply them with processed glass cullet are not.
The common definition of a reprocessor is a company that takes raw recycled glass and then processes it to enhance its purity. The reprocessor usually undertakes crushing and screening. Depending upon the final application there may be also be metal and ceramic removal, colour enhancement or colour separation
BRITISH GLASS MANUFACTURERS CONFEDERATION – PUBLIC AFFAIRS COMMITTEE