GIS analysis of flood damage using Google Earth - WIT …€¦ · GIS analysis of flood damage...
8
GIS analysis of flood damage using Google Earth M. Mori & T. Kameyama Department of Information and Computer Science, Kinki University, Japan Abstract Recently, flood damage has occurred frequently in Japan due to sudden heavy rainfall. Particularly, floods caused serious damage many times in 2008. Rapid flood analysis requires contour lines, fine aerial photo images, and a 3D model of the region. However, it is generally difficult to prepare ortho aerial photo images with high resolution for a region in order to quickly analyze damage. Conversely, recent photo images in Google Earth view are of relatively high quality, and are sufficient for use by a Geographic Information System (GIS). Contour lines generated in a GIS for 3D models are transformed to the Google Earth desktop application in a KML file. KML files are files specially formatted for Google Earth that contain data that allows them to be viewed in the Google Earth desktop application. Flooding of individual houses can be precisely estimated depending on flood water levels in the flooded area. Keywords: flood, 3D GIS, digital elevation model, 3D view, remote sensing, DEM/DSM, high resolution. 1 Introduction Geographic Information Systems (GIS) have become an effective tool for analyzing flood disasters, especially for three-dimensional (3D) analysis. 3D GIS require a Digital Elevation Model (DEM), which can construct a surface model around flood disaster for analysis. Also, 3D GIS requires fine aerial photo images, in which the flood damage of a given ground surface such as residential, field, public space etc. can be precisely estimated. Flood disasters occurred frequently around rivers in Japan in 2008, possibly due to global warming. However, one feature of such disasters is their River Basin Management V 105 www.witpress.com, ISSN 1743-3541 (on-line) © 2009 WIT Press WIT Transactions on Ecology and the Environment, Vol 124, doi:10.2495/RM090101
Transcript of GIS analysis of flood damage using Google Earth - WIT …€¦ · GIS analysis of flood damage...
GIS analysis of flood damage using Google Earth
M. Mori & T. Kameyama Department of Information and Computer Science, Kinki University, Japan
Abstract
Recently, flood damage has occurred frequently in Japan due to sudden heavy rainfall. Particularly, floods caused serious damage many times in 2008. Rapid flood analysis requires contour lines, fine aerial photo images, and a 3D model of the region. However, it is generally difficult to prepare ortho aerial photo images with high resolution for a region in order to quickly analyze damage. Conversely, recent photo images in Google Earth view are of relatively high quality, and are sufficient for use by a Geographic Information System (GIS). Contour lines generated in a GIS for 3D models are transformed to the Google Earth desktop application in a KML file. KML files are files specially formatted for Google Earth that contain data that allows them to be viewed in the Google Earth desktop application. Flooding of individual houses can be precisely estimated depending on flood water levels in the flooded area. Keywords: flood, 3D GIS, digital elevation model, 3D view, remote sensing, DEM/DSM, high resolution.
1 Introduction
Geographic Information Systems (GIS) have become an effective tool for analyzing flood disasters, especially for three-dimensional (3D) analysis. 3D GIS require a Digital Elevation Model (DEM), which can construct a surface model around flood disaster for analysis. Also, 3D GIS requires fine aerial photo images, in which the flood damage of a given ground surface such as residential, field, public space etc. can be precisely estimated. Flood disasters occurred frequently around rivers in Japan in 2008, possibly due to global warming. However, one feature of such disasters is their
River Basin Management V 105
www.witpress.com, ISSN 1743-3541 (on-line)
© 2009 WIT PressWIT Transactions on Ecology and the Environment, Vol 124,
doi:10.2495/RM090101
occurrence in unexpected areas. Previously, GIS has been used to analyze actual flood disasters [1]. However, high resolution aerial photo images are rather expensive for local governments. It is therefore difficult to quickly prepare such aerial photo images of the related area when sudden flood disasters occur. Conversely, recent photo images in Google Earth view are of very high quality, especially the spatial resolution of images in urban areas which is up to 0.15 meters. Resolution differs depending on region. These high resolutions are sufficient for GIS use. However, the coordinates used in Google Earth are only an approximation because the system in Google Earth view is merely a viewing tool for obtaining a general idea of the cache location rather than for technical application, and the errors can be up to 30 meters from the actual location. Thus it is necessary to correct the coordinates. For this research report, ArcGIS 9.2 (ESRI) is mainly used as a GIS analysis system for PC Windows.
2 Google Earth
Google Earth is a virtual globe, and geographic information application program. Google Earth application has been freely available since June 2005, and its current version is 5.0 in 2009. Google Earth shows images obtained from satellite imagery and aerial photography. The resolution of the Earth's surface in Google Earth view varies depending on points of interest and popularity, and is 15 meters as standard, increasing to 15 cm in limited areas. Also, Google Earth is able to show GIS data overlaid on the surface of the Earth through a Keyhole Markup Language (KML) file. The KML file was originally designed for the old Earth Viewer. A standard GIS application is able to transform a shape file to a KML file, and an shp2kml command can be used for the same purpose [2]. Google Earth shows a 3D view of the surface of terrain and buildings. Google Earth uses DEM data obtained by NASA's Shuttle Radar Topography Mission (SRTM). However, the resolution of SRTM is approximately 30 meters, which is not sufficient to analyze flood disasters.
3 Study area
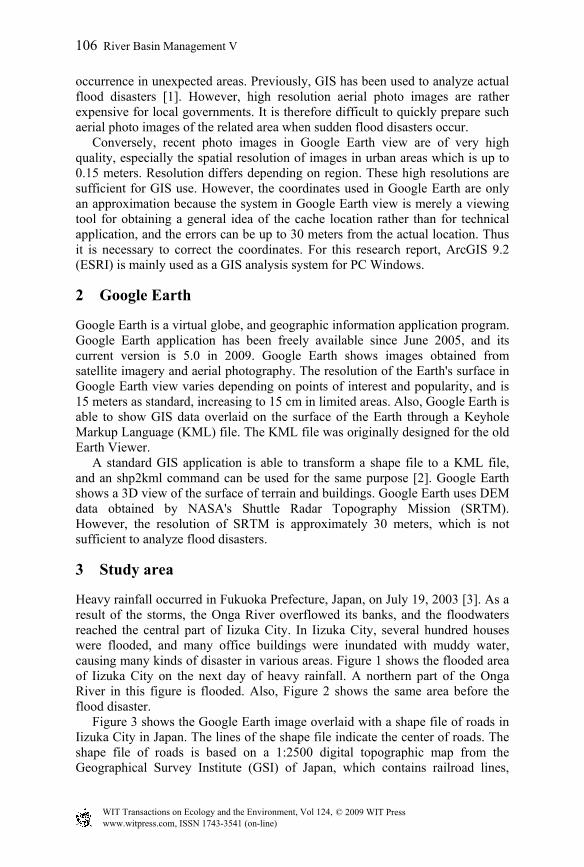
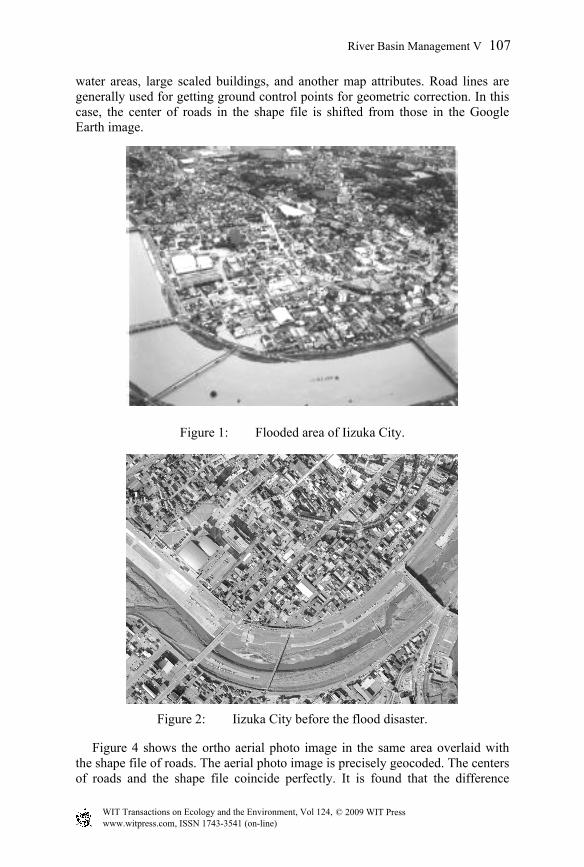
Heavy rainfall occurred in Fukuoka Prefecture, Japan, on July 19, 2003 [3]. As a result of the storms, the Onga River overflowed its banks, and the floodwaters reached the central part of Iizuka City. In Iizuka City, several hundred houses were flooded, and many office buildings were inundated with muddy water, causing many kinds of disaster in various areas. Figure 1 shows the flooded area of Iizuka City on the next day of heavy rainfall. A northern part of the Onga River in this figure is flooded. Also, Figure 2 shows the same area before the flood disaster. Figure 3 shows the Google Earth image overlaid with a shape file of roads in Iizuka City in Japan. The lines of the shape file indicate the center of roads. The shape file of roads is based on a 1:2500 digital topographic map from the Geographical Survey Institute (GSI) of Japan, which contains railroad lines,
106 River Basin Management V
www.witpress.com, ISSN 1743-3541 (on-line)
© 2009 WIT PressWIT Transactions on Ecology and the Environment, Vol 124,
water areas, large scaled buildings, and another map attributes. Road lines are generally used for getting ground control points for geometric correction. In this case, the center of roads in the shape file is shifted from those in the Google Earth image.
Figure 1: Flooded area of Iizuka City.
Figure 2: Iizuka City before the flood disaster.
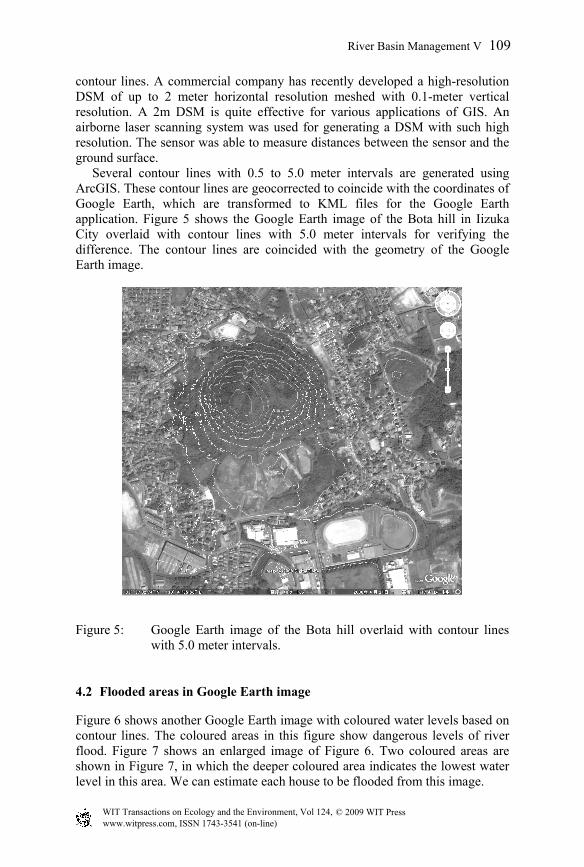
Figure 4 shows the ortho aerial photo image in the same area overlaid with the shape file of roads. The aerial photo image is precisely geocoded. The centers of roads and the shape file coincide perfectly. It is found that the difference
River Basin Management V 107
www.witpress.com, ISSN 1743-3541 (on-line)
© 2009 WIT PressWIT Transactions on Ecology and the Environment, Vol 124,
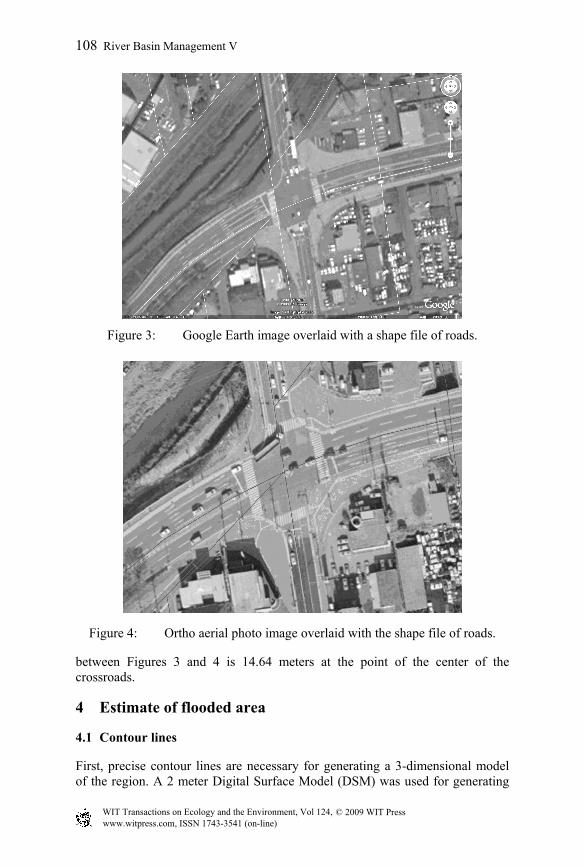
Figure 3: Google Earth image overlaid with a shape file of roads.
Figure 4: Ortho aerial photo image overlaid with the shape file of roads.
between Figures 3 and 4 is 14.64 meters at the point of the center of the crossroads.
4 Estimate of flooded area
4.1 Contour lines
First, precise contour lines are necessary for generating a 3-dimensional model of the region. A 2 meter Digital Surface Model (DSM) was used for generating
108 River Basin Management V
www.witpress.com, ISSN 1743-3541 (on-line)
© 2009 WIT PressWIT Transactions on Ecology and the Environment, Vol 124,
contour lines. A commercial company has recently developed a high-resolution DSM of up to 2 meter horizontal resolution meshed with 0.1-meter vertical resolution. A 2m DSM is quite effective for various applications of GIS. An airborne laser scanning system was used for generating a DSM with such high resolution. The sensor was able to measure distances between the sensor and the ground surface. Several contour lines with 0.5 to 5.0 meter intervals are generated using ArcGIS. These contour lines are geocorrected to coincide with the coordinates of Google Earth, which are transformed to KML files for the Google Earth application. Figure 5 shows the Google Earth image of the Bota hill in Iizuka City overlaid with contour lines with 5.0 meter intervals for verifying the difference. The contour lines are coincided with the geometry of the Google Earth image.
Figure 5: Google Earth image of the Bota hill overlaid with contour lines with 5.0 meter intervals.
4.2 Flooded areas in Google Earth image
Figure 6 shows another Google Earth image with coloured water levels based on contour lines. The coloured areas in this figure show dangerous levels of river flood. Figure 7 shows an enlarged image of Figure 6. Two coloured areas are shown in Figure 7, in which the deeper coloured area indicates the lowest water level in this area. We can estimate each house to be flooded from this image.
River Basin Management V 109
www.witpress.com, ISSN 1743-3541 (on-line)
© 2009 WIT PressWIT Transactions on Ecology and the Environment, Vol 124,
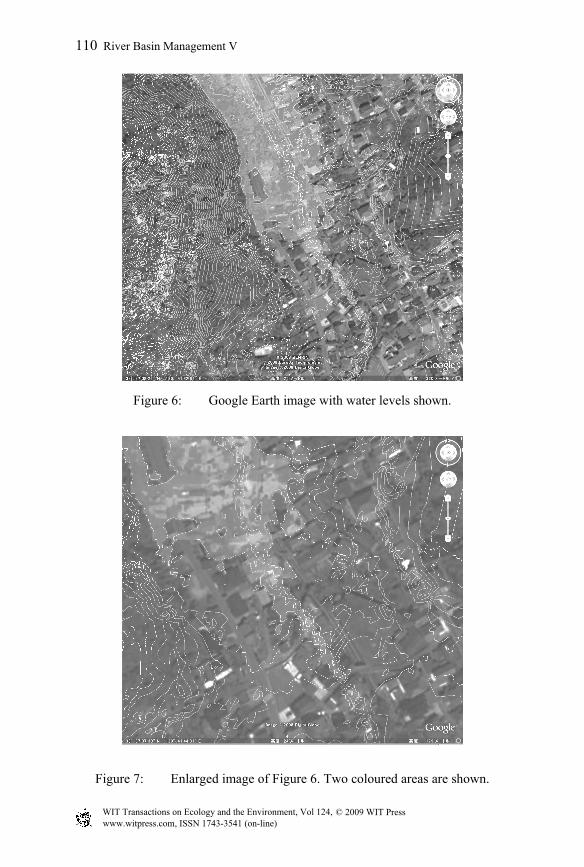
Figure 6: Google Earth image with water levels shown.
Figure 7: Enlarged image of Figure 6. Two coloured areas are shown.
110 River Basin Management V
www.witpress.com, ISSN 1743-3541 (on-line)
© 2009 WIT PressWIT Transactions on Ecology and the Environment, Vol 124,
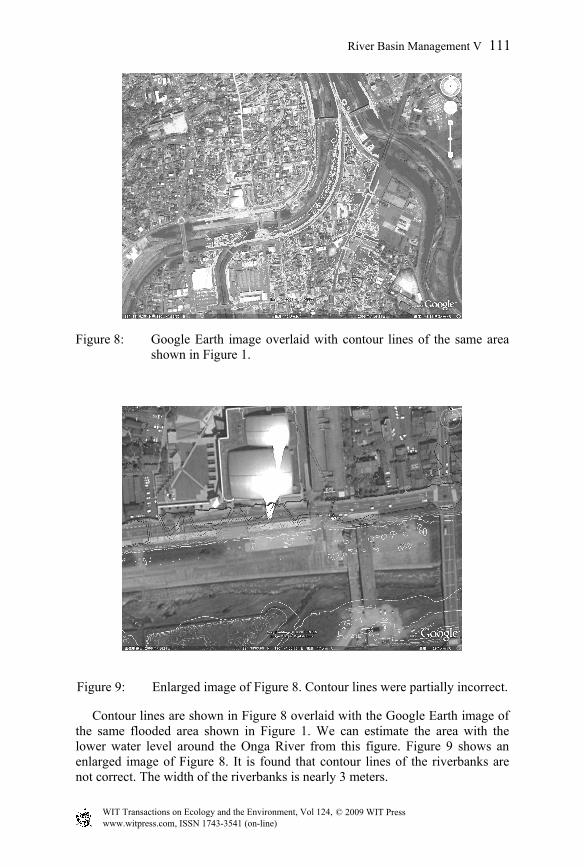
Figure 8: Google Earth image overlaid with contour lines of the same area shown in Figure 1.
Figure 9: Enlarged image of Figure 8. Contour lines were partially incorrect.
Contour lines are shown in Figure 8 overlaid with the Google Earth image of the same flooded area shown in Figure 1. We can estimate the area with the lower water level around the Onga River from this figure. Figure 9 shows an enlarged image of Figure 8. It is found that contour lines of the riverbanks are not correct. The width of the riverbanks is nearly 3 meters.
River Basin Management V 111
www.witpress.com, ISSN 1743-3541 (on-line)
© 2009 WIT PressWIT Transactions on Ecology and the Environment, Vol 124,

5 Conclusions
This research paper shows GIS data such as shape files overlaid on Google Earth images. Shape files are transformed to KML files for the Google Earth application. Recent Google Earth imagery is with high-resolution, which is somewhat useful for rapid flood analysis. However, contour lines based on 2 m DSM were partially incorrect for narrow riverbanks and roads because of topographic discontinuities, and are difficult to be precisely generated by airborne laser scanner. Also, another type of GIS data could yield more useful results. For example, a 3D model of narrow riverbanks could be rather generated by 3D CAD or the Google Sketchup application. The 3D model data generated by CAD or Google Sketchup could be transformed for Google Earth through AutoCAD dxf files or KML files. DSM data of such narrow riverbanks should be generated by ground laser scanner.
Acknowledgements
The present work was partially supported by the Grant-in-Aid for Scientific Research (C) No.16510141 from of the Ministry of Education, Science and Culture of Japan.
References
[1] Mori, M., Application of high-resolution (10m) DEM on Flood Disaster in 3D-GIS, Risk Analysis, 5, pp.263-270, 2006.
[2] Zonum Solutions, http://www.zonums.com/shp2kml.html. [3] Ushiyama, M., Characteristics of heavy rainfall disaster in Kyushu district
from July 19 to 21, 2003. Journal of Japan Society for Natural Disaster Science, 22(4), pp.373-385, 2004.
112 River Basin Management V
www.witpress.com, ISSN 1743-3541 (on-line)
© 2009 WIT PressWIT Transactions on Ecology and the Environment, Vol 124,