GIS EVALUATION OF URBAN GROWTH AND FLOOD …
24
TS07D - GIS Applications, 5479 Khalid AL-GHAMDI, Meraj MIRZA, , Ramze ELZAHRANY, and Gomaa DAWOD. GIS Evaluation of Urban Growth and Flood Hazards: A Case Study of Makkah City, Saudi Arabia FIG Working Week 2012 Knowing to manage the territory, protect the environment, evaluate the cultural heritage Rome, Italy, 6-10 May 2012 1/24 GIS EVALUATION OF URBAN GROWTH AND FLOOD HAZARDS: A CASE STUDY OF MAKKAH CITY, SAUDI ARABIA Khalid A. AL-GHAMDI, Meraj N. MIRZA, , Ramze A. ELZAHRANY Saudi Arabia, and Gomaa M. DAWOD, Egypt SUMMARY Four-dimensional Geographic Information System (4D GIS) furnishes a noteworthy technical tool for precisely mapping 3D-space growth of urban municipality over time. It can be augmented to estimate flood hazardous impacts due to urban sprawl. In the current study, a 4D GIS has been developed to analyze and quantify both urban growth and flood hazard changes in Makkah city, Saudi Arabia, over the last twenty years. It has been found that the urban growth in 1990 took the north-east and south-west directions, while it took the north- west and south-east directions in 2010. Additionally, investigating the city topography reveals that the urban sprawl mostly exist in low- and moderate-elevation regions. Attained results showed, also, that the residential regions of Makkah city have been increased by 197%, while the total flood volumes have been enlarged by 248%. This is due to two factors: (1) establishment of new residential areas in regions that already posse high flood impacts; and (2) building up new suburban areas on sediment soil that significantly decreases the permeability of the soil and, thus, leads to a crucial increase in hazardous water surface runoff. It is concluded that the utilization of GIS in urban growth and flood hazard estimation studies is quit powerful and provides a successful technical tool that helps in analyzing and understanding such phenomena. It is recommended that the achieved findings should be taken into account by decision-makers in development planning and resources management policies for Makkah metropolitan area. Keywords: GIS, Spatial analysis, Urban growth, Flood hazards, Rainfall-Runoff, Saudi Arabia.
Transcript of GIS EVALUATION OF URBAN GROWTH AND FLOOD …

TS07D - GIS Applications, 5479 Khalid AL-GHAMDI, Meraj MIRZA, , Ramze ELZAHRANY, and Gomaa DAWOD. GIS Evaluation of Urban Growth and Flood Hazards: A Case Study of Makkah City, Saudi Arabia
FIG Working Week 2012 Knowing to manage the territory, protect the environment, evaluate the cultural heritage Rome, Italy, 6-10 May 2012
1/24
GIS EVALUATION OF URBAN GROWTH AND FLOOD HAZARDS: A CASE STUDY OF MAKKAH CITY, SAUDI ARABIA
Khalid A. AL-GHAMDI, Meraj N. MIRZA, , Ramze A. ELZAHRANY Saudi Arabia,
and Gomaa M. DAWOD, Egypt SUMMARY Four-dimensional Geographic Information System (4D GIS) furnishes a noteworthy technical tool for precisely mapping 3D-space growth of urban municipality over time. It can be augmented to estimate flood hazardous impacts due to urban sprawl. In the current study, a 4D GIS has been developed to analyze and quantify both urban growth and flood hazard changes in Makkah city, Saudi Arabia, over the last twenty years. It has been found that the urban growth in 1990 took the north-east and south-west directions, while it took the north-west and south-east directions in 2010. Additionally, investigating the city topography reveals that the urban sprawl mostly exist in low- and moderate-elevation regions. Attained results showed, also, that the residential regions of Makkah city have been increased by 197%, while the total flood volumes have been enlarged by 248%. This is due to two factors: (1) establishment of new residential areas in regions that already posse high flood impacts; and (2) building up new suburban areas on sediment soil that significantly decreases the permeability of the soil and, thus, leads to a crucial increase in hazardous water surface runoff. It is concluded that the utilization of GIS in urban growth and flood hazard estimation studies is quit powerful and provides a successful technical tool that helps in analyzing and understanding such phenomena. It is recommended that the achieved findings should be taken into account by decision-makers in development planning and resources management policies for Makkah metropolitan area. Keywords: GIS, Spatial analysis, Urban growth, Flood hazards, Rainfall-Runoff, Saudi
Arabia.

TS07D - GIS Applications, 5479 Khalid AL-GHAMDI, Meraj MIRZA, , Ramze ELZAHRANY, and Gomaa DAWOD. GIS Evaluation of Urban Growth and Flood Hazards: A Case Study of Makkah City, Saudi Arabia
FIG Working Week 2012 Knowing to manage the territory, protect the environment, evaluate the cultural heritage Rome, Italy, 6-10 May 2012
2/24
GIS EVALUATION OF URBAN GROWTH AND FLOOD HAZARDS: A CASE STUDY OF MAKKAH CITY, SAUDI ARABIA
Khalid A. AL-GHAMDI, Meraj N. MIRZA, , Ramze A. ELZAHRANY Saudi Arabia,
and Gomaa M. DAWOD, Egypt
1. INTRODUCTION Urbanization is an outcome of natural and socio-economic factors and their utilization by man in time and space. The dispersed development along highways, or surrounding a city and in rural countryside is called urban sprawl. Geomatics technologies, such as Remote Sensing (RS) and GIS, furnish exceptional technical tools for urban modelling and planning. Mapping the spatial (three-dimensional) growth of a city over time, i.e. a four-dimensional scenario, is a central aspect in developing city planning strategies. Several researchers have examined this issue particularly with utilization of GIS and RS. Mishra et al. (2011) carried out a research project for detecting urban growth (1930-2005) and land use changes (2000-2005) in Bhubaneswar city, India. Also, Saravanan and Ilangovan (2010) used GIS to investigate the nature and pattern of urban expansion of Madurai city over its surrounding region during the period 1991-2006. Similarly, Feng (2009) used GIS and RS to quantifying the urban sprawl in China over the period 1980-2003. Moreover, Alabi (2009) integrated RS and GIS data to examine the sprawl of Lokoja region, Nigeria over the period 1987-2007. Abd-Allah (2007) utilized GIS and RS in modelling urban dynamics, particularly for quantifying the loss in agricultural lands in the greater Cairo region, Egypt, for 1972-2005. On the other hand, floods are natural returning hydrological phenomena that affect human lives. Hazards of flash floods, chiefly in urban regions, are vital from both human settlement and economical perspectives. Recently, the estimation of flood hazardous impacts and the development of GIS-based flood inundation maps have been considered a crucial demand. For example, Sagala (2006) carried out a detailed vulnerability assessment study to investigate physical flood hazards, particularly buildings' damages, in a residential area depending upon a mobile GIS. Fernandez and Lutz (2010) described a GIS-based research produced flood hazard maps for two cities in Argentina based on a multi-criteria design analysis. Park and Hur (2011) have utilized GIS for the development of flood simulation system for Namgang watershed, Korea. In addition, a similar methodology was proposed and rested in Georgia, USA (Qi and Altinakar, 2011). Hagen et al. (2011) presented a simple methodology for developing a nation-wide flood hazard maps in Afghanistan as an example of developing countries. A special attention was given to the interrelationship between urbanization and flood hazardous impact in the last few decades. He and Hogue (2011) integrated hydrologic modelling and land use projections to predict long-term impacts of urbanization on hydrologic behavior and water supply in Los Angeles, USA. Amini et al. (2011) concluded that changes in land-use will increase the peak stream flow, and the increase is directly proportional to the rate of urbanization in Damansara watershed, Malaysia. Additionally, Zheng and Qi (2011) highlighted that serious natural hazards, particularly flood impacts, are increased due to
TS07D - GIS Applications, 5479 Khalid AL-GHAMDI, Meraj MIRZA, , Ramze ELZAHRANY, and Gomaa DAWOD. GIS Evaluation of Urban Growth and Flood Hazards: A Case Study of Makkah City, Saudi Arabia
FIG Working Week 2012 Knowing to manage the territory, protect the environment, evaluate the cultural heritage Rome, Italy, 6-10 May 2012
3/24
urbanization in Chinese mountainous cities. 3D GIS models are proposed for simulating flood spreading in urban areas in order to decide optimum urban protection levels (e.g. Wang et al., 2010, and Merwade et al., 2008). Moreover, GIS was used for assessing economic impacts of flood damages in Korea (Yi et al., 2010) and in France (Vinet 2008). In Kingdom of Saudi Arabia (KSA), GIS and RS have been utilized in a variety of planning and development tasks such as: urban-rural land use change detection (e.g. Belaid, 2003), change detection in coastal areas (e.g. Al-Otaibi et al., 2006), traffic planning in Makkah city (Koshak 2006), modelling urban growth dynamics (e.g. Al-Ahmadia et al., 2008), analysis of population distribution variations (Elzahrany 2007), developing maps from RS images (AlSultan et al., 2008), groundwater exploration (e.g. El-Hames et al., 2001, and Al Saud 2010), and morphometric analysis (Subyani et al., 2010). Moreover, a great attention has been paid recently to the issue of flood assessment and flood hazards estimation in KSA. For example, Dawod et al. (2011) developed a GIS-based process to quantify the flood parameters, e.g. peak discharge and runoff volume, in Makkah city based on the US National Resources Conservation Service (NRCS)'s flood modelling method (known also as the curve number methodology). Moreover, Subyani (2011) investigated the flood probability for arid basins in Makkah administrative area. Dawod and Koshak (2011) developed NRCS-based unit hydrographs for the six catchments within Makkah metropolitan area as a tool for rainfall-runoff modelling and flood management. This paper aims to monitor and quantify the spatial urban sprawl of Makkah metropolitan area and the anticipated flood hazards' increase over the period 1947-2010 within a GIS environment. 2. STUDY AREA Makkah city is located in the south-west part of Kingdom of Saudi Arabia (KSA), about 80 km east of the Red Sea (Fig. 1). It extends from longitudes 39o 35’ E to 40o 02’ E, and from latitudes 21o 09’ N to 21o 37’ N. The current area of the metropolitan region (the study area) equals 1593 square kilometres. Makkah city is a unique city for Muslims all over the world, since it contains the holly mosque. From a religious point of view, a Muslim should perform pilgrimage (called Hajj, which means visiting Makkah in specific days in the year) once in his/her life. Thus, hundreds of thousands Muslims are gathered in Makkah yearly. Also, Muslims prefer to perform a religious tourism plane, called Omarh, to Makkah all over the years. This is an important factor to be considered in analyzing the urban growth of this city. Moreover, the topography of Makkah is complex in nature, and several mountainous areas exist inside its metropolitan area. That is also a vital element in investigating the spatial pattern of Makkah sprawl.

TS07D - GIS Applications, 5479 Khalid AL-GHAMDI, Meraj MIRZA, , Ramze ELZAHRANY, and Gomaa DAWOD. GIS Evaluation of Urban Growth and Flood Hazards: A Case Study of Makkah City, Saudi Arabia
FIG Working Week 2012 Knowing to manage the territory, protect the environment, evaluate the cultural heritage Rome, Italy, 6-10 May 2012
4/24
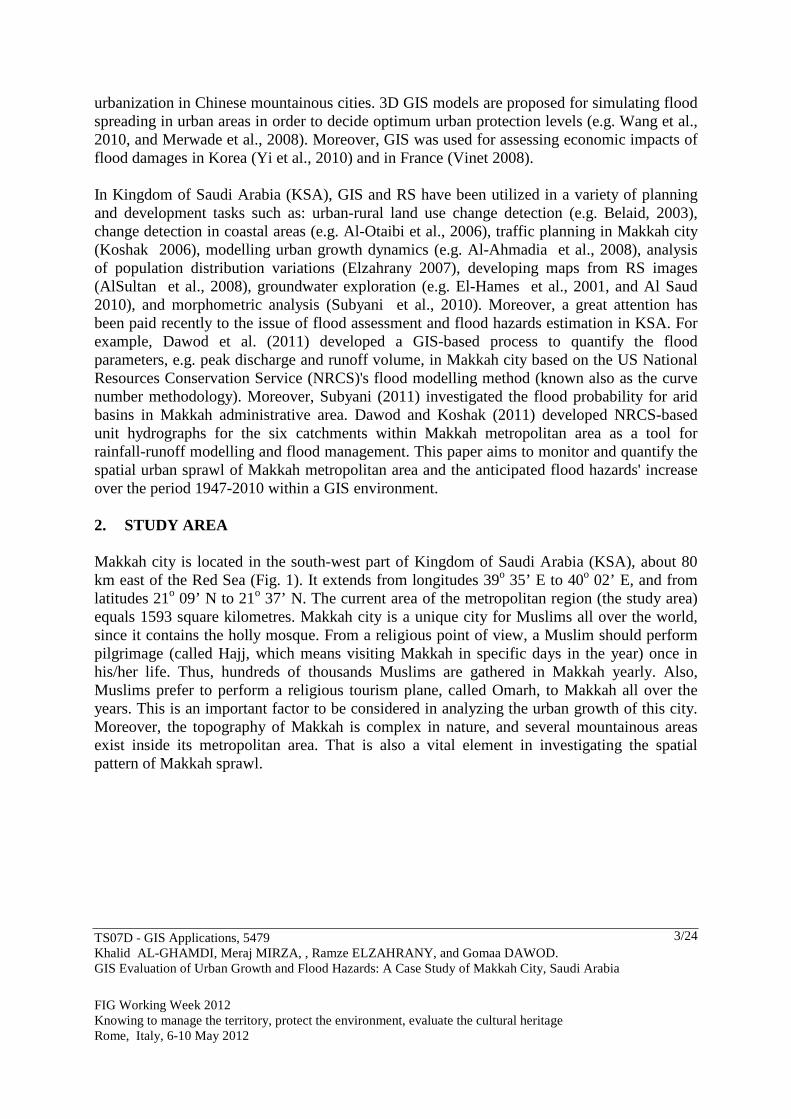
Figure 1: Study Area On a national level, precise flood assessment is considered as an important demand in Makkah metropolitan area due to the unexpected nature of rainfall that often produce flash hazardous floods. The annual rain over Makkah city, for a period extending from 1966 to 2010, varies from 3.8 mm to 318.5 mm, with an average of rainfall equals 102.6 mm (Fig. 2). Due to the complexity of Makkah’s topography, flash floods occur periodically with significant variations in magnitude. Mirza and Ahmed (2001) reported that the extreme flood type is repeated with a return period of 46 years, while a second-order flood takes place occasionally with a return period of 33 years, and a low-dangerous flood comes about every 13 years. The topography of the Makkah metropolitan area is complex, where several mountainous regions exist within the urban boundaries of the city. Terrain elevations in Makkah (Figure 3) range from 82 to 982 meters above sea level (Mirza et al., 2011).
TS07D - GIS Applications, 5479 Khalid AL-GHAMDI, Meraj MIRZA, , Ramze ELZAHRANY, and Gomaa DAWOD. GIS Evaluation of Urban Growth and Flood Hazards: A Case Study of Makkah City, Saudi Arabia
FIG Working Week 2012 Knowing to manage the territory, protect the environment, evaluate the cultural heritage Rome, Italy, 6-10 May 2012
5/24
0
50
100
150
200
250
300
350
1966
1968
1970
1972
1974
1976
1978
1980
1982
1984
1986
1988
1990
1992
1994
1996
1998
2000
2002
2004
2006
2008
2010
Year
An
nu
al R
ain
(mm
)
Figure 2: Annual Rains in Makkah city from 1966 to 2010
Figure 3: Elevations of Makkah city

TS07D - GIS Applications, 5479 Khalid AL-GHAMDI, Meraj MIRZA, , Ramze ELZAHRANY, and Gomaa DAWOD. GIS Evaluation of Urban Growth and Flood Hazards: A Case Study of Makkah City, Saudi Arabia
FIG Working Week 2012 Knowing to manage the territory, protect the environment, evaluate the cultural heritage Rome, Italy, 6-10 May 2012
6/24
3. DATA AND METHODOLOGY The spatial compiled datasets constitute of three categories. The first element is a topographic map of Makkah city in 1947. The second group consists of 105 cadastral maps in AutoCAD file format for 1990. The third constituent consists of a land use map developed by the Saudi geological survey authority dated 2010. Additionally, a national 5-meter resolution Digital Elevation Model (DEM) for the study area has been obtained from King Abdulaziz City of Sciences and Technology (KACST). The Arc GIS software (v. 10), along with the Arc Hydro extension, has been used in the present study to combine all obtainable data in a unique environment, and to delineate the main hydrological basins, and their associated sub-basins, in the study area. The processing phase includes (Fig. 4): rectifying the printed maps, digitizing two shapefile for residential areas and roads for each dataset, converting AutoCAD files to GIS shapefiles, unifying the spatial reference frames for all datasets, performing statistical and spatial analysis; and flood estimation. The term 4D GIS in Fig. 4 indicates the integration and utilization of 3D spatial datasets for several time intervals in a unique GIS environment. Regarding flood estimation, the NRCS, formerly known as the Soil Conservation Service (SCS), has been selected in this research study since it might be considered the most widely-utilized flood modelling methodology. It utilizes geological information to assign a unique Curve Number (CN) coefficient value for each area, that will be further used to estimate the surface runoff depth and the peak discharge magnitude. The NRCS method is quit utilized in engineering design and flood management projects (e.g. Masoud, 2011, Al-Jabari et al., 2009; Adebayo et al., 2009; Elaji, 2010; Xianzhao and Jiazhu, 2008; and Gul et al., 2009), and particularly in USA (e.g. US ACE, 2004; and US DoT, 2002). The basic formulas of the NRCS approach are (e.g. US NRCS, 1986): Q = ( P – 0.2 S )2 / ( P + 0.8 S) (1) where, Q = depth of direct runoff (mm) P = depth of precipitation for a specific return period (mm) S = maximum potential retention (mm): S = 25.4 ( (1000 / CN ) – 10 ) (2) where CN is the curve number. Tables provide values of CN are presented in several hydraulic literatures (e.g., Sen 2008b, pp. 165). Table 1 presents some of these CN values. qp = qu A Q (3) where, qp = peak discharge (m3/s) A = drainage area (km2)

TS07D - GIS Applications, 5479 Khalid AL-GHAMDI, Meraj MIRZA, , Ramze ELZAHRANY, and Gomaa DAWOD. GIS Evaluation of Urban Growth and Flood Hazards: A Case Study of Makkah City, Saudi Arabia
FIG Working Week 2012 Knowing to manage the territory, protect the environment, evaluate the cultural heritage Rome, Italy, 6-10 May 2012
7/24
Q = depth of runoff (mm) qu = unit peak discharge (m3/s/km2/mm) that can be interpolated from a specific charts (e.g.
US NRCS, 1986) or computed from corresponding tables (e.g. US DoT 2002, pp. 5-28).
QT = Q A (4) where QT = Flood volume (m3)
Table 1: Examples of runoff CN values
Cover Type Hydrological Soil Types
A B C D Fully developed urban areas (vegetation established): - Good condition; grass cover on 75% or more of the area - Fair condition; grass cover on 50% to 75% of the area - Poor condition; grass cover on 50% or less of the area
39 49 68
61 69 79
74 79 86
80 84 89
Streets and Roads: - Paved with curbs and storm sewers (excl. right-of-way) - Gravel (incl. right-of-way)
98 76
98 85
98 89
98 91
Industrial districts (72% average impervious) 81 88 91 93 Commercial and business areas (85% average impervious) 89 92 94 95 Where: Group A soils have low runoff potential and high infiltration rates even when thoroughly wetted, Group B soils have moderate infiltration rates when thoroughly wetted, Group C soils have low infiltration rates when thoroughly wetted, Group D soils have high runoff potential and low infiltration rates when thoroughly wetted.
after US NRCS 1986. Simply, the flood processing stage starts by assigning a CN value for each sub-basin based on its geological, soil, and land use properties. Then the maximum potential retention, S, is computed through eq. 2. The value of the depth of precipitation, P in eq. 1, is obtained through the Pearson Log III statistical analysis of the rainfall dataset for a specific return period (e.g., 50 years in the current study). The depth of runoff, Q in eq. 1, can then be computed. Next, the unit peak discharge, qu, being computed or interpolated from the corresponding specific diagrams. Finally, the peak discharge, qp, is evaluated through eq. 3, and the total flood volume for each sub-basin, QT, is obtained from eq. 4.

TS07D - GIS Applications, 5479 Khalid AL-GHAMDI, Meraj MIRZA, , Ramze ELZAHRANY, and Gomaa DAWOD. GIS Evaluation of Urban Growth and Flood Hazards: A Case Study of Makkah City, Saudi Arabia
FIG Working Week 2012 Knowing to manage the territory, protect the environment, evaluate the cultural heritage Rome, Italy, 6-10 May 2012
8/24
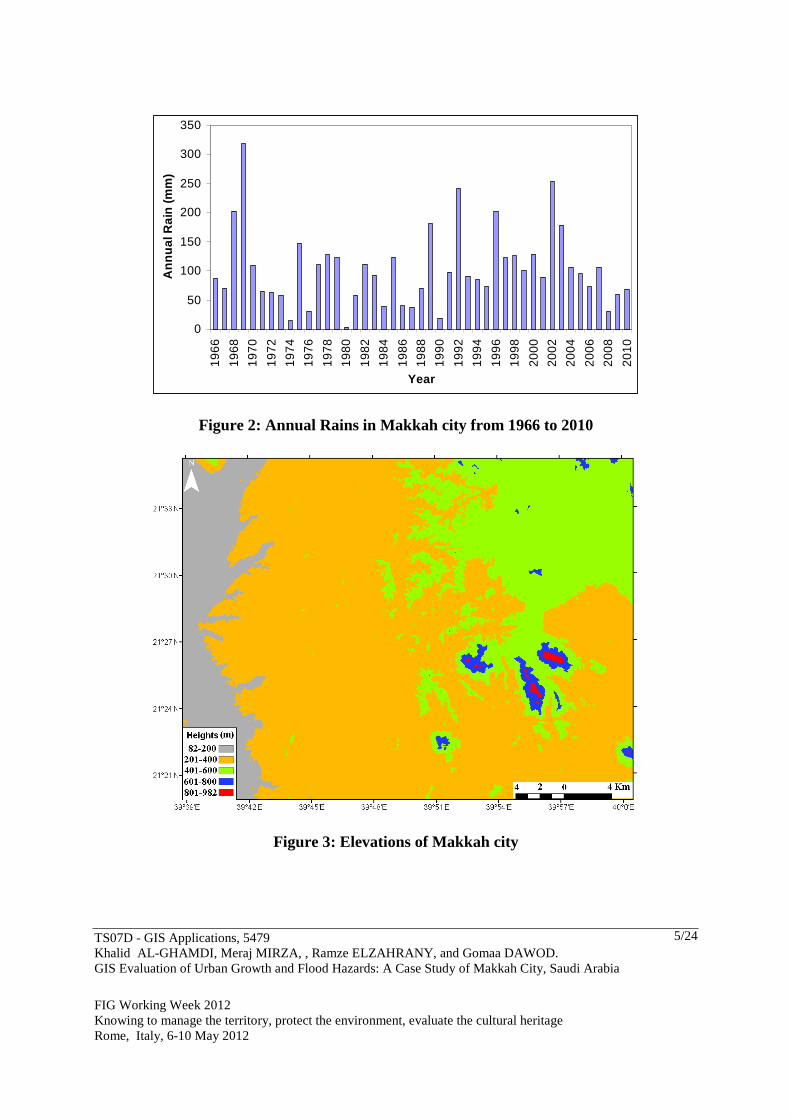
Figure 4: Processing Workflow 4. RESULTS AND DISCUSSION The attained results may be divided into two main groups: (1) results related to urban growth; and (2) results related to flood hazards. For the first results' category, shapefiles of Makkah metropolitan area for 1947, 1990, and 2010 have been integrated in a GIS project (Fig. 5). The total residential area has been computed and found to be 5.168, 99.234, and 158.583 square kilometers for 1947, 1990, and 2010 respectively. Thus, the residential areas in Makkah city have been grown by about 1820% between 1947 and 1990 (with 42% annual rate), and by about 97 % from 1990 to 2010 (with 4.8 % annual rate). The most important reason behind the huge urban sprawl in mid 20th century might be the enormous national income expansion due to the oil exploration in the Gulf region. That economical enlargement caused an urban development revolution not just in Makkah city but almost in all towns within Saudi Arabia. Secondly, the official planning rules and governmental authority have been started in 1955 in order to regulate the urban development of Makkah city (HAMDD 2004).
TS07D - GIS Applications, 5479 Khalid AL-GHAMDI, Meraj MIRZA, , Ramze ELZAHRANY, and Gomaa DAWOD. GIS Evaluation of Urban Growth and Flood Hazards: A Case Study of Makkah City, Saudi Arabia
FIG Working Week 2012 Knowing to manage the territory, protect the environment, evaluate the cultural heritage Rome, Italy, 6-10 May 2012
9/24
Figure 5: Urban Sprawl of Makkah City It can be realized from figure 5 that the urban growth in Makkah city takes a radial (or spoke) pattern. That is logically understood knowing that the holly mosque is considered the center of the city, and the central area around it has the highest population density since residents and pilgrims prefer to stay close to this holly mosque. Applying GIS spatial analysis tools produces more valuable pieces of information. The directional distribution tool supplies precious information about the spatial directional trend of the urban spread out. Directional distribution, or standard deviational ellipse, has been carried out for the three urban development stages of Makkah city (Fig. 6). Although a directional ellipse by itself gives a static perspective about the residential areas at a specific time, comparing several ellipses may give an idea about the changes took place over a time interval. The idea, herein, is that the changes occurred in the ellipses' orientation may portrait, to some extent, the variations of the residential areas' expansion or growth directions. From figure 6, it can be noticed that the azimuth of the major axes of the ellipse, in a clockwise from the North direction, has been found to be 35o, 31o, and 148o for 1947, 1990, and 2010 respectively. Therefore, the urban growth in both 1947 and 1990 took the north-east and south-west directions, while it took the north-west and south-east directions in 2010. So, such results conclude that the growth general direction has been relatively fixed between 1947 and 1990, while it has been significantly changed between 1990 and 2010.

TS07D - GIS Applications, 5479 Khalid AL-GHAMDI, Meraj MIRZA, , Ramze ELZAHRANY, and Gomaa DAWOD. GIS Evaluation of Urban Growth and Flood Hazards: A Case Study of Makkah City, Saudi Arabia
FIG Working Week 2012 Knowing to manage the territory, protect the environment, evaluate the cultural heritage Rome, Italy, 6-10 May 2012
10/24
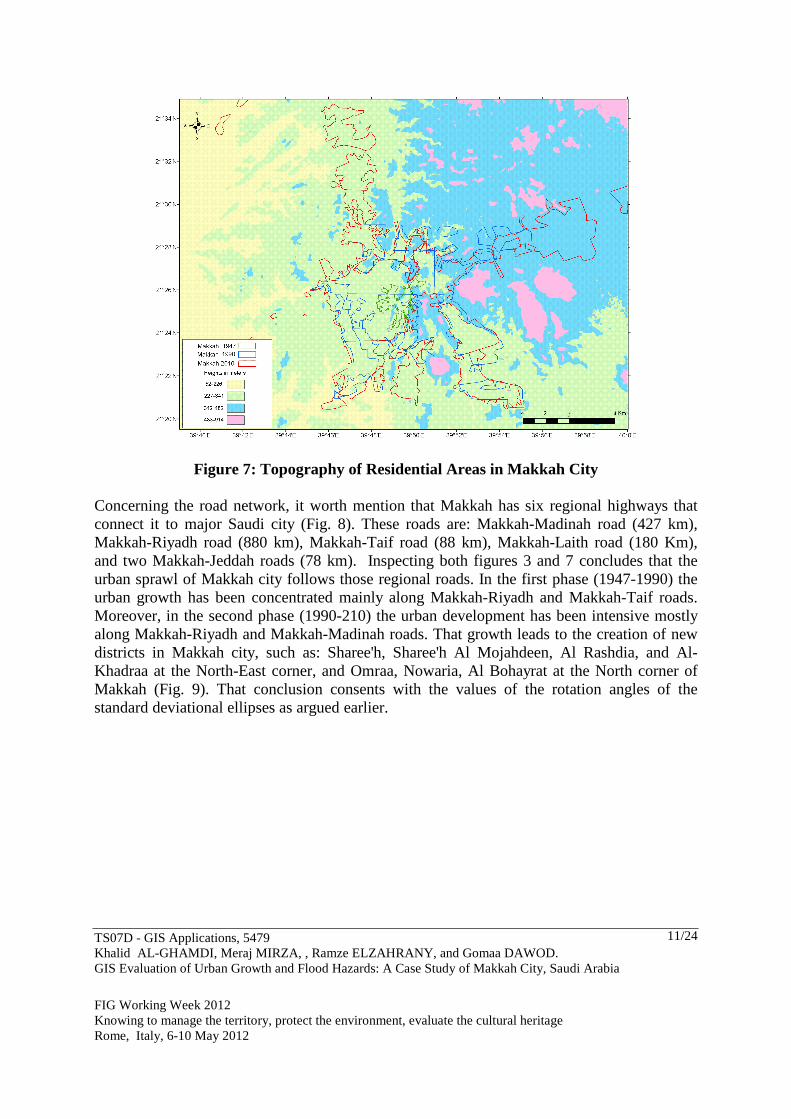
Figure 6: Standard Deviational Ellipses of Urban Sprawl of Makkah City The available national 5-meter resolution DEM describes the rigid topography of Makkah metropolitan area. Several mountainous areas exist within Makkah city, and affect the spatial urban growth location and direction. Figure 7 depicts the topography of Makkah as divided into four categories. It can be seen that the urban sprawl mainly exist in low- and moderate-elevation regions. The growth spreads out along the valleys and stays away from the mountainous areas for economical reasons. It worth mentioning that almost 50% of Makkah's geology contains igneous rocks, mainly granite, that massively increase the development costs in mountainous areas.
TS07D - GIS Applications, 5479 Khalid AL-GHAMDI, Meraj MIRZA, , Ramze ELZAHRANY, and Gomaa DAWOD. GIS Evaluation of Urban Growth and Flood Hazards: A Case Study of Makkah City, Saudi Arabia
FIG Working Week 2012 Knowing to manage the territory, protect the environment, evaluate the cultural heritage Rome, Italy, 6-10 May 2012
11/24
Figure 7: Topography of Residential Areas in Makkah City Concerning the road network, it worth mention that Makkah has six regional highways that connect it to major Saudi city (Fig. 8). These roads are: Makkah-Madinah road (427 km), Makkah-Riyadh road (880 km), Makkah-Taif road (88 km), Makkah-Laith road (180 Km), and two Makkah-Jeddah roads (78 km). Inspecting both figures 3 and 7 concludes that the urban sprawl of Makkah city follows those regional roads. In the first phase (1947-1990) the urban growth has been concentrated mainly along Makkah-Riyadh and Makkah-Taif roads. Moreover, in the second phase (1990-210) the urban development has been intensive mostly along Makkah-Riyadh and Makkah-Madinah roads. That growth leads to the creation of new districts in Makkah city, such as: Sharee'h, Sharee'h Al Mojahdeen, Al Rashdia, and Al-Khadraa at the North-East corner, and Omraa, Nowaria, Al Bohayrat at the North corner of Makkah (Fig. 9). That conclusion consents with the values of the rotation angles of the standard deviational ellipses as argued earlier.

TS07D - GIS Applications, 5479 Khalid AL-GHAMDI, Meraj MIRZA, , Ramze ELZAHRANY, and Gomaa DAWOD. GIS Evaluation of Urban Growth and Flood Hazards: A Case Study of Makkah City, Saudi Arabia
FIG Working Week 2012 Knowing to manage the territory, protect the environment, evaluate the cultural heritage Rome, Italy, 6-10 May 2012
12/24
Figure 8: Main Roads in Makkah City
Figure 9: New Districts Within Makkah City

TS07D - GIS Applications, 5479 Khalid AL-GHAMDI, Meraj MIRZA, , Ramze ELZAHRANY, and Gomaa DAWOD. GIS Evaluation of Urban Growth and Flood Hazards: A Case Study of Makkah City, Saudi Arabia
FIG Working Week 2012 Knowing to manage the territory, protect the environment, evaluate the cultural heritage Rome, Italy, 6-10 May 2012
13/24
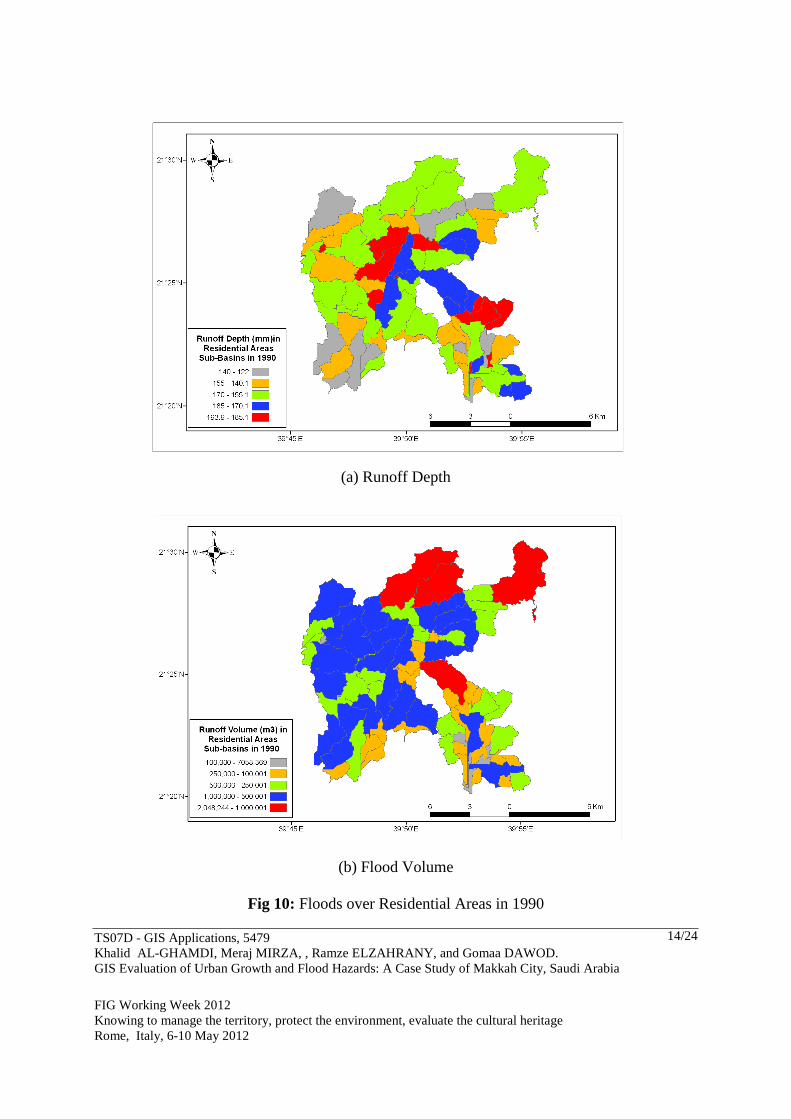
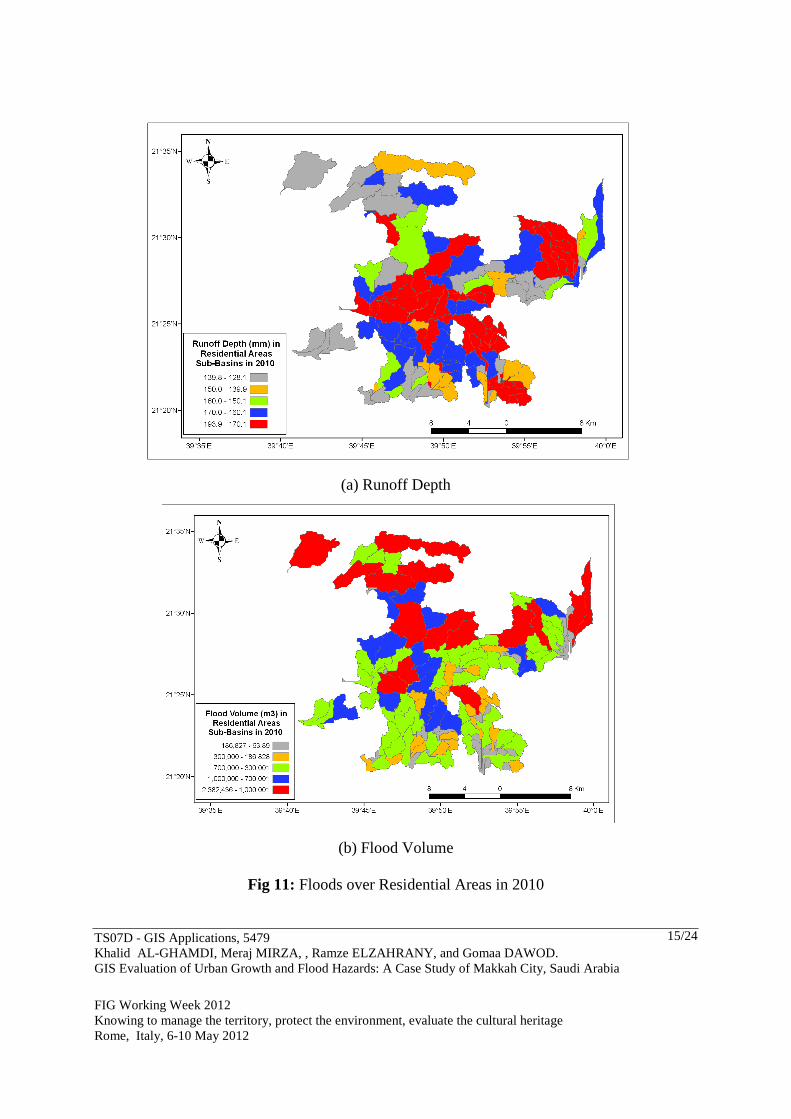
The second category of accomplished results deal with the estimation of flood hazards in Makkah city. The NRCS method has been performed for the available data of Makkah metropolitan area to compute the peak discharge value for the six basins for 1990 and 2010 datasets. The return period has been chosen, herein, as 50 years, for which the rainfall intensity (P in equation 1) has been estimated, by applying the Log Pearson III statistical analysis, as 200 mm/hour (Dawod et al., 2011). Table 2 presents statistics of the attained flood parameters, over residential areas, for 1990 and 2010. The runoff depth and the total flood volumes have been computed on the sub-basin scale, only for those sub-basins contain residential areas (Fig. 10). Twenty-five sub-basins that include residential areas, in 1990, have been identified within the study area. The area of these sub-basins range from 0.478 to 10.663 square kilometers, with a sum of 71.587 square kilometers. The flood volumes of these sub-basins have been estimated (equation 4) for 1990 and found to vary from 79.6 to 1809.7 thousands cubic meters with a total of 11849.9 thousands cubic meters. Then, utilization of the 2010 datasets revealed that there are 64 sub-basins that include residential areas (Fig. 11). The area of these sub-basins range from 0.223 to 18.569 square kilometers, with a sum of 157.564 square kilometers. The flood volumes of these sub-basins have been estimated for 2010 and found to vary from 45.5 to 2928.7 thousands cubic meters with a total of 41282.1 thousands cubic meters.
Table 2: Statistics of floods over residential areas in 1990 and 2010
Item 1990 2010 Number of sub-basins contain residential areas 25 64 Total area of residential areas (km2) 80.021 157.564 Minimum flood volumes (m3) 79,623 45,487 Maximum flood volumes (m3) 1,809,701 2,928,694 Total flood volumes (m3) 11,849,980 41,282,085
TS07D - GIS Applications, 5479 Khalid AL-GHAMDI, Meraj MIRZA, , Ramze ELZAHRANY, and Gomaa DAWOD. GIS Evaluation of Urban Growth and Flood Hazards: A Case Study of Makkah City, Saudi Arabia
FIG Working Week 2012 Knowing to manage the territory, protect the environment, evaluate the cultural heritage Rome, Italy, 6-10 May 2012
14/24
(a) Runoff Depth
(b) Flood Volume
Fig 10: Floods over Residential Areas in 1990
TS07D - GIS Applications, 5479 Khalid AL-GHAMDI, Meraj MIRZA, , Ramze ELZAHRANY, and Gomaa DAWOD. GIS Evaluation of Urban Growth and Flood Hazards: A Case Study of Makkah City, Saudi Arabia
FIG Working Week 2012 Knowing to manage the territory, protect the environment, evaluate the cultural heritage Rome, Italy, 6-10 May 2012
15/24
(a) Runoff Depth
(b) Flood Volume
Fig 11: Floods over Residential Areas in 2010

TS07D - GIS Applications, 5479 Khalid AL-GHAMDI, Meraj MIRZA, , Ramze ELZAHRANY, and Gomaa DAWOD. GIS Evaluation of Urban Growth and Flood Hazards: A Case Study of Makkah City, Saudi Arabia
FIG Working Week 2012 Knowing to manage the territory, protect the environment, evaluate the cultural heritage Rome, Italy, 6-10 May 2012
16/24
Comparing the results of flood estimation for both 1990 and 2010 reveals critical points. First, the residential areas of Makkah city have been increased, over twenty years, from 80.0 to 157.6 km2, with 197% increase (with an annual rate of 9.8%). Second, the total flood volumes, of the entire study area, have been increased from 11.8 to 41.3 million cubic meters, i.e. 248%. The spatial distribution of the new residential areas (built between 1990 and 2010) is depicted in figure 12. It can be seen that there are several new areas, particularly in the north of Makkah city, located in high-flood sub-basins. Furthermore, it has been found that most of the new residential areas have been established on sediment soils (Figure 13). From an economical point of view, that geological type is cost-effective than constructing building on solid igneous rock geology. However, that urbanization significantly decreases the permeability of the soil and, thus, leads to a crucial increase in hazardous water surface runoff. For example, the curve number (CN in equation 2) of sediment geology type equals 76 while it equals 98 for paved residential areas (e.g. Sen 2008b, and US NRCS 1986). These two factors might be the major reasons resulted in that sever augmentation of flood volume in Makkah metropolitan area.

TS07D - GIS Applications, 5479 Khalid AL-GHAMDI, Meraj MIRZA, , Ramze ELZAHRANY, and Gomaa DAWOD. GIS Evaluation of Urban Growth and Flood Hazards: A Case Study of Makkah City, Saudi Arabia
FIG Working Week 2012 Knowing to manage the territory, protect the environment, evaluate the cultural heritage Rome, Italy, 6-10 May 2012
17/24
(a) Runoff Depth
(b) Flood Volume
Fig 12: Floods over New Residential Areas

TS07D - GIS Applications, 5479 Khalid AL-GHAMDI, Meraj MIRZA, , Ramze ELZAHRANY, and Gomaa DAWOD. GIS Evaluation of Urban Growth and Flood Hazards: A Case Study of Makkah City, Saudi Arabia
FIG Working Week 2012 Knowing to manage the territory, protect the environment, evaluate the cultural heritage Rome, Italy, 6-10 May 2012
18/24
Fig 13: Geology of New Residential Areas 5. CONCLUSIONS The urban sprawl is one of the human-induced potential threats to sustainable development where urban planning, with effective resource utilization and allocation, is a crucial concern. Thus, identification and analysis of the patterns of sprawl would help in effective land-use planning in an urban area. In the current study, a four-dimensional GIS has been developed to analyze and quantify the urban growth of Makkah city in the last sixty years. Makkah has witnessed a huge urban sprawl in mid 20th century, that might be due the enormous national income expansion due to the oil exploration in the Gulf region. That economical growth commenced an urban development revolution for almost all towns within Saudi Arabia. Also, it has been found that the urban growth in Makkah city takes a radial pattern, which is logically understood knowing that the holly mosque is considered the center of the city, and the central area around it has the highest population intensity since residents and pilgrims prefer to stay close to this mosque. In the context of 4D GIS, it worth mentioning that GIS presents a valuable tool for developing 4D cadastre for land use and real estate of a city (Van Oosterom et al., 2006). Such a project is currently proposed for Makkah city, and can be linked to the GIS-based flood modelling developed in this research. Applying GIS spatial analysis tools produces more valuable pieces of information. The azimuth of the major axes of the standard deviational ellipse has been found to be 35o, 31o, and 148o for 1947, 1990, and 2010 respectively. Therefore, the urban growth in both 1947 and 1990 took the north-east and south-west directions, while it took the north-west and south-east
TS07D - GIS Applications, 5479 Khalid AL-GHAMDI, Meraj MIRZA, , Ramze ELZAHRANY, and Gomaa DAWOD. GIS Evaluation of Urban Growth and Flood Hazards: A Case Study of Makkah City, Saudi Arabia
FIG Working Week 2012 Knowing to manage the territory, protect the environment, evaluate the cultural heritage Rome, Italy, 6-10 May 2012
19/24
directions in 2010. Furthermore, inspecting the topography of Makkah city concluded that the urban sprawl mainly exist in low- and moderate-elevation regions. The growth spreads out along the valleys and avoid the mountainous areas for economical reasons. Moreover, it is concluded that the urban sprawl of Makkah city follows regional roads. In the first phase (1947-1990) the urban growth has been concentrated mainly along Makkah-Riyadh and Makkah-Taif roads. However, in the second phase (1990-210) the urban development has been intensive mostly along Makkah- Riyadh and Makkah-Madinah roads. Furthermore, accomplished results showed that the residential regions of Makkah city have been increased by 197%, while the total flood volumes have been enlarged by 248%. Two factors might be considered possible reasons led to that significant flood hazard raising. First, establishment of new residential areas in regions that already posse high flood impacts. Second, building up new suburban areas on sediment soil significantly decreases the permeability of the soil and, thus, leads to a crucial increase in hazardous water surface runoff. It is concluded that the utilization of GIS in urban growth and flood hazard estimation researches is quit powerful and provides an effective technical tool that helps in analyzing and understanding such phenomena. It is recommended that the attained results should be taken into account by decision-makers in implementing new development planning of Makkah metropolitan area. ACKNOWLEDGMENT The authors would like to acknowledge the financial support offered by the Center of Research Excellence in Hajj and Omrah, Umm Al-Qura university, Saudi Arabia (Project PR12/2011). REFERENCES Abd-Allah, M., 2007, Modelling urban dynamics using geographic information systems,
remote sensing and urban growth models, PhD Dissertation, Faculty of Engineering, Cairo university, Cairo, Egypt.
Al-Ahmadia, K., Heppenstallb, A., Seeb, L., and Hoggb, J., 2008, Modeling urban growth dynamics using cellular automata and GIS, Proceedings of the Third National GIS Symposium in Saudi Arabia, April 7 – 9, Al-Khobar, Saudi Arabia.
Alabi, M., 2009, Urban sprawl, pattern and measurement in Lokoja, Nigeria, Theoretical and Empirical Researches in Urban Management. 13(4) 158-164.
Al-Jabari S., Abu Sharakh M., and Al-Mimi Z., 2009, Estimation of runoff for agricultural watershed using SCS curve number and GIS, Proceedings of the thirteenth International Water Technology Conference, Hurghada, Egypt, 1213-1229.
Al-Otaibi, Y., Belaid, M., and Abdu, A, 2006, Impact assessment of human activities on coastal zones of eastern Saudi Arabia using remote sensing and geographic information systems techniques, Proceedings of the ISPRS Commission 7's workshop on Remote Sensing, May 8-11, Enschede, the Netherlands.
Al Saud, M., 2010, Mapping potential areas for groundwater storage in Wadi Aurnah Basin, western Arabian Peninsula, using remote sensing and geographic information system

TS07D - GIS Applications, 5479 Khalid AL-GHAMDI, Meraj MIRZA, , Ramze ELZAHRANY, and Gomaa DAWOD. GIS Evaluation of Urban Growth and Flood Hazards: A Case Study of Makkah City, Saudi Arabia
FIG Working Week 2012 Knowing to manage the territory, protect the environment, evaluate the cultural heritage Rome, Italy, 6-10 May 2012
20/24
techniques, Hydrogeology Journal, Published on-line April 13, DOI 10.1007/s10040-010-0598-9.
AlSultan, S., Lim, J., MatJafri, M., Abdullah, K. and Saleh, N., 2008, Innovative satellite image map of Alkhabrta area, Saudi Arabia using high resolution image, Proceedings of the ISPRS XXIst Congress. July 3-11. Beijing, China, Part B7, pp. 1355-1358.
Adebayo W., Solomon O., Ayanniyi M. and Sikiru, F., 2009, Evaluation of synthetic unit hydrograph methods for the development of design storm hydrographs for Rivers in South-West, Nigeria, Journal of American Science, (5)4: 23-32.
Amini, A., Ali, T., Ghazali, A., Aziz, A., and Akib, S., 2011, Impacts of Land-Use Change on stream flows in the Damansara Watershed, Malaysia, Arabian Journal Sciences and Engineering, 36:713–720.
Basawaraja, R., Chari, K., Mise, S., and Chetti, S., 2011, Analysis of the impact of urban sprawl in altering the land-use, land-cover pattern of Raichur City, India, using geospatial technologies, Journal of Geography and Regional Planning, 4(8) 455-462.
Belaid, M., 2003, Urban-rural land use change detection and analysis using GIS and RS technologies, Proceedings of the 2nd FIG regional conference, December 2-5, Marrakech, Morocco.
Dawod, G., Mirza, M., and Al-Ghamdi, K., 2011, GIS-based spatial mapping of flash flood hazards in Makkah city, Saudi Arabia, Journal of Geographic Information System, 3(3) 217-223.
Dawod, G., and Koshak, N., 2011, Developing GIS-Based Unit Hydrographs for Flood Management in Makkah Metropolitan Area, Saudi Arabia, Journal of Geographic Information System, 3(2) 153-159.
El-Hames, A. Al-Ahmadi, M. and Al-Amri, N., 2011, A GIS approach for the assessment of groundwater quality in Wadi Rabigh aquifer, Saudi Arabia, Environmental Earth Science, (63) 1319–1331.
Elaji A., 2010, Applications of Geographic Information Systems to construct databases of morphometric characteristics and their hydrologic meanings in Yalamlam basin (in Arabic), MSC thesis, Umm Al-Qura university, Makkah, Saudi Arabia.
Elzahrany, R., 2007, The geographical distribution of population and houses in provinces of the Kingdom of Saudi Arabia, 1425(2004), (in Arabic), Umm Al-Qura university's Journal of Social Sciences, 19(1) 12-66.
Feng, L., 2009, Applying remote sensing and GIS on monitoring and measuring urban sprawl. A case study of China, Revista Internacional de Sostenibilisas, Tecnologia y Humanismo, (4) 47-56.
Fernandez D. and Lutz M., 2010, Urban flood hazard zoning in Tucumán Province, Argentina, using GIS and multicriteria decision analysis, Engineering Geology, 111:90–98
Gul G., Harmancıoglu N., and Gul A., 2009, A combined hydrologic and hydraulic modeling approach for testing efficiency of structural flood control measures, Journal of Natural Hazards, DOI 10.1007/s11069-009-9464-2.
Hagen E., Shroder J., Lu X. and Teufert, J., 2011, Reverse engineered flood hazard mapping in Afghanistan: A parsimonious flood map model for developing countries, Quaternary International, 226:82–91.
TS07D - GIS Applications, 5479 Khalid AL-GHAMDI, Meraj MIRZA, , Ramze ELZAHRANY, and Gomaa DAWOD. GIS Evaluation of Urban Growth and Flood Hazards: A Case Study of Makkah City, Saudi Arabia
FIG Working Week 2012 Knowing to manage the territory, protect the environment, evaluate the cultural heritage Rome, Italy, 6-10 May 2012
21/24
HAMDD (Higher Authority for Makkah District Development), 2004, Master planning of Makkah city till 2028, Technical report (in Arabic), Makkah. Saudi Arabia.
He, M. and Hogue, T., 2011, Integrating hydrologic modeling and land use projections for evaluation of hydrologic response and regional water supply impacts in semi-arid environments, Environmental Earth Science, DOI 10.1007/s12665-011-1144-3.
Hegde, N., MuraliKrishna, I., and ChalapatiRao, K., 2008, Integration of cellular automata and GIS for simulating land use changes, Proceedings of the ISPRS 5th International Symposium, June 13-15, Enschede, The Netherlands.
Koshak, N., 2006, Developing a web-based GIS for Hajj traffic plan, Journal of Urban Planning Research, Cairo University, 6(6) 1-13.
Li, C., Hongbo, L., and Kemper, G., 2008, Monitoring urban development of small Chinese cities using innovative aerial surveying technologies, Proceedings of the ISPRS XXIst Congress, July 3-11. Beijing, China, Part B7, pp. 1667-1674.
Mishra, M., Mishra, K., Subudhi, A., and Phil, M., 2011, Urban sprawl mapping and land use change analysis using remote sensing and GIS: Case study of bhubaneswar city, orissa, Proceedings of the Geo-Spatial World Forum, January 18-21, Hyderabad, India.
Masoud A., 2011, Runoff modeling of the wadi systems for estimating flash flood and groundwater recharge potential in Southern Sinai, Egypt, Arab Journal of Geosciences, 4:785–801.
Merwade, V., Cook, A., and Coonrod, J., 2008, GIS techniques for creating river terrain models for hydrodynamic modeling and flood inundation mapping, Environmental Modelling and Software, 23:1300–1311.
Mirza M., Dawod G., and Al-Ghamdi K., 2011, Accuracy and relevance of digital elevation models for geomatics applications - A case study of Makkah municipality, Saudi Arabia, International Journal of Geomatics and Geosciences, (1)4:803-812.
Park J., and Hur Y., 2011, Development and application of GIS based K-DRUM for flood runoff simulation using radar rainfall, Journal of Hydro-environment Research, doi:10.1016/j.jher.2011.05.005.
Qi H. and Altinakar M., 2011, A GIS-based decision support system for integrated flood management under uncertainty with two dimensional numerical simulations, Environmental Modelling and Software, 26:817-821.
Saravanan, P. and Ilangovan, P., 2010, Identification of urban sprawl pattern for Madurai region using GIS, International Journal of Geomatics and Geosciences, 1(2) 141-149.
Sagala S., 2006, Analysis of flood physical vulnerability in residential areas, Case study: Naga city, the Philippines, Master thesis, International Institute for Geo-information Science and Earth Observation, The Netherlands.
Sen Z., 2008a, Modified hydrograph method for arid regions, Hydrological Process. 22:356–365.
Sen Z., 2008b, Wadi Hydrology, CRC Press. Su, S. Xiao, R. and Zhang, Y., 2011, Multi-scale analysis of spatially varying relationships
between agricultural landscape patterns and urbanization using geographically weighted regression, Applied Geography, (32) 360-375.
Subyani, A., Qari, M., and Matsah, M., 2010, Digital elevation model and multivariate statistical analysis of morphometric parameters of some wadis, western Saudi Arabia,

TS07D - GIS Applications, 5479 Khalid AL-GHAMDI, Meraj MIRZA, , Ramze ELZAHRANY, and Gomaa DAWOD. GIS Evaluation of Urban Growth and Flood Hazards: A Case Study of Makkah City, Saudi Arabia
FIG Working Week 2012 Knowing to manage the territory, protect the environment, evaluate the cultural heritage Rome, Italy, 6-10 May 2012
22/24
Arabian Journal of Geosciences, DOI 10.1007/s12517-010-0149-7, Published online May 11.
US ACE (US Army Corps of Engineers), 2004, Physical stream assessment. US DoT (US Department of Transportation), 2002, Highway hydrology manual, Publication
No. FHWA-02-001. US NRCS (US National Resources Conservation Services), 1986, Urban hydrology for small
watersheds, Technical Manual TR55. Van Oosterom, P., Ploeger, H., Stoter, J., Thompson, R., and Lemmen, C., 2006, Aspects of a
4D cadastre: A First exploration, XXIII FIG Congress, Munich, Germany, October 8-13.
Vinet, F., 2008, Geographical analysis of damage due to flash floods in southern France: The cases of 12–13 November 1999 and 8–9 September 2002, Applied Geography 28:323–336.
Xianzhao L. and Jiazhu L., 2008, Application of SCS model in estimation of runoff from small watershed in Loess plateau of China, Journal of Chinese Geographical Science, (18)3:235–241.
Yi, C., Lee, J., and Shim, M., 2010, GIS-based distributed technique for assessing economic loss from flood damage: pre-feasibility study for the Anyang Stream Basin in Korea, Natural Hazards, 55:251–272.
Zhang, X., Tong, X., and Liu, M., 2008, Genetic algorithm optimized neutral network classification and overlapping pixel change detection based on remote sensing for urban sprawl: a case study in Jiading district of Shanghai, China, Proceedings of the ISPRS XXIst Congress, July 3-11, Beijing, China.
Zheng, Z. and Qi, S., 2011, Potential flood hazard due to urban expansion in the karst mountainous region of North China, Regional Environmental Change. 11:439–440.
Wang, C., Wan, T., and Palmer, I., 2010, Urban flood risk analysis for determining optimal flood protection levels based on digital terrain model and flood spreading model, Vis Comput, 26: 1369–1381.
TS07D - GIS Applications, 5479 Khalid AL-GHAMDI, Meraj MIRZA, , Ramze ELZAHRANY, and Gomaa DAWOD. GIS Evaluation of Urban Growth and Flood Hazards: A Case Study of Makkah City, Saudi Arabia
FIG Working Week 2012 Knowing to manage the territory, protect the environment, evaluate the cultural heritage Rome, Italy, 6-10 May 2012
23/24
BIOGRAPHICAL NOTES Khalid A. Al-Ghamdi received his Master degree from Clark University, Worcester, Massachusetts, USA in 2002, and his Ph.D. from University of Fribourg, Fribourg, Switzerland in 2008. Since 1993, he is affiliated with Umm Al-Qura university, Makkah city, Saudi Arabia. Since 2009, he is the supervisor of the GIS/Remote Sensing unit in Umm Al-Qura university. He has taught several geomatics courses, and has attended many scientific conferences in KSA and abroad. Currently, he is the chairperson of the geography department in Umm Al-Qura university, Saudi Arabia. Meraj N. Mirza received his Master degree from the Michigan University, USA in 1979 and his Ph.D. from Khartoum University, Sudan in 1995. Since 1975, he is affiliated with Umm Al-Qura university, Makkah city, Saudi Arabia. In 1997, he was one of the initiators of the GIS/Remote Sensing unit in Umm Al-Qura university, which is the pioneer GIS unit in Saudi universities. He is also an active associate of the Center of Research Excellence in Hajj and Omrah (Hajjcore), Umm Al-Qura university. Currently, he is a visiting professor at center of GIS in Harvard university, USA. Ramze A. Elzahrany received his Master degree from the Eastern Michigan University, USA in 1983 and his Ph.D. from Kent State University, Ohio, USA in 1989. He works, now, as a professor of human geography in the geography department, Umm Al-Qura university, Saudi Arabia. Additionally, he is a member of Umm Al-Qura university's scientific council, and a member of the editorial board of Umm Al-Qura university's journal of social sciences, and a member of the editorial board of the Arabian journal of Geographical Information Systems, the Saudi geographical society. Furthermore, he published more than twenty nine papers; mainly in Arabic and few in English. Gomaa M. Dawod received his Master of Geodetic Science and Surveying from the Ohio State University, Columbus, Ohio, USA in 1991 and his Ph.D. of Surveying Engineering from Shobra Faculty of Engineering, Zagazig University, Egypt in 1998. Since 1987, he is affiliated with the Survey Research Institute (SRI), the National Water Research Center (NWRC), Egypt, mainly in the field of Geodesy. Since 2005, he is affiliated with Umm Al-Qura university, Makkah city, Saudi Arabia. Dr. Dawod published more than forty papers related to GPS and GIS. Additionally, he has been chosen in the 2011-2012 edition of Who is Who encyclopedia in engineering and sciences.

TS07D - GIS Applications, 5479 Khalid AL-GHAMDI, Meraj MIRZA, , Ramze ELZAHRANY, and Gomaa DAWOD. GIS Evaluation of Urban Growth and Flood Hazards: A Case Study of Makkah City, Saudi Arabia
FIG Working Week 2012 Knowing to manage the territory, protect the environment, evaluate the cultural heritage Rome, Italy, 6-10 May 2012
24/24
CONTACTS Khalid Abdel-Rahman Al-Ghamdi Geography department, Umm Al-Qura University P. O. Box 138474, Jeddah 21323, Saudi Arabia Tel. +966541740090 Fax. +96625534113 Email: [email protected] and [email protected] Web site: http://www.uqu.edu.sa/kaghamdi Meraj Nawab Mirza Centre of Research Excellence in Hajj and Omrah (Hajjcore), Umm Al-Qura University, P.O. Box 6247, Makkah 21955, Saudi Arabia Tel. +966505509935 Fax. +96625571561 Email: [email protected] and [email protected] Web site: http://www.mmirza.com Ramze Ahmed Elzahrany Geography department, Umm Al-Qura University P.O. Box 715, Makkah 21955, Saudi Arabia Tel. +966555510613 Fax. +96625534113 Email: [email protected] and [email protected] Web site: http://www.uqu.edu.sa/raelzahrany Gomaa Mohamed Dawod Geography department, Umm Al-Qura University P.O. Box 715, Makkah 21955, Saudi Arabia Tel. +966551402093 Fax. +96625534113 Email: [email protected] and [email protected] Web site: http://www.uqu.edu.sa/gmmahmoud