Giant oil field decline rates and their influence on world ...
23
1 Published in Energy Policy Volume 37, Issue 6, June 2009, Pages 2262-2272 http://dx.doi.org/10.1016/j.enpol.2009.02.020 Giant oil field decline rates and their influence on world oil production Mikael Höök * , Robert Hirsch + , Kjell Aleklett * Contact e-mail: [email protected] * Uppsala University, Global Energy Systems, Department of physics and astronomy, Box 535, SE-751 21, Uppsala, Sweden http://www.fysast.uu.se/GES + Management Information Services, Inc. (MISI), 723 Fords Landing Way, Alexandria, VA, 22314, U.S.A. Abstract The most important contributors to the world’s total oil production are the giant oil fields. Using a comprehensive database of giant oil field production, the average decline rates of the world’s giant oil fields are estimated. Separating subclasses was necessary, since there are large differences between land and offshore fields, as well as between non-OPEC and OPEC fields. The evolution of decline rates over past decades includes the impact of new technologies and production techniques and clearly shows that the average decline rate for individual giant fields is increasing with time. These factors have significant implications for the future, since the most important world oil production base – giant fields – will decline more rapidly in the future, according to our findings. Our conclusion is that the world faces an increasing oil supply challenge, as the decline in existing production is not only high now but will be increasing in the future. Key words: Giant oil fields, decline rates, peak oil, future oil production
Transcript of Giant oil field decline rates and their influence on world ...

1
Published in Energy Policy Volume 37, Issue 6, June 2009, Pages 2262-2272
http://dx.doi.org/10.1016/j.enpol.2009.02.020
Giant oil field decline rates and their
influence on world oil production
Mikael Höök*, Robert Hirsch
+, Kjell Aleklett
*
Contact e-mail: [email protected]
* Uppsala University, Global Energy Systems, Department of physics and astronomy,
Box 535, SE-751 21, Uppsala, Sweden
http://www.fysast.uu.se/GES
+ Management Information Services, Inc. (MISI), 723 Fords Landing Way, Alexandria,
VA, 22314, U.S.A.
Abstract The most important contributors to the world’s total oil production are the giant oil fields. Using
a comprehensive database of giant oil field production, the average decline rates of the world’s
giant oil fields are estimated. Separating subclasses was necessary, since there are large
differences between land and offshore fields, as well as between non-OPEC and OPEC fields.
The evolution of decline rates over past decades includes the impact of new technologies and
production techniques and clearly shows that the average decline rate for individual giant fields
is increasing with time. These factors have significant implications for the future, since the most
important world oil production base – giant fields – will decline more rapidly in the future,
according to our findings. Our conclusion is that the world faces an increasing oil supply
challenge, as the decline in existing production is not only high now but will be increasing in the
future.
Key words:
Giant oil fields, decline rates, peak oil, future oil production
2
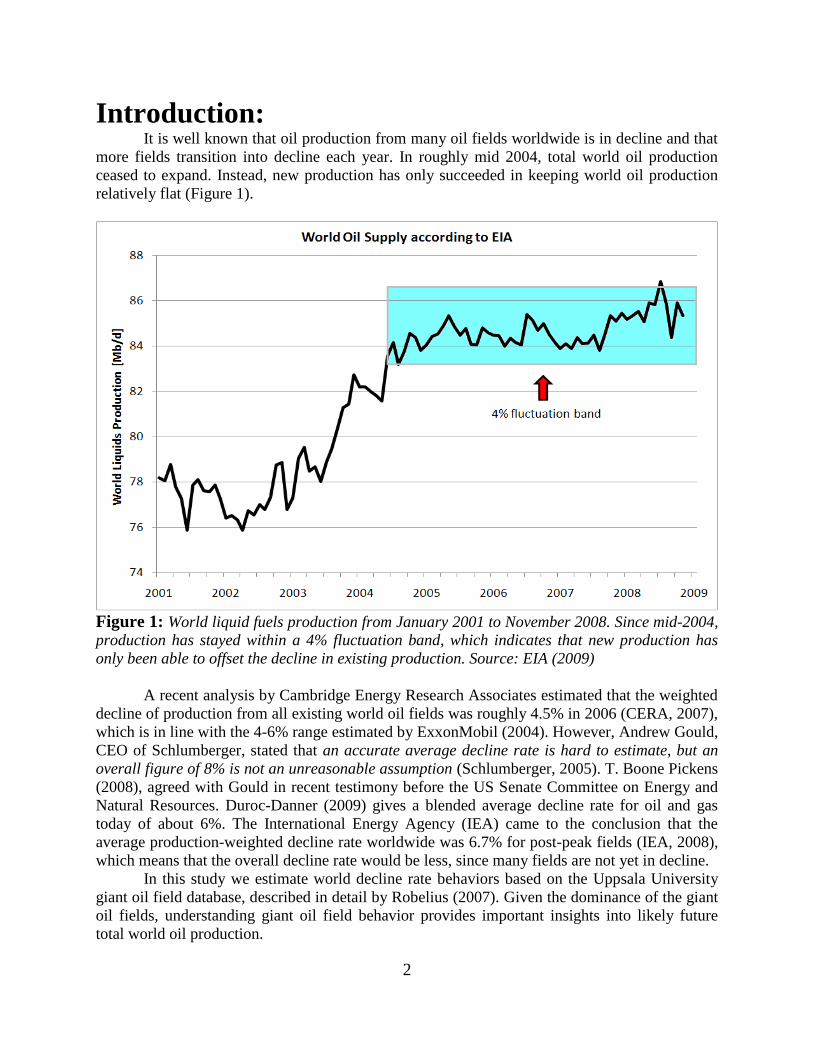
Introduction: It is well known that oil production from many oil fields worldwide is in decline and that
more fields transition into decline each year. In roughly mid 2004, total world oil production
ceased to expand. Instead, new production has only succeeded in keeping world oil production
relatively flat (Figure 1).
Figure 1: World liquid fuels production from January 2001 to November 2008. Since mid-2004,
production has stayed within a 4% fluctuation band, which indicates that new production has
only been able to offset the decline in existing production. Source: EIA (2009)
A recent analysis by Cambridge Energy Research Associates estimated that the weighted
decline of production from all existing world oil fields was roughly 4.5% in 2006 (CERA, 2007),
which is in line with the 4-6% range estimated by ExxonMobil (2004). However, Andrew Gould,
CEO of Schlumberger, stated that an accurate average decline rate is hard to estimate, but an
overall figure of 8% is not an unreasonable assumption (Schlumberger, 2005). T. Boone Pickens
(2008), agreed with Gould in recent testimony before the US Senate Committee on Energy and
Natural Resources. Duroc-Danner (2009) gives a blended average decline rate for oil and gas
today of about 6%. The International Energy Agency (IEA) came to the conclusion that the
average production-weighted decline rate worldwide was 6.7% for post-peak fields (IEA, 2008),
which means that the overall decline rate would be less, since many fields are not yet in decline. In this study we estimate world decline rate behaviors based on the Uppsala University
giant oil field database, described in detail by Robelius (2007). Given the dominance of the giant
oil fields, understanding giant oil field behavior provides important insights into likely future
total world oil production.

3
Giant oil fields and world production Giant oil fields are the world’s largest. There are two ways to define a giant oil field. One
is based on ultimately recoverable resources (URR), and the second is based on maximum oil
production level. The URR definition considers giants to have more than 0.5 Gb of ultimately
recoverable resources. The production definition assumes a production of more than 100,000
barrels per day (b/d) for more than one year (Simmons, 2002). In this analysis we consider the
worlds conventional oil fields, regardless of location, e.g. shallow or deep water, the Arctic, etc.
Conventional oil fields refer to reservoirs that dominantly allow oil to be recovered as a free-
flowing dark to light-coloured liquid (Speight, 2007). Consequently, heavier crude oils that
require special production methods are excluded.
The American Association of Petroleum Geologists (AAPG) has published a series of
memoires about giant oil fields and their geology (see for instance AAPG, 1970; 1980; 1992;
2003; 2005). Other studies have used essentially the same definition system (Nehring, 1978;
Robelius, 2007). Giant fields covered by both the AAPG and the Simmons definitions were used
in this study.
Using our definition of giant oil fields, we find that roughly 500 (about one percent of the
total number of world oil fields) are classified as giants. Their contribution to world oil
production was over 60 % in 2005, with the 20 largest fields alone responsible for nearly 25%
(Figure 2). Giant fields represent roughly 65 % of the global ultimate recoverable conventional
oil resources (Robelius, 2007). Many studies have pointed out the importance of giant oil fields,
for instance Campbell (1991), Hirsch (2008), Meng and Bentley (2008).
Individual oilfields can be operated in various ways. Important field operating options
and planning models have been described (Palsson et al, 2003; Ortíz-Gómez et al, 2002; Barnes
et al, 2002). For specific fields, much is dependent on specific reservoir characteristics,
investments, production strategies, and technology use, as a function of time.
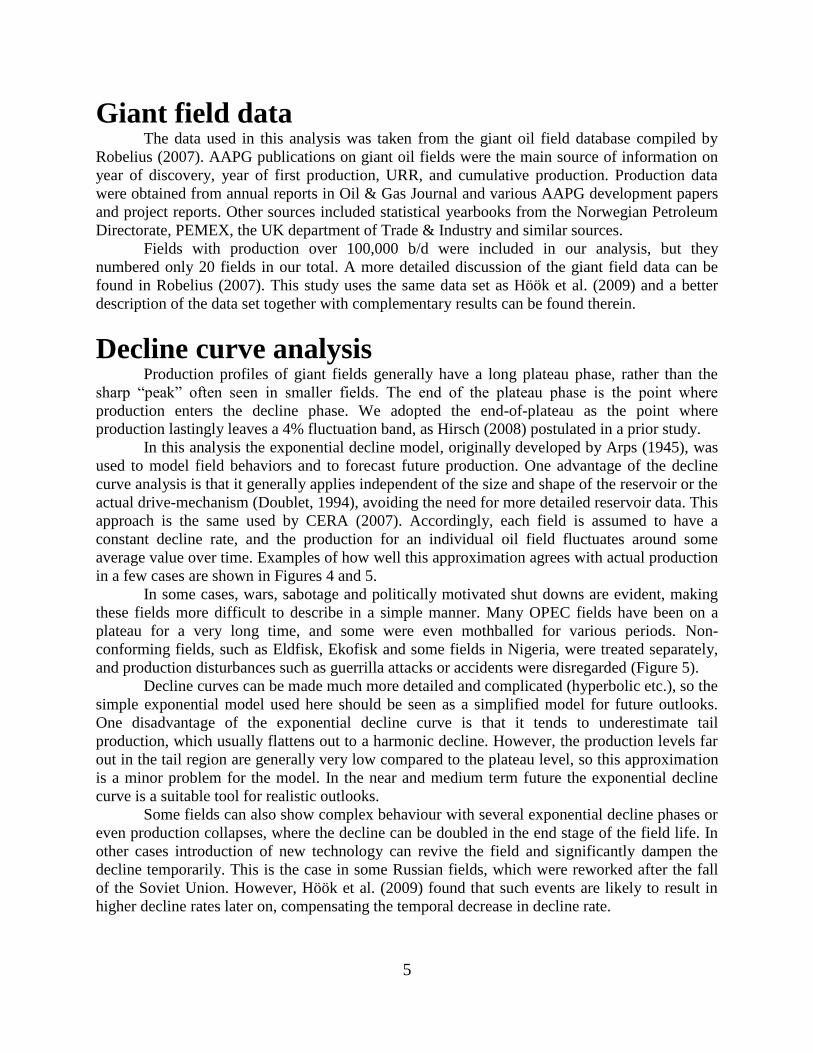
The overall production from giant fields is declining, because a majority of the largest
giant fields are over 50 years old, and fewer and fewer new giants have been discovered since the
decade of the 1960s (Figure 3). The average contribution from an individual giant oilfield to
world production is less than 1%. Thus, with few exceptions, e.g., Ghawar, the contribution from
a single field is generally small compared to the total. On this basis, our approach is to estimate
collective behaviors.
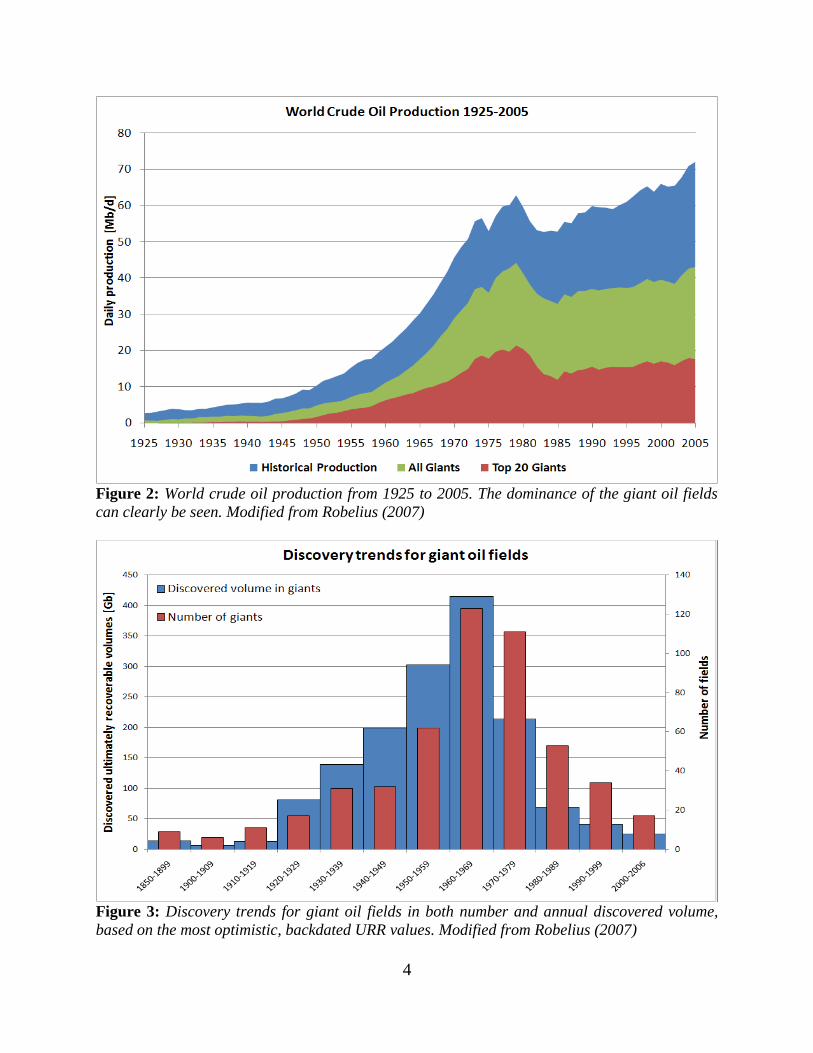
4
Figure 2: World crude oil production from 1925 to 2005. The dominance of the giant oil fields
can clearly be seen. Modified from Robelius (2007)
Figure 3: Discovery trends for giant oil fields in both number and annual discovered volume,
based on the most optimistic, backdated URR values. Modified from Robelius (2007)
5
Giant field data The data used in this analysis was taken from the giant oil field database compiled by
Robelius (2007). AAPG publications on giant oil fields were the main source of information on
year of discovery, year of first production, URR, and cumulative production. Production data
were obtained from annual reports in Oil & Gas Journal and various AAPG development papers
and project reports. Other sources included statistical yearbooks from the Norwegian Petroleum
Directorate, PEMEX, the UK department of Trade & Industry and similar sources.
Fields with production over 100,000 b/d were included in our analysis, but they
numbered only 20 fields in our total. A more detailed discussion of the giant field data can be
found in Robelius (2007). This study uses the same data set as Höök et al. (2009) and a better
description of the data set together with complementary results can be found therein.
Decline curve analysis Production profiles of giant fields generally have a long plateau phase, rather than the
sharp “peak” often seen in smaller fields. The end of the plateau phase is the point where
production enters the decline phase. We adopted the end-of-plateau as the point where
production lastingly leaves a 4% fluctuation band, as Hirsch (2008) postulated in a prior study.
In this analysis the exponential decline model, originally developed by Arps (1945), was
used to model field behaviors and to forecast future production. One advantage of the decline
curve analysis is that it generally applies independent of the size and shape of the reservoir or the
actual drive-mechanism (Doublet, 1994), avoiding the need for more detailed reservoir data. This
approach is the same used by CERA (2007). Accordingly, each field is assumed to have a
constant decline rate, and the production for an individual oil field fluctuates around some
average value over time. Examples of how well this approximation agrees with actual production
in a few cases are shown in Figures 4 and 5.
In some cases, wars, sabotage and politically motivated shut downs are evident, making
these fields more difficult to describe in a simple manner. Many OPEC fields have been on a
plateau for a very long time, and some were even mothballed for various periods. Non-
conforming fields, such as Eldfisk, Ekofisk and some fields in Nigeria, were treated separately,
and production disturbances such as guerrilla attacks or accidents were disregarded (Figure 5).
Decline curves can be made much more detailed and complicated (hyperbolic etc.), so the
simple exponential model used here should be seen as a simplified model for future outlooks.
One disadvantage of the exponential decline curve is that it tends to underestimate tail
production, which usually flattens out to a harmonic decline. However, the production levels far
out in the tail region are generally very low compared to the plateau level, so this approximation
is a minor problem for the model. In the near and medium term future the exponential decline
curve is a suitable tool for realistic outlooks.
Some fields can also show complex behaviour with several exponential decline phases or
even production collapses, where the decline can be doubled in the end stage of the field life. In
other cases introduction of new technology can revive the field and significantly dampen the
decline temporarily. This is the case in some Russian fields, which were reworked after the fall
of the Soviet Union. However, Höök et al. (2009) found that such events are likely to result in
higher decline rates later on, compensating the temporal decrease in decline rate.

6
Figure 4: The production curves of the land-based US giant Prudhoe Bay and the giant UK
Thistle offshore field. The approximately exponential average decline rate is clearly seen in these
two well-behaved fields.
Figure 5: The exponential decline curve fits reasonably well with the production of the Norway
giant Eldfisk, where pressure depletion has caused major reservoir compaction and subsidence
problems. The Nigerian Jones Creek, which has been severely disturbed by wars, rebel attacks
and sabotage, provides a good fit with the model if disturbed data points are disregarded. In
both these cases the production curve has been fluctuating around an approximately exponential
decline curve.

7
Modelling future field behaviour is done by extrapolating the historical production data
with an exponential decline curve. This does not take dramatic deviations into account and
assumes that declines will continue approximately exponentially. This leads to a somewhat
optimistic extrapolation. The decline rate of a field is affected by introduction of new
technology, investments, changes in strategies and other factors affecting production. Studying
decline rates and their development gives some hints about the effects of technology and field
investments.
Average decline rate The Uppsala giant field database includes 331 giant oil fields with a combined estimated
URR of over 1130 Gb, using estimates adopted by Robelius (2007). 214 fields are land-based
(about 65% of the total), while 117 are offshore installations (about 35%). To calculate the
decline rate of giants that were in decline as of the end of 2005, we considered only the 261
fields classified as post-plateau and in decline. Of these, 170 were land-based and 91 offshore.
IEA (2008) gives an average depletion factor, defined as cumulative production divided by initial
2P reserves, of 48% for their super-giants and giants. Höök et al. (2009) found that most giant
fields leave the plateau phase and reach the onset of decline when around 40% of the URR has
been produced, and combined with IEA’s average depletion factor, it is not surprising that the
majority of the fields are categorized as in decline.
Because the number of fields is so large, our approach provided reasonable statistics and
reasonable mean, median and production weighted values for the giant oil fields as a group. The
production weighted values were created by weighting the decline rate against the peak or
plateau production level for each field, thus giving greater importance to fields with high
production. The production weighted decline is lower than the mean value, because fields with
high production levels often tend to be larger and decline slower than the rest. More details can
be found in Höök et al. (2009).
The statistical uncertainty is difficult to estimate, since production data contains political
influences, differences in definitions, reporting practice and many other parameters, making
conventional statistical error estimate hard to apply. A histogram showing the distribution of the
decline rates for all the post plateau fields considered in this analysis is shown in Figure 6.
A traditional statistical analysis based on the assumption that production data measures
approximately the same thing, results in standard deviations of around 5% and may be seen as a
rough attempt to put a number on the inaccuracy (Höök et al., 2009). In comparison, neither IEA
(2008) nor CERA (2007) provides any uncertainty estimates and hence it is hard to judge the
statistical variations in their results. This study makes no attempt to provide detailed analysis of
the uncertainty; rather, it only concludes that the results are accompanied with significant
uncertainty. Two significant digits will be used here, to make comparisons with CERA (2007)
and IEA (2008) easier, despite the fact that the results of Höök et al. (2009) indicate that only
one digit should be utilized because of the significant uncertainties in many of the underlying
reserves estimates and production figures.
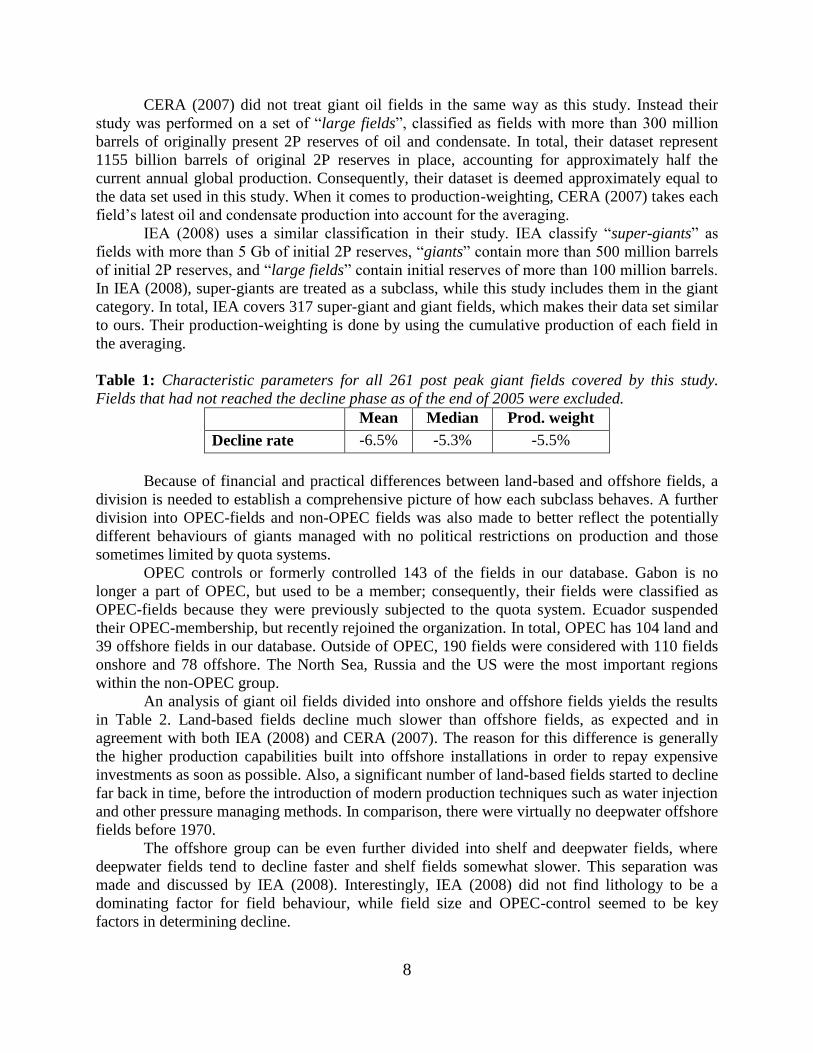
In Table 1 an average annual decline rate for the world’s giant oil fields is seen to be
roughly -6.5%, which is in line with the average observed decline rate worldwide of -6.5% and
the -5.8% production-weighted average annual decline rate obtained by IEA (2008). The
agreement with the 5.8% production-weighted annual decline for large fields obtained by CERA
(2007) is good. However, it should also be noted that the weighting methods and field size
classifications are slightly different.
8
CERA (2007) did not treat giant oil fields in the same way as this study. Instead their
study was performed on a set of “large fields”, classified as fields with more than 300 million
barrels of originally present 2P reserves of oil and condensate. In total, their dataset represent
1155 billion barrels of original 2P reserves in place, accounting for approximately half the
current annual global production. Consequently, their dataset is deemed approximately equal to
the data set used in this study. When it comes to production-weighting, CERA (2007) takes each
field’s latest oil and condensate production into account for the averaging.
IEA (2008) uses a similar classification in their study. IEA classify “super-giants” as
fields with more than 5 Gb of initial 2P reserves, “giants” contain more than 500 million barrels
of initial 2P reserves, and “large fields” contain initial reserves of more than 100 million barrels.
In IEA (2008), super-giants are treated as a subclass, while this study includes them in the giant
category. In total, IEA covers 317 super-giant and giant fields, which makes their data set similar
to ours. Their production-weighting is done by using the cumulative production of each field in
the averaging.
Table 1: Characteristic parameters for all 261 post peak giant fields covered by this study.
Fields that had not reached the decline phase as of the end of 2005 were excluded.
Mean Median Prod. weight
Decline rate -6.5% -5.3% -5.5%
Because of financial and practical differences between land-based and offshore fields, a
division is needed to establish a comprehensive picture of how each subclass behaves. A further
division into OPEC-fields and non-OPEC fields was also made to better reflect the potentially
different behaviours of giants managed with no political restrictions on production and those
sometimes limited by quota systems.
OPEC controls or formerly controlled 143 of the fields in our database. Gabon is no
longer a part of OPEC, but used to be a member; consequently, their fields were classified as
OPEC-fields because they were previously subjected to the quota system. Ecuador suspended
their OPEC-membership, but recently rejoined the organization. In total, OPEC has 104 land and
39 offshore fields in our database. Outside of OPEC, 190 fields were considered with 110 fields
onshore and 78 offshore. The North Sea, Russia and the US were the most important regions
within the non-OPEC group.
An analysis of giant oil fields divided into onshore and offshore fields yields the results
in Table 2. Land-based fields decline much slower than offshore fields, as expected and in
agreement with both IEA (2008) and CERA (2007). The reason for this difference is generally
the higher production capabilities built into offshore installations in order to repay expensive
investments as soon as possible. Also, a significant number of land-based fields started to decline
far back in time, before the introduction of modern production techniques such as water injection
and other pressure managing methods. In comparison, there were virtually no deepwater offshore
fields before 1970.
The offshore group can be even further divided into shelf and deepwater fields, where
deepwater fields tend to decline faster and shelf fields somewhat slower. This separation was
made and discussed by IEA (2008). Interestingly, IEA (2008) did not find lithology to be a
dominating factor for field behaviour, while field size and OPEC-control seemed to be key
factors in determining decline.

9
Figure 6: Histogram of the decline rate distribution of the 261 post plateau giant fields as of the
end of 2005. About 65% are onshore and 35% offshore. Significant differences occur between
different subgroups. The offshore fields cluster together around -10% and the land fields around
-4%. OPEC fields tend to decline slower than non-OPEC fields.
Table 2: Characteristic decline rates of land and offshore fields. Fields that had not ended their
plateau phase or were in build-up phase as of the end of 2005 were excluded.
# fields Field Type Mean Median Prod Weight
170 Land fields -4.9% -4.4% -3.9%
91 Offshore fields -9.4% -9.0% -9.7%
The results for the non-OPEC fields are shown in Table 3. Once again the high decline of
offshore fields compared to land fields can be seen. The average decline of all non-OPEC giant
fields is above 7%, indicating that non-OPEC production is dropping relatively rapidly.
Many of the low decline rates can be found in fields in the US that peaked prior to 1970s.
In fact most of the non-OPEC land group is dominated by the US giant fields. The non-OPEC
offshore group is dominated by giant fields in the North Sea. Many fields, both giant fields and
smaller ones, in the North Sea, show a high decline rate, for instance in Norway and the UK
(Zittel, 2001; Höök and Aleklett, 2008).
In comparison to the non-OPEC group, the OPEC group generally displays lower decline
rates (Table 3). One quite intriguing detail is that OPEC fields tend to exit the plateau phase at a
lower percentage of their URR volumes. This is an explanation for the lower decline rate. Instead
of a prolonged plateau, a longer decline phase with less annual decrease has generally been
favoured as a production strategy compared to non-OPEC. This is examined in greater detail in
10
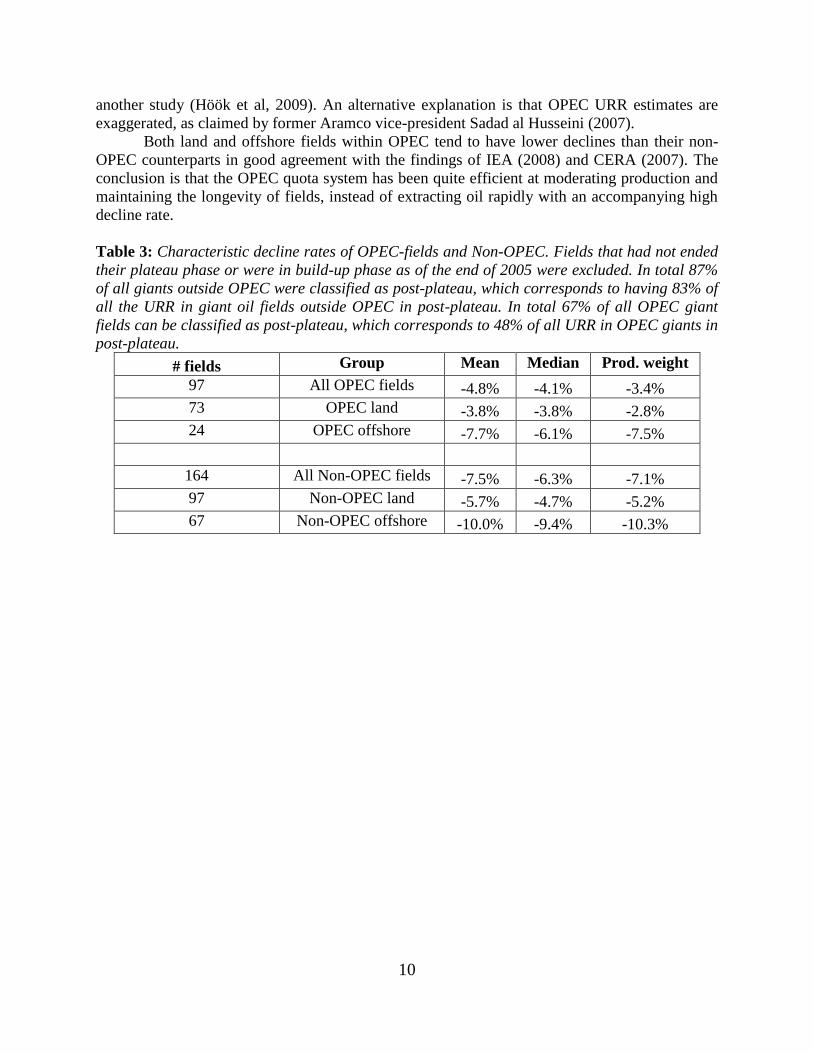
another study (Höök et al, 2009). An alternative explanation is that OPEC URR estimates are
exaggerated, as claimed by former Aramco vice-president Sadad al Husseini (2007).
Both land and offshore fields within OPEC tend to have lower declines than their non-
OPEC counterparts in good agreement with the findings of IEA (2008) and CERA (2007). The
conclusion is that the OPEC quota system has been quite efficient at moderating production and
maintaining the longevity of fields, instead of extracting oil rapidly with an accompanying high
decline rate.
Table 3: Characteristic decline rates of OPEC-fields and Non-OPEC. Fields that had not ended
their plateau phase or were in build-up phase as of the end of 2005 were excluded. In total 87%
of all giants outside OPEC were classified as post-plateau, which corresponds to having 83% of
all the URR in giant oil fields outside OPEC in post-plateau. In total 67% of all OPEC giant
fields can be classified as post-plateau, which corresponds to 48% of all URR in OPEC giants in
post-plateau.
# fields Group Mean Median Prod. weight
97 All OPEC fields -4.8% -4.1% -3.4%
73 OPEC land -3.8% -3.8% -2.8%
24 OPEC offshore -7.7% -6.1% -7.5%
164 All Non-OPEC fields -7.5% -6.3% -7.1%
97 Non-OPEC land -5.7% -4.7% -5.2%
67 Non-OPEC offshore -10.0% -9.4% -10.3%

11
Evolution of decline rate in time It is useful to consider the historical evolution of field decline rates, since many giant
fields are old and passed into decline before much of modern oil field technology was developed
and implemented. The year that fields left plateau production was used to form subgroups, e.g.,
if a field started to decline in 1950-1959, it is included in the 1950s group and so on. This
approach is different from IEA (2008), which used the year of first oil production to form
subgroups in their study of decline rate evolution. We believe that the year of the onset of
production decline is of greater importance because it better reflects the impacts of improved
technology and alternate production strategies.
The results are shown in Tables 4, 5, 6, 7, 8 and 9. For all offshore fields (Table 4), a
clear trend towards higher decline rates over time was found. For all land-based fields (Table 5),
the trend is not as clear but is directionally similar. Separating OPEC and non-OPEC fields
reveals larger differences. Data for the decade of the 2000s are limited because less declining
field data was available as of the end of 2005.
Table 4: Evolution of the decline rate of offshore giant fields. The decade that the fields left
plateau production was used to form the subgroups.
# fields Time period Mean Median Prod. weight
0 Pre 1960 - - -
2 1960s -2.8% -2.8% -3.7%
17 1970s -6.0% -6.1% -6.3%
16 1980s -7.9% -7.5% -8.9%
35 1990s -10.4% -11.4% -10.6%
19 2000s -12.5% -12.6% -10.8%
Table 5: Evolution of the decline rate of land-based giant oil fields. The decade that the fields
left plateau production was used to form the subgroups.
# fields Time period Mean Median Prod. weight
23 Pre 1960 -4.2% -4.4% -4.2%
18 1960s -5.1% -5.5% -6.0%
72 1970s -4.2% -3.9% -3.0%
25 1980s -4.4% -4.1% -3.9%
28 1990s -6.9% -5.6% -5.6%
4 2000s -10.7% -9.9% -10.1%
12
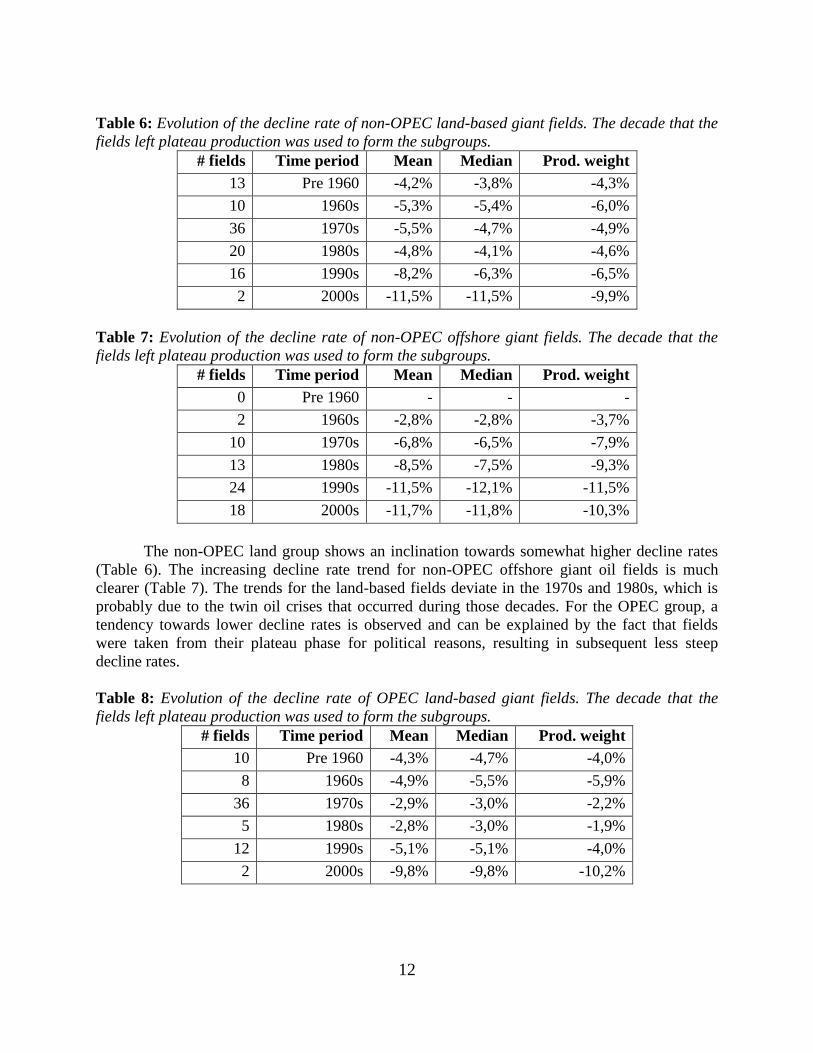
Table 6: Evolution of the decline rate of non-OPEC land-based giant fields. The decade that the
fields left plateau production was used to form the subgroups.
# fields Time period Mean Median Prod. weight
13 Pre 1960 -4,2% -3,8% -4,3%
10 1960s -5,3% -5,4% -6,0%
36 1970s -5,5% -4,7% -4,9%
20 1980s -4,8% -4,1% -4,6%
16 1990s -8,2% -6,3% -6,5%
2 2000s -11,5% -11,5% -9,9%
Table 7: Evolution of the decline rate of non-OPEC offshore giant fields. The decade that the
fields left plateau production was used to form the subgroups.
# fields Time period Mean Median Prod. weight
0 Pre 1960 - - -
2 1960s -2,8% -2,8% -3,7%
10 1970s -6,8% -6,5% -7,9%
13 1980s -8,5% -7,5% -9,3%
24 1990s -11,5% -12,1% -11,5%
18 2000s -11,7% -11,8% -10,3%
The non-OPEC land group shows an inclination towards somewhat higher decline rates
(Table 6). The increasing decline rate trend for non-OPEC offshore giant oil fields is much
clearer (Table 7). The trends for the land-based fields deviate in the 1970s and 1980s, which is
probably due to the twin oil crises that occurred during those decades. For the OPEC group, a
tendency towards lower decline rates is observed and can be explained by the fact that fields
were taken from their plateau phase for political reasons, resulting in subsequent less steep
decline rates.
Table 8: Evolution of the decline rate of OPEC land-based giant fields. The decade that the
fields left plateau production was used to form the subgroups.
# fields Time period Mean Median Prod. weight
10 Pre 1960 -4,3% -4,7% -4,0%
8 1960s -4,9% -5,5% -5,9%
36 1970s -2,9% -3,0% -2,2%
5 1980s -2,8% -3,0% -1,9%
12 1990s -5,1% -5,1% -4,0%
2 2000s -9,8% -9,8% -10,2%
13
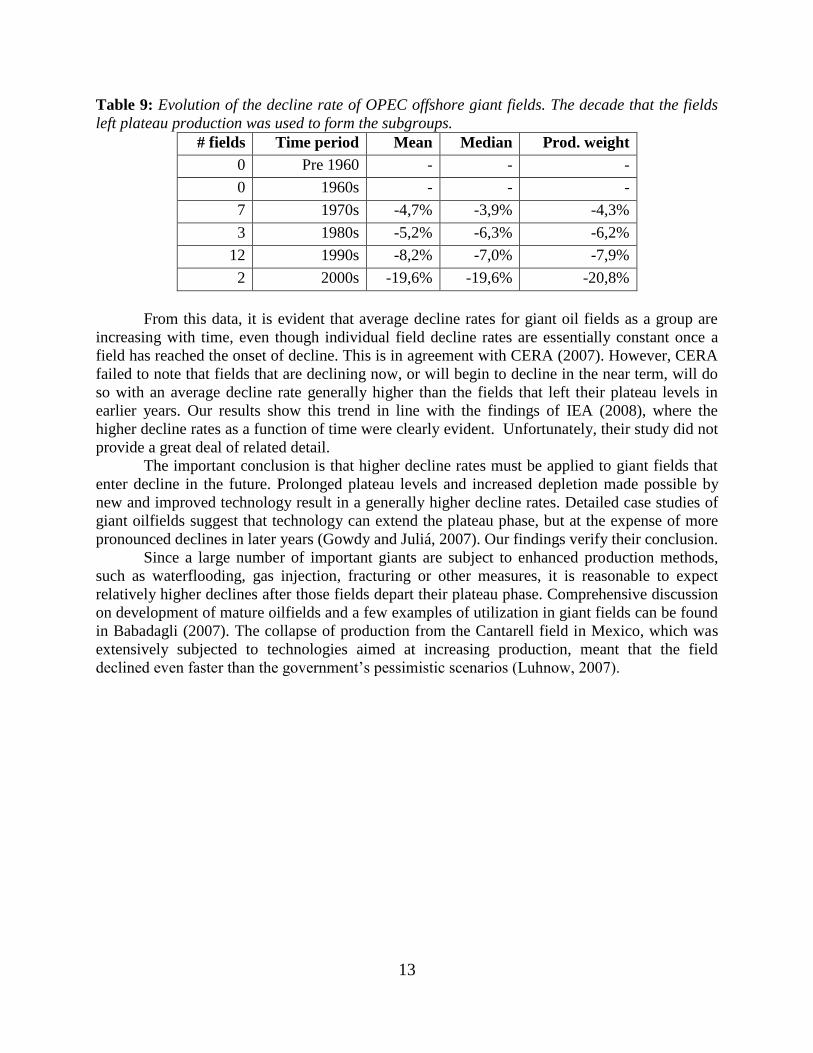
Table 9: Evolution of the decline rate of OPEC offshore giant fields. The decade that the fields
left plateau production was used to form the subgroups.
# fields Time period Mean Median Prod. weight
0 Pre 1960 - - -
0 1960s - - -
7 1970s -4,7% -3,9% -4,3%
3 1980s -5,2% -6,3% -6,2%
12 1990s -8,2% -7,0% -7,9%
2 2000s -19,6% -19,6% -20,8%
From this data, it is evident that average decline rates for giant oil fields as a group are
increasing with time, even though individual field decline rates are essentially constant once a
field has reached the onset of decline. This is in agreement with CERA (2007). However, CERA
failed to note that fields that are declining now, or will begin to decline in the near term, will do
so with an average decline rate generally higher than the fields that left their plateau levels in
earlier years. Our results show this trend in line with the findings of IEA (2008), where the
higher decline rates as a function of time were clearly evident. Unfortunately, their study did not
provide a great deal of related detail.
The important conclusion is that higher decline rates must be applied to giant fields that
enter decline in the future. Prolonged plateau levels and increased depletion made possible by
new and improved technology result in a generally higher decline rates. Detailed case studies of
giant oilfields suggest that technology can extend the plateau phase, but at the expense of more
pronounced declines in later years (Gowdy and Juliá, 2007). Our findings verify their conclusion.
Since a large number of important giants are subject to enhanced production methods,
such as waterflooding, gas injection, fracturing or other measures, it is reasonable to expect
relatively higher declines after those fields depart their plateau phase. Comprehensive discussion
on development of mature oilfields and a few examples of utilization in giant fields can be found
in Babadagli (2007). The collapse of production from the Cantarell field in Mexico, which was
extensively subjected to technologies aimed at increasing production, meant that the field
declined even faster than the government’s pessimistic scenarios (Luhnow, 2007).
14
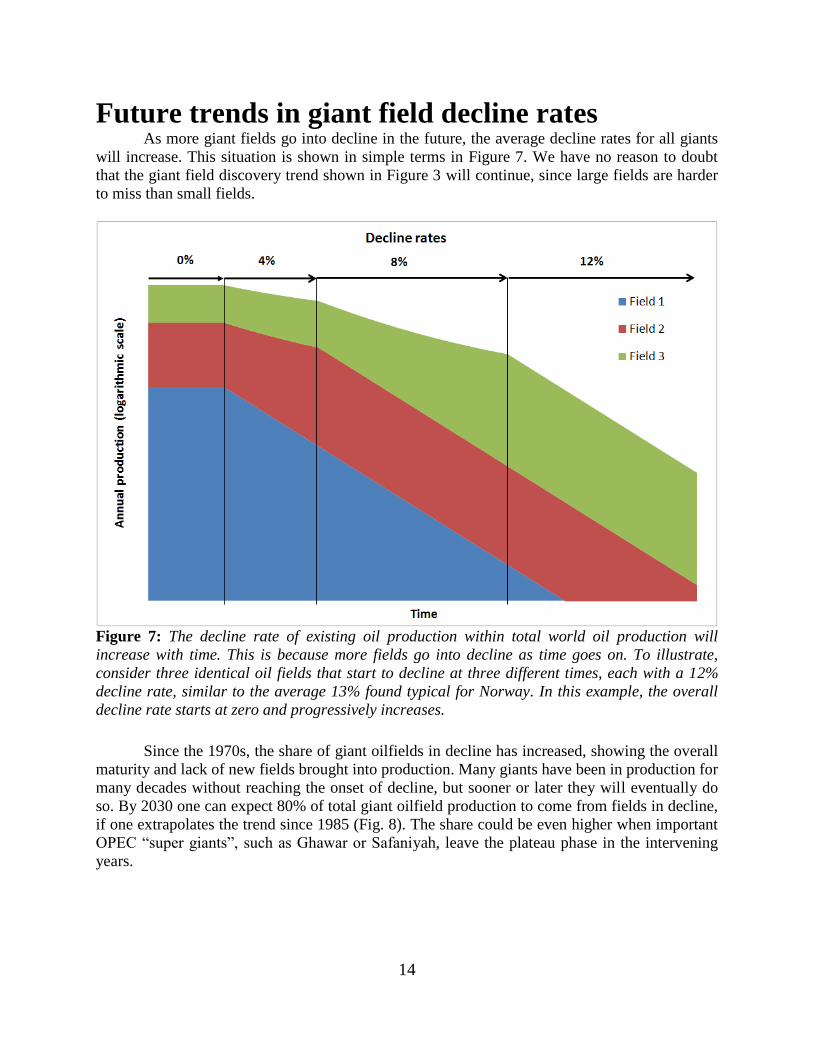
Future trends in giant field decline rates As more giant fields go into decline in the future, the average decline rates for all giants
will increase. This situation is shown in simple terms in Figure 7. We have no reason to doubt
that the giant field discovery trend shown in Figure 3 will continue, since large fields are harder
to miss than small fields.
Figure 7: The decline rate of existing oil production within total world oil production will
increase with time. This is because more fields go into decline as time goes on. To illustrate,
consider three identical oil fields that start to decline at three different times, each with a 12%
decline rate, similar to the average 13% found typical for Norway. In this example, the overall
decline rate starts at zero and progressively increases.
Since the 1970s, the share of giant oilfields in decline has increased, showing the overall
maturity and lack of new fields brought into production. Many giants have been in production for
many decades without reaching the onset of decline, but sooner or later they will eventually do
so. By 2030 one can expect 80% of total giant oilfield production to come from fields in decline,
if one extrapolates the trend since 1985 (Fig. 8). The share could be even higher when important
OPEC “super giants”, such as Ghawar or Safaniyah, leave the plateau phase in the intervening
years.
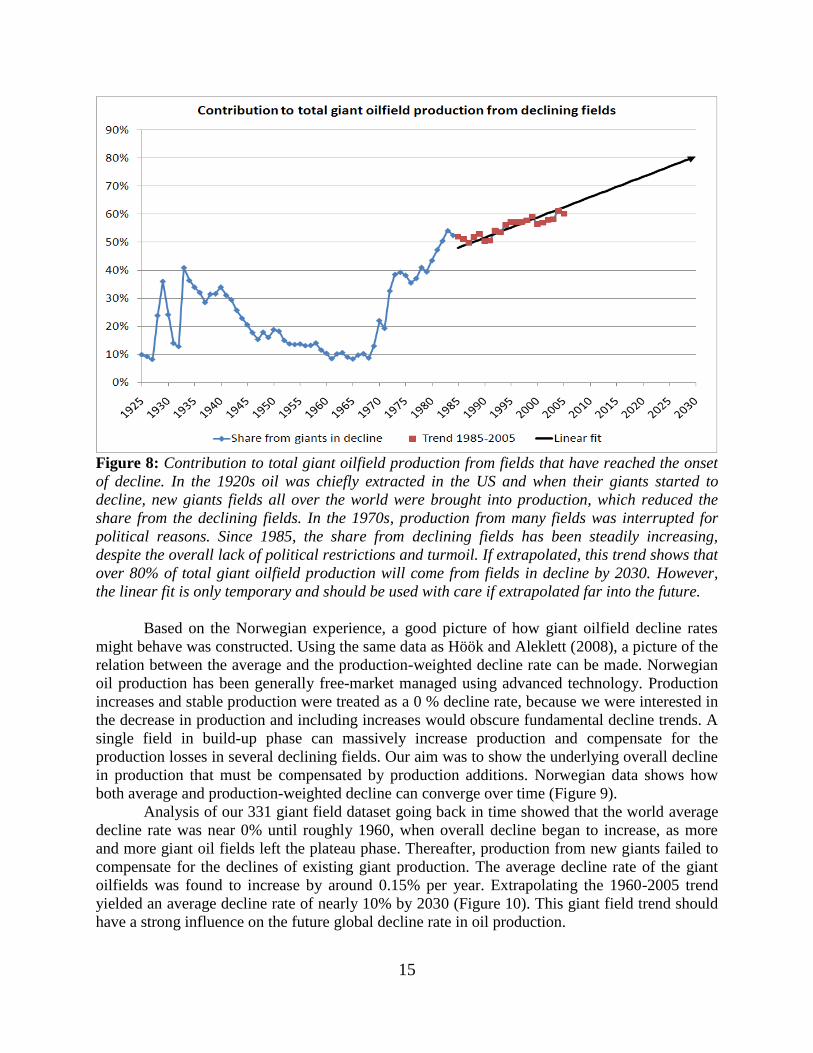
15
Figure 8: Contribution to total giant oilfield production from fields that have reached the onset
of decline. In the 1920s oil was chiefly extracted in the US and when their giants started to
decline, new giants fields all over the world were brought into production, which reduced the
share from the declining fields. In the 1970s, production from many fields was interrupted for
political reasons. Since 1985, the share from declining fields has been steadily increasing,
despite the overall lack of political restrictions and turmoil. If extrapolated, this trend shows that
over 80% of total giant oilfield production will come from fields in decline by 2030. However,
the linear fit is only temporary and should be used with care if extrapolated far into the future.
Based on the Norwegian experience, a good picture of how giant oilfield decline rates
might behave was constructed. Using the same data as Höök and Aleklett (2008), a picture of the
relation between the average and the production-weighted decline rate can be made. Norwegian
oil production has been generally free-market managed using advanced technology. Production
increases and stable production were treated as a 0 % decline rate, because we were interested in
the decrease in production and including increases would obscure fundamental decline trends. A
single field in build-up phase can massively increase production and compensate for the
production losses in several declining fields. Our aim was to show the underlying overall decline
in production that must be compensated by production additions. Norwegian data shows how
both average and production-weighted decline can converge over time (Figure 9).
Analysis of our 331 giant field dataset going back in time showed that the world average
decline rate was near 0% until roughly 1960, when overall decline began to increase, as more
and more giant oil fields left the plateau phase. Thereafter, production from new giants failed to
compensate for the declines of existing giant production. The average decline rate of the giant
oilfields was found to increase by around 0.15% per year. Extrapolating the 1960-2005 trend
yielded an average decline rate of nearly 10% by 2030 (Figure 10). This giant field trend should
have a strong influence on the future global decline rate in oil production.

16
Figure 9: The decline of the Norwegian giant oilfields. Ultimately the onset of national decline
could not be prevented and decline rates soared. Both the average and the production-weighted
decline values agree well. Norway is an example of how technology can temporarily maintain
production at the expense of a rapid future decline rate.
The production-weighted decline rate has been behaving somewhat differently, especially
since 1985, compared to the average decline rate. The reason for this change is the introduction
of new technologies, most notably horizontal drilling and fracturing techniques, in many major
fields in former Soviet Union and the Middle East. Using new technologies, it was possible to
halt the decline in many giants and keep production stable for some time. Eventually the average
and the production-weighted declines must follow each other. The currently stable production-
weighted decline cannot be expected to continue far into the future, once technology-enhanced
fields reach the final onset of decline.
A limit for the average decline rate of the giant oil fields occur when all the fields in the
population have reached the onset of decline. In other words the average decline rate cannot
increase monotonously, but will sooner or later reach a limit. In the case of Norway, where all
the giant fields now are in decline, the transition towards the decline rate limit was roughly linear
(Figure 9) and similar behavior is expected globally. In the case of the world, OPEC and Non-
OPEC, the limit of average decline rate is not known, but will be reached when all the giants
have reached the onset of decline.

17
Figure 10: The decline rate of the world’s giant oilfields. The trend toward an increasing
average decline rate is very clear and explained by an ever decreasing volumes of newly
discovered and declining production from new giant fields. The time period 1973-1982 was
disregarded since production was deliberately reduced during that period by OPEC. The
divergence between the two decline rates after 1985 is caused by the introduction of new
technology and the revival of giant fields in primarily Middle East and Russia.
Figure 11: Decline rate of the non-OPEC giant fields. The average decline rate started to grow
in 1965 and has been increasing as more and more giants reached the onset of decline. The
deviation after 1995 was caused by the fall of the Soviet Union and the introduction of new
technologies that managed to temporarily revive Russian giants.

18
Separating non-OPEC and OPEC giant field production yields the trends seen in Figures
11 and 12. In the non-OPEC case, the 2030 decline rate is roughly 11%, while the OPEC 2030
rate is roughly 8%. Sooner or later the production-weighted decline rate must catch up with the
average decline rate, but exactly how soon and how fast this development will happen is hard to
forecast. Currently, the world may have a false sense of security, temporarily created by decline-
delaying technology introduction in underdeveloped fields. When fewer giants can be
momentarily revived, the production-weighted decline must eventually begin to increase.
Figure 12: The decline of the OPEC giant fields. The trend in average decline broke from near
zero in the 1950s and grew more slowly that in the non-OPEC case. This is likely the result of
the OPEC quota system. During the period 1973-1985 significant production capacity was
withheld deliberately or otherwise unavailable for short periods, so related data points were
excluded. The production-weighted decline rate has been virtually constant since 1985.

19
Future global production
Without good data on a large fraction of the world’s oil fields, an accurate estimate of
future global oil production cannot be developed. While various databases exist, all include
approximations and estimates, so none are fully definitive. Nevertheless, a number of factors can
provide insights into what might evolve. First, the world’s giant oil fields are the dominating
contributors to total world oil production. Second, it is found that the decline of smaller fields is
equal to or greater than those of the giants (see for instance IEA, 2008; CERA, 2007). A detailed
study of Norwegian fields showed that giants declined at an average of 13%, while the small
fields, condensate, and NGL declined at 20% or more (Höök and Aleklett, 2008).
A small field requires fewer wells to fully develop; hence it is more easily depleted. A
large field requires many more wells, often widely separated, so it is typically depleted more
slowly. High depletion rates, which are common in small fields, have been shown to strongly
correlate with high decline rates (Höök et al., 2009). Thus, giant oil field decline rates are useful
for estimating the likely average world decline. Accordingly, we believe that the decline in
existing production, both for giants and other fields, will be at least 6.5% or 5.5% if production-
weighted. The findings of Höök et al. (2009) indicate that the decline rates are only significant in
the first digit. Consequently, we use 6% for our production outlook to reflect uncertainty. The
average and the production-weighted values will ultimately coincide, as they did in Norway
(Figure 9).
As a comparison, in a field-by-field study of predominantly giant fields, IEA (2008)
derived an average decline rate worldwide for all oil fields of 6.7%. IEA (2008) stated that field
size was a large determinant of field decline behaviour, noting that large fields decline relatively
slower than small fields. This reasoning also supports their expected increases in future decline
rates, as the world moves towards generally smaller oilfields. In their published forecast, they
used a decline of 4.1% for fields in production for reasons they did not explain.
The exact annual increase in world average decline rate is difficult to estimate and
requires a more comprehensive database than was available to us. Accordingly, the value of -
0.15% per year derived here should be taken as a rough estimate. The important point, however,
is that the average decline rate in existing production is clearly increasing with time. Also, the
contribution from declining fields is increasing (Figure 8). Consequently, “we must run faster
and faster just to stand still”
Using our 6% production-weighted average decline and extrapolation of the contribution
from declining fields (Figure 8), one can create a future outlook for world crude oil production.
By incorporating the increasing average decline, another possible future can be envisioned. The
difference between using a constant decline rate and a growing decline is as much as 7 Mb/d by
2030 (Figure 13).
There are significant uncertainties regarding future oil production from our study and
similar works. Nevertheless, reasonable future decline rates can be estimated. Our outlook and
the forecast for fields in production from IEA (2008) agree reasonably well (Figure 13). While
there is a few million barrels per day of difference, the overall picture is similar. However, IEA
(2008) seems to lean more towards the optimistic case and a more comprehensive study of their
oil forecast is recommended.
20
Figure 13: The historical world oil production along with crude oil forecast the reference
scenario from IEA World Energy Outlook 2008. A constant decline rate of existing production of
6%, combined with an increasing share of fields in decline, is displayed as one possibility. Our
other scenario is a case with increasing average decline. The IEA WEO 2008 forecast for fields
in production (FIP) is compared to our own estimates of reasonable decline rates and the
contribution from declining fields. The IEA forecast is reasonable in the near-term, but towards
2030, it seems optimistically biased. Using a constant decline rate compared to an increasing
rate can mean as much as 7 Mb/d of production capacity by 2030.
21
Conclusions Based on a comprehensive database of giant oil field production data, we estimated the
average decline rates of the world’s giant oil fields that are beyond their plateau phase. Since
there are large differences between land and offshore fields and non-OPEC and OPEC fields,
separation into different subclasses was necessary. In order to obtain a realistic forecast of future
giant field decline rates, the subclasses were treated separately to better reflect their different
behaviours.
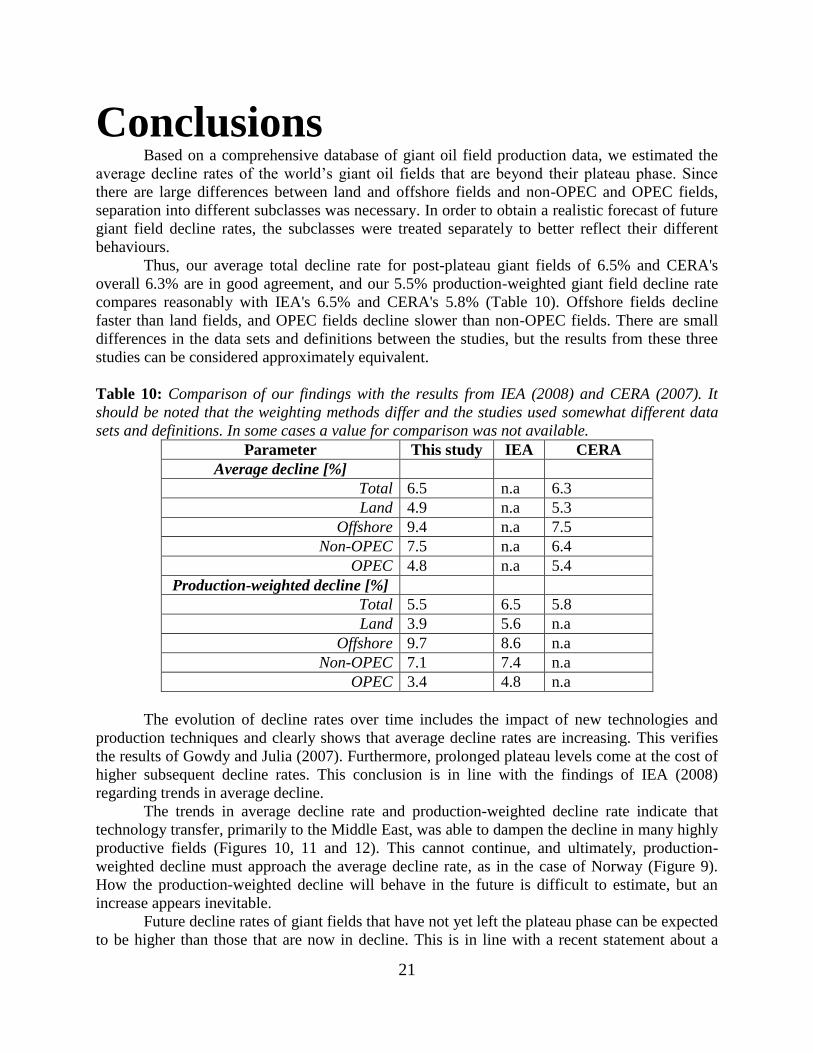
Thus, our average total decline rate for post-plateau giant fields of 6.5% and CERA's
overall 6.3% are in good agreement, and our 5.5% production-weighted giant field decline rate
compares reasonably with IEA's 6.5% and CERA's 5.8% (Table 10). Offshore fields decline
faster than land fields, and OPEC fields decline slower than non-OPEC fields. There are small
differences in the data sets and definitions between the studies, but the results from these three
studies can be considered approximately equivalent.
Table 10: Comparison of our findings with the results from IEA (2008) and CERA (2007). It
should be noted that the weighting methods differ and the studies used somewhat different data
sets and definitions. In some cases a value for comparison was not available.
Parameter This study IEA CERA
Average decline [%]
Total 6.5 n.a 6.3
Land 4.9 n.a 5.3
Offshore 9.4 n.a 7.5
Non-OPEC 7.5 n.a 6.4
OPEC 4.8 n.a 5.4
Production-weighted decline [%]
Total 5.5 6.5 5.8
Land 3.9 5.6 n.a
Offshore 9.7 8.6 n.a
Non-OPEC 7.1 7.4 n.a
OPEC 3.4 4.8 n.a
The evolution of decline rates over time includes the impact of new technologies and
production techniques and clearly shows that average decline rates are increasing. This verifies
the results of Gowdy and Julia (2007). Furthermore, prolonged plateau levels come at the cost of
higher subsequent decline rates. This conclusion is in line with the findings of IEA (2008)
regarding trends in average decline.
The trends in average decline rate and production-weighted decline rate indicate that
technology transfer, primarily to the Middle East, was able to dampen the decline in many highly
productive fields (Figures 10, 11 and 12). This cannot continue, and ultimately, production-
weighted decline must approach the average decline rate, as in the case of Norway (Figure 9).
How the production-weighted decline will behave in the future is difficult to estimate, but an
increase appears inevitable.
Future decline rates of giant fields that have not yet left the plateau phase can be expected
to be higher than those that are now in decline. This is in line with a recent statement about a

22
decline of 10% in mature fields from Petrobras downstream director Paulo Roberto Costa (2008).
The crash of the Cantarell field in Mexico and the experiences of the North Sea giants are a vivid
example of what can happen to other giant oilfields in the future.
These findings have large implications for the future, since the most important world oil
production base – giant oilfields – will decline more rapidly. In the extreme, a potential 10%
annual decline in Ghawar would be very challenging to compensate and would create severe
problems for Saudi-Arabia and the world. The future behaviour of the remaining giants,
especially in OPEC, will be a key factor in future oil supply.
Based on the decline behaviour of giants, decline rate estimates for world oil production
are possible because of the large influence of the giants. Many studies have shown that smaller
fields, condensate, and NGL will decline at least as fast or faster than giant oilfields, once the
onset of decline is reached (CERA, 2007; Höök and Aleklett, 2008; IEA, 2008). Consequently,
we believe that there is a strong basis for believing that giant oilfields can be used to set a floor
for future decline rate assumptions.
In conclusion, this analysis shows that the average decline rate of the giant oil fields have
been increasing with time, reflecting the fact that more and more fields enter the decline phase
and fewer and fewer new giant fields are being found. The increase is in part due to new
technologies that have been able to temporarily maintain production at the expense of subsequent
more rapid decline. Growing average decline rates have also been noted by IEA (2008). The
difference between using a constant decline in existing production and an increasing decline rate
is significant and could mean as much of a difference of 7 Mb/d by 2030 (Figure 13).
By 2030 the production from fields currently on stream could have decreased by over
50% in agreement with IEA (2008). The struggle to maintain production and compensate for the
decline in existing production will become harder and harder. Our conclusion is that the world
will face an increasing oil supply challenge, as the decline in existing production is not only high
but also increasing.
Acknowledgments We would like to thank Fredrik Robelius for providing us with helpful insights and valuable help
on acquiring the giant oil field data. Many thanks for the reviewers for valuable comments and
assistance in the review process.
References: al-Husseini, S.I., 2007, Long-Term Oil Supply Outlook: Constraints on Increasing Production Capacity,
presentation held at Oil and Money Conference, London, 30 October 2007, see also: http://www.boell-
meo.org/download_en/saudi_peak_oil.pdf
Arps, J.J, (1945); Analysis of Decline Curves, Transactions of the American Institute of Mining, Metallurgical and
Petroleum Engineers, 1945, 160, 228-247.
AAPG (1970); Geology of giant petroleum fields, Memoir 14, 1970
AAPG (1980); Giant oil and gas fields of the decade 1968-1978, Memoir 30 / 1980
AAPG (1992); Giant oil and gas fields of the decade 1978-1988, Memoir 54 / 1992
AAPG (2003); Giant oil and gas fields of the decade 1990-1999, Memoir 78 / 2003
AAPG (2005); Saudi Arabia's Ghawar Field - The Elephant of All Elephants, AAPG Explorer, Jan 2005
Aleklett, K. (2006); Oil production limits mean opportunities, conservation. Oil & Gas Journal, Volume 104, Issue
31, 21 Aug 2006
23
Babadagli, T. (2007); Development of mature oil fields — A review, Journal of Petroleum Science and Engineering,
Volume 57, Issues 3-4, June 2007, Pages 221-246
Barnes, R.J, Linke, P., Kokossis, A. (2002); Optimisation of oilfield development production capacity, Computer
Aided Chemical Engineering, Volume 10, 2002, Pages 631-636
Doublet, L.E, Pande, P.K, McCollom, T.J, Blasingame, T.A. (1994); Decline Curve Analysis Using Type Curves-
-Analysis of Oil Well Production Data Using Material Balance Time: Application to Field Cases, Society of
Petroleum Engineers paper presented at the International Petroleum Conference and Exhibition of Mexico, 10-
13 October 1994, Veracruz, Mexico, SPE paper 28688-MS, 24 p.
Duroc-Danner, B.J., 2009, Game-Changing Technology: The Key to Tapping Mature Reservoirs, World Energy.
Vol. 5, Issue 1, February 9, 2009.
CERA (2007); Finding the Critical Numbers: What Are the Real Decline Rates for Global Oil Production? Private
report written by Peter M. Jackson and Keith M. Eastwood
Campbell, C., (1991); The Golden Century of Oil, 1950-2050: The Depletion of a Resource, first edition, Springer,
29 October 1991, 368 p.
Costa, Paulo Roberto (2008): Statement in an interview in Valor Economico on 27 October 2008, available from:
http://rigzone.com/news/article.asp?a_id=68365
EIA, 2009, January 2009 International Petroleum Monthly, see also: http://www.eia.doe.gov/emeu/ipsr/supply.html
ExxonMobil (2004); A Report on Energy Trends, Greenhouse Gas Emissions, and Alternative Energy, information
to share holders, February 2004
Gowdy, J., Juliá, R. (2007); Technology and petroleum exhaustion: Evidence from two mega-oilfields, Energy,
Volume 32, Issue 8, August 2007, Pages 1448-1454
Hirsch, Robert (2008); Mitigation of maximum world oil production: Shortage scenarios, Energy Policy, Volume
36, Issue 2, February 2008, Pages 881-889
Höök, M., Aleklett, K. (2008); A decline rate study of Norwegian Oil Production, Energy Policy, Volume 36, Issue
11, November 2008, Pages 4262-4271
Höök, M., Söderbergh, B., Jakobsson, K., Aleklett, K. (2009); The evolution of giant oil field production
behaviour, Natural Resources Research, Volume 18, Number 1, March 2009, Pages 39-56
Luhnow, D. (2007); Mexico's Oil Output Cools, Wall Street Journal, Monday 29 January 2007. Available from:
http://www.rigzone.com/news/article.asp?a_id=40538
Meng, Q.A, Bentley, R.W. (2008); Global oil peaking: Responding to the case for ‘abundant supplies of oil’,
Energy, Volume 33, Issue 8, August 2008, Pages 1179-1184
Nehring, R., (1978); Giant Oil Fields and World Oil Resources, Report prepared by the RAND Corporation for the
Central Intelligence Agency, June 1978.
Ortíz-Gómez, A. Rico-Ramirez, V., Hernández-Castro, S. (2002); Mixed-integer multiperiod model for the
planning of oilfield production, Computers & Chemical Engineering, Volume 26, Issues 4-5, 15 May 2002,
Pages 703-714
Palsson, B. Davies, D.R. Todd A.C. and Somerville, J.M. (2003); The Water Injection Process A Technical and
Economic Integrated Approach, Chemical Engineering Research and Design, Volume 81, Issue 3, March 2003,
Pages 333-341
Pickens, T. Boone (2008); testimony to the US Senate Committee on Energy and Natural resources, 17 June 2008,
see also: http://energy.senate.gov/public/_files/PickensTestimony061708.doc
Robelius, F., (2007); Giant Oil Fields - The Highway to Oil: Giant Oil Fields and their Importance for Future Oil
Production. Doctoral thesis from Uppsala University
Simmons, M., (2002); The World's Giant Oilfields, white paper from January 9, 2002, available from:
http://www.simmonsco-intl.com/files/giantoilfields.pdf
Schlumberger (2005); Schlumberger Chairman and CEO Andrew Gould addressed the oil and gas investment
community at the 33rd Annual Howard Weil Energy Conference on April 4, 2005 in New Orleans, Louisiana,
USA. Available from: http://www.slb.com/content/news/presentations/2005/20050404_agould_neworleans.asp
Speight, J., 2008, Synthetic Fuels Handbook: Properties, Process, and Performance, McGraw-Hill Professional,
2008, 422 p
IEA (2008); World Energy Outlook 2008, available from: http://www.worldenergyoutlook.org/
Zittel, W., (2001); Analysis of the UK Oil Production, a contribution to ASPO (the Association for the Study of
Peak Oil & Gas), 22 February 2001, available online from:
http://www.peakoil.net/Publications/06_Analysis_of_UK_oil_production.pdf