Factors Influencing the Decline in Stroke Mortality...Differential Rates of Decline in Stroke...
90
Factors Influencing the Decline in Stroke Mortality A Statement from the American Heart Association/American Stroke Association 0
Transcript of Factors Influencing the Decline in Stroke Mortality...Differential Rates of Decline in Stroke...

Factors Influencing the Decline in Stroke Mortality
A Statement from the
American Heart Association/American Stroke Association
0

Authors
Daniel T. Lackland, DrPH, FAHA, Chair; Edward J. Roccella, PhD, MPH, Co-Chair; Anne Deutsch, RN, PhD, CRRN; Myriam Fornage, PhD, FAHA; Mary G. George, MD, MSPH, FACS, FAHA; George Howard, DrPH, FAHA;
Brett Kissela, MD, MS; Steven J. Kittner, MD, MPH, FAHA; Judith H. Lichtman, PhD, MPH; Lynda Lisabeth, PhD, MPH, FAHA; Lee H.
Schwamm, MD, FAHA; Eric E. Smith, MD; Amytis Towfighi, MD; on behalf of the American Heart Association Stroke Council, Council on
Cardiovascular Nursing, Council on Quality of Care and Outcomes Research, and Council on Functional Genomics and Translational
Biology
1 ©2013 American Heart Association, Inc. All rights reserved. Unauthorized use prohibited.

Stroke Council Professional Education Committee
This slide presentation was developed by a member of the Stroke Council Professional
Education Committee
Aaron Anderson, MD
2 ©2013 American Heart Association, Inc. All rights reserved. Unauthorized use prohibited.

Introduction
• The remarkable decline in stroke mortality has been acknowledged as one of the 10 great public health achievements for the United States (US) in the 20th century.
• Stroke has now fallen from the third to the fourth leading cause of death in the US.
• While both stroke and ischemic heart disease mortalities have declined substantially, the patterns of their decline stand in stark contrast.
3 ©2013 American Heart Association, Inc. All rights reserved. Unauthorized use prohibited.

Decline in Death Rates
4
Per 100,000 population, standardized to the U.S. 2000 standard population Diseases were classified to the International Classification of Disease codes in
use at the time the deaths were reported ©2013 American Heart Association, Inc. All rights reserved. Unauthorized use prohibited.

Decline in Mortality by Race
5
Age‐adjusted death rates for cerebrovascular disease by race, United States, 1999‐2010
Rates per 100,000 population, standardized to the U.S. 2000 standard population
©2013 American Heart Association, Inc. All rights reserved. Unauthorized use prohibited.

Differential Rates of Decline in Stroke Mortality by Race and Gender
• Race
– From 1996 to 2005, there was a 23% decline in age-adjusted stroke death rates in blacks, yet stroke remained the second leading cause of death in blacks. Among whites, a 26% decline moved stroke from second to fourth leading cause of death.
• Gender
– Stroke dropped from third to fifth cause of death in men. Among women, stroke remained the second leading cause of death.
6 ©2013 American Heart Association, Inc. All rights reserved. Unauthorized use prohibited.
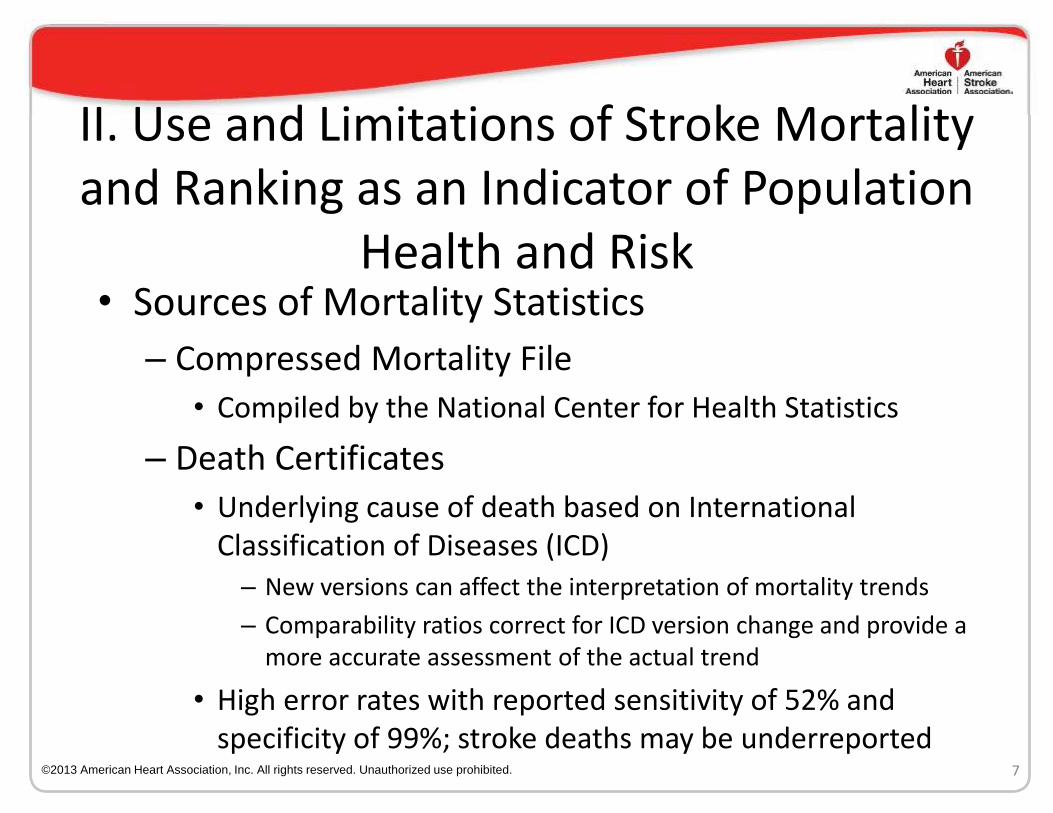
II. Use and Limitations of Stroke Mortality and Ranking as an Indicator of Population
Health and Risk • Sources of Mortality Statistics
– Compressed Mortality File
• Compiled by the National Center for Health Statistics
– Death Certificates
• Underlying cause of death based on International Classification of Diseases (ICD) – New versions can affect the interpretation of mortality trends
– Comparability ratios correct for ICD version change and provide a more accurate assessment of the actual trend
• High error rates with reported sensitivity of 52% and specificity of 99%; stroke deaths may be underreported
7 ©2013 American Heart Association, Inc. All rights reserved. Unauthorized use prohibited.

Age-Adjusted Death Rates for Cerebrovascular Disease by Year—United States, 1900-2010
8
ICD 1 1900-1909
ICD 2 1910-1920
ICD 3 1921-1929
ICD 4 1930-1938
ICD 5 1939-1948
ICD 6 1949-1959
ICD 7 1960-1967
ICD 8 1968-1978
ICD 9 1979-1998
ICD 10 1999-2009
Diseases were classified to the International Classification of Disease codes in use at the time the deaths were reported.
Rates per 100,000 population, standardized to the U.S. 2000 standard population
©2013 American Heart Association, Inc. All rights reserved. Unauthorized use prohibited.

III. Recurrent and Incident Strokes
• Assessment of stroke mortality includes
– Case fatality, in-hospital mortality, 30-day mortality, 1-year mortality, and various definitions across studies
• 30-day mortality rate near double for recurrent stroke
• Early mortality often related to index stroke
• Later mortality often related to cardiovascular disease – Recommendation that ischemic stroke be included in cardiac
risk assessment models as survivors are more likely to die from a cardiovascular event
9 ©2013 American Heart Association, Inc. All rights reserved. Unauthorized use prohibited.
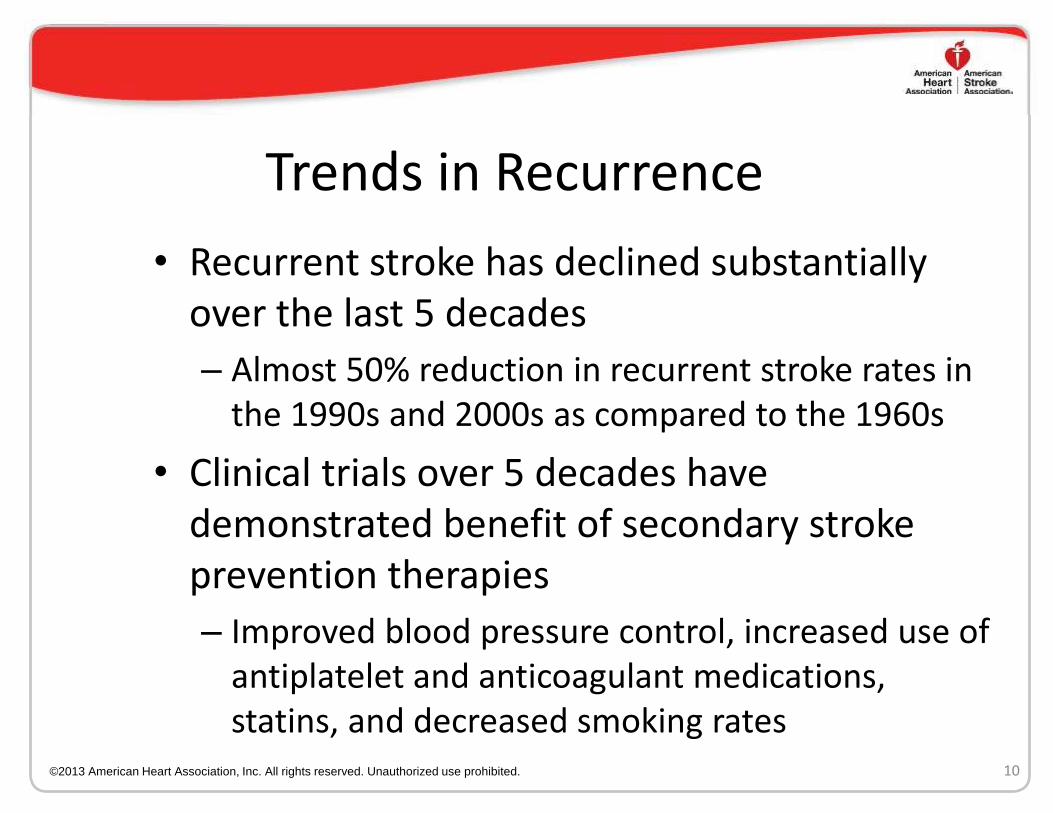
Trends in Recurrence
• Recurrent stroke has declined substantially over the last 5 decades
– Almost 50% reduction in recurrent stroke rates in the 1990s and 2000s as compared to the 1960s
• Clinical trials over 5 decades have demonstrated benefit of secondary stroke prevention therapies
– Improved blood pressure control, increased use of antiplatelet and anticoagulant medications, statins, and decreased smoking rates
10 ©2013 American Heart Association, Inc. All rights reserved. Unauthorized use prohibited.
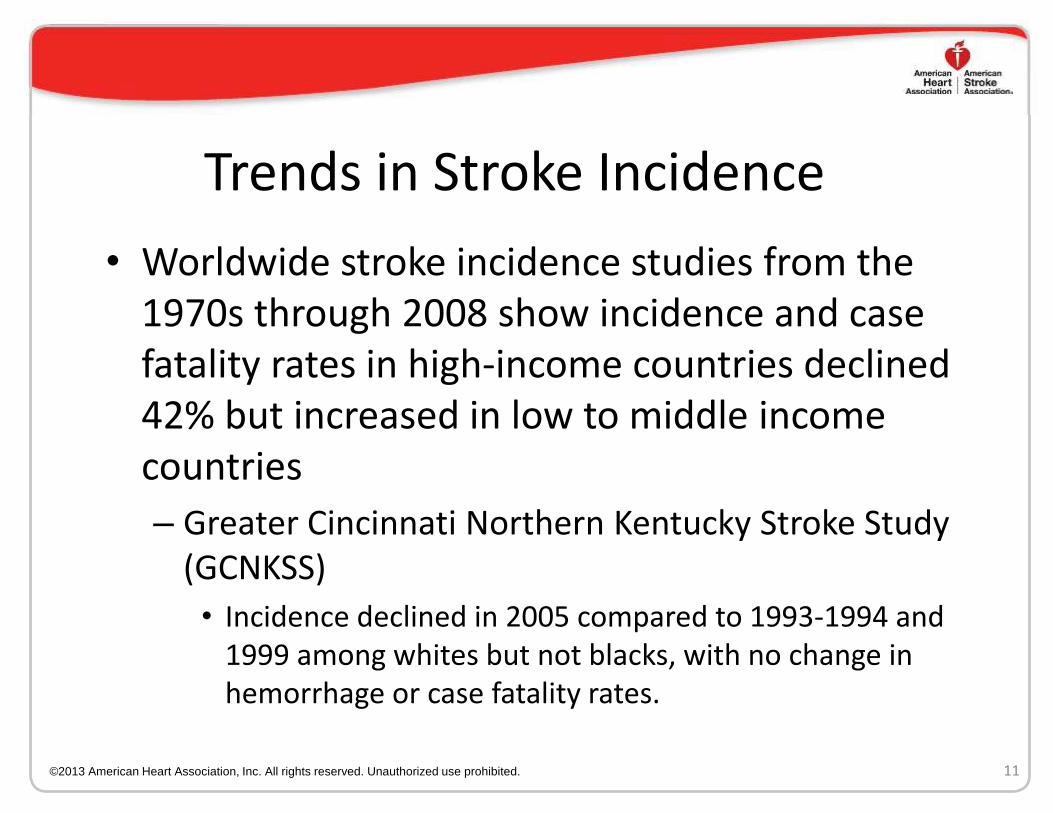
Trends in Stroke Incidence
• Worldwide stroke incidence studies from the 1970s through 2008 show incidence and case fatality rates in high-income countries declined 42% but increased in low to middle income countries
– Greater Cincinnati Northern Kentucky Stroke Study (GCNKSS)
• Incidence declined in 2005 compared to 1993-1994 and 1999 among whites but not blacks, with no change in hemorrhage or case fatality rates.
11 ©2013 American Heart Association, Inc. All rights reserved. Unauthorized use prohibited.
IV. Changes in Pulmonary and Lung Disease on the Assessment of Stroke Mortality Trends
and Ranking
• Chronic Lower Respiratory Disease (CLRD)
– Mortality rates slowly increased 1979-1999 then declined from 2000-2008
• Stroke Mortality Rates
– Declined steadily over the past 100 years
• 1/2% per year until the 1970s when rate of decline accelerated to 5% per year
• These mortality trends for CLRD and Stroke resulted in a change in the ranking
12 ©2013 American Heart Association, Inc. All rights reserved. Unauthorized use prohibited.

Figure 4: Age-adjusted death rates for Stroke and CLRD, by year—United States, 1979-2010
13
Rates per 100,000 population, standardized to the U.S. 2000 standard population
©2013 American Heart Association, Inc. All rights reserved. Unauthorized use prohibited.
V. Hypertension as a Factor in the Decline in Stroke Mortality
• Society of Actuaries first recognized the association of blood pressure levels and risk of stroke in the 1920s.
• Evidence for the benefits of lower blood pressure and reduced stroke risks is strong, continuous, graded, consistent, independent, predictive, and etiologically significant for those with and without coronary heart disease
14 ©2013 American Heart Association, Inc. All rights reserved. Unauthorized use prohibited.

Hypertension, Continued
• High blood pressure recognition and reduction campaigns are associated with the US age-adjusted stroke mortality rate reduction from 88 in 1950 to 23/100,000 in 2010
– Blood pressure reduction strategies
• Clinical interventions
• Public health efforts focused on lifestyle modification – Obesity, high alcohol intake, sodium intake, healthier diets,
physical activity, and smoking cessation
15 ©2013 American Heart Association, Inc. All rights reserved. Unauthorized use prohibited.

Prevalence of HTN
• Global estimates of 1 billion individuals and 7.1 million deaths attributable to HTN
• National Health and Nutrition Examination Survey (NHANES) estimates 68 million Americans have HTN
– 70% treated
– 46% controlled to below 140/90 mmHg
– Median SBP declined 16 mmHg between 1959 and 2010
16 ©2013 American Heart Association, Inc. All rights reserved. Unauthorized use prohibited.

Prevalence of HTN (Continued)
17
TABLE 1
YEAR SBP (Hg)
1960-62 131 mm
1971-74 129 mm
1976-81 126 mm
1988-91 119 mm
1988-94 121 mm
1999-04 123 mm
2001-08 122 mm
Mean Systolic Blood Pressure (SBP) by Time Period NHANES I-IV
Mean SBP for the US adult population declined from 131 mmHg in 1960 to 122 mmHg in 2008.
©2013 American Heart Association, Inc. All rights reserved. Unauthorized use prohibited.
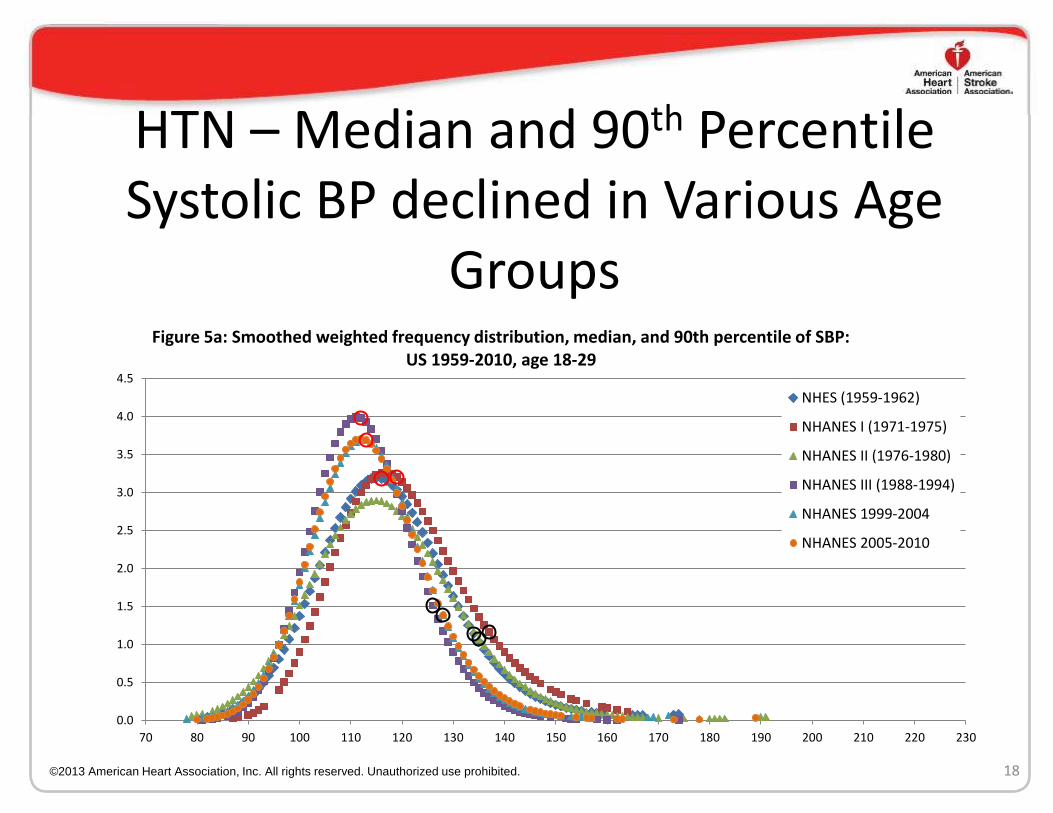
HTN – Median and 90th Percentile Systolic BP declined in Various Age
Groups
18
0.0
0.5
1.0
1.5
2.0
2.5
3.0
3.5
4.0
4.5
70 80 90 100 110 120 130 140 150 160 170 180 190 200 210 220 230
Figure 5a: Smoothed weighted frequency distribution, median, and 90th percentile of SBP: US 1959-2010, age 18-29
NHES (1959-1962)
NHANES I (1971-1975)
NHANES II (1976-1980)
NHANES III (1988-1994)
NHANES 1999-2004
NHANES 2005-2010
©2013 American Heart Association, Inc. All rights reserved. Unauthorized use prohibited.

HTN – Median and 90th Percentile Systolic BP Declined in Various Age Groups
19
0.0
0.5
1.0
1.5
2.0
2.5
3.0
3.5
4.0
4.5
70 80 90 100 110 120 130 140 150 160 170 180 190 200 210 220 230
Figure 5b: Smoothed weighted frequency distribution, median, and 90th percentile of SBP: US 1959-2010, age 18-59
NHES (1959-1962)
NHANES I (1971-1975)
NHANES II (1976-1980)
NHANES III (1988-1994)
NHANES 1999-2004
NHANES 2005-2010
©2013 American Heart Association, Inc. All rights reserved. Unauthorized use prohibited.

HTN – Median and 90th Percentile Systolic BP Declined in Various Age Groups
20
0.0
0.5
1.0
1.5
2.0
2.5
3.0
3.5
4.0
4.5
70 80 90 100 110 120 130 140 150 160 170 180 190 200 210 220 230
Figure 5c: Smoothed weighted frequency distribution, median, and 90th percentile of SBP: US 1959-2010, age 30-59
NHES (1959-1962)
NHANES I (1971-1975)
NHANES II (1976-1980)
NHANES III (1988-1994)
NHANES 1999-2004
NHANES 2005-2010
©2013 American Heart Association, Inc. All rights reserved. Unauthorized use prohibited.

HTN – Median and 90th Percentile Systolic BP Declined in Various Age Groups
21
0.0
0.5
1.0
1.5
2.0
2.5
3.0
3.5
4.0
4.5
70 80 90 100 110 120 130 140 150 160 170 180 190 200 210 220 230
Figure 5d: Smoothed weighted frequency distribution, median, and 90th percentile of SBP: US 1959-2010, age 60-74
NHES (1959-1962)
NHANES I (1971-1975)
NHANES II (1976-1980)
NHANES III (1988-1994)
NHANES 1999-2004
NHANES 2005-2010
©2013 American Heart Association, Inc. All rights reserved. Unauthorized use prohibited.

Summary - HTN
• Declining shift in BP distribution consistent for different age groups
• Population-wide changes in reduced blood pressures associated with large accelerated reductions in stroke mortality
• Shift in mean arterial blood pressure is more pronounced in older Americans than younger Americans
22 ©2013 American Heart Association, Inc. All rights reserved. Unauthorized use prohibited.
HTN – Risk of Stroke begins at BP below 140/90 mmHg
• Meta-analysis of 61 prospective studies observed 1M adults between the ages of 40-69 years with starting BP of 115/75 mmHg
• Each incremental 20 mmHg (SBP) and 10 mmHg (DBP) was associated with a 2x increase in stroke death rates
• This effect is seen in all decades of life.
23 ©2013 American Heart Association, Inc. All rights reserved. Unauthorized use prohibited.

HTN – Age-Related Increase in SBP Responsible for Increase in Incidence and Prevalence of HTN
• Framingham Heart Study: Lifetime risk of HTN to be ~ 90% for men and women who were non-HTN at 55-65 years and survived to age 80-85.
• 4-year rates of progression to HTN for 65 years and older
- 50% with BP in 130-139/85-89 mmHg range
- 26% with BP in 120-129/80-84 mmHg range
24 ©2013 American Heart Association, Inc. All rights reserved. Unauthorized use prohibited.

HTN – Extreme HBP Levels Contributed Less to Overall Stroke Mortality Decrease
• Extreme BP levels are more prevalent among high stroke risk populations, such as African Americans
• Values have been reduced with treatment with corresponding risk reduction
• HTN emergencies, crises, and malignant HTN represent up to 2% of HBP population
• Summary – Lowering extreme HBP levels has impact on the decline in stroke mortality. But it should be considered less because of low number of affected people.
25 ©2013 American Heart Association, Inc. All rights reserved. Unauthorized use prohibited.

HTN – Observational Studies
• Higher the BP = Increase in stroke mortality rate
• 34.6% for HTN: INTERSTROKE study concluded the contribution of various stroke factors to the burden of stroke worldwide
• 45% of all strokes attributed to uncontrolled BP
• HBP identified as responsible for largest number of cardiovascular and stroke deaths in US
26 ©2013 American Heart Association, Inc. All rights reserved. Unauthorized use prohibited.

HTN – Clinical Trials: Benefit of HTN Treatment to Reduce Stroke Risks
• In clinical trials, antihypertensive therapy has been associated with reductions
– Stroke incidence averaging 35-40%
– Myocardial infarction 20-25%
– Heart failure more than 50%
Clinical trials have demonstrated that control of isolated systolic hypertension reduces total and stroke mortality
Reducing SBP even if BP control levels are not achieved improves risks and outcomes.
27 ©2013 American Heart Association, Inc. All rights reserved. Unauthorized use prohibited.

HTN – Clinical Trials • ALLHAT and CONVINCE trials show DBP control rates
exceeded 90% but SBP control rates were considerably less (60-70%).
• Hypertension Detection and Follow-up Program (HDFP) showed that reductions of 4.7 mmHg reduced stroke mortality by 17.6%.
• Meta-analysis (32 trials)
- confirmed HTN treatment reduces stroke risks
- showed substantial stroke risk reduction with tight BP
control and lowered BP levels
- determined a 41% reduction in stroke risks with systolic BP reductions of 10 mmHg
28
©2013 American Heart Association, Inc. All rights reserved. Unauthorized use prohibited.
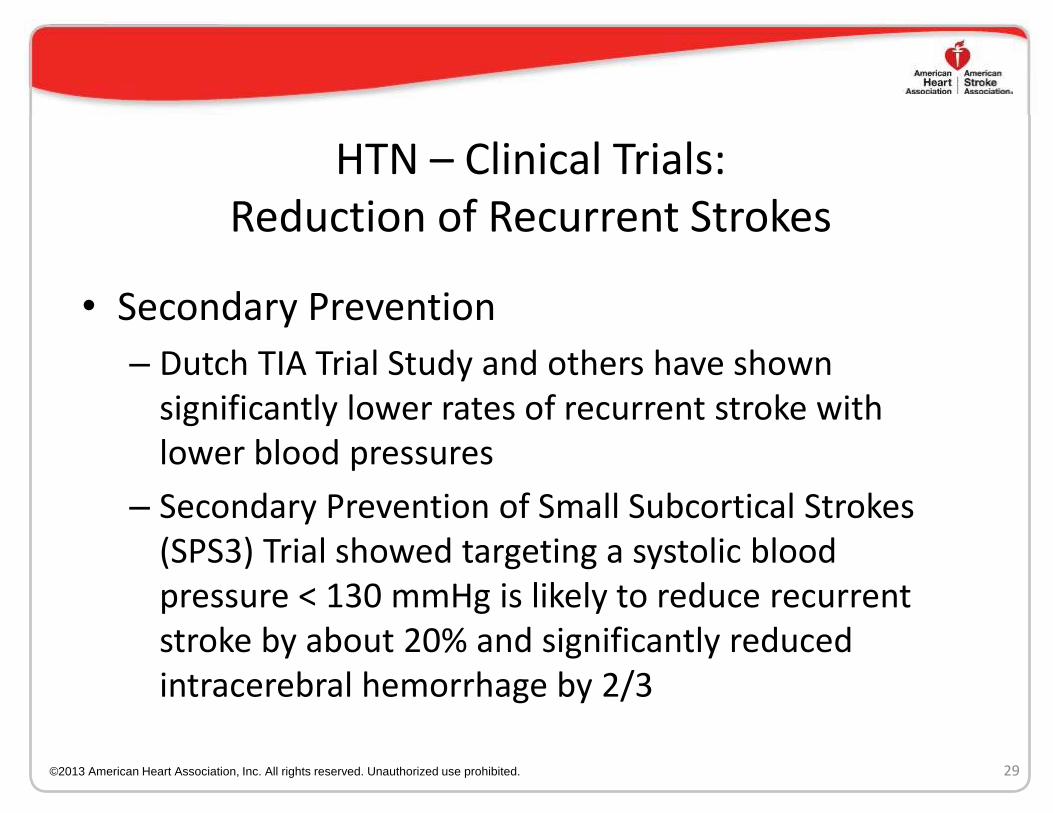
HTN – Clinical Trials: Reduction of Recurrent Strokes
• Secondary Prevention
– Dutch TIA Trial Study and others have shown significantly lower rates of recurrent stroke with lower blood pressures
– Secondary Prevention of Small Subcortical Strokes (SPS3) Trial showed targeting a systolic blood pressure < 130 mmHg is likely to reduce recurrent stroke by about 20% and significantly reduced intracerebral hemorrhage by 2/3
29 ©2013 American Heart Association, Inc. All rights reserved. Unauthorized use prohibited.

HTN – Treatment Guidelines
• JNC’s BP treatment guidelines have included recommendations focused on lowering HTN-related conditions including stroke.
• With each set of JNC guidelines, the BP level for treatment and goals has typically been lowered, possibly impacting the population BP levels as SBPs have been lower (Table 1).
30
TABLE 1
YEAR SBP (Hg)
1960-62 131 mm
1971-74 129 mm
1976-81 126 mm
1988-91 119 mm
1988-94 121 mm
1999-04 123 mm
2001-08 122 mm
©2013 American Heart Association, Inc. All rights reserved. Unauthorized use prohibited.

HTN – Structured Programs to Lower Stroke Risks
• Structured programs are used to implement public health programs that focus on decreasing blood pressure and therefore stroke risks
• Programs are aimed at working with manufacturers, restaurants, and food procurement policymakers to decrease stroke risk factors via
– Reduction of salt in prepared and processed food
– Encouragement of fresh produce consumption
– Increasing community participation in physical activity
– Detecting and tracking HBP at community places
31 ©2013 American Heart Association, Inc. All rights reserved. Unauthorized use prohibited.
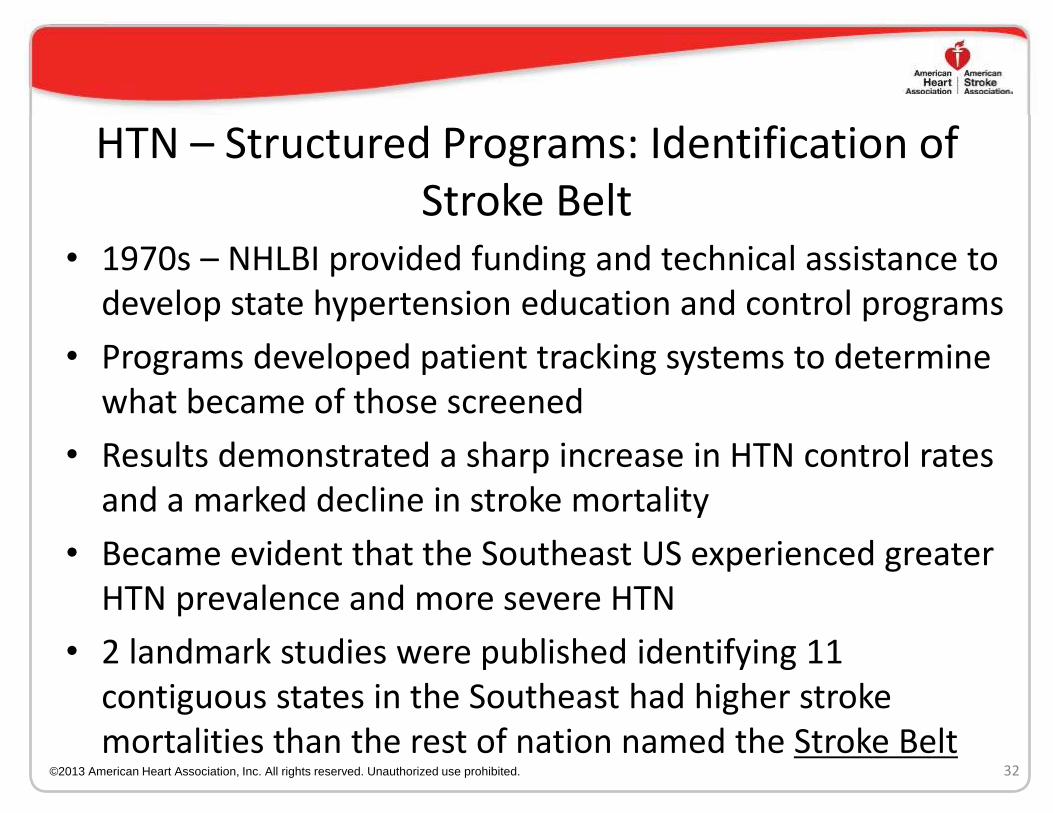
HTN – Structured Programs: Identification of Stroke Belt
• 1970s – NHLBI provided funding and technical assistance to develop state hypertension education and control programs
• Programs developed patient tracking systems to determine what became of those screened
• Results demonstrated a sharp increase in HTN control rates and a marked decline in stroke mortality
• Became evident that the Southeast US experienced greater HTN prevalence and more severe HTN
• 2 landmark studies were published identifying 11 contiguous states in the Southeast had higher stroke mortalities than the rest of nation named the Stroke Belt
32 ©2013 American Heart Association, Inc. All rights reserved. Unauthorized use prohibited.
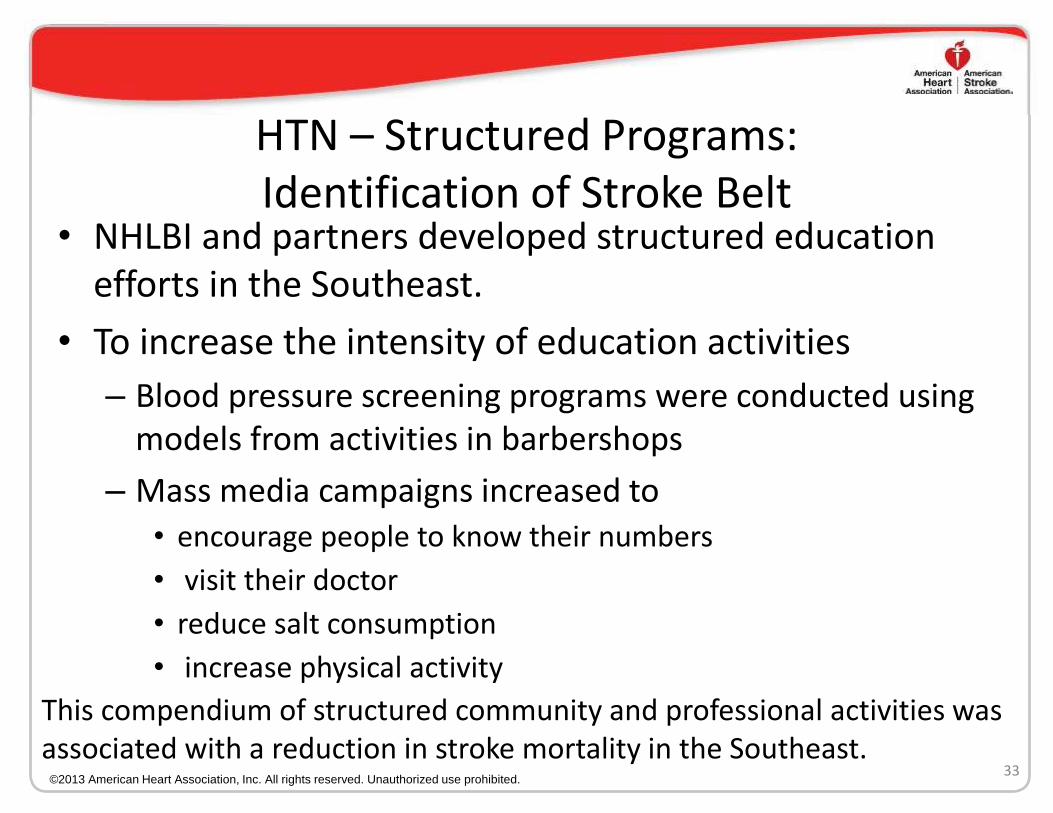
HTN – Structured Programs: Identification of Stroke Belt
• NHLBI and partners developed structured education efforts in the Southeast.
• To increase the intensity of education activities
– Blood pressure screening programs were conducted using models from activities in barbershops
– Mass media campaigns increased to • encourage people to know their numbers
• visit their doctor
• reduce salt consumption
• increase physical activity
33
This compendium of structured community and professional activities was associated with a reduction in stroke mortality in the Southeast.
©2013 American Heart Association, Inc. All rights reserved. Unauthorized use prohibited.

HTN – Research Gaps and Considerations
• How to lower the number of hypertension-related ICH cases in older age-groups currently using antithrombiotics
• An increase in prevalence of amyloid angiopathy among aging population could lead to an increase in the number of ICH cases
• Studying cerebral microbleeds (CMB) and HTN as it relates to increased stroke risks has the potential to be an important biomarker
• These studies also facilitate disparities as significant racial differences in CMB prevalence in ICH.
34 ©2013 American Heart Association, Inc. All rights reserved. Unauthorized use prohibited.

HTN – Summary “Higher BP = Greater Stroke Risk”
• Observational epidemiological study findings are consistent with clinical trial findings that BP reduction results in lower stroke mortality rates
• Major determinant for decrease in stroke prevalence and mortality decrease in BP with drug therapy
35 ©2013 American Heart Association, Inc. All rights reserved. Unauthorized use prohibited.

VI. Contribution of Diabetes Treatment and Control on Decline in Stroke
36 ©2013 American Heart Association, Inc. All rights reserved. Unauthorized use prohibited.

Diabetes Treatment and Effect on Stroke Prevalence
• Diabetes mellitus is a risk factor for stroke and stroke mortality
• Diabetes prevalence has been increasing in US and the world
• Sparse data are available regarding trends in population prevalence of diabetes treatment or treatment intensity
• Temporal effect of changes in diabetes treatment on risk of stroke death cannot be determined
37 ©2013 American Heart Association, Inc. All rights reserved. Unauthorized use prohibited.

Diabetes Treatment and Effect on Stroke Prevalence (continued)
• Ischemic stroke prevalence has decreased
• Yet individuals with ischemic stroke and co-morbid diabetes has increased
38 ©2013 American Heart Association, Inc. All rights reserved. Unauthorized use prohibited.

Diabetes Treatment and Effect on Stroke Prevalence (continued)
• Ischemic stroke incidences have decreased in US
• Acute ischemic stroke (AIS) hospitalizations in us from 1997-2006 showed a decline by 17%
• Ischemic stroke and co-morbid diabetes incidences have increased in US
• AIS hospitalizations with co-morbid type 2 diabetes rose by 27% from 1997-2006
39
ISCHEMIC STROKE ALONE ISCHEMIC STROKE/DIABETES
©2013 American Heart Association, Inc. All rights reserved. Unauthorized use prohibited.

Diabetes Treatment and Effect on Stroke Prevalence (continued)
• The rise in comorbid diabetes over time was more pronounced in patients who were relatively younger, Black or ‘other race’, on Medicaid, or admitted to hospitals located in the South
• Factors independently associated with higher odds of diabetes in acute ischemic stroke patients were Black or ‘other’ vs. White race, congestive heart failure, peripheral vascular disease, history of myocardial infarction, renal disease, and HTN.
40 ©2013 American Heart Association, Inc. All rights reserved. Unauthorized use prohibited.

Diabetes Treatment and Effect on Stroke
Prevalence (continued) • Main thrust of diabetes research treatment –
Investigate whether tight glucose treatment would improve long-term outcomes
• Meta-analysis (5 interventional studies) showed that tight glucose control did affect MI and CAD events, but had no consistent effect on stroke events.
• There was a suggestion that tight glucose control may increase mortality according to ACCORD trial results.
41 ©2013 American Heart Association, Inc. All rights reserved. Unauthorized use prohibited.

Diabetes Treatment and ACCORD study
• ACCORD sub-study found that patients with type 2 diabetes had reduced risk for stroke if blood pressure was tightly controlled.
• ACCORD and other studies suggest that multi-factorial risk factor intervention and tight blood pressure control lowers risk for stroke in patients with diabetes.
42 ©2013 American Heart Association, Inc. All rights reserved. Unauthorized use prohibited.

Summary Diabetes Treatment and Effect on Stroke
Prevalence
• Tight glucose control for type 2 diabetic patients has not been shown to reduce mortality from stroke (based on a meta-analysis) and in fact led to a higher mortality in one large RCT
• Multi-factorial risk factor intervention in diabetic patients, especially blood pressure control, has been shown to reduce mortality and stroke
43 ©2013 American Heart Association, Inc. All rights reserved. Unauthorized use prohibited.

VII. Contribution of Atrial Fibrillation (AF) Treatment and Control on Decline
in Stroke Mortality
44 ©2013 American Heart Association, Inc. All rights reserved. Unauthorized use prohibited.

Atrial Fibrillation Treatment Effect on Stroke Mortality Decline
• Data on trends in age-adjusted prevalence of AF are limited by ascertainment bias
– Framingham study showed increasing trend in prevalence of AF among men aged 65-84 years
• 2% in 1968-70 to 5.3% in 1987-1989 (p=0.08)
• Anticoagulation with warfarin for AF reduces fatal and non-fatal stroke by approximately 50%
• Between 2003 and 2009, Get with the Guidelines showed anticoagulation for AF increased from 28% to 69%
45 ©2013 American Heart Association, Inc. All rights reserved. Unauthorized use prohibited.

Atrial Fibrillation Treatment Effect on Stroke Mortality Decline, Continued
• Further data are needed on temporal trends in age-adjusted AF prevalence
• Post-marketing surveillance to monitor use and clinical outcomes of newer oral anticoagulants
– Available data suggest that newer oral anticoagulants may have a greater effect than warfarin on reducing stroke mortality from AF
46 ©2013 American Heart Association, Inc. All rights reserved. Unauthorized use prohibited.

Atrial Fibrillation (AF) Treatment Effect on Stroke Mortality Decline, Continued
• Unclear whether AF prevalence or treatment has resulted in reduction of stroke mortality
– Competing effects
• Increasing prevalence of AF
• Improved treatment of AF
• Warfarin as routine treatment of AF was not actively used until the last decade
47 ©2013 American Heart Association, Inc. All rights reserved. Unauthorized use prohibited.

VIII. Contribution of Hyperlipidemia Treatment and Control on Decline in
Stroke Mortality
48 ©2013 American Heart Association, Inc. All rights reserved. Unauthorized use prohibited.

Recent Trends in Dyslipidemia Prevalence in the United States
• Dyslipidemia remains highly prevalent in the United States
• NHANES population
– Total Cholesterol ≥240 mg/dL decreased
• 20.5% in 1988-94 to 14.2% in 2005-10
– Mean low-density lipoprotein cholesterol (LDL-C)
• 134 mg/dL in 1976-80 to 119 mg/dL in 1999-2006
• Estimated 33.5 million adults >20 years have total cholesterol levels ≥240 mg/dL
49 ©2013 American Heart Association, Inc. All rights reserved. Unauthorized use prohibited.

Recent Trends in Dyslipidemia Prevalence in the United States
• Improvements in dyslipidemia control have not been uniform across demographic strata
– Disparity of LDL-C rates of control
• Age (lower in younger age groups): 13.9% in 20- to 49-year old adults vs. 30.3% in adults ≥65 years
• Race: Non-Hispanic blacks 17.2%; Mexican-Americans 16.5%; compared to Non-Hispanic whites 26.9%
• Gender: Men 22.6%; Women 28.0%
• Insurance: Insured 31%; uninsured 7%
– High-density lipoprotein cholesterol (HDL-C) and triglyceride levels have not improved in 30 years
– Triglycerides worsened (130 to 146 mg/dL, trending upward with the rise in obesity.
50 ©2013 American Heart Association, Inc. All rights reserved. Unauthorized use prohibited.

Association between Dyslipidemia and Stroke Incidence
• High LDL-C and low HDL-C lack clear association with stroke risk
• Positive association with ischemic stroke and negative association with hemorrhagic stroke
• Heterogeneity of ischemic stroke mechanisms
• Must take into account the use of medications
• Dyslipidemia is a risk factor for large vessel intra- and extracranial atherosclerosis and lacunar stroke, but not cardioembolic stroke
• Low LDL-C and triglycerides may increase risk of hemorrhagic stroke
51 ©2013 American Heart Association, Inc. All rights reserved. Unauthorized use prohibited.

Association between Dyslipidemia and Stroke Severity and Mortality
• Dyslipidemia has been associated with lower mortality after ischemic stroke
– Non-cardioembolic strokes are less severe and have better prognoses than cardioembolic strokes
– Use of medications, such as statins, may impact severity or prognosis from stroke
• Low total cholesterol, triglyceride, and LDL-C associated with higher risk of death after ICH
– Cholesterol protective against hematoma growth
– Maintains vessel integrity and resistance to rupture 52 ©2013 American Heart Association, Inc. All rights reserved. Unauthorized use prohibited.

Effects of Lipid-lowering Therapy on Stroke Incidence and Mortality
• Use of statins consistently shows reduction in incidence of ischemic stroke
• Beneficial impact of statins on ischemic stroke might be partially offset by suggested increased risk of hemorrhagic stroke
– Association between statin therapy and ICH is not consistent
• Multiple systematic reviews and meta-analyses revealed statins were not associated with an increased risk of ICH
53 ©2013 American Heart Association, Inc. All rights reserved. Unauthorized use prohibited.

Effects of Lipid-Lowering Therapy on Stroke Incidence and Mortality, Continued
• Statins show no significant effects on mortality from first stroke or incidence of first non-fatal hemorrhagic stroke
– Significant reduction in first nonfatal ischemic stroke with a 23% reduction per 1.0 mmol/L reduction in LDL-C
• Statin therapy in acute setting may have a beneficial impact on survival
• Effect of fibrate therapy on stroke incidence and mortality is unclear
54 ©2013 American Heart Association, Inc. All rights reserved. Unauthorized use prohibited.

IX. Contribution of Aspirin and Other Antiplatelet Drugs to Decline in Stroke
Mortality
55 ©2013 American Heart Association, Inc. All rights reserved. Unauthorized use prohibited.

Effects of Antiplatelet Drugs on Decline in Stroke Mortality, Continued
• Increased aspirin use has probably had a moderate impact on stroke mortality
– Secondary prevention of ischemic stroke incidence
– Reducing the stroke case fatality rate when used acutely
• Clopidogrel or combination of aspirin and sustained-release dipyridamole likely has no impact on reducing stroke mortality as their effects on fatal stroke are so similar to aspirin
56 ©2013 American Heart Association, Inc. All rights reserved. Unauthorized use prohibited.

Effects of Antiplatelet Drugs on Decline in Stroke Mortality
• Use of aspirin following acute ischemic stroke is well established without opportunity for improvement
• In outpatient setting, large number of individuals with known cardiovascular disease are not taking aspirin
– Opportunity exists to further reduce incidence of mortality rate from stroke
57 ©2013 American Heart Association, Inc. All rights reserved. Unauthorized use prohibited.

X. Contribution of Neurological and Technical Advances in Stroke
Treatment on Decline in Stroke Mortality
58 ©2013 American Heart Association, Inc. All rights reserved. Unauthorized use prohibited.

Contribution of Neurological and Technical Advances in Stroke Treatment
• Technological advances, medical treatment options, and systems of delivering care have affected stroke mortality rates
• 1920s and 1930s: cerebral angiography
• 1940s and 1950s: measurement and assessment of cerebral flow metabolism
– Principles used currently for identifying mismatch between blood flow and tissue injury to identify patients for reperfusion therapies
59 ©2013 American Heart Association, Inc. All rights reserved. Unauthorized use prohibited.

Contribution of Neurological and Technical Advances in Stroke Treatment, Continued
• 1950s: Carotid Endarterectomy and Prosthetic Heart Valves for Rheumatic Heart Disease
– Reduced incidence of stroke from carotid stenosis
– Reduced risk for embolic stroke
• 1960s: Doppler Ultrasonography
– Enhanced technology permitted the use of transcranial sonography
• Proven useful in sickle cell disease
60 ©2013 American Heart Association, Inc. All rights reserved. Unauthorized use prohibited.

Neurological and Technical Advances in Stroke Treatment, Continued
• 1970s: Computed Tomography (CT)
– Main diagnostic tool available for evaluation of brain injury; essential component of all acute treatment protocols
– There is insufficient evidence identifying a relationship between MRI imaging and stroke mortality
• 1990s: tissue plasminogen activator (rtPA) approved by FDA and endovascular therapy become available
61 ©2013 American Heart Association, Inc. All rights reserved. Unauthorized use prohibited.
XI. Contribution of Tissue Plasminogen Activator (rtPA) Use on Decline in
Stroke Mortality
62 ©2013 American Heart Association, Inc. All rights reserved. Unauthorized use prohibited.
rtPA Use on Decline in Stroke Mortality
• Use of rtPA is unlikely to have contributed to decline in stroke mortality rates
– Randomized controlled trials failed to show that IV rtPA prevents post-stroke death, although it does prevent post-stroke disability
– Small proportion of ischemic stroke patients treated with rtPA
• Increased from 1.1% in 2004-2005 to 3.4% in 2009
63 ©2013 American Heart Association, Inc. All rights reserved. Unauthorized use prohibited.

XII. Contribution of Stroke Systems of Care (Telemedicine, Stroke
Units/Teams, Primary and Secondary Stroke Centers) on Decline in Stroke
Mortality
64 ©2013 American Heart Association, Inc. All rights reserved. Unauthorized use prohibited.

Contribution of Stroke Systems of Care on Decline in Stroke Mortality
• Primary or Comprehensive Stroke Centers and Stroke Systems of Care
– Primary stroke centers (PSC) may have lower rates of mortality at discharge compared to non-stroke centers, although outcomes were better even prior to certification
• Certification did not produce reduced mortality rates
– 11 major criteria for establishing PSCs are not associated with changes in stroke mortality
65 ©2013 American Heart Association, Inc. All rights reserved. Unauthorized use prohibited.

Stroke Systems of Care on Decline in Stroke Mortality
• Stroke Units/Stroke Teams
– Systematic review of acute stroke units found lower rates of death when patients were treated in dedicated stroke units
– Stroke consult teams have been shown to reduce length of stay and urinary tract infections, but no change in stroke mortality
66 ©2013 American Heart Association, Inc. All rights reserved. Unauthorized use prohibited.
Stroke Systems of Care on Decline in Stroke Mortality Continued
• Telemedicine
– Geographic barriers exist in treatment of acute stroke patients
• High-quality video teleconferencing is reasonable for performing a general neurological exam and a non-acute NIHSS assessment
• FDA-approved teleradiology systems are recommended for timely review of CT scans
• If stroke specialist is not immediately available, high-quality video teleconferencing can facilitate appropriate use of IV rtPA
67 ©2013 American Heart Association, Inc. All rights reserved. Unauthorized use prohibited.
XIII. Contribution of Smoking and Other Respiratory Conditions on
Decline in Stroke Mortality
68 ©2013 American Heart Association, Inc. All rights reserved. Unauthorized use prohibited.

Contribution of Smoking on Decline in Stroke Mortality
• Cigarette smoking is an independent risk factor for stroke and abstention from smoking after stroke is associated with better outcomes
• Any decline in prevalence of smoking would contribute to the decline in stroke mortality
69 ©2013 American Heart Association, Inc. All rights reserved. Unauthorized use prohibited.

Contribution of Smoking on Decline in Stroke Mortality, Continued
• Prevalence of Smoking
– Declined from 42% in 1965 to 19% in 2010
– Increased from non-existent to 42% between 1900 and 1965
• continued decline in stroke mortality in same time period
• Second-hand smoke exposure retrospective studies show significant relationship to stroke, but prospective studies have not reported positive association to stroke risk
70 ©2013 American Heart Association, Inc. All rights reserved. Unauthorized use prohibited.

Contribution of Smoking and Post-Stroke Pneumonia on Decline in Stroke Mortality
• Enactment of smoke-free policies in work and public settings has been suggested to reduce stroke hospital admissions, but effect on stroke mortality rates has not been assessed
• Reduction in post-stroke pneumonia would result in decreased case-fatality rates
– Lack of available studies
71 ©2013 American Heart Association, Inc. All rights reserved. Unauthorized use prohibited.
Contribution of Obstructive Sleep Apnea (OSA) on Decline in Stroke Mortality
• OSA is increasing in the US (due to the rising obesity epidemic) and is an independent risk factor for ischemic stroke and combined endpoint of stroke and death
– OSA is associated with post-stroke mortality.
– OSA treatment with continuous positive air pressure (CPAP) reduces cardiovascular events
– OSA is underdiagnosed and there is poor compliance with the use of CPAP
72 ©2013 American Heart Association, Inc. All rights reserved. Unauthorized use prohibited.

XIV. Air Pollution and Environmental Factors on Decline in Stroke Mortality
73 ©2013 American Heart Association, Inc. All rights reserved. Unauthorized use prohibited.
Air Pollution and Environmental Factors on Decline in Stroke Mortality
• The Clean Air Act and implementation of clean air standards have resulted in significant reduction in particulate matter (PM) over time
• Inconclusive epidemiologic evidence of a causal effect of PM on stroke mortality
– Pollution levels increased from 1900-1970 while stroke mortality was declining.
– Short-term PM exposure was associated with an increased stroke risk and mortality.
– Long-term PM exposure studies (in the US) have not been consistent in association with risk of stroke, mortality, or both.
©2013 American Heart Association, Inc. All rights reserved. Unauthorized use prohibited.

XV. Contribution of Exercise on Decline in Stroke Mortality
75 ©2013 American Heart Association, Inc. All rights reserved. Unauthorized use prohibited.
Contribution of Exercise on Decline in Stroke Mortality
• Few studies have examined the role of physical activity and stroke mortality
• Significant inverse associations between cardiorespiratory fitness and age-adjusted data, nonfatal, and total stroke rates found in both women and men
76 ©2013 American Heart Association, Inc. All rights reserved. Unauthorized use prohibited.
Contribution of Exercise on Decline in Stroke Mortality, Continued
• Prevalence of exercise by self report
– Leisure-time physical activity
• Decreased from 31% in 1988 to 25% in 2008
– Recommended levels of activity
• Increased slightly from 24% in 1990 to 25% in 1998
– No activity
• Decreased from 31% in 1990 to 29% in 1998
• Effect of physical activity on decline in stroke mortality may be minimal
77 ©2013 American Heart Association, Inc. All rights reserved. Unauthorized use prohibited.

XVI. Effect of Obesity and Body Mass Patterns on Decline in Stroke Mortality
78 ©2013 American Heart Association, Inc. All rights reserved. Unauthorized use prohibited.
Obesity and Body Mass Patterns on Decline in Stroke Mortality
• Obesity prevalence rates are rising in the US
– 36% of US adults are obese
– 33% of US adults are overweight
• Body mass index (BMI) association with stroke mortality
– Each 5 kg/m2 increase in BMI from 25-50 kg/m2 yielded 40% higher stroke mortality, any stroke subtype
• Mostly accounted for effects of BMI on blood pressure 79 ©2013 American Heart Association, Inc. All rights reserved. Unauthorized use prohibited.

XVII. Impact of Research and Program Funding on Decline in Stroke Mortality
80 ©2013 American Heart Association, Inc. All rights reserved. Unauthorized use prohibited.

Impact of Research and Program Funding on Decline in Stroke Mortality
• Benefit of lowering blood pressure reported in 1967 and 1969 Veterans Administration Cooperative Study on the Treatment of Hypertension
– Creation of the National High Blood Pressure Education Program
• Increased public awareness, treatment, and control of hypertension (see figures showing decline in median blood pressures by age group)
81 ©2013 American Heart Association, Inc. All rights reserved. Unauthorized use prohibited.
Impact of Research and Program Funding on Decline in Stroke Mortality, Continued
• Significant contribution to the reduction in stroke mortality accomplished
– Research findings on stroke risk and prevention
– Funding of studies
– Intervention programs
• Control rates for hypertension have improved six-fold during the last four decades
– Driven by an increase in public awareness and treatment
82 ©2013 American Heart Association, Inc. All rights reserved. Unauthorized use prohibited.

XVIII. Impact of Other Factors on Decline in Stroke Mortality
83 ©2013 American Heart Association, Inc. All rights reserved. Unauthorized use prohibited.

Impact of Other Factors on Decline in Stroke Mortality
• Sickle Cell Disease
– Increased risk of stroke among young African Americans
– Reduced stroke risk over past 2 decades
• Use of transcranial Doppler
• Transfusion therapy
• Salt Intake
– Reduced sodium intake associated with reduced stroke rates as well as improved blood pressure control
84 ©2013 American Heart Association, Inc. All rights reserved. Unauthorized use prohibited.
Impact of Other Factors on Decline in Stroke Mortality
• Adherence to Medical Regimens
– Impact seen through reduction in stroke risk factors
• Hypertension control and smoking cessation
• Diet
– Dietary Approaches to Stop Hypertension (DASH)
• Impact on long-term stroke mortality rates requires more data
85 ©2013 American Heart Association, Inc. All rights reserved. Unauthorized use prohibited.

XIX. Conclusions and Discussion
86 ©2013 American Heart Association, Inc. All rights reserved. Unauthorized use prohibited.

Conclusions and Discussion
• Stroke has moved from 3rd to 4th leading cause of death in the United States
• Decline seen in both genders as well as all races and age groups
• No marked increase in death rates from respiratory disease
87 ©2013 American Heart Association, Inc. All rights reserved. Unauthorized use prohibited.
Conclusions and Discussion, Continued
• Combination of different parameters and programs contributes to the significant decline
– Improved control of blood pressure has resulted in a significant and accelerated decline in stroke deaths
– Treatment and control of diabetes and hyperlipidemia contribute to decline
– Systems of care, rtPA use, smoking cessation, air pollution, exercise, atrial fibrillation, and other factors may play a small role in the decline in stroke deaths
88 ©2013 American Heart Association, Inc. All rights reserved. Unauthorized use prohibited.

Conclusions and Discussion, Continued
• The decline in stroke mortality is one of the major public health successes of the past 50 years.
• With implementation of evidence-based primary, secondary, and tertiary stroke prevention strategies, these trends should continue.
89 ©2013 American Heart Association, Inc. All rights reserved. Unauthorized use prohibited.