Getting Started with SPR - Bio-Rad
24
The Essentials for Successful Interactions Getting Started with SPR
Transcript of Getting Started with SPR - Bio-Rad

The Essentials for Successful InteractionsGetting Started with SPR

Even Einstein Asked QuestionsThis is a success guide that includes a variety of tips and tricks for obtaining optimal results from your surface plasmon resonance (SPR) experiments.
Read on to discover key tips, secrets, and recommended resources that no SPR experiment should be without.

Time to Regenerate Your Association
with Sensorgrams

Remember that certain descriptors, such as the association phase, show second-order kinetics while others, such as the dissociation phase, show first-order kinetics.
For the association kinetic constant (ka), the analyte concentration is necessary for the calculation.
For the dissociation kinetic constant (kd), no parameters are needed.
The equilibrium constant (KD) is dependent on the following equation:
Baseline
Association
Equilibrium
Dissociation
RegenerationRes
po
nse,
RU
Time, sec
kd
ka & kd
KD
KD
[ A ] [ B ][ AB ]
=

Bring Your Experimental Design
to the Surface
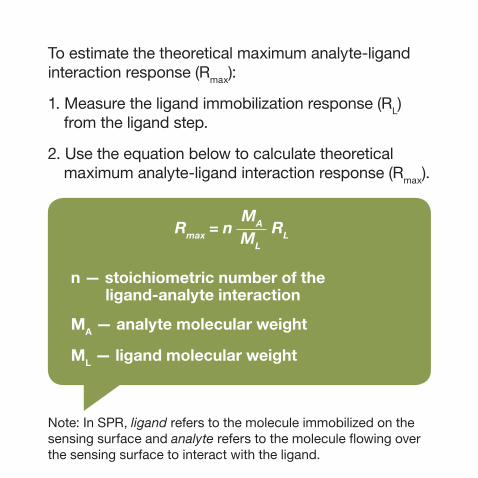
To estimate the theoretical maximum analyte-ligand interaction response (Rmax):
1. Measure the ligand immobilization response (RL) from the ligand step.
2. Use the equation below to calculate theoretical maximum analyte-ligand interaction response (Rmax).
n — stoichiometric number of the ligand-analyte interaction
MA — analyte molecular weight
ML — ligand molecular weight
Rmax RL
MA
ML
= n
Note: In SPR, ligand refers to the molecule immobilized on the sensing surface and analyte refers to the molecule flowing over the sensing surface to interact with the ligand.

For ligand immobilization, we recommend preparing the ligand in a concentration range of 0.5–25 µg/ml.
Use a slow flow rate of 30 µl/min to limit the amount of ligand used during immobilization steps.
You may also vary the contact time from 1–10 min, depending on the immobilization level needed.
The amount of ligand immobilized can be determined by the subsequent increase in response units in the corresponding sensorgram.

If your ligand is not binding or you are getting low analyte response, try using a capture surface instead of amine coupling for ligand immobilization. The capture surface uses a reagent to reversibly capture a ligand to the surface instead of covalently immobilizing the ligand. The advantages of this include:
1. Ligand can be captured in the correct orientation for optimal interaction with the analyte.
2. Easy removal of the ligand and regeneration of a new capture surface.
3. Capture surfaces can be used for capturing ligands from crude samples.

Make sure to choose the appropriate reference option for your experiment.
Channel referencing allows for reliable detection of analyte interaction with the surface and ligand.
Injection referencing is used in conjunction with channel referencing in certain applications, such as ligand capture surfaces, to correct for baseline drift.
For robust kinetics, at least three dose-responsive sensorgrams should be generated.
Choose sensorgrams that are from an analyte concentration in the range of 0.1–10 KD and that show good reproducibility.

A Bevy of Tips for Your Sensor Chips

To create a low density surface for a large protein ligand, use a low density chip (for instance, Bio-Rad’s ProteOn™ GLC chip).
When working with small molecules as your analyte, try a medium to high density sensor chip (for instance, Bio-Rad’s ProteOn GLM and ProteOn GLH chips).
If high sensitivity is your primary concern, use a high capacity sensor chip with a high analyte response (such as Bio-Rad’s ProteOn GLH chip).
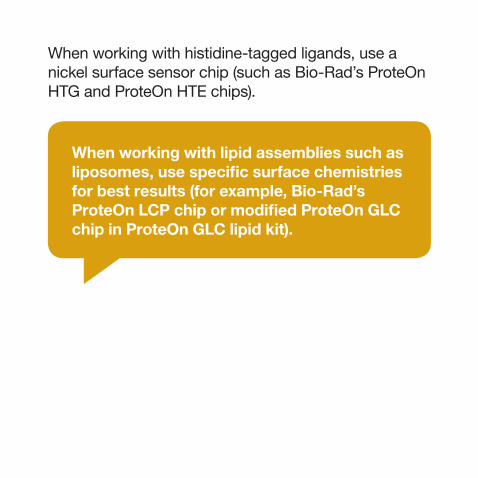
When working with histidine-tagged ligands, use a nickel surface sensor chip (such as Bio-Rad’s ProteOn HTG and ProteOn HTE chips).
When working with lipid assemblies such as liposomes, use specific surface chemistries for best results (for example, Bio-Rad’s ProteOn LCP chip or modified ProteOn GLC chip in ProteOn GLC lipid kit).

Refer to this website for all available sensor chips: www.sprpages.nl/sensor-chips.html
It is possible to immobilize ligands in individual spots/channels with any of the amine coupling, histidine-tag binding, and lipid assembly–capturing sensor chips.
• May not apply to streptavidin or NeutrAvidin sensor chips if an additive is used to stabilize these proteins on the surface
If you plan to reuse a spot/channel after a ligand has been immobilized, be sure that the chip surface is regenerated and preserved properly to keep the ligand active.
When optimizing the regeneration of a surface that contains a bound ligand, start with the least harsh solution and then move on to the harsher solutions to avoid denaturing the bound ligand.

The extent of regeneration depends on the strength/stability of the ligand-analyte interaction.
•Forsmallmoleculeanalytes,runningbuffer is often the regeneration solution and the ligand can remain stable and active for multiple rounds of regeneration
•Ifanacid,base,ordetergentisrequiredfor regeneration, the ligand may lose its activity
Use a positive control interaction/analyte injection to monitor ligand activity when using harsh regeneration conditions, which may cause the ligand to lose activity.

Prep Yourself before You Wreck Yourself

Unless your system has an inline degasser, it is best to degas the buffers and samples.
Use a sealing film for microplates to prevent evaporation of samples.
SPR systems use different amounts of air bubbles to prevent mixing of the sample and the running buffer. Choose how many air bubbles you need based on the injection quality you require.
To ensure high quality data use three air bubbles for maximum separation when injecting your analyte.
Most sensor chips are compatible with a running buffer containing free amine salts. However, avoid using these buffers when immobilizing a ligand by amine coupling.

Beware of the Mass Transport Effect

To quickly check for mass transport effect:
1. Inject the analyte at different flow rates. If the same ka is measured at all flow rates, there is no influence from the mass transport effect. But if the ka decreases with decreasing flow rates, the system is mass transport limited.
2. Analyze data first with the Langmuir model and then with the Langmuir with mass transport model. If the ka values are the same for both models, then there is no mass transport effect. If the ka is lower with Langmuir analysis, then the system is mass transport limited.
To avoid the mass transport effect, reduce ligand surface density and/or increase analyte injection flow rate.

It should be noted that the mass transport effect is not a problem if its influence is insignificant to the data fitting.
The mass transport effect occurs when working with fast on-rate interactions and/or very high surface density of the ligand.
Example of data limited by mass transport:
0 50 100 150 200 250 300 350 400Time, sec
6
5
4
3
2
1
0
–1
Res
pon
se, R
U

Example of data with no mass transport:
0 100 200 300 400 500 600 700 800 900Time, sec
90
70
50
30
10
–10
Res
pon
se, R
U

When to Include Excluded
Volume Correction

When working with analytes dissolved in a cosolvent with a high refractive index, such as DMSO, beware of the excluded volume effect.
Excluded volume effect occurs because the reference surface will produce a larger bulk solvent response than the ligand surface and cause inaccurate reference subtraction.
Use excluded volume correction to correct for the bulk solvent response.

For more assistance visit our support website at www.bio-rad.com or reach out to your local Bio-Rad tech support team.
Follow us on Twitter @bioradlifesci.
NeutrAvidin is a trademark of Pierce Biotechnology, Inc.
The ProteOn XPR36 protein interaction array system is covered by Bio-Rad pat-ents, including United States patent numbers 8,111,400, 8,105,845, 7,999,942, and 7,443,507.
This product or portions thereof is manufactured and sold under license from GE Healthcare under United States patent numbers 5,492,840, 5,554,541, 5,965,456, 7,736,587, and 8,021,626, and any international patents and patent applications claiming priority.

www.bio-rad.com
Life Science Group
13-1398 1013 Sig 1212Bulletin 6476 Rev A US/EG
Bio-Rad Laboratories, Inc.
Web site www.bio-rad.com USA 800 424 6723 Australia 61 2 9914 2800 Austria 01 877 89 01 Belgium 09 385 55 11 Brazil 55 11 5044 5699 Canada 905 364 3435 China 86 21 6169 8500 Czech Republic 420 241 430 532 Denmark 44 52 10 00 Finland 09 804 22 00 France 01 47 95 69 65 Germany 089 31 884 0 Greece 30 210 9532 220 Hong Kong 852 2789 3300 Hungary 36 1 459 6100 India 91 124 4029300 Israel 03 963 6050 Italy 39 02 216091 Japan 03 6361 7000 Korea 82 2 3473 4460 Mexico 52 555 488 7670 The Netherlands 0318 540666 New Zealand 64 9 415 2280 Norway 23 38 41 30 Poland 48 22 331 99 99 Portugal 351 21 472 7700 Russia 7 495 721 14 04 Singapore 65 6415 3188 South Africa 27 861 246 723 Spain 34 91 590 5200 Sweden 08 555 12700 Switzerland 026 674 55 05 Taiwan 886 2 2578 7189 Thailand 800 88 22 88 United Kingdom 020 8328 2000