German Construction Figures 2016 - bauindustrie.de · German Construction Figures 2016 Source:...
15
German Construction Figures 2017 Source: Stats Office GDP, billion Euro 3,277 Construction Investment, billion Euro 327 Share of GDP 10.0 % Construction Output per capita, Euro 3,950 Gross Value Added, total economy, billion Euro 2,955 Gross Value Added, construction sector 144 Share of Construction Sector 4.9 % All Employees, Thousands 44,269 Employees in Construction, Thousands 2,490 Share of Construction Sector 5.6 % Hauptverband der Deutschen Bauindustrie e. V. | Weitz | Stand: 08/2018
Transcript of German Construction Figures 2016 - bauindustrie.de · German Construction Figures 2016 Source:...

German Construction Figures 2017
Source: Stats Office
GDP, billion Euro 3,277
Construction Investment, billion Euro 327
Share of GDP 10.0 %
Construction Output per capita, Euro 3,950
Gross Value Added, total economy, billion Euro 2,955
Gross Value Added, construction sector 144
Share of Construction Sector 4.9 %
All Employees, Thousands 44,269
Employees in Construction, Thousands 2,490
Share of Construction Sector 5.6 %
Hauptverband der Deutschen Bauindustrie e. V. | Weitz | Stand: 08/2018

Construction Companies 2018,
market share
Source: Stats Office
Employment, companies with
1 - 49 employees 64 %
50 - 249 employees 23 %
250 and more employees 13 %
Turnover, companies with
1 - 49 employees 47 %
50 - 249 employees 30 %
250 and more employees 23 %
Hauptverband der Deutschen Bauindustrie e. V. | Weitz | Stand: 08/2018
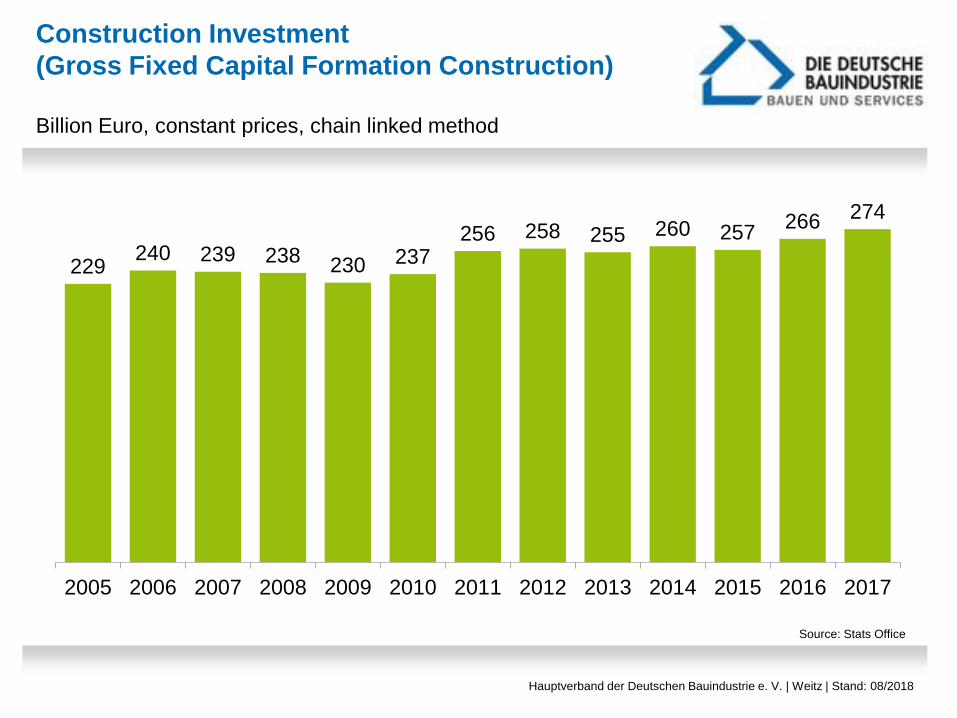
229240 239 238 230 237
256 258 255 260 257266 274
2005 2006 2007 2008 2009 2010 2011 2012 2013 2014 2015 2016 2017
Billion Euro, constant prices, chain linked method
Source: Stats Office
Construction Investment
(Gross Fixed Capital Formation Construction)
Hauptverband der Deutschen Bauindustrie e. V. | Weitz | Stand: 08/2018

-5,7
9,3
-0,6
6,1
-4,0
-0,3
12,5
0,5
3,14,1
1,6
6,3 5,9
-10
-5
0
5
10
15
2005 2006 2007 2008 2009 2010 2011 2012 2013 2014 2015 2016 2017
%
Turnover in the Construction Industry
against previous year, current prices
Source: Stats Office
Hauptverband der Deutschen Bauindustrie e. V. | Weitz | Stand: 08/2019
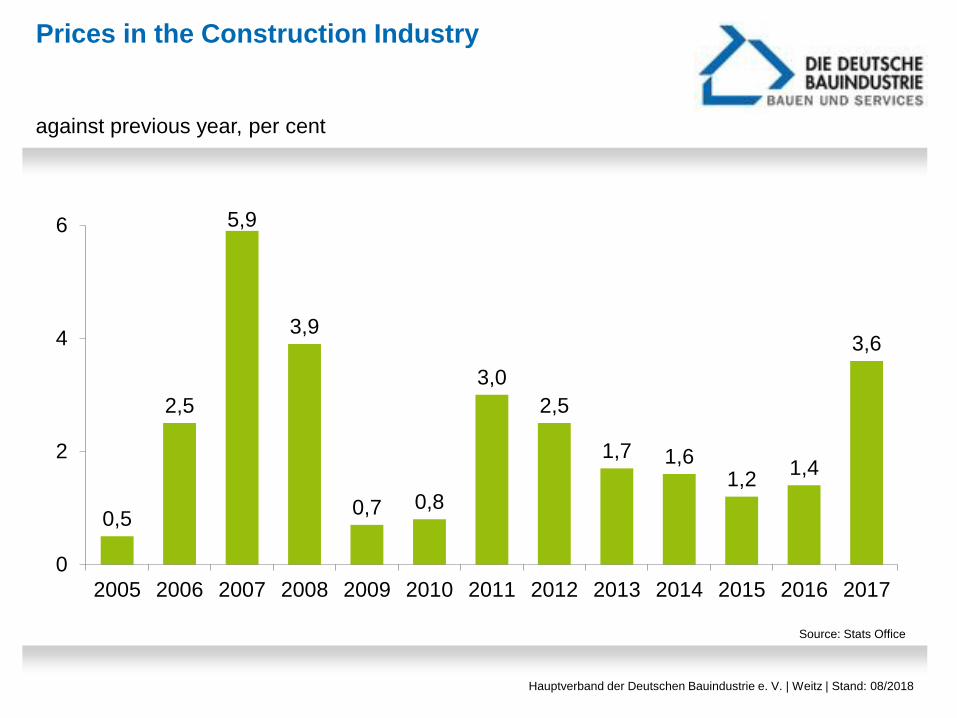
0,5
2,5
5,9
3,9
0,7 0,8
3,0
2,5
1,7 1,61,2
1,4
3,6
0
2
4
6
2005 2006 2007 2008 2009 2010 2011 2012 2013 2014 2015 2016 2017
Prices in the Construction Industry
against previous year, per cent
Source: Stats Office
Hauptverband der Deutschen Bauindustrie e. V. | Weitz | Stand: 08/2018

-6,2
6,5
-6,1
2,2
-4,5
-1,1
9,2
-2,0
1,42,5
0,4
4,8
2,2
-8
-6
-4
-2
0
2
4
6
8
10
2005 2006 2007 2008 2009 2010 2011 2012 2013 2014 2015 2016 2017
Turnover in the Construction Industry
against previous year, constant prices, per cent
Source: Stats Office
Hauptverband der Deutschen Bauindustrie e. V. | Weitz | Stand: 08/2018
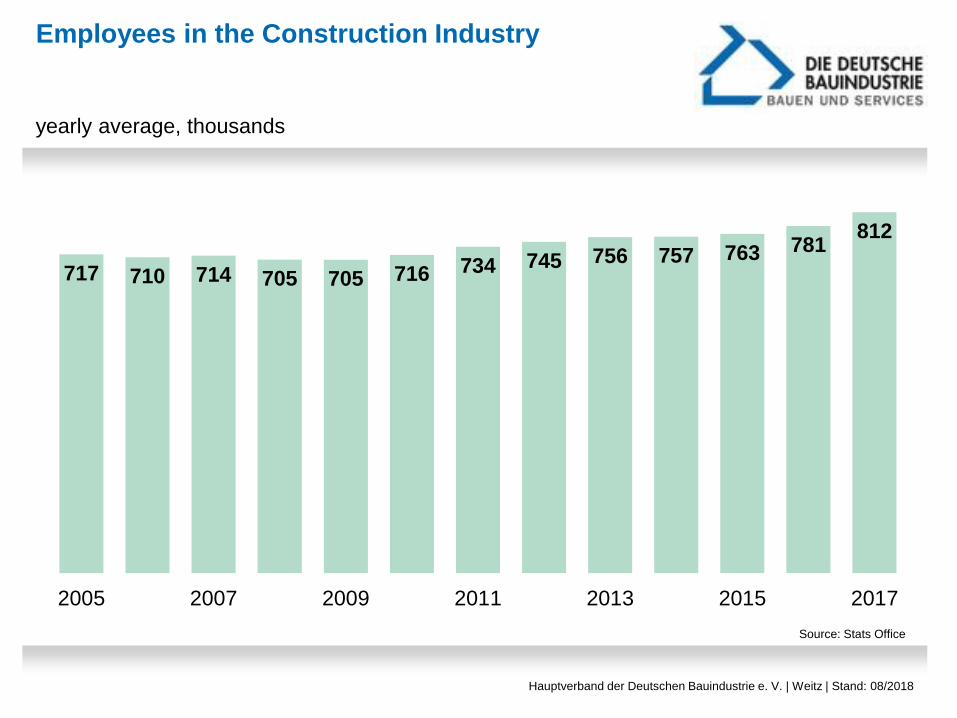
Employees in the Construction Industry
yearly average, thousands
Source: Stats Office
717 710 714 705 705 716 734 745 756 757 763 781812
2005 2007 2009 2011 2013 2015 2017
Hauptverband der Deutschen Bauindustrie e. V. | Weitz | Stand: 08/2018
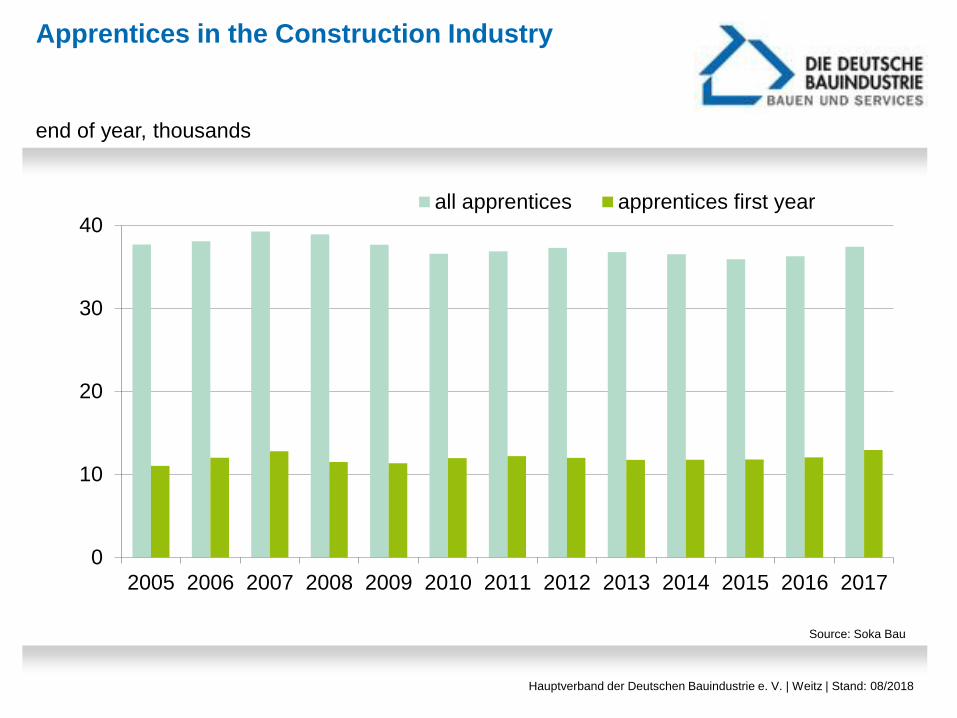
0
10
20
30
40
2005 2006 2007 2008 2009 2010 2011 2012 2013 2014 2015 2016 2017
all apprentices apprentices first year
Apprentices in the Construction Industry
end of year, thousands
Source: Soka Bau
Hauptverband der Deutschen Bauindustrie e. V. | Weitz | Stand: 08/2018

3,742
2,963
2,3962,227 2,270
2,057 1,9991,893
1,714 1,648 1,614 1,556
1,290
2005 2006 2007 2008 2009 2010 2011 2012 2013 2014 2015 2016 2017
Insolvencies in the Construction Industry
Source: Stats Office
Hauptverband der Deutschen Bauindustrie e. V. | Weitz | Stand: 08/2018
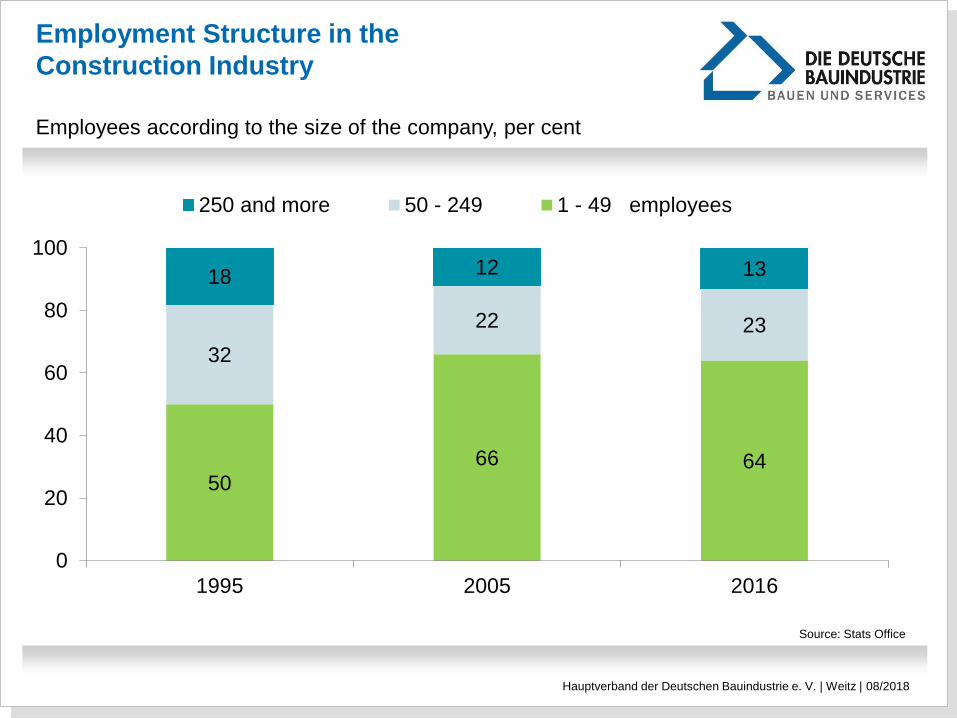
Employment Structure in the
Construction Industry
Source: Stats Office
50
66 64
32
22 23
18 12 13
0
20
40
60
80
100
1995 2005 2016
250 and more 50 - 249 1 - 49 employees
Employees according to the size of the company, per cent
Hauptverband der Deutschen Bauindustrie e. V. | Weitz | 08/2018

Turnover Structure in the
Construction Industry
Source: Stats Office
45 50 47
34 27 30
21 23 23
0
20
40
60
80
100
1995 2005 2016
250 and more 50 - 249 1 - 49 employees
Turnover according to the size of the company, per cent
Hauptverband der Deutschen Bauindustrie e. V. | Weitz | 08/2018

Residential Commercial Public
44 %
30 %
26 %
1970 61 %
27 %
12 %
2017
Source: Stats Office
Split-Up of Construction Investment
Hauptverband der Deutschen Bauindustrie e. V. | Weitz | Stand: 08/2018

0
50
100
150
200
250
2005 2006 2007 2008 2009 2010 2011 2012 2013 2014 2015 2016 2017
1 + 2 family dwellings flats other
Source: Stats Office
Permits in Residential Construction
Hauptverband der Deutschen Bauindustrie e. V. | Weitz | Stand: 08/2018
number of houses or flats, thousands
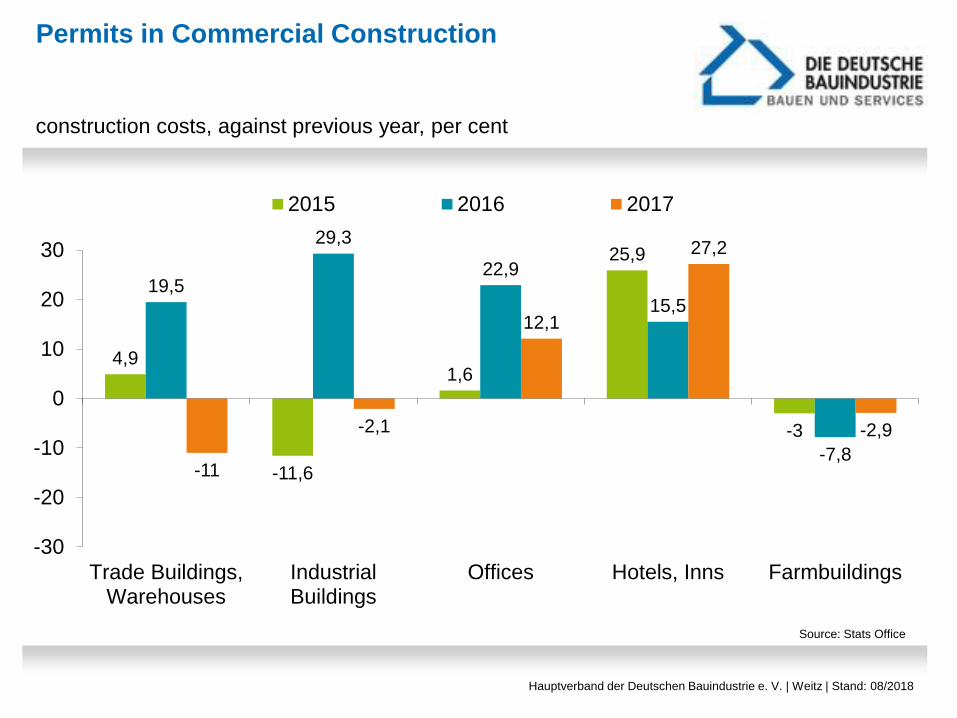
4,9
-11,6
1,6
25,9
-3
19,5
29,3
22,9
15,5
-7,8-11
-2,1
12,1
27,2
-2,9
-30
-20
-10
0
10
20
30
Trade Buildings,Warehouses
IndustrialBuildings
Offices Hotels, Inns Farmbuildings
2015 2016 2017
Permits in Commercial Construction
construction costs, against previous year, per cent
Source: Stats Office
Hauptverband der Deutschen Bauindustrie e. V. | Weitz | Stand: 08/2018

-8,9
64,5
45,8
23,2
-11,2
-1,9
10,513,7
29,4
22,3
-20
-10
0
10
20
30
40
50
60
70
Q1 2016 Q3 2016 Q1 2017 Q3 2017 Q1 2018
Permits in Public Construction
Source: Stats Office
Hauptverband der Deutschen Bauindustrie e. V. | Weitz | Stand: 08/2018
construction costs, against quarter of the previous year, per cent