Georgia Association of School Personnel Administrators November 30, 2011
42
-
Upload
jerome-parsons -
Category
Documents
-
view
28 -
download
2
description
Georgia Association of School Personnel Administrators November 30, 2011. Examine the Data for Education in Georgia. Academic Achievement Milestones. School Readiness. Literacy by 3 rd Grade. Numeracy by 8 th Grade. High School Graduation. Workforce and/or College Ready. 20 th State - PowerPoint PPT Presentation
Transcript of Georgia Association of School Personnel Administrators November 30, 2011

Georgia Association of School Personnel Administrators
November 30, 2011
1 Examine the Data for Education in Georgia
2 Economic Impact of Georgia Non-Graduates
3 Strengthening the Birth to Work Pipeline
4 What Can We Do?

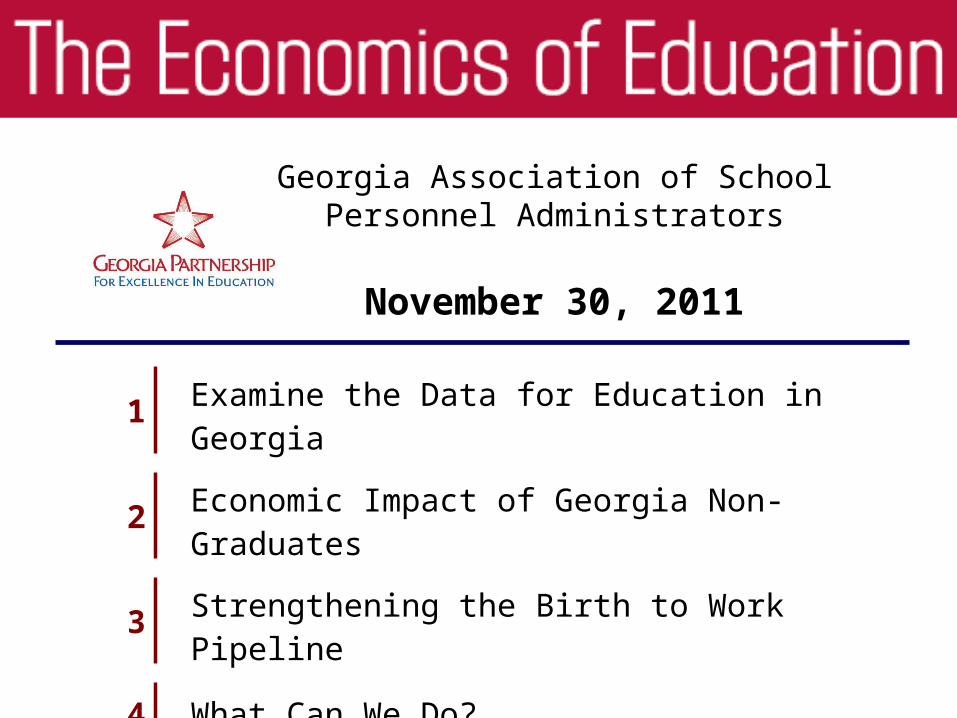
Examine the Data for Education in Georgia
Academic Achievement Milestones
School Readiness
Literacy by 3rd Grade
Numeracy by 8th Grade
High School Graduation
Workforce and/or College Ready

0%
20%
40%
60%
80%
100%
New
Jer
sey
Con
nect
icut
Mas
sach
uset
tsLo
uisi
ana
New
Yor
kPu
erto
Ric
oH
awai
iIlli
nois
Geo
rgia
Mar
ylan
dN
ewSo
uth
Car
olin
aAr
kans
asM
issi
ssip
piC
alifo
rnia
Mic
higa
nN
ebra
ska
Penn
sylv
ania
Virg
inia
Wis
cons
inC
olor
ado
Del
awar
eFl
orid
aIo
wa
Kans
asR
hode
Isla
ndU
nite
d St
ates
Nor
th C
arol
ina
Kent
ucky
Min
neso
taM
onta
na Ohi
oM
isso
uri
Okl
ahom
aTe
xas
Verm
ont
Alab
ama
Sout
h D
akot
aTe
nnes
see
Mai
neN
ew M
exic
oO
rego
nU
tah
Was
hing
ton
Wes
t Virg
inia
Indi
ana
Ariz
ona
Idah
oN
orth
Dak
ota
Alas
kaN
evad
a
Percent of Children Age 3-5 Enrolled in Early Education, 2009
Source: The Annie E. Casey Foundation, KIDS COUNT Data Center.
20th State61%
UnitedStates60%
Georgia64%

NAEP 2011 4th Grade Reading At or Above Basic
Source: National Center for Education Statistics
0
20
40
60
80
100
Mas
sach
uset
tsNe
w Je
rsey Ne
wM
aryla
ndNo
rth D
akot
aPe
nnsy
lvania
Mon
tana
Verm
ont
Conn
ectic
utDe
lawar
eVi
rgini
aKe
ntuc
ky Ohio
Wyo
ming
Flor
idaCo
lorad
oKa
nsas
Rhod
e Is
land
Minn
esot
aNe
bras
kaM
aine
Idah
oIo
waSo
uth
Dako
taNe
w Yo
rk Utah
North
Car
olina
India
naW
iscon
sinAl
abam
aW
ashin
gton
Miss
ouri
Geo
rgia
Mich
igan
Illino
isTe
xas
Okla
hom
aAr
kans
asO
rego
nSo
uth
Caro
lina
Wes
t Virg
inia
Tenn
esse
eHa
waii
Arizo
naNe
vada
Califo
rnia
Alas
kaLo
uisian
aM
ississ
ippi
New
Mex
icoDC
Georgia & US Average
66%20th State
70%

NAEP 2011 8th Grade Math At or Above Basic
Source: National Center for Education Statistics
0
20
40
60
80
100
Mas
sach
uset
tsN
orth
Dak
ota
Min
neso
taM
onta
naN
ew J
erse
yS
outh
Dak
ota
Ver
mon
tN
ewT
exas
Wyo
min
gC
olor
ado
Kan
sas
Ohi
oW
isco
nsin
Mai
neV
irgin
iaId
aho
Indi
ana
Was
hing
ton
Iow
aC
onne
ctic
utN
orth
Car
olin
aN
ebra
ska
Ala
ska
Mar
ylan
dP
enns
ylva
nia
Del
awar
eR
hode
Isla
ndU
tah
Illin
ois
Mis
sour
iO
rego
nO
klah
oma
Ken
tuck
yN
atio
nal
Mic
higa
nN
ew Y
ork
Sou
th C
arol
ina
Ark
ansa
sG
eorg
iaA
rizon
aF
lorid
aH
awai
iN
evad
aW
est V
irgin
iaT
enne
ssee
New
Mex
ico
Loui
sian
aC
alifo
rnia
Ala
bam
aM
issi
ssip
piD
C
United States72%
Georgia68%
20th State77%
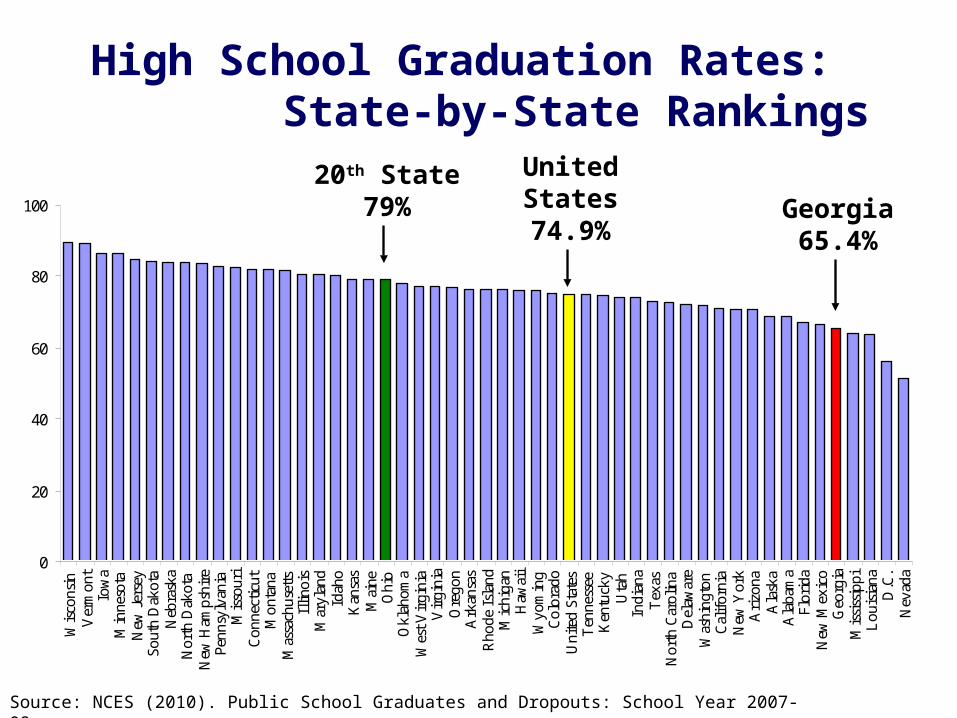
Source: NCES (2010). Public School Graduates and Dropouts: School Year 2007-08.
0
20
40
60
80
100
Wis
cons
inV
erm
ont
Iow
aM
inne
sota
New
Jer
sey
Sout
h D
akot
aN
ebra
ska
Nor
th D
akot
aN
ew H
amps
hire
Penn
sylv
ania
Mis
sour
iC
onne
ctic
utM
onta
naM
assa
chus
etts
Illin
ois
Mar
ylan
dId
aho
Kan
sas
Mai
neO
hio
Okl
ahom
aW
est V
irgi
nia
Vir
gini
aO
rego
nA
rkan
sas
Rho
de I
slan
dM
ichi
gan
Haw
aii
Wyo
min
gC
olor
ado
Uni
ted
Stat
esT
enne
ssee
Ken
tuck
yU
tah
Indi
ana
Tex
asN
orth
Car
olin
aD
elaw
are
Was
hing
ton
Cal
ifor
nia
New
Yor
kA
rizo
naA
lask
aA
laba
ma
Flor
ida
New
Mex
ico
Geo
rgia
Mis
siss
ippi
Lou
isia
naD
.C.
Nev
ada
20th State79% Georgia
65.4%
High School Graduation Rates: State-by-State Rankings
UnitedStates74.9%

Georgia High School Graduation Rates
Source: The Governor’s Office of Student Achievement, State Report Cards.
YearHigh School
Graduation RateNumber of High
School Non-Grads
2007 72% 28,883
2008 75% 27,248
2009 79% 23,567
2010 81% 21,803
2011 81% 21,844
Total 123,345

Economic Impact ofGeorgia Non-Graduates

Education Pays
Source: U.S. Bureau of Labor Statistics. Earnings & unemployment for full-time workers age 25 & older, not seasonally adjusted.
EDUCATIONAL ATTAINMENT & EMPLOYMENT
Unemployment Rate Sept 2011 Median Wkly Earnings (& approx. annual)
15% 10% 5% 0% 0 200 600 1000
4.2 Bachelor’s Degree & Higher
$1,152 ($58,500)
8.3 Some college/ Associate Degree
$731 ($38,012)
9.1 HS Graduates, No College
$636 ($33,072)
13.0 Less than a High School Diploma
$459 ($23,868)
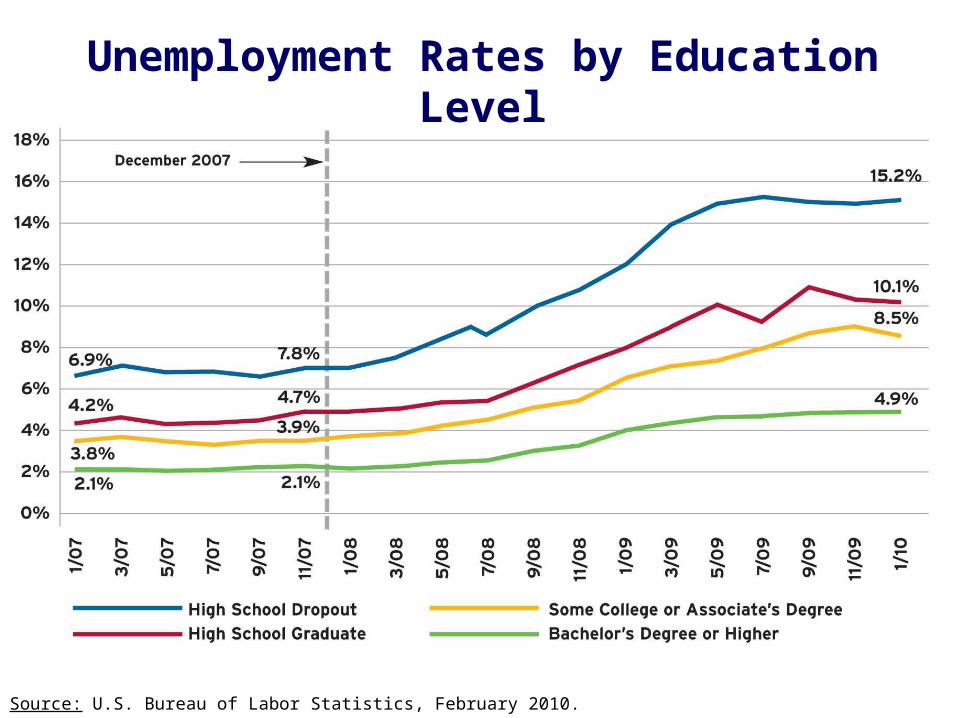
Unemployment Rates by Education Level
Source: U.S. Bureau of Labor Statistics, February 2010.

Unemployment Rates by County: Aug. 2011
Source: Georgia Department of Labor; State average = 10.4%
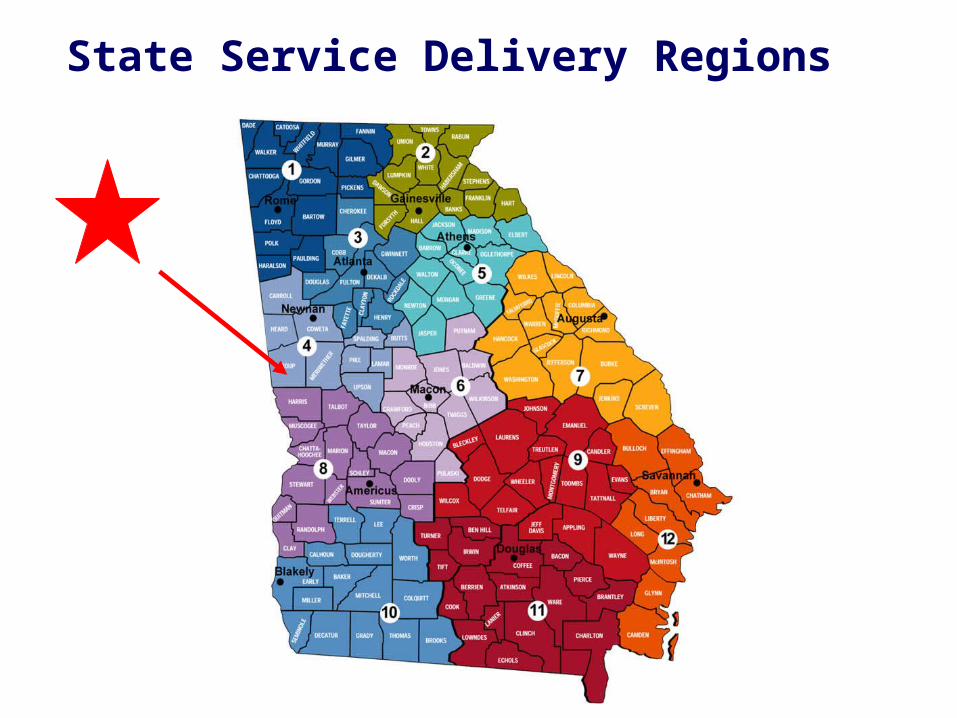
State Service Delivery Regions

Economic Impact of High School Non-Completion
How much could YOUR region benefit from this additional income currently being foregone?
Source: Isley, P. & Hill, J. “Updated Economic Impact of High School Non-Completion in Georgia: 2005 Estimate,” Georgia Southern University. April 2007. *According to GSU study, totals may not add due to rounding.
Region 1 $2.2 billion
Region 2 $1.2 billion
Region 3 $4.2 billion
Region 4 $1.1 billion
Region 5 $1.1 billion
Region 6 $1.0 billion
Region 7 $1.1 billion
Region 8 $0.9 billion
Region 9 $0.9 billion
Region 10 $2.0 billion
Region 11 $1.0 billion
Region 12 $1.1 billion
TOTAL $18 billion*

Compounded Impacts of High School Non-Completion
Source: Levin, H., et al., (2007). The Costs and Benefits of an Excellent Education for All of America’s Children.
INDIVIDUALS THE COMMUNITY
Lower Lifetime Earnings Reduced buying power & tax revenues; less economic growth
Decreased health status; Higher mortality rates; More criminal activity
Higher health care & criminal justice costs
Higher teen pregnancy rates; Single motherhood
Higher public services costs
Less voting; Less volunteeringLow rate of community involvement

Strengthening the Birth to Work Pipeline
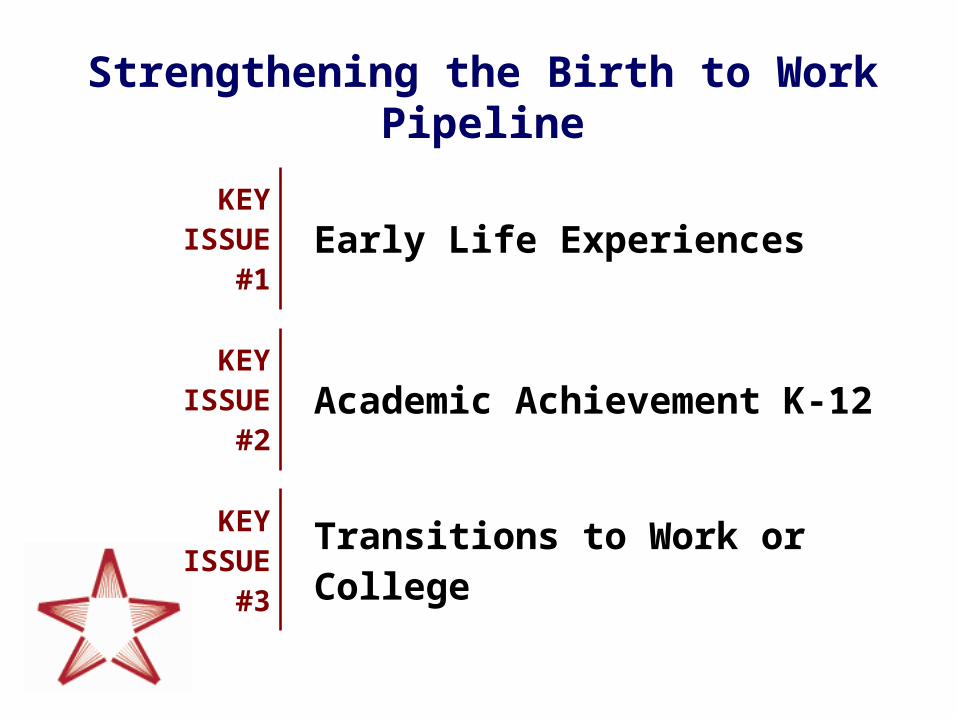
Strengthening the Birth to Work Pipeline
KEY ISSUE
#1Early Life Experiences
KEY ISSUE
#2Academic Achievement K-12
KEY ISSUE
#3Transitions to Work or College

Family Income Affects School Readiness
Source: National Center for Education Statistics. (2004). Early Longitudinal Study, Kindergarten Class of 1998-99.
Achievement Gap as Children Enter Kindergarten

0
200
400
600
800
1000
1200
9 12 15 18 21 24 27 30 33 36
Age of child in months
Voc
abu
lary
Siz
eDisparities in Early Vocabulary Growth
Source: Hart, B. and Risley, T. R. (2003). “The Early Catastrophe: The 30 Million Word Gap by Age 3.”
Professional Families 1,116 words
Working Class Families 749 words
Welfare Families 525 words

Economic Benefits of Early Education:Perry Preschool Study
41%
36%
29%
20%
13%
7%
0% 10% 20% 30% 40% 50%
Never onwelfare as adult
Own home
Earn $2,000+monthly
Program group No-Program group
Source: Schweinhart, L.J., et al. (2005). Lifetime effects: The High/Scope Perry Preschool study through age 40.
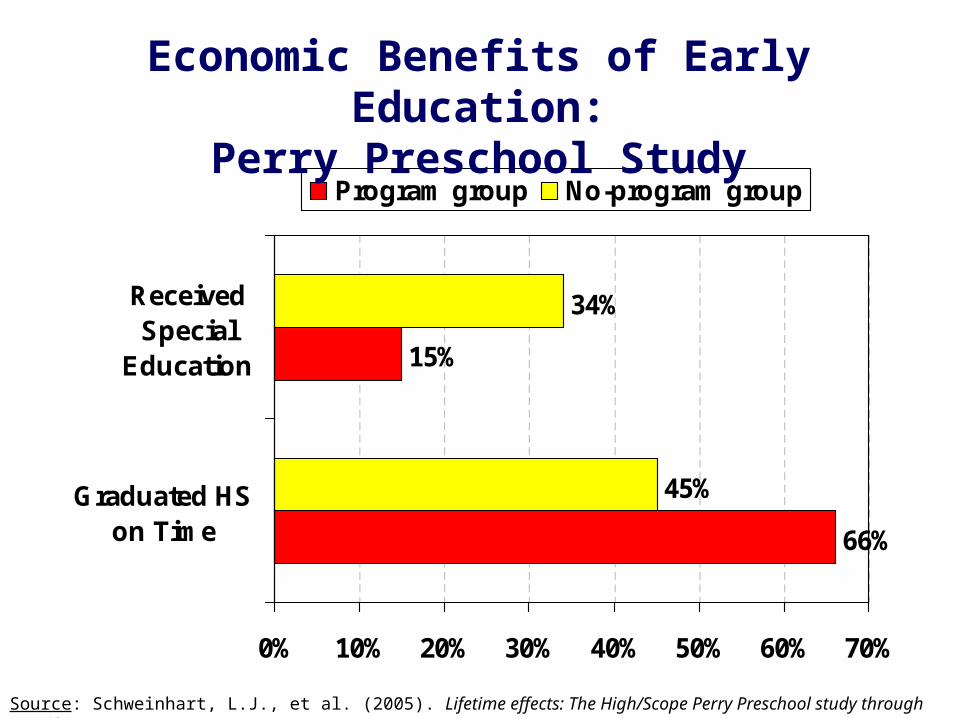
66%
15%
45%
34%
0% 10% 20% 30% 40% 50% 60% 70%
Graduated HSon Time
ReceivedSpecial
Education
Program group No-program group
Economic Benefits of Early Education:Perry Preschool Study
Source: Schweinhart, L.J., et al. (2005). Lifetime effects: The High/Scope Perry Preschool study through age 40.
Strengthening the Birth to Work Pipeline
KEY ISSUE
#1Early Life Experiences
KEY ISSUE
#2Academic Achievement K-12
KEY ISSUE
#3Transitions to Work or College
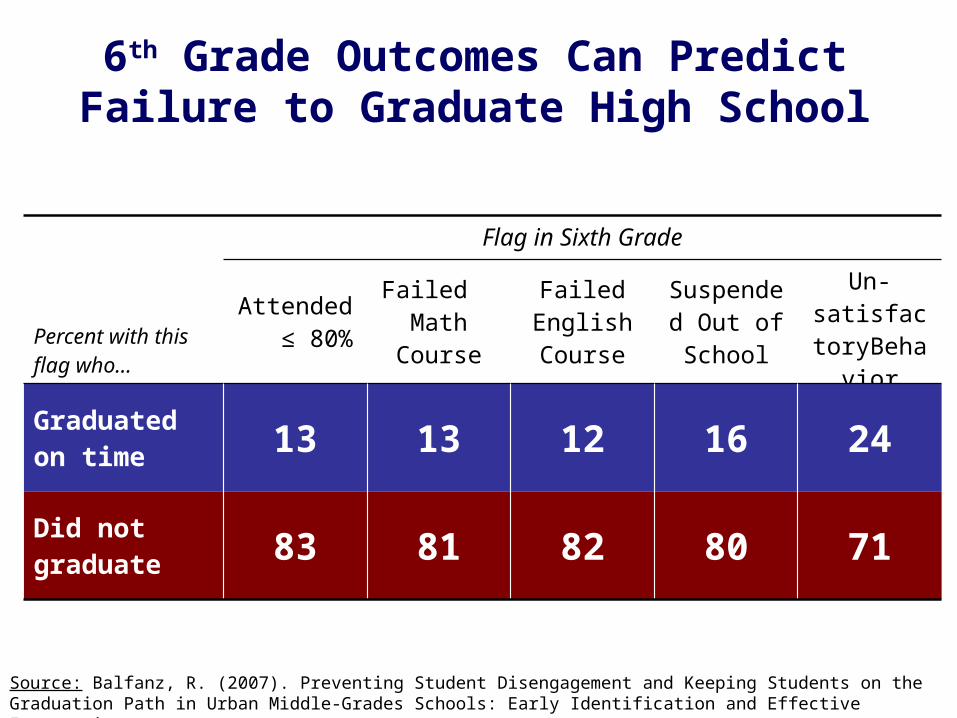
6th Grade Outcomes Can Predict Failure to Graduate High School
Source: Balfanz, R. (2007). Preventing Student Disengagement and Keeping Students on the Graduation Path in Urban Middle-Grades Schools: Early Identification and Effective Intervetions.
Flag in Sixth Grade
Percent with this flag who…
Attended ≤ 80%
Failed Math
Course
Failed English Course
Suspended Out of School
Un-satisfactory
Behavior
Graduated on time 13 13 12 16 24
Did not graduate 83 81 82 80 71

Cost of Student Retention in Georgia (2010)
59,999 X $8,760 = More than $525 million
Georgia students retained in 09-10
Average annual cost of education
per student
Total cost of student retention in 2009 for
Georgia
Source: Georgia Department of Education; Partnership Calculation
Example for Troup County School System:
376 X $8,874 = $3,336,624
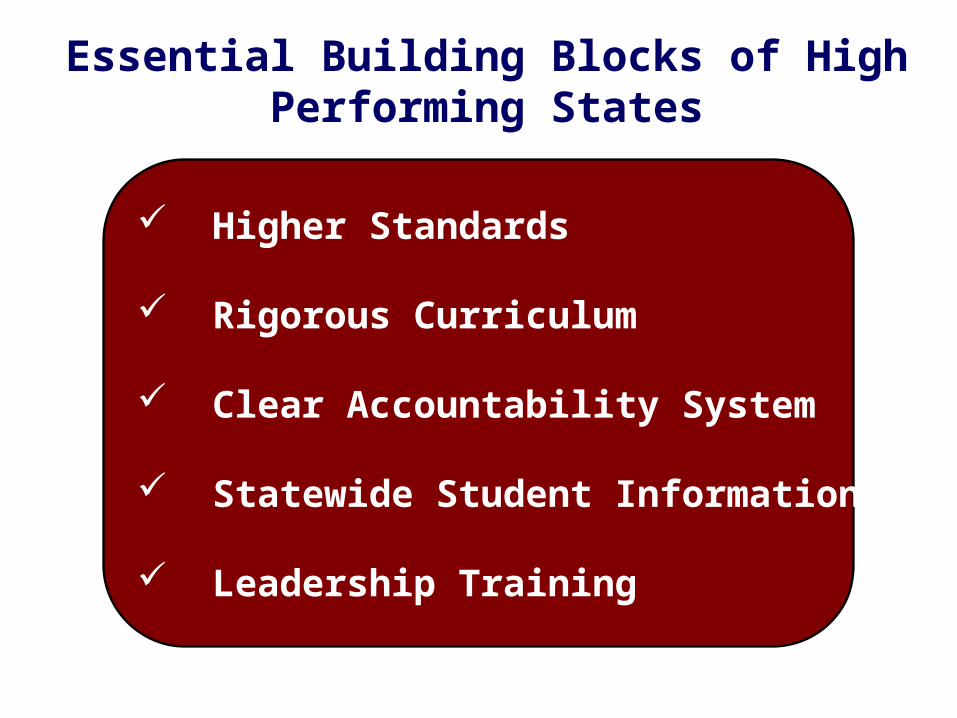
Essential Building Blocks of High Performing States
Higher Standards
Rigorous Curriculum
Clear Accountability System
Statewide Student Information System
Leadership Training

3rd Grade Reading Achievement in Georgia:Closing the Gaps
70%
80%
90%
100%
2007 2008 2009 2010
All Students Black Hispanic White
Source: Georgia Department of Education.
% of Students Meeting or Exceeding Standards

60%
70%
80%
90%
100%
2007 2008 2009 2010
All Students Black Hispanic White
8th Grade Math Achievement in Georgia:Closing the Gaps
Source: Georgia Department of Education.
% of Students Meeting or Exceeding Standards
50%
60%
70%
80%
90%
100%
2005 2006 2007 2008 2009 2010 2011
All Students Black Hispanic White
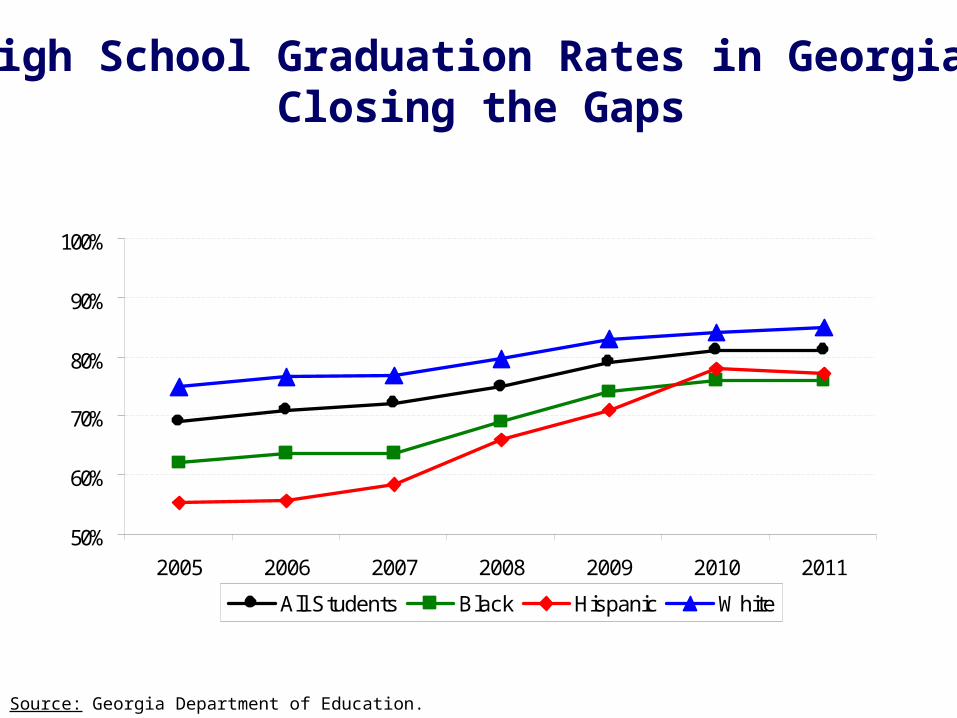
High School Graduation Rates in Georgia:Closing the Gaps
Source: Georgia Department of Education.

Strengthening the Birth to Work Pipeline
KEY ISSUE
#1Early Life Experiences
KEY ISSUE
#2Academic Achievement K-12
KEY ISSUE
#3Transitions to Work or College

Demand for postsecondary education has increased, and will continue to increase during and after the recovery.
Source: Anthony Carnevale’s analysis of March CPS data, various years; Center on Education and the Workforce forecast of educational demand to 2018, presented in The Recession: Accelerating the New Economy, September 2011.

Job Losers Job Gainers
Structural Changes Through 2018 and Beyond
Source: : Anthony Carneval’s presentation: The Recession: Accelerating the New Economy, September 2011.
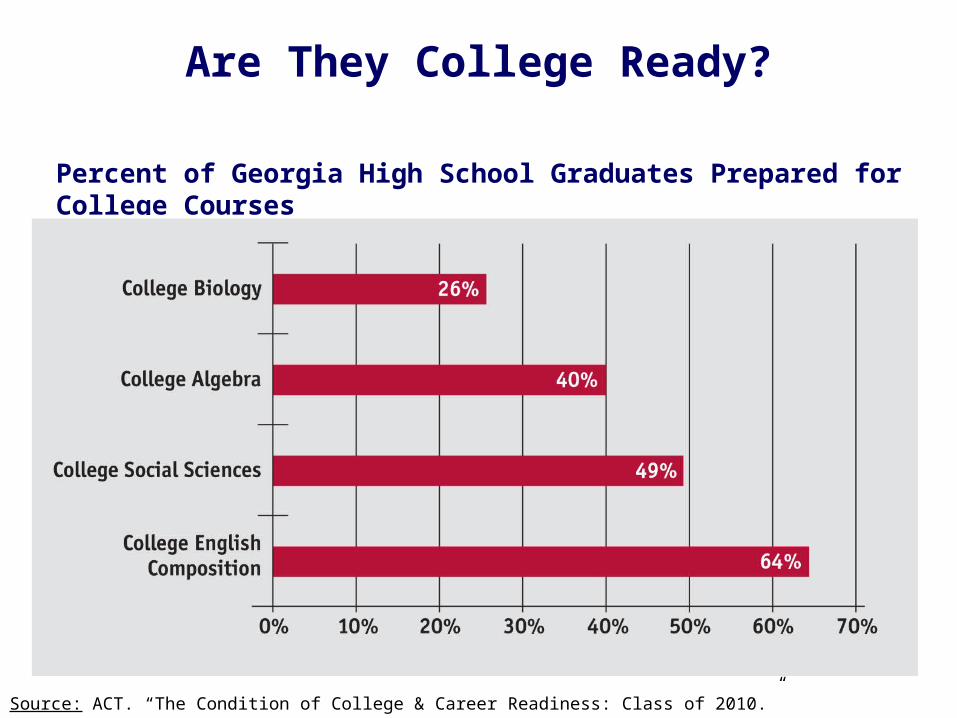
Are They College Ready?
Source: ACT. “The Condition of College & Career Readiness: Class of 2010.”
Percent of Georgia High School Graduates Prepared for College Courses
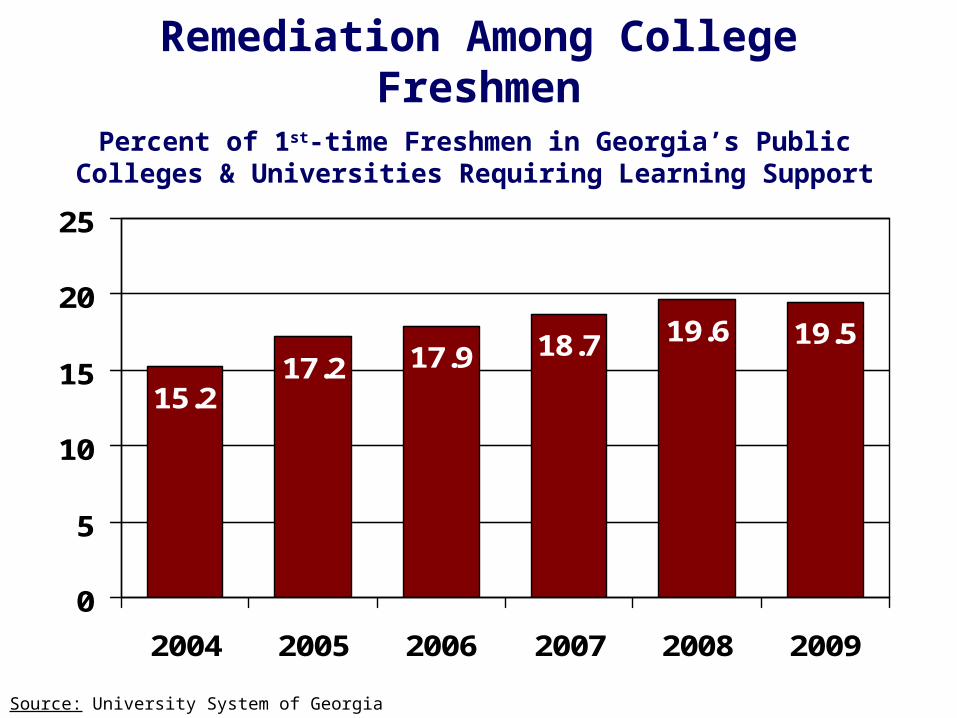
Remediation Among College Freshmen
Source: University System of Georgia
Percent of 1st-time Freshmen in Georgia’s Public Colleges & Universities Requiring Learning Support
15.217.2 17.9 18.7 19.6 19.5
0
5
10
15
20
25
2004 2005 2006 2007 2008 2009

What Can We Do?

Look at the Data for Your Community
Benchmark against similar communities
(demographically alike; geographic proximity)
Consider multiple sources
(KIDS COUNT, Department of Education, Georgia School Council Institute, etc.)
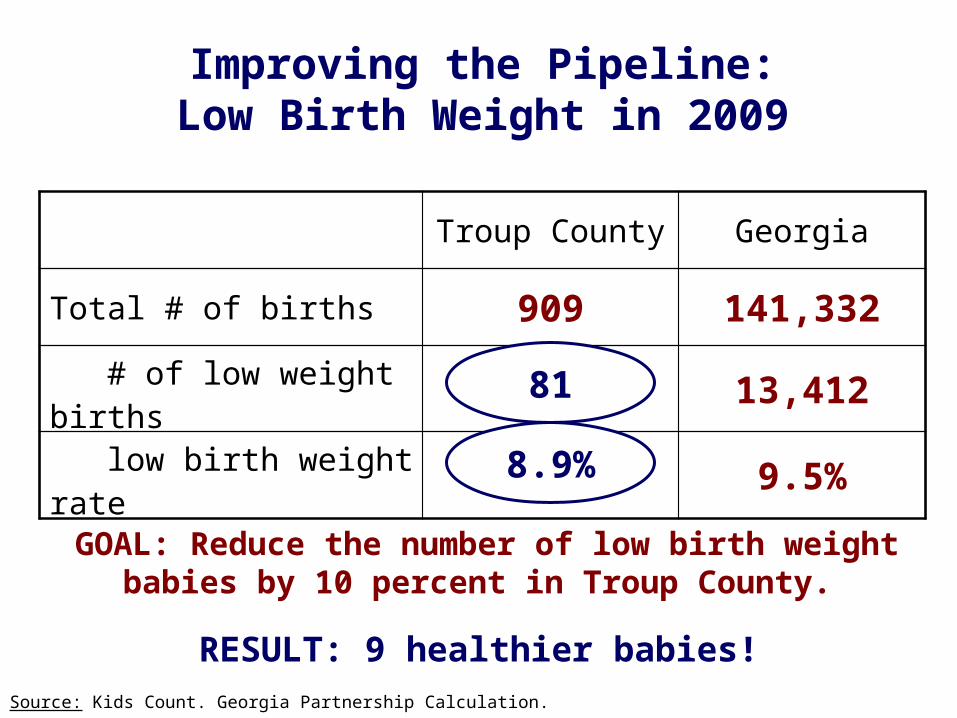
Improving the Pipeline:Low Birth Weight in 2009
GOAL: Reduce the number of low birth weight babies by 10 percent in Troup County.
Troup County Georgia
Total # of births 909 141,332
# of low weight births 90 13,412
low birth weight rate 9.9% 9.5%
RESULT: 9 healthier babies!Source: Kids Count. Georgia Partnership Calculation.
81
8.9%
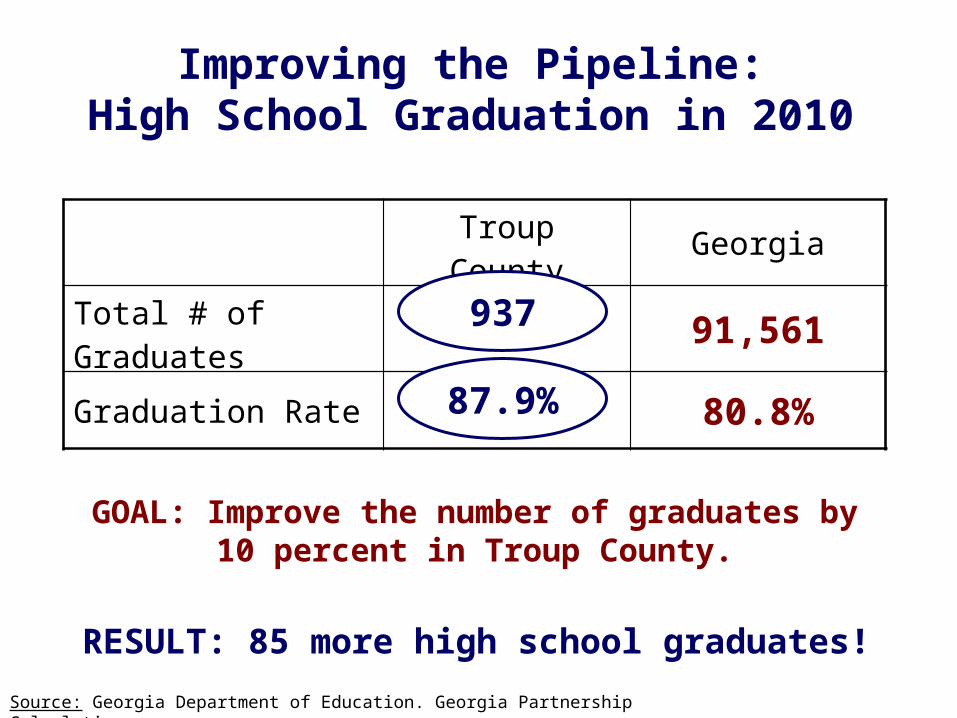
Improving the Pipeline:High School Graduation in 2010
GOAL: Improve the number of graduates by 10 percent in Troup County.
Troup County Georgia
Total # of Graduates 852 91,561
Graduation Rate 80.0% 80.8%
RESULT: 85 more high school graduates!
Source: Georgia Department of Education. Georgia Partnership Calculation.
937
87.9%

Aligning Educational Strategies
Aligned Acts of Improvement
Random Acts of Improvement
GOALS
GOALS
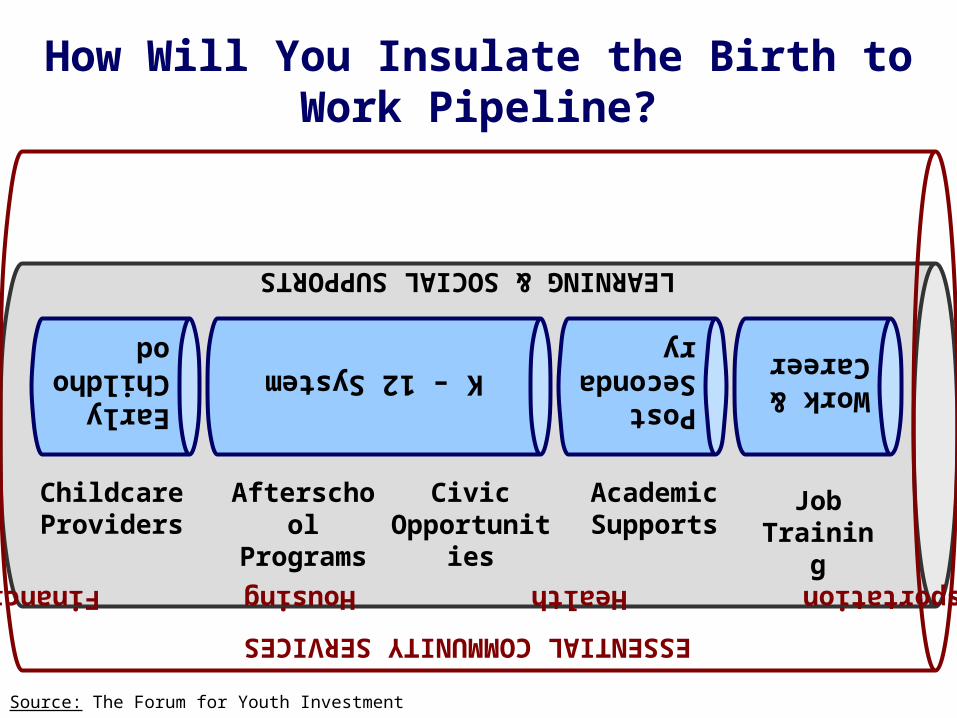
How Will You Insulate the Birth to Work Pipeline?
LEARNING & SOCIAL SUPPORTS
Childcare Providers
Afterschool Programs
Academic Supports
Job Training
Civic Opportunities
Early Childhood
K – 12 SystemPost Secondary
Work & Career
ESSENTIAL COMMUNITY SERVICES
Transportation Health Housing Financial
Source: The Forum for Youth Investment
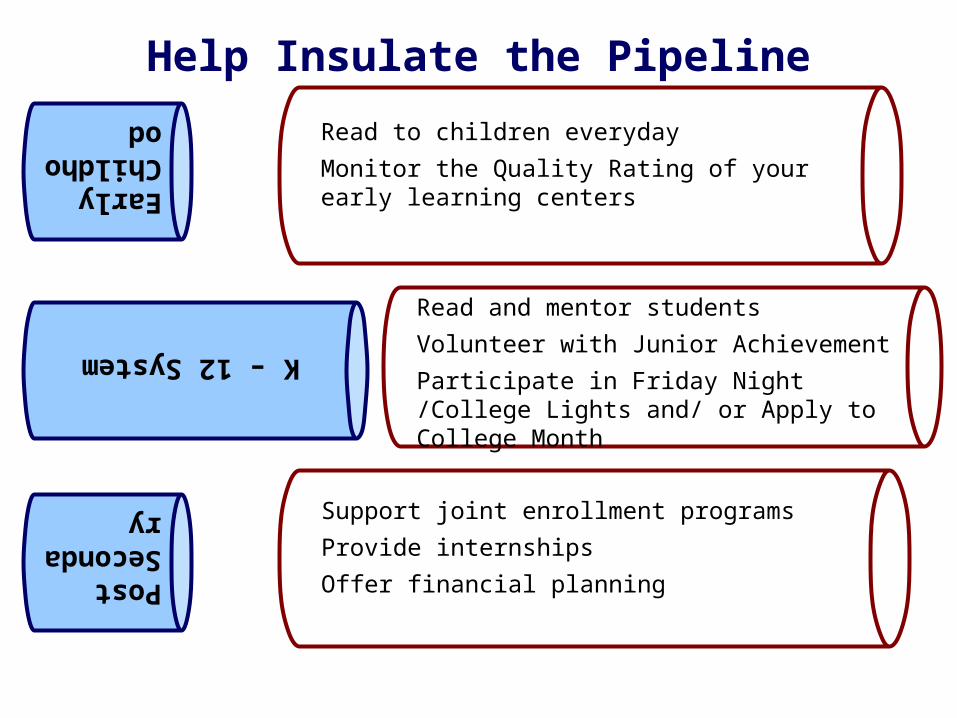
Help Insulate the Pipeline
Post Secondary
Read to children everyday
Monitor the Quality Rating of your early learning centers
Read and mentor students
Volunteer with Junior Achievement
Participate in Friday Night /College Lights and/ or Apply to College Month
Support joint enrollment programs
Provide internships
Offer financial planning
Early Childhood
K – 12 System