
GEORGE WEISS CENTER and - Wharton...
31
-
Upload
phungkhanh -
Category
Documents
-
view
220 -
download
0
Transcript of GEORGE WEISS CENTER and - Wharton...


Canadian Imperial Bank of Commerce (CIBC) is affiliated with CIBC Oppenheimer Corp., a New York Stock Exchange member. The CIBC and Oppenheimer trademarks are used under license. CIBC Oppenheimer Corp. is solelyresponsible for its contractual obligations and commitments.
GEORGE WEISS CENTERFOR INTERNATIONAL FINANCIAL RESEARCH
WHARTON SCHOOL, UNIVERSITY OF PENNSYLVANIA
and
CIBC WORLD MARKETS
1998 Survey of Financial Risk Managementby U.S. Non-Financial Firms
written by
Gordon M. Bodnar and Richard C. Marston,Wharton School, University of Pennsylvania
andGreg Hayt, CIBC World Markets
July 1998

Wharton/CIBC World Markets 1998 Financial Risk Management Survey: Executive Summary p. 1
WHARTON/CIBC WORLD MARKETS 1998 SURVEY OFFINANCIAL RISK MANAGEMENT BY U.S. NON-FINANCIAL FIRMS
Executive Summary
This is the third in a series of surveys on financial risk management practice and derivativesuse by non-financial corporations in the United States undertaken by the Weiss Center forInternational Financial Research of the Wharton School. This 1998 survey, written in partnershipagain with CIBC World Markets, extends the previous two surveys by asking new questionsabout certain aspects of derivative use and risk management practice. Among the key findingsare the following:
(1) There is no evidence that the number of firms using derivatives has declined overtime (as a result of well-publicized derivative losses at Proctor & Gamble and other firms).Among firms participating in one or more of our previous surveys, the proportion usingderivatives is unchanged. Among firms using derivatives, 42% report that their usage hasactually increased as opposed to 13% who report that their usage has decreased.
(2) As in past surveys, the use of derivatives is much higher among large firms (83%)than among small firms (12%), and higher among primary product firms (68%), andmanufacturers (48%) than among firms in the service industry (42%). But, the intensity ofuse of derivatives by service firms is increasing significantly faster than for other firms.
(3) A surprisingly large percentage of firms (73%) report that FASB’s new rulegoverning derivatives activity will have no effect on their derivative use or risk managementstrategy.
(4) A new question about revenue and expense exposure in foreign currency reveals awide range of exposure across firms. For example, 40% of the firms with foreign exchangeexposure report that their revenues in foreign currency are 20% or more of total revenues,and almost as large a percentage report foreign currency expenses to be 20% or more of theirtotal expenses. On the other hand, 60% of the firms report that they have a balance betweentotal foreign currency revenues and expenses (though this may not be true for revenues andexpenses in each currency).
(5) Among firms with significant foreign exchange exposure that regularly hedge, thereseems to be a general tendency to hedge only a small fraction of the total foreign currencyexposure of the firm. Even in the case of payables and receivables, for example, the averagefirm hedges less than 50% of the perceived exposure.
The majority of hedges, moreover, are short-dated. 82% of firms use foreign currencyderivatives with a maturity of 90 days or less and for 40% of firms, these account for themajority of their foreign currency derivative use.

Wharton/CIBC World Markets 1998 Financial Risk Management Survey: Executive Summary p. 2
(6) A wider variety of options have become common in the marketplace in the last fewyears, but firms continue to use standard European-style or American-style options muchmore than such exotic options as average rate, basket, or barrier options.
(7) When asked which best describes how the risk management function is evaluated,40% of the firms chose increased profit relative to a benchmark or absolute profit rather thanreduced volatility (40%) or risk adjusted performance (21%). In addition, 32 % of firms thatuse derivatives reported that their market view of exchange rates leads them to “actively takepositions” at least occasionally. A similar result is found for the market view of interestrates.
(8) Most firms seem to have internal controls over derivative use. A large percentage ofrespondents, 86%, have either a written policy about the use of derivatives or a regularschedule for reporting derivative use to the firm’s board of directors.
(9) Firms are concerned about counterparty risk, especially when longer-datedderivatives are concerned. 40% of the firms using derivatives insist on a credit rating of AAor better for their counterparty, an insistence that precludes derivative transactions with manyU.S. banks.

Wharton/CIBC World Markets 1998 Financial Risk Management Survey: Report p. 1
WHARTON/CIBC WORLD MARKETS 1998 SURVEY OFFINANCIAL RISK MANAGEMENT BY U.S. NON-FINANCIAL FIRMS
I. INTRODUCTIONThis is the third in a series of surveys on financial risk management practice and derivatives
use by non-financial corporations in the United States undertaken by the Weiss Center forInternational Financial Research of the Wharton School and CIBC World Markets. The results ofthe two earlier surveys, carried out in 1994 and 1995, are published in Financial Management andhave been widely cited in the business and academic press.1 The 1998 survey, once againsponsored by CIBC World Markets, extends the previous two surveys by asking new questionsabout certain aspects of derivatives use and risk management practice. This report provides asummary of the responses to the questions on the 1998 survey, both in total and, when responsesdiffer, conditional on size and industrial sector. Also, where appropriate, current responses arecompared with responses to similar questions on previous surveys. However, caution is requiredin interpreting some of those comparisons as some differences may result simply from changes inthe set of responding firms. A copy of the questionnaire with the response tallies is displayed inthe Appendix.
As with the previous surveys, one of the primary objectives of this survey is the developmentof a database on risk management practices suitable for academic research. The survey results canbe linked with industry and firm-specific characteristics of the respondents to allow economicanalysis of the responses. However, as in the past, the firm-specific responses are confidential andknown only to the researchers at Wharton.
II. USE OF DERIVATIVES
A. Sample Firms and Overall Derivative Usage
The six-page questionnaire was mailed in October 1997 to the same basic sample of firmsused in the 1994 and 1995 surveys. The sample consists of the original randomly selected 2000publicly traded firms used in 1994 plus the remaining 154 non-financial Fortune 500 firms addedin 1995. Due to mergers, buyouts, and bankruptcies since 1994, this sample currently consists of1928 firms. A second mailing of the questionnaire was done in March 1998. 399 firms returned acompleted survey, yielding a response rate of 20.7%. Of these firms, 197 are from themanufacturing sector, 82 are from the primary products sector, which includes agriculture,mining, and energy, as well as utilities, and 120 are from the service sector. In terms of size, 160firms are from the large category, consisting of firms with fiscal year 1996 total sales greater than$1.2 billion, 116 are from the medium-sized category, with total sales between $1.2b and $150mand 123 are from the small category, with total sales less than $150m.2
1 The report on the 1994 survey can be found in Financial Management 24, Fall, 1995, and the report on the 1995 survey canbe found in Financial Management 25, Winter, 1996. These results of these studies have been cited in Barrons, BusinessWeek, Financial Times, The Economist, Forbes, and the Washington Post, among others.
2 These size groups were defined based upon cutoff points that divided the entire sample of 1928 firms into three equal sizedgroups. Given our response total, equivalent response rates across size groups would imply 133 responses per group.

Wharton/CIBC World Markets 1998 Financial Risk Management Survey: Report p. 2
The first question in the survey asksfirms whether they use derivatives. 200of the firms, 50%, report usingderivatives. Table 1 displays thebreakdown of the first question. In the“Full Sample” row of Table 1, wecompare this usage rate with that of theprevious two surveys. The resultssuggest that the percentage ofresponding firms using derivatives hasincreased each year. However, thisincrease over time may be a combinationof the change in the sample in 1995and/or variation in response composition.A better way to compare derivatives useover time is to compare the response ofthe same set of firms. In the second rowof Table 1, we report the usagepercentages for the 58 firms that responded to all three surveys. Interestingly, in all three yearsthe percentage of derivative users from this group is 41%, although several firms switch betweenuse and non-use across years. Because of the limited number of firms that responded to all threesurveys, we also report the usage percentages for the 171 firms that responded to both the 1994and the 1998 surveys. These percentages, reported in the bottom row of Table 1, are also thesame in both years at 44%. Overall, these results suggest that the percentage of firms usingderivatives has remained constant over the past three years.
B. Change in Usage Intensity
While the evidence suggeststhat the percentage of firms usingderivatives has not changednoticeably, we were interested indetermining whether there was anychange in the intensity of usageamong the firms that usederivatives. To consider this,Question 2 asks the derivativeusing firms to indicate how theirderivative usage in the current yearcompared to usage in the previousyear (based upon the notionalvalue of total contracts). Figure 1displays the response to thisquestion. 42% of derivative usersindicated that their usage had increased over the previous year, compared to just 13% whoindicated a decrease. The remaining firms indicated that their usage had remained constant.
46%
13%
42%
0% 10% 20% 30% 40% 50%
usage has
increased
usage has
decreased
usage has
remained constant
Figure 1: Firms’ Derivatives Usage Compared to Previous Year
Table 1: Comparison of Derivative Usage AcrossSurveys
Yearof
Survey
Percentage ofRespondents using
Derivatives
This Survey 1998 50%
Previous Years’ Surveys19951994
41%
35%
Firms responding to allthree surveys (58 firms)
199819951994
41%
41%
41%
Firms responding in both1994 & 1998 (171 firms)
1998
1994
44%
44%

Wharton/CIBC World Markets 1998 Financial Risk Management Survey: Report p. 3
Overall, these responses suggest that a significant proportion of derivative users is findingderivatives helpful enough that they are choosing to increase their usage.
C. Derivative Usage Conditional on Size and Activity
Figure 2 presents the percentage of current derivative users broken down by size group andindustrial sector. In the size dimension, usage is heaviest among large firms at 83%. Thederivative usage rate drops to 45% for medium-sized firms and to 12% for small firms. That largefirms are so much more likely to use derivatives is suggestive of an economies-to-scale argumentfor derivative use, with large firms better able to bear the fixed cost of derivatives use comparedto small firms. In the industrial dimension, derivatives usage is greatest among primary productproducers at 68%. Given that futures exchanges were originally established to help managecommodity risks, it is not surprising that such a large percentage of primary product producersuse derivatives. Among manufacturing firms 48% use derivatives, much of this likely driven byforeign currency exposure arising from foreign operations or exporting/importing. But evenamong service firms, 42% use derivatives, most likely because of the increased internationalizationof service firms and the growing need to manage foreign currency exposure.
The change in derivative usage also varies across these groupings. Service firms are nearly
twice as likely to have increased derivative usage than manufacturing or primary product firms.Also, not a single small firm indicated that it had decreased its derivative usage over the previousyear. These responses suggest that the usage rate is increasing most among groups where overallderivative usage is least common.
Figure 2: Derivatives Usage Response Rates by Size and Sector
42%
48%
68%
12%
45%
83%
0% 10% 20% 30% 40% 50% 60% 70% 80% 90%
Services
Manufacturing
Primary Products
Small
Medium
Large

Wharton/CIBC World Markets 1998 Financial Risk Management Survey: Report p. 4
D. Approach to Risk Management Across Risk Classes
Financial price risk can be classified into four broad classes: foreign currency, interest rate,commodity and equity risk. We were interested in the percentage of firms that used derivatives tomanage risk in each of these four classes. The responses to this question are displayed as thewhite bars in Figure 3. The figure reveals that of the firms using derivatives, foreign exchange(FX) is the risk most commonly managed with derivatives, being done so by 83% of all derivativeusers. Interest rate (IR) risk is the next most commonly managed risk with 76% of firmsindicating IR derivatives use. Commodity (CM) risk is managed with derivatives by 56% ofderivative users, while equity (EQ) risk is the least commonly managed risk at just 34%.3 Itshould be noted that unlike EQ risk and IR risk, which are likely to be faced by all firms, somefirms will not directly face FX and CM risk because of the nature of their activities.Consequently, the usage of derivatives in these classes, conditional on having an exposure, will beeven higher than the numbers displayed in the figure.
The responses to this question conditional on industry display an interesting pattern. Amongprimary product firms, commodity risk is the most commonly managed risk with 79% of thesefirms indicating CM derivative use. FX risk is most commonly managed by manufacturing firmswith 95% of this group indicating FX derivative use. For service firms, IR risk was slightly morecommonly managed with derivatives than FX risk, with derivative usage rates of 78% versus72%, respectively. Equity risk was managed least frequently by service firms with only 22%indicating EQ derivative use.
3 Examples of equity risks that are commonly hedged with equity derivatives by non financial firms include using equity putsas part of a share repurchase program, or using total return swaps to monetize equity positions in other companies.
96% 4%
34%
67% 21% 12%
56%
94% 5% 1%
76%
89% 9% 2%
83%
0% 20% 40% 60% 80% 100%
FX
IR
CM
EQ
Ris
k C
lass
es
Figure 3: Risk Management Approach Across Risk Classes
Centralized Decentralized with Centralized Coordination
Decentralized
Percent of Derivatives Users Active in that Class
Risk Management Approach:

Wharton/CIBC World Markets 1998 Financial Risk Management Survey: Report p. 5
Because of the different nature of these risk classes and the fact that they are often managedseparately within firms, we also asked the firms to indicate their approach, in terms of decision-making structure, to managing each class of risk. We allowed firms to choose between i) riskmanagement activities being primarily centralized, ii) risk management decisions primarilydecentralized with centralized coordination, or iii) risk management activities primarilydecentralized. The responses to this inquiry are also shown in Figure 3 as the multicolored barsunder each risk class. As can be seen, centralized risk management activities are overwhelminglymost common, with the only exception being commodity risk management where one-third offirms indicated some degree of decentralized structure.
E. Concerns about Derivatives Usage
The use of derivatives in today’s market involves many issues. Question 4a asks respondentsto indicate their degree of concern about a series of issues regarding the use of derivatives. Theseissues include: accounting treatment, credit risk, market risk (unexpected changes in price ofderivatives), monitoring and evaluating hedge results, reaction by analysts and investors, SECdisclosure requirements, and secondary market liquidity (ability to unwind transactions). For eachissue, firms are asked to indicate a high, moderate, or low level of concern or indicate that theissue is not a concern to them. Firms were also given the option of listing any other issues of highconcern to them regarding derivative use. Figure 4 displays the responses. Given the propensityof a majority of firms to indicate a moderate concern with many issues, the figure displays thepercentage of firms indicating a high or low degree of concern for the six issues.
Accounting treatment was the issue causing the most concern among derivative users, with37% of firms indicating a high concern and only 15% low or no concern with this issue.Undoubtedly, this is the result of the August 1997 release by the FASB of a draft proposal for a
Accounting Treatment
Market Risk
Monitoring /EvaluatingHedge Results
Credit Risk
Secondary Market Liquidity
SEC DisclosureRequirement
Reaction byAnalysts/Investors
Figure 4: Concerns Regarding Derivatives
38%18%
27%21%
40%21%
35%25%
26%29%
27%31%
15%37%
0% 10% 20% 30% 40%
Low High

Wharton/CIBC World Markets 1998 Financial Risk Management Survey: Report p. 6
new accounting standard for the measurement and reporting of derivatives. Market risk, definedas unforeseen changes in the market value of derivative positions was the next issue mosttroubling firms, with 31% of firms indicating a high degree of concern and 34% of firms indicatinglittle or no concern. This was followed closely by monitoring and evaluating hedge results with29% of firms indicating a high degree of concern but 29% indicating little or no concern. Theremaining four issues all had significantly more firms indicating little or no concern compared tohigh concern. In the case of credit risk, secondary market liquidity, and reaction by analysts andinvestors, more than 40% of firms indicated low or no concern with these issues. For credit risk,this result contrasts markedly with the 1995 survey in which it was the issue causing the mostconcern among derivative users. Among the “other issues” that some firms indicated highconcern about were transaction costs and unauthorized trading.
We also asked firms to indicate their most serious concern from the items listed above.The percentage of firms indicating each concern as their most serious are displayed on the righthand edge of Figure 4. Interestingly, market risk came in first with 27% of firms indicating this astheir most serious concern. This was followed closely by accounting treatment with 26% of firmsranking as their most serious concern. Despite the large percentage of firms indicating little or noconcern about credit risk, 14% ranked this as their most serious concern just ahead of monitoringand evaluating hedges which was ranked the most serious concern by 13% of firms.
F. Likely Impact of FASB’s New Accounting Rules
Given the degree of concern regarding the accounting treatment of derivatives, we wereinterested in investigating the potential impact of the FASB’s new accounting standard, StatementNo. 133, "Accounting for Derivative Instruments and Hedging Activities." This new standard,originally released in draft form in June 1996, then modified and re-released in August 1997, andthen formally issued in June 1998, requires some significant changes to the way derivatives aremeasured and reported in the firm’s financial statement. It also provides official recognition to theuse of a broader array of derivative for use in hedging transactions. Roughly speaking, the newproposal requires all derivatives be recorded on the balance sheet at fair market value and markedto market each reporting period. Changes in market value are either reported in income eachperiod, or directly in the equity section of the balance sheet, depending on the specific use of thederivatives. The rule also essentially covers all derivative instruments, including derivativesembedded in other securities, thus expanding the set of derivatives instruments for whichaccounting rules are explicitly stated.
In Question 5, we asked firms to indicate the most likely impact on their risk managementactivities of the FASB’s new rule on derivatives accounting. Table 2 displays the results. For 73%of firms, the new rules will have no effect on their derivative use or their risk managementstrategies. Of the 27% of firms for whom the new rules will cause some change, the most likelyeffect is a change in the type of instruments used, with 55% of these firms indicating this change.Other commonly chosen effects include a reduction in the use of derivatives and a change in thetiming of hedging transactions.

Wharton/CIBC World Markets 1998 Financial Risk Management Survey: Report p. 7
Table 2: Impacts of FASB’s New Rule Governing Derivatives Accounting
Most Likely Impact:Percentage of Firms
Responding*
No effect on derivative use or risk management strategy 73%Firms FindingFASB effects
A reduction in the use of derivatives 38%
An increase in the use of derivatives 9%
A change in the types of instruments used 55%
A change in the timing of hedging transactions 38%
A significant change in the firm’s overall approach to risk management 13%
* Percentages in right column are with respect to those firms not agreeing with the first statement.
III. FOREIGN EXCHANGE EXPOSURE MANAGEMENT
A. Currency Exposure
The next section of questions addressesthe issue of currency exposure and itsmanagement using derivatives. As shownabove, foreign currency derivatives are themost commonly used class of derivatives with83% of derivative-using firms utilizing them.Before asking detailed questions on foreigncurrency derivative use, we were interested inlearning about the exposure of the samplefirms. To do this, Question 7 asks firms toindicate their percentage of total revenues andcosts in foreign currency. The responses tothis question for revenues and expenses aswell as net foreign currency position aredisplayed in Table 3.
As the table shows, a reasonablepercentage of firms report either no foreigncurrency revenue or no foreign currencycosts. On the other hand, 40% of firmsreport foreign currency revenues to be 20%or more of total revenues, while 36% of firmsreport foreign currency expenses to be 20%or more of total expenses. So there are manyfirms in the survey that have significantforeign currency exposure.
Table 3: Foreign Currency Revenues and ExpensesAmong Derivatives Users
% of Firms Responding in Each Category
% of total Revenues Expenses Imbalance
-50 8% 0%-40 5% 1%-30 11% 1%-25 6% 0%-20 6% 1%-15 7% 2%-10 12% 4%-5 20% 6%0 28% 25% 60%5 14% 9%
10 11% 6%15 6% 2%20 6% 5%25 6% 3%30 9% 1%40 7% 0%
50+ 12% 0%Table displays the frequency distribution of firm responses to the question:What percentage of your total revenues/expenses is denominated in foreigncurrency. Expenses are displayed as negative values. Third column is theimbalance of FC revenues and expenses for firms reporting both revenues andexpense results.

Wharton/CIBC World Markets 1998 Financial Risk Management Survey: Report p. 8
The fourth column of the table displays the net imbalance of foreign currency revenues andexpenses for the firms. It is interesting that a majority of firms roughly balance out total foreigncurrency revenues with foreign currency expenses. Although the responses mask whether theexpenses and revenues are in the same foreign currencies, and thus many of these balanced firmsmay have exposures to particular foreign currencies, this pattern suggests that natural hedging is acommon way for firms to manage their exposure to exchange rates. Of the firms that report a netimbalance in total foreign currency revenues and costs, there are nearly twice as many firms with anet revenue exposure (26%) than a net expense exposure (15%).
Conditionally, these revenue and expense exposures exhibit several interesting characteristics.First of all, large and medium firms are both substantially net-revenue exposed, while the smallfirms are, on average, net-expense exposed. Across industries, manufacturing and service firmsare heavily revenue exposed with more than three times as many net-revenue exposed firms asnet-expense exposed firms. This is offset by a heavy net-expense exposure on the part of theprimary product firms.
B. Transactions In Foreign Currency Derivative Markets
As in the previous two surveys, firms were asked to indicate how often they transacted in theforeign currency derivatives market for hedging eight frequently cited exposures. These werecontractual commitments--both on-balance sheet (i.e., payables and receivables) and off-balancesheet (i.e., signed contracts pending), anticipated transactions within one year, anticipatedtransactions beyond one year, economic/competitive exposure, translation of foreign accountingstatements, and foreign repatriations. As foreign currencies may be used for financing purposes,we also asked about the frequency of transactions to arbitrage borrowing rates across currencies.Figure 5 reports the percentage of firms who “frequently” or “sometimes” transacted in theforeign currency derivatives markets for each of these reasons (expressed as a percentage of firmsresponding to the question for whom the exposure was applicable).
5% 35%
32% 46%
14% 23%
11% 28%
12% 45%
46% 39%
24% 40%
54% 35%
0% 10% 20% 30% 40% 50% 60% 70% 80% 90%
Hedge On B/SCommitments
Hedge Off-B/SCommitments
Hedge AnticipatedTransactions <1 yr.
Hedge AnticipatedTransactions >1 yr.
Hedge CompetitiveExposure
Hedge Translation
Hedge Repatriations
Arbitrage RatesAcross Currencies
Frequently Sometimes
Figure 5: Reasons for FX Derivatives Transactions

Wharton/CIBC World Markets 1998 Financial Risk Management Survey: Report p. 9
The figure shows that the most frequently cited motivations for transacting in the foreigncurrency derivatives markets are for hedging near-term, directly observable exposures. The mostcommonly hedged exposures were On Balance Sheet Commitments (89% hedge frequently orsometimes), Anticipated Transactions expected within one year (85% hedge frequently orsometimes) and Foreign Repatriations (78% hedge frequently or sometimes)4. Identifiable off-balance sheet commitments are substantially less likely to be hedged by these firms than onbalance sheet commitments. Anticipated transactions beyond one year are frequently hedged by12% of the firms but sometimes hedged by 45%, suggesting that a majority of firms using foreigncurrency derivatives at least sometimes hedge exposures over a longer horizon. The moreamorphous and longer term competitive exposure is hedged frequently by just 11% of firms butsometimes by an additional 28%, which is a noticeable increase from past surveys. Hedgingtranslation exposure was a reason for currency derivatives transactions for only a minority offirms, with 14% percent doing this frequently and another 23% doing so sometimes. Finally,transacting in derivatives to hedge exposures from arbitraging interest rates across currencies wasdone frequently by only 5% of firms; however, 35% of firms indicated that they do thissometimes.
C. Hedging Intensity
Not much is known about the extent to which firms hedge their various exposures, so in thisyear’s survey we asked firms to indicate the percentage of the perceived exposure that theytypically hedge across various categories of currency exposure. The responses were aggregatedinto four classes, firms that hedge 0-25%, 26-50%, 51-75%, and 76-100 of that particularexposure. Table 4 displays the percentage of firms that responded in each of the four groups foreach of seven different categories of exposure. In each case, the percentages are taken only with
Table 4: Percentage of Foreign Currency Exposures Typically Hedged
Percentage of firms responding in the followingranges for the proportion of exposure hedged
Exposure Category 0-25% 26-50% 51-75% 76-100%
Average %of exposure
hedged
On-B/S Commitments 40% 13% 12% 35% 49%
Off-B/S Commitments 72% 11% 5% 13% 23%
Anticipated Transactions < 1 yr. 42% 22% 9% 27% 42%
Anticipated Transactions > 1yr. 78% 11% 4% 6% 16%
Economic/Competitive Exposure 90% 6% 2% 3% 7%
Translation of Foreign Accounts 84% 6% 3% 8% 12%
Repatriations 50% 14% 5% 31% 40%
Percentages taken of all responding firms that indicated that the exposure was applicable to them.
4 Given that not all firms using currency derivatives have foreign operations from which to repatriate, these numbers suggestthat an even larger proportion of the set of multinational firms use currency derivatives hedge foreign repatriations.

Wharton/CIBC World Markets 1998 Financial Risk Management Survey: Report p. 10
respect to those responding firms that indicated that such an exposure was applicable in theprevious question.
The table reveals that with the exception of three types of exposure--on-balance sheetexposures, anticipated transactions less than one year and foreign repatriations--the majority offirms hedge less than 25% of their perceived exposures. Even for these three heavily hedgedexposures, the average proportion hedged, shown in the final column of the table, is less than50%. Only for on-balance sheet commitments does the average percentage of the exposurehedged reach 50%. Thus, partial hedging appears to be normal practice for these firms. Even inthe cases of these three types of exposures, only a third of firms indicated that they hedged morethan 75% of the total exposure. Again, these three were the more easily identifiable, near-term,transaction-based exposures. For longer term exposures such as anticipated transactions beyondone year and economic/competitive exposure, less than 10% of firms indicated that they hedged asmuch as 75% of the perceived exposure. These results suggest that foreign currency hedging,rather than eliminating exposures, generally only reduces the exposures, but typically by less thanhalf of the original outstanding exposure.
D. Maturity Structure of Hedging
In the 1995 survey, we learned that most firms use derivatives with short maturities. Thepercentage of firms using derivatives at longer maturities decreased significantly with the maturityof the derivatives; only 30% of firms reported any use of derivatives with tenor greater than threeyears. Again, we asked firms to provide some information on the maturity structure of theirforeign currency hedging. Table 5 displays the results of our inquiry asking firms to indicate thepercentage of their foreign currency hedging done with instruments of various original maturities.
Table 5: Percentage of Hedging at Various Maturities
Proportion of responding firms indicating the percentage of theirtotal foreign currency derivatives with various original maturities
Derivative Maturity 0% 1-25% 26-50% 51-75% 76-100%
1 day - 90 days 18% 23% 26% 13% 21%
91 – 180 days 23% 44% 26% 3% 4%
181 days - 1 year 31% 41% 22% 3% 3%
1 year – 3 years 63% 26% 7% 0% 5%
More than 3 years 88% 9% 1% 0% 2%
There are several interesting things to note about Table 5. First, short-term derivatives areused by a vast majority of firms. 82% of firms utilize foreign currency derivatives with an originalmaturity of 90 days or less, and 77% use foreign currency derivatives with an original maturity of91 - 180 days for less while only 12% use foreign currency derivatives with maturities of morethan 3 years. Second, firms tend to concentrate most of their foreign currency derivatives usageat the short horizon, especially 90 days or less. In fact, when we combine the responses in thefirst two rows, nearly one-quarter of the firms do all of their foreign currency derivative activity ininstruments with original maturities of 180 days or less. Finally, the intensity of usage drops offdramatically with the lengthening of the maturity of the derivatives. Very few firms use anyinstruments with maturities over one year. There is a small group, 7%, of firms, all large firms,

Wharton/CIBC World Markets 1998 Financial Risk Management Survey: Report p. 11
which concentrate their foreign currency derivative usage only in the long horizon instruments.However, this is a significant reduction from the previous survey when 16% of firms had morethan half of their derivative activity in instruments with maturities longer than one year.
E. Impact of a Market View on Foreign Currency Derivatives Use
Although financial research has suggested that it is virtually impossible to outperform theexpectations of future rates embedded in the market rates, financial managers have typically foundit difficult to avoid letting their own view of the currency market affect their risk managementactivities. Just as in the previous two surveys, we asked firms to indicate the frequency withwhich their market view causes them to alter the timing or size of hedges or to actively take aposition in the market using derivatives. The responses to this question are presented in Figure 6.
In response to the first two parts of the question, 10% of firms indicated that their market
view on exchange rates “frequently” altered either the size or the timing of hedges that they made.A substantially larger number of firms occasionally incorporate their market view into theirhedging decision, with 49% of firms sometimes altering the timing of their hedges and 51%sometimes altering the size of their hedges. Without entering the debate about what constitutes ahedge and what constitutes speculation, it is apparent that a majority of firms sometimes takes intoaccount their opinion about market conditions when choosing a risk management strategy. Asmaller, but still substantial, proportion of firms “actively take positions” based on a market viewof the exchange rate. While only 6% of firms “frequently” take positions, another 26% do so atleast “sometimes”. While the percentage of firms that alter the size of their hedge is similar to theprevious survey, the percentage of firms that sometimes alter the timing of a hedge or sometimesactively take positions has decreased from 33% to 26 %.
10%
49%
10%
51%
6%
26%
0%
10%
20%
30%
40%
50%
60%
70%
Alter the Timing of a Hedge
Alter the Size of a Hedge
Actively take Positions
Frequently Sometimes
Figure 6: Impact of a Market View on FX Risk Management

Wharton/CIBC World Markets 1998 Financial Risk Management Survey: Report p. 12
F. Benchmark for Evaluating Foreign Currency Risk Management
One of the new questions asked this year focuses on the benchmarks that firms use to evaluatethe risk management process. For foreign currency risk management, we asked firms about thebenchmark they use for evaluating foreign currency risk management over the budget/planningperiod. Figure 7 displays the responses.
44% of firms indicated that they did not have a benchmark for evaluating the foreign currencyrisk management process. Of the remaining responding firms, the most common benchmark wasthe use of the forward rates available at the beginning of the budget/planning period. 42% of thefirms with some benchmarking used the forward rates, which is a simple and reasonable approachto the question. 24% of the firms indicated that they simply use the spot rates available at thebeginning of the period. This approach is questionable on theoretical grounds as the current spotrates do not incorporate any market expectations of currency movements over the period nor dothey offer rates at which any risks could actually be laid off. 17% of the firms with some form ofbenchmark use a baseline percent hedged strategy. The firms indicated that the baselines for thesebenchmarks typically ranged from 50% - 100% hedged. Finally, 17% of the firms indicated theuse of some other form of benchmark. Examples of these include comparison against fully openand fully hedged results, comparison against an average executable rate over a period, comparisonagainst some combination of a forward and option hedge, and simple profit and loss on currencyderivatives. While some of these ideas have more merit than others, it is disturbing that nearly halfof the firms do not have a well-specified benchmark for evaluating whether their foreign currencyrisk management process is providing any useful service to the firm.
17%
17%
24%
42%
44%
0% 5% 10% 15% 20% 25% 30% 35% 40% 45%
No Benchmark
Beginning of PeriodForward Rates
Beginning of PeriodSpot Rates
Baseline PercentHedged Strategy
Other Benchmark
Figure 7: Benchmark for Evaluating Foreign Currency
Risk Management
Of those witha benchmark:

Wharton/CIBC World Markets 1998 Financial Risk Management Survey: Report p. 13
IV. INTEREST RATE EXPOSURE MANAGEMENTFigure 8 displays the results from our question about motivations for interest rate derivative
transactions. Nearly all firms that use interest rate derivatives reported using them to swap fromfloating rate debt to fixed rate debt. While only 13% of firms indicated that they do thisfrequently, 83% of firms indicated that they use interest rate derivatives to do this sometimes. Incontrast, just 60% of firms indicated that they use interest rate derivatives to swap from fixed ratedebt to floating rate debt with most firms doing so only sometimes as opposed to frequently.Compared to the 1995 survey results for this question, there has been an increase in the use offloating to fixed swaps and a decrease in the use of fixed to floating rate swaps. It is interesting tospeculate whether this shift in intensity is related to the general lowering of interest rates since1995 and the resulting increased desire of firms to lock in what they perceive to be favorable lowrates. In addition to swapping existing debt, interest rate derivatives are used by a majority offirms to fix the rate or spread on new or forthcoming debt issues as well as to take positions toreduce costs based upon a market view. While less than 10% of firms frequently use interest ratederivatives to take these actions, approximately half of the interest rate derivative using firms doesso sometimes. These frequencies are very similar to those reported in the previous surveys.Lastly, it is interesting to note that the percentages of firms reporting that they “frequently” useinterest rate derivative for various reasons are lower than in the foreign currency case. This isprobably because interest rate derivative transactions are large and infrequent as they are typicallyassociated with debt issuance, whereas most foreign currency derivatives use is transaction-basedand these transactions occur more frequently than debt issuance.
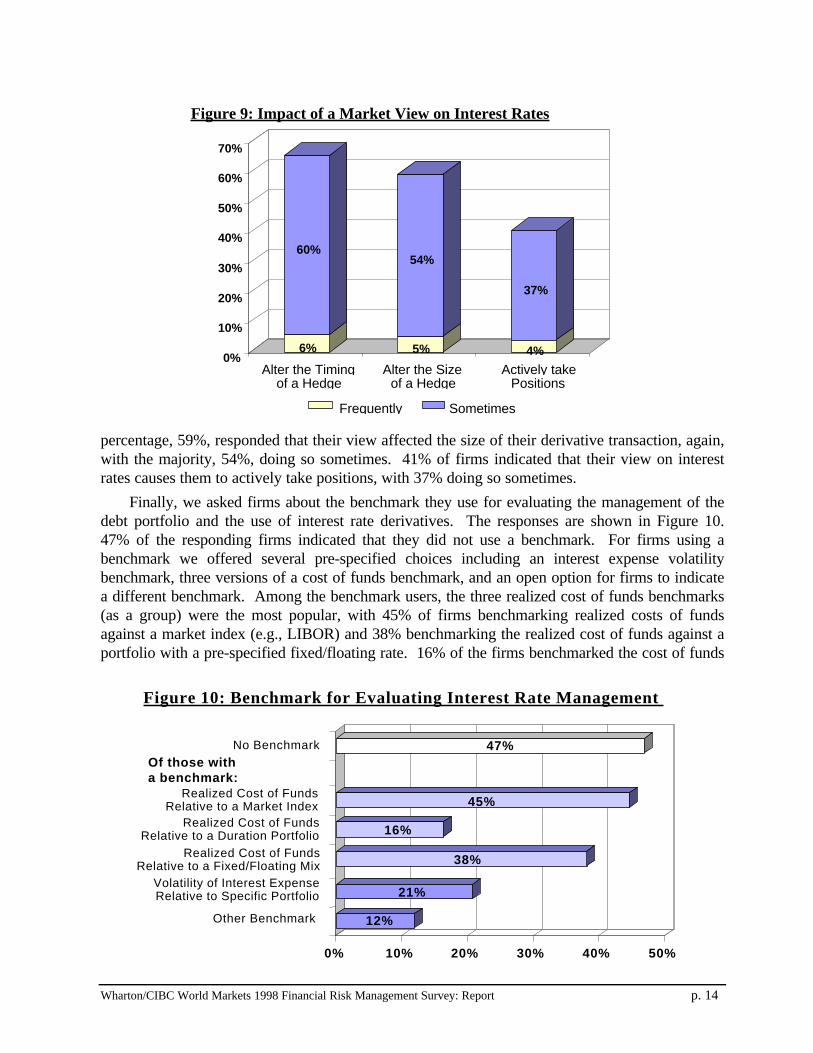
We also asked firms a similar question about whether their market view on interest ratescauses them to alter their interest rate derivatives usage. Figure 9 displays the responses. Theresponses are quite similar to those for the impact of a view on the foreign exchange market. 66%of firms indicated that their view on interest rates causes them to alter the timing of a transaction,60% of the firms doing so sometimes and just 6% doing so frequently. A slightly smaller
6% 48%
8% 50%
10% 50%
13% 83%
0% 20% 40% 60% 80% 100%
Swap from floating tofixed
Swap from fixed tofloating
Fix rates/spreads inadvance
Reduce costs basedupon a view
Frequently Sometimes
Figure 8: Reasons for Interest Rate Derivatives Transactions
Wharton/CIBC World Markets 1998 Financial Risk Management Survey: Report p. 14
percentage, 59%, responded that their view affected the size of their derivative transaction, again,with the majority, 54%, doing so sometimes. 41% of firms indicated that their view on interestrates causes them to actively take positions, with 37% doing so sometimes.
Finally, we asked firms about the benchmark they use for evaluating the management of thedebt portfolio and the use of interest rate derivatives. The responses are shown in Figure 10.47% of the responding firms indicated that they did not use a benchmark. For firms using abenchmark we offered several pre-specified choices including an interest expense volatilitybenchmark, three versions of a cost of funds benchmark, and an open option for firms to indicatea different benchmark. Among the benchmark users, the three realized cost of funds benchmarks(as a group) were the most popular, with 45% of firms benchmarking realized costs of fundsagainst a market index (e.g., LIBOR) and 38% benchmarking the realized cost of funds against aportfolio with a pre-specified fixed/floating rate. 16% of the firms benchmarked the cost of funds
12%
38%
16%
21%
47%
0% 10% 20% 30% 40% 50%
No Benchmark
Volatility of Interest Expense Relative to Specific Portfolio
Realized Cost of Funds Relative to a Market Index
Realized Cost of Funds Relative to a Duration Portfolio
Realized Cost of FundsRelative to a Fixed/Floating Mix
Other Benchmark
Figure 10: Benchmark for Evaluating Interest Rate Management
45%
Of those witha benchmark:
6%
60%
5%
54%
4%
37%
0%
10%
20%
30%
40%
50%
60%
70%
Alter the Timing of a Hedge
Alter the Sizeof a Hedge
Actively takePositions
Frequently Sometimes
Figure 9: Impact of a Market View on Interest Rates

Wharton/CIBC World Markets 1998 Financial Risk Management Survey: Report p. 15
against a portfolio with specific duration. Just 21% of the firms using a benchmark reported usinga volatility based benchmark. The remaining 12% of firms with benchmarks indicated the use ofsome other form of benchmark. Among their choices were benchmarking against competitorscost of funds or relative to the previous period.
V. OPTION CONTRACTSOne objective of this year’s survey was to gain a deeper insight into the use of options by
U.S. non-financial firms. We have learned in past years that options are generally less popularthan forwards in the FX area, swaps in the IR area and futures in the CM area. Option use tendedto be concentrated in exposures that are longer term and more contingent. Firms limited theiroption usage either because they felt some other instrument was better suited to the exposure orthey pointed to some obstacle to their use, such as excessive cost or lack of sufficient comfortwith their behavior. This year, we were interested in exploring some other aspect of option usage.Rather than as in the past, when we treated options as a homogenous group, we decided toexplore the usage of different flavors of options. The variety of options commonly used in themarket today has increased dramatically over the past few years. In addition to standard options,average rate options, barrier options, and option combinations are widely available in the over-the-counter market. Thus, we decided to ask firms to indicate their usage over the past twelvemonths of a variety of different options across the three common classes of risk, foreigncurrencies, interest rates, and commodities. The results are displayed in Table 6.
Of the 200 derivative using firms, 68% indicated that they had used some form of optionwithin the past 12 months. FX options were the most common, used by 44% of derivative usingfirms while IR and CM options were used by just 28% of derivative using firms. The results as tothe percentages of firms using different types of options are also displayed in Table 6. The firstcolumn of the table displays the total percentage of users of each type of option relative to allderivative-using firms. The next three columns display the percentage of those firms using eachtype of option in each of the three risk classes.
Table 6: Options Usage
% of users in each classTypes of Options
% of firmsusing FX IR CM
Any options 68% 44% 28% 28%
Standard European-style options 42% 67% 33% 30%
Standard American-style options 38% 41% 35% 44%
Average rate options 19% 39% 18% 45%
Basket options 9% 47% 29% 24%
Barrier options 13% 69% 19% 19%
Contingent Premium options 6% 42% 8% 42%
Option combinations 25% 42% 20% 48%
Others 5% 56% 56% 22%

Wharton/CIBC World Markets 1998 Financial Risk Management Survey: Report p. 16
The instrument-specific responses indicate that the standard European-style (exercisable onlyat maturity) and American-style (exercisable any time up to maturity) options are the mostcommonly used, with 42% of responding firms using European-style and 38% using Americanstyle. Option combinations such as collars, straddles, etc., are used by 25% of all derivative users.The most commonly used exotic option is the average rate option, which is different in that itspayoff is based upon the difference between the strike price and some average of the history ofprices. This type of option is used by 19% of derivative users. Barrier options, which come intoexistence or cease to exist when some price point is past, are used by 13% of firms, whilecontingent premium options, with deferred or contingent premium payments, have been used byjust 6% of firms in the past twelve months. Among the “other” type of options used arecompound options (i.e., options on options) and equity options generally. Another featurerevealed by the table is that options usage is heaviest in foreign currencies and commodities.Currency option usage is heaviest in the European-style and the exotic basket and barrier optionswhile commodity option usage is heaviest in the American-style and Asian options.
There are several notable conditional results to option usage based upon size and industrialsector. First, the percentage of firms using options is an increasing function of firm size. 74% oflarge firms that used derivatives indicated the use of some form of option within the past 12months. This compares with 58% of medium firms and 47% of small firms. By industry,manufacturing firms were most likely to use options with 78% indicating some use compared to67% of primary product firms and 50% of service firms. Manufacturing firms are substantiallymore likely to have used European-style relative to American-style options, while the opposite isweakly true for firms in the primary product and service sectors. Manufacturing firms are alsomore likely to have used barrier options, with most of this use being in the FX area. Finally,option combinations are most commonly used by primary product firms.
The derivative using firms that did not use options were asked to provide an explanation forthis decision. The overwhelming explanation for not using options focused around their costs,with a substantial number of firms complaining that they were “too expensive”. Among the otherexplanations for non-use were that options were not appropriate for the firm’s exposure or thatother instruments were better suited for their exposures, and that the firm lacked sufficient oradequately trained staff in order to use options.
VI. CONTROL AND REPORTING PROCEDURESAs we have done in the previous two surveys, we asked questions about internal policy
regarding derivative usage and reporting as well as corporate policies regarding monitoring andevaluation of derivative risks. To provide a sense of the change in the control and reportingenvironment for derivative usage among US non-financial firms, we will contrast the currentresults with those found in the previous surveys.5
5 Recall that differences in response frequencies across surveys can be influenced by differences in the set of responding firms.
Wharton/CIBC World Markets 1998 Financial Risk Management Survey: Report p. 17
A. Corporate Policy and Reporting
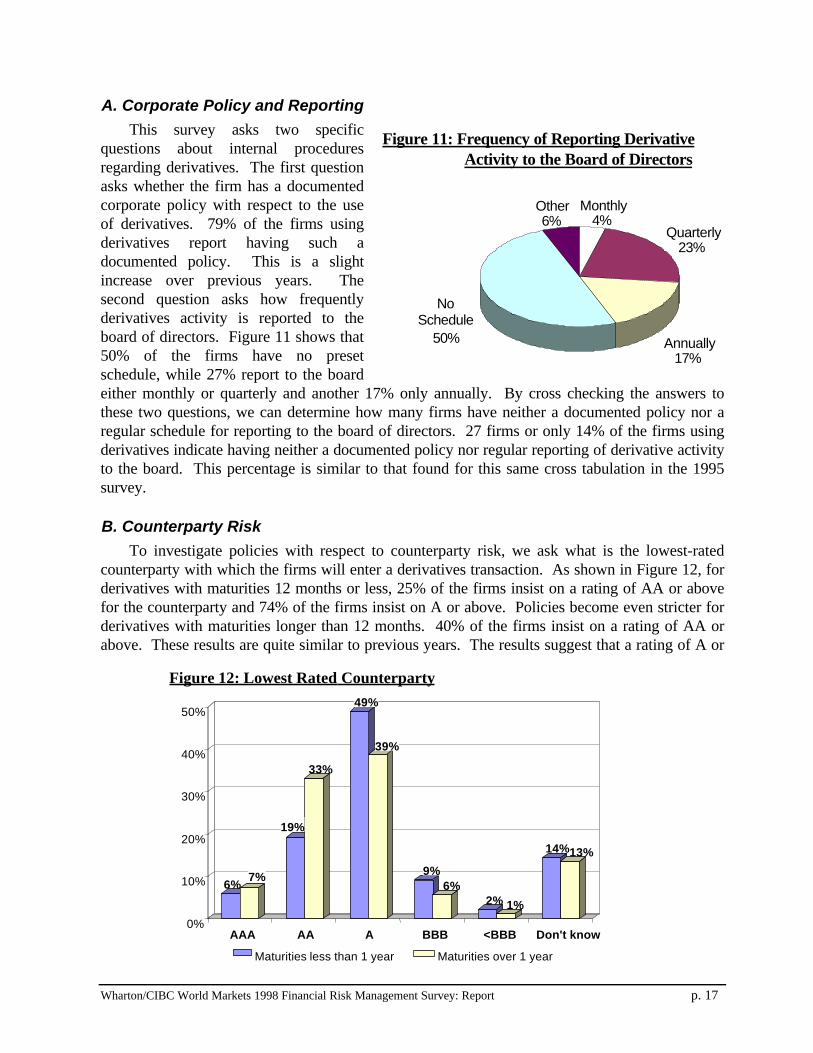
This survey asks two specificquestions about internal proceduresregarding derivatives. The first questionasks whether the firm has a documentedcorporate policy with respect to the useof derivatives. 79% of the firms usingderivatives report having such adocumented policy. This is a slightincrease over previous years. Thesecond question asks how frequentlyderivatives activity is reported to theboard of directors. Figure 11 shows that50% of the firms have no presetschedule, while 27% report to the boardeither monthly or quarterly and another 17% only annually. By cross checking the answers tothese two questions, we can determine how many firms have neither a documented policy nor aregular schedule for reporting to the board of directors. 27 firms or only 14% of the firms usingderivatives indicate having neither a documented policy nor regular reporting of derivative activityto the board. This percentage is similar to that found for this same cross tabulation in the 1995survey.
B. Counterparty Risk
To investigate policies with respect to counterparty risk, we ask what is the lowest-ratedcounterparty with which the firms will enter a derivatives transaction. As shown in Figure 12, forderivatives with maturities 12 months or less, 25% of the firms insist on a rating of AA or abovefor the counterparty and 74% of the firms insist on A or above. Policies become even stricter forderivatives with maturities longer than 12 months. 40% of the firms insist on a rating of AA orabove. These results are quite similar to previous years. The results suggest that a rating of A or
6%7%
19%
33%
49%
39%
9%6%
2% 1%
14%13%
0%
10%
20%
30%
40%
50%
AAA AA A BBB <BBB Don't know
Figure 12: Lowest Rated Counterparty
Maturities less than 1 year Maturities over 1 year
Figure 11: Frequency of Reporting DerivativeActivity to the Board of Directors
Monthly4%
Quarterly23%
Annually17%
NoSchedule
50%
Other6%

Wharton/CIBC World Markets 1998 Financial Risk Management Survey: Report p. 18
below significantly handicaps a bank in offering derivatives, especially those with longermaturities.
C. Monitoring and Evaluation
From previous surveys we havelearned that an important issue inmonitoring derivatives is to value themand measure their risk. Such monitoringhelps keep the firms abreast of marketchanges as well as provides a basis fordetermining sudden change in value andwhether such changes in value continueto constitute a sufficient hedge of theunderlying exposure. To this end, weasked firms to indicate how frequentlythey valued their derivatives portfolio.Figure 13 reports that a significantproportion of the firms, 28%, arerevaluing their derivative portfolio eitherdaily or weekly, while another 27% revalue monthly. Compared to the 1995 survey there hasbeen a shift towards valuing the derivatives portfolio less frequently. We were also interested inthe source of the valuations for the derivatives portfolio. In contrast to previous results where theoriginal dealer was the most important source for information about revaluing derivatives, firmsnow indicate that internal sources (such as software and simple spreadsheets with market data) arethe most relied upon method for revaluing derivatives. 43% of firms indicated that in-housesources are the most important source for revaluing derivatives, with just 38% indicating that theystill rely primarily on the original dealer. 26% of firms indicated a primary reliance on anotherdealer, consultant or professional price vendor. This increase in in-house valuations as theprimary source of valuation does not seem surprising given the widespread availability of low-costsoftware for end-user pricing.
With regard to the risk of the derivatives portfolio, we asked firms to indicate if they calculatea “value-at-risk” measure. Value at risk (VAR) is a technique for determining the value loss thatthe derivative portfolio could hypothetically suffer with some given probability and assumptionsabout the statistical properties of the underlying price processes. It originated as a method forcontrolling trading risks at banks and financial institutions but has subsequently been marketed tonon-financial corporations. 44% of the derivative users indicated that they calculated a value atrisk measure for some or all of their derivative portfolio. Use of VAR was much more commonamong large firms and firms in the primary products sector.
Finally, we were also interested in the firm’s philosophy for evaluating the entire riskmanagement function within the firm. The survey asks firms to choose among four statements theone that best matches the practice within the firms. The results are displayed in Figure 14. Themost popular choice was reduced volatility relative to some benchmark. This was the approach of40% of the respondents. 22% of firms indicated that they evaluated the risk management functionbased upon its ability to increase profits relative to some benchmark, while 18% used an absoluteprofit or loss approach to risk management evaluation. Finally, 21% of firms indicated that they
Daily19%
Weekly9%
Monthly27%
Quarterly
21%
Annually5%
As Needed/No Set Schedule
19%
Figure 13: How Frequently Do You Value Your Derivatives Portfolio

Wharton/CIBC World Markets 1998 Financial Risk Management Survey: Report p. 19
prefer to examine a risk adjusted performance measure (profits relative to volatility change) toevaluate the risk management function. Given that the purpose of risk management is to reducerisk rather than increase profits, it is surprising that 40% of the firms (22% + 18%) have a profitbased approach to risk management evaluation. Such an approach can provide incentives for riskmanagers to do take positions that may ultimately increase the total riskiness of the firm.
VII. NON-USE OF DERIVATIVESGiven that firms not using derivatives are as prevalent as firms using derivatives, we once
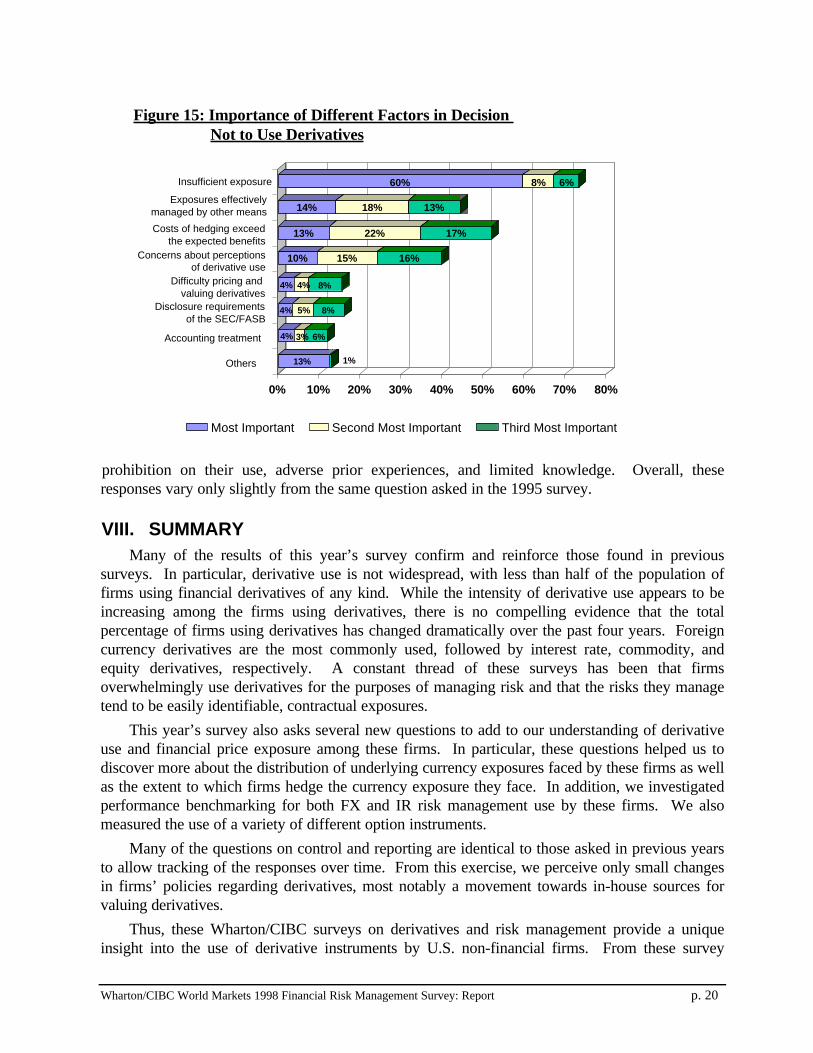
again asked firms that did not use derivatives to provide some information on why they choosenot to use them. To do this, we asked the non-users of derivatives to rank the three primaryfactors from a list of eight possible factors (including an “other” category) in their decision not touse derivatives. The responses to this question are shown in Figure 15.
The figure reveals that the majority (60%) of firms do not use derivatives because theirexposures are too small. An additional 14% of non-users with potentially large exposuresindicated that the most important reason they do not use derivatives is that they can manage theseexposures effectively by other means such as operational diversification or risk shifting/sharingarrangements.
Another group of non-users indicated that they did not perceive the benefits of derivatives useto exceed the costs, making their use a poor business decision. This was the most importantreason for not using derivatives for 13% of non-users, but a secondary or tertiary reason fornearly an additional 40% of the non-users.
The only other concern receiving much weight was the concern about perceptions ofderivatives use by others such as investors/analysts. 10% of the firms indicated that this was theprimary reason in their mind for not using derivatives, with an additional 31% citing it as asupporting explanation.
The other three specifically mentioned issues, difficulty pricing and valuing derivatives,concerns over disclosure requirements of the SEC and concerns over the new FASB accountingtreatment issues all generated only token measures of concern from the respondents. Among theother issues that more than one firm mentioned for not using derivatives were corporate
21%
18%
22%
40%
0% 10% 20% 30% 40%
Reduced Volatility Relative to a Benchmark
Increased Profit Relative to a Benchmark
Absolute Profit/Loss
Risk AdjustedPerformance
Figure 14: Evaluation of Risk Management Function
Wharton/CIBC World Markets 1998 Financial Risk Management Survey: Report p. 20
prohibition on their use, adverse prior experiences, and limited knowledge. Overall, theseresponses vary only slightly from the same question asked in the 1995 survey.
VIII. SUMMARYMany of the results of this year’s survey confirm and reinforce those found in previous
surveys. In particular, derivative use is not widespread, with less than half of the population offirms using financial derivatives of any kind. While the intensity of derivative use appears to beincreasing among the firms using derivatives, there is no compelling evidence that the totalpercentage of firms using derivatives has changed dramatically over the past four years. Foreigncurrency derivatives are the most commonly used, followed by interest rate, commodity, andequity derivatives, respectively. A constant thread of these surveys has been that firmsoverwhelmingly use derivatives for the purposes of managing risk and that the risks they managetend to be easily identifiable, contractual exposures.
This year’s survey also asks several new questions to add to our understanding of derivativeuse and financial price exposure among these firms. In particular, these questions helped us todiscover more about the distribution of underlying currency exposures faced by these firms as wellas the extent to which firms hedge the currency exposure they face. In addition, we investigatedperformance benchmarking for both FX and IR risk management use by these firms. We alsomeasured the use of a variety of different option instruments.
Many of the questions on control and reporting are identical to those asked in previous yearsto allow tracking of the responses over time. From this exercise, we perceive only small changesin firms’ policies regarding derivatives, most notably a movement towards in-house sources forvaluing derivatives.
Thus, these Wharton/CIBC surveys on derivatives and risk management provide a uniqueinsight into the use of derivative instruments by U.S. non-financial firms. From these survey
13% 1%
4% 3% 6%
4% 5% 8%
4% 4% 8%
10% 15% 16%
13% 22% 17%
14% 18% 13%
60% 8% 6%
0% 10% 20% 30% 40% 50% 60% 70% 80%
Insufficient exposure
Exposures effectively managed by other means
Costs of hedging exceedthe expected benefits
Concerns about perceptions of derivative use
Difficulty pricing and valuing derivatives
Disclosure requirementsof the SEC/FASB
Accounting treatment
Others
Figure 15: Importance of Different Factors in Decision Not to Use Derivatives
Most Important Second Most Important Third Most Important

Wharton/CIBC World Markets 1998 Financial Risk Management Survey: Report p. 21
responses we can look towards the future. Will derivative use expand over time or has it reached aplateau defined by the economic activities of the firms? Among firms using derivatives, the usagerate is increasing, suggesting that these firms are generally finding derivatives useful for theirbusiness. While the percentage of firms using derivatives has remained roughly constant, thereremains some reason to think that a portion of the firms currently not using derivatives will beginto use them as knowledge of these instruments increases and fear of negative public perception ofderivatives dies down or volatility in the world’s financial prices continues to increase. Finally, asfirms face the implementation of a new accounting regime for derivatives and hedging, amount ofhedging or the types of products employed may shift. As before, we intend to revisit many ofthese issues in a few years time when Wharton and CICB World Markets conduct a fourth surveyof derivative usage among U.S. non-financial firms.
For additional copies of this survey report or for further information, please contact:
Weiss Center for International Financial Research
Wharton School, University of Pennsylvania
Philadelphia, PA. 19104
Telephone: 215-898-7626 and Facsimile: 215-573-2242
email: [email protected]
or
CIBC School of Financial Products
425 Lexington Ave.
New York, NY 10017
Telephone: 212-885-4407 and Facsimile: 212-885-4826
You can download additional copies of the report from
The Weiss Center website at http://finance.wharton.upenn.edu/weiss
or
The CIBC School of Financial Products website at http://www.schoolfp.cibc.com

Wharton/CIBC World Markets 1998 Financial Risk Management Survey: Appendix p. 1
IX. APPENDIX: Survey Questionnaire and Response Tallies
Wharton Survey of Financial Risk Management by U.S. Non-Financial FirmsPlease complete the questionnaire by following the instructions following each question.
I. Use of Derivatives
1a. Does your firm use derivatives (forwards, futures, options, swaps)?(Please circle the appropriate response.)
a. Yes - 200 b. No - 199 Total firms responding……..399
Firms by Size Firms by Industry
LargeMediumSmall
Yes No Total 133 27 160 52 64 116 15 108 123
PrimaryManufacturingServices
Yes No Total 56 26 82 94 103 50 70
Please complete this section if you answered NO to question 1a.
1b. Please indicate the three most important factors in your decision not to use derivatives.(Please rank: 1 - Most important; 2 - Second most important; 3 - Third most important.) 1 2 3
a. Insufficient exposure to financial or commodity prices ......................................118 15 12b. Exposures are more effectively managed by other means.................................28 35 25c. Difficulty pricing and valuing derivatives.............................................................8 7 16d. Disclosure requirements of the SEC or the FASB...............................................7 10 15e. Accounting treatment .........................................................................................8 5 11f. Concerns about perceptions of derivative use by investors, regulators and the public ....................................................................................19 29 31g. Costs of establishing and maintaining a derivatives program exceed the expected benefits.............................................................................25 44 34
h. Other ..............................................................................................................25 0 1
Total number of firms responding – 198
1c. What percentage of your consolidated operating revenues are in foreign currency?(Please circle the response that is closest.)
a. 0% - 112 b. 5% - 41 c. 10% - 9 d. 15% - 6 e. 20% - 3 f. 25% - 6 g. 30% - 7 h. 40% - 5 i. 50+% - 4
1d. What percentage of your consolidated operating costs are in foreign currency?(Please circle the response that is closest.)
a. 0% - 97 b. 5% - 43 c. 10% - 20 d. 15% - 8 e. 20% - 9 f. 25% - 2 g. 30% - 6 h. 40% - 2 i. 50+% - 4
Thank you. Please return your survey in the postage paid envelope
2. Based upon the notional value of contracts, how does your firm’s derivative usage compare to lastyear? (Please circle the appropriate response.)
a. Usage has increased - 83 b. Usage has decreased – 26 c. Usage has remained constant – 91

Wharton/CIBC World Markets 1998 Financial Risk Management Survey: Appendix p. 2
3. Which of the following statements best describes your organization’s approach to the use ofderivatives to manage each of the following forms of risk?(Please indicate with a check in each column.)
ForeignExchange
InterestRate Commodity Equity
Exposure not managed with derivatives 34 48 88 131
Risk management activities primarily centralized 136 149 72 55
Risk management decisions primarily decentralizedwith centralized coordination
13 8 23 2
Risk management activities primarily decentralized 3 2 13 0
4a. Indicate your degree of concern about the following issues with respect to derivatives.(Please indicate your degree of concern with each issue by checking the appropriate box in each column.)
No Concern Low Moderate High
a. Accounting treatment ....................................................12 30 84 73
b. Credit risk .....................................................................13 69 66 49
c. Market risk ....................................................................14 54 68 62
d. Monitoring and evaluating hedge results .......................6 52 82 58
e. Reaction by analysts or investors .................................18 75 69 36
f. SEC disclosure requirements ........................................11 53 93 41
g. Secondary market liquidity............................................18 79 59 42
4b. Indicate the three issues of greatest concern from the list in question 4a.(Please enter the letter from Question 4a for your three most serious concerns.)
a b c d e f g h
Most serious 51 28 53 25 9 10 14 4
Second most serious 37 27 32 35 17 27 18 0
Third most serious 33 21 27 27 25 26 26 2
5. What will be the most likely impact on your firm of the FASB’s new rules on derivatives accounting?(Please circle all that apply.)
Responses
a. No effect on derivatives use or risk management strategy ...................................................146
b. A reduction in the use of derivatives .....................................................................................20
c. An increase in the use of derivatives......................................................................................5
d. A change in the types of instruments used ...........................................................................29
e. Alter the timing of hedging transactions ................................................................................20
f. A significant change in the firm’s overall strategy or approach to risk management................7
Total firms responding ........199
6. Does your firm calculate the “value-at-risk” for some or all of its derivatives portfolio?
a. Yes - 87 b. No - 112

Wharton/CIBC World Markets 1998 Financial Risk Management Survey: Appendix p. 3
II. Currency Exposure
7a. What percentage of your consolidated operating revenues are in foreign currency?(Please circle the response that is closest.)
a. 0% - 55 b. 5% - 28 c. 10% - 21 d. 15% - 12 e. 20% - 11 f. 25% - 13 g. 30% - 18 h. 40% - 14 i. 50+% - 23
7b. What percentage of your consolidated operating costs are in foreign currency?(Please circle the response that is closest.)
a. 0% - 49 b. 5% - 38 c. 10% - 24 d. 15% - 13 e. 20% - 11 f. 25% - 11 g. 30% - 21 h. 40% - 10 i. 50+% - 15
8. Which benchmark does your firm use for evaluating foreign currency risk management over thebudget/planning period? (Please circle the response that is appropriate.)
Firms Responding
a. Our firm does not use a benchmark ............................................................................ 79
b. Forward rates available at the beginning of the period ................................................ 42
c. Spot rates at the beginning of the period ..................................................................... 24
d. Baseline percent hedged strategy (i.e. X% hedged................................................................................ 17
e. Other benchmark ........................................................................................................ 17
If your firm does not use currency derivatives, please skip ahead to Section III.
9. How often does your firm transact in the currency derivatives markets to...(Please circle the appropriate response for each exposure.)
Not Applicable Never Sometimes Frequently
a. Hedge foreign repatriations (dividends, royalties, interest payments) ...............23 27 56 39
b. Hedge contractual commitmentsi. on-balance sheet transactions (accounts receivable/payable)..........4 15 50 76
ii. off-balance sheet transactions (unfilled or pending contracts) ........12 46 52 31
c. Hedge anticipated transactions one year or less.................................4 21 55 65
d. Hedge anticipated transactions over one year ....................................8 60 62 17
e. Hedge economic/competitive exposure.............................................12 79 37 15
f. Hedge translation of foreign accounting statements ..........................13 81 30 18
g. Arbitrage borrowing rates across currencies(currency swaps in association with foreign currency borrowings)......18 74 44 6
10. What percentage of the following categories of exposures do you typically hedge?(Please indicate the appropriate percentage under each exposure category.)
(Responses categorized for display and reported only for responding firms indicating applicable exposure in question 9.)
Percentage ofExposure Typically
Hedged
On-balancesheet
Transactions
Off-balancesheet
Transactions
AnticipatedTransactions1 yr or less
AnticipatedTransactions
over 1 yr
Economic/Competitive
ExposureForeign
Repatriations
Translationof ForeignAccounts
>25%25%-50%50%-75%
75%-100%
55171545
9515816
57291234
1031559
120723
76156
35
113739

Wharton/CIBC World Markets 1998 Financial Risk Management Survey: Appendix p. 4
11. For each of the following exposures, which best describes your typical hedging horizon?(Please check the appropriate response for each column.)
Hedging HorizonContractual
CommitmentsAnticipated
Transactions
Economic/Competitive
ExposureForeign
Repatriations
Translationof ForeignAccounts
hedge shorter than the maturity of the exposure 9 16 11 8 7
hedge the maturity of the exposure 97 71 20 54 16
hedge longer than the maturity of the exposure 4 6 0 1 2 hedge to the end of the current period
(budget period or fiscal year) 3 4 3 3 8
12. How often does your market view of exchange rates cause you to ...(Please check the appropriate response for each column.)
Never Sometimes Frequently
a. Alter the timing of hedges ...................................................... 58 68 14
b. Alter the size of hedges.......................................................... 56 72 14
c. Actively take positions in currency derivatives ....................... 96 37 9
13. What percent of your total foreign currency derivatives (by face value of contracts) have thefollowing original maturities: (Please enter the approximate percentage of currency hedging for each maturity.)
(Responses categorized for display.)
Percentage of ForeignCurrency Hedging Activity
with Maturities of :
90 days orless
91 to 180days
181 days toone year
One year tothree year
Beyond threeyears
Zero 23 30 40 80 113
1% - 25% 29 56 52 33 11
25%- 50% 33 33 28 9 1
50% - 75% 16 4 4 0 0
75% - 100% 27 5 4 6 3
III. Interest Rate Exposure
14. Which statement(s) best describes the benchmark your firm uses for evaluating the management of thedebt portfolio? (Circle all that apply.)
Responses
a. Our firm does not use a benchmark for the debt portfolio .........................................................81
b. The volatility of interest expense relative to a specified portfolio ..............................................19
c. Realized cost of funds relative to a market index (e.g. Libor) ..................................................41
d. Realized cost of funds relative to a portfolio with a specified duration ......................................15
e. Realized cost of funds relative to a portfolio with a specified ratio of fixed to floating rate debt 35
f. Other benchmark (please describe) .........................................................................................13
Total firms responding ........................173
If your firm does not use interest rate derivatives, please skip ahead to Section IV.

Wharton/CIBC World Markets 1998 Financial Risk Management Survey: Appendix p. 5
15a. How often does your firm transact in the interest rate derivatives market to...(Please check the appropriate column for each row. Choose ‘Not Applicable’ if a reason is not relevant to your firm.)
Not Applicable Never Sometimes Frequently
a. Swap from fixed rate to floating rate debt ................................12 51 65 13
b. Swap from floating rate to fixed rate debt ................................11 13 107 17
c. Fix in advance the rate (spread) on new debt ..........................14 52 65 10
d. Reduce costs or lock-in rates based upon a market view .........12 56 62 8
15b. How often does your market view of interest rates cause you to ...(Please check the appropriate response.)
Never Sometimes Frequentlya. Alter the timing of hedges................................................................. 50 87 9
b. Alter the size of hedges .................................................................... 59 79 8
c. Actively take positions in interest rate derivatives ............................. 86 53 6
IV. Option Contracts
16a. Please indicate which of the following types of option contracts your firm has used in the past 12months for the indicated exposures.(Place check marks in the appropriate columns for each type of option, leave blank is options are not used.)
Types of ExposuresFX IR CM ANY
a. Standard European-style options .................................................... 56 28 25 84b. Standard American-style options..................................................... 31 26 33 75c. Average rate (price) options............................................................ 15 7 17 38d. Basket options (options on two or more prices) .................................... 8 5 4 17e. Barrier options (knock-in/knock-out) .................................................. 18 5 5 26f. Contingent premium (options with deferred or conditional premiums) .... 5 1 5 23g. Option combinations (i.e. collars, straddles, etc.) ........................... 21 10 24 50h. Other ____________________________......................................... 5 5 2 9
Summay: Use of any form of options in the last 12 months ....................87 56 56 136
16b. If your firm does not use options, can you tell us why not? __________________________
V. Control and Reporting Procedures
17a. Does your firm have a documented policy with respect to the use of derivatives?(Please circle the appropriate response.)
a. Yes – 158 b. No – 42
17b. How frequently is derivatives activity reported to the Board of Directors?(Please circle the appropriate response.)
a. Monthly - 8 b. Quarterly - 44 c. Annually - 34 d. As needed/No set schedule - 97 e. Other – 12

Wharton/CIBC World Markets 1998 Financial Risk Management Survey: Appendix p. 6
18. What is the lowest rated counterparty with which you will enter a derivatives transaction?(Please check the appropriate rating for each maturity.)
Less than No Set Policy/AAA AA A BBB BBB Don’t Know
a. Maturities 12 months or less................. 11 36 92 17 4 27
b. Maturities more than 12 months ........... 13 59 69 10 2 24
19. How frequently do you value your derivatives portfolio?(Please circle the appropriate answer.)
a. Daily......................................... 36 d. Quarterly ..................................... 41b. Weekly ..................................... 18 e. Annually ....................................... 9c. Monthly .................................... 53 f. As needed/No set schedule ......... 37
20. Rank your degree of reliance on each of the following for valuing your derivative positions.(Please rank items; 1 - Most important, .., 3 - Least important; Use an “X” if a method is not used at all.)
Rank 1 Rank2 Rank3
a. Dealer that originated the transaction ................................................. 66 60 42b. Another dealer, consultant, or price vendor (e.g. Bloomberg)............... 42 62 53c. Internal source (e.g. software, spreadsheet, etc).................................. 79 41 39
Total Firms Responding 184
21. How do you evaluate the risk management function?(Please circle the statement that best matches your practice.)
Firms Responding
a. Reduced volatility relative to a benchmark .......................................................73b. Increased profit (reduced costs) relative to a benchmark ..................................40c. Absolute profit/loss ...........................................................................................33d. Risk adjusted performance (profits or savings adjusted for volatility) ................38
Thank you for completing the survey.Please mail it today in the enclosed postage-paid envelope.
vvvvvvv
If you have further questions or comments, please contact:Professor Richard Marston
Weiss Center for International Financial ResearchThe Wharton School
(215) 898-7626