GEOG 6 – Resources and Energy Professor: Dr. Jean-Paul Rodrigue Hofstra University, Department of...
59
GEOG 6 – Resources and Energy Professor: Dr. Jean-Paul Rodrigue Professor: Dr. Jean-Paul Rodrigue Hofstra University, Department of Global Studies & Geography Professor: Dr. Jean-Paul Rodrigue Hofstra University, Department of Global Studies & Geography Topic 4 – Fossil Fuels A – Energy Transitions B – Coal C – Petroleum D – Natural Gas
-
Upload
bryana-partain -
Category
Documents
-
view
223 -
download
1
Transcript of GEOG 6 – Resources and Energy Professor: Dr. Jean-Paul Rodrigue Hofstra University, Department of...
GEOG 6 – Resources and Energy
Professor: Dr. Jean-Paul Rodrigue
Hofstra University, Department of Global Studies & Geography
Professor: Dr. Jean-Paul Rodrigue
Hofstra University, Department of Global Studies & Geography
Professor: Dr. Jean-Paul Rodrigue
Hofstra University, Department of Global Studies & Geography
Topic 4 – Fossil Fuels
A – Energy TransitionsB – CoalC – PetroleumD – Natural Gas

© Dr. Jean-Paul Rodrigue© Dr. Jean-Paul Rodrigue© Dr. Jean-Paul Rodrigue© Dr. Jean-Paul Rodrigue
A. ENERGY TRANSITIONS
1. Factors Behind Energy Transitions2. Peak Oil3. Energy Markets
© Dr. Jean-Paul Rodrigue© Dr. Jean-Paul Rodrigue© Dr. Jean-Paul Rodrigue© Dr. Jean-Paul Rodrigue
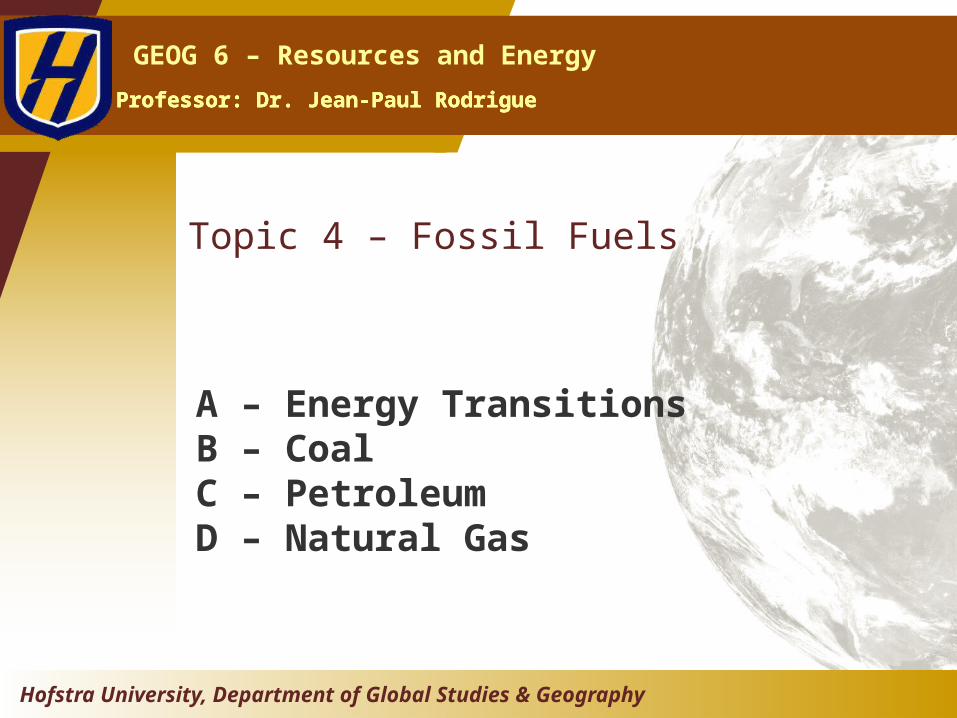
1. Factors Behind Energy Transitions
■ Energy transition• Shift from one dominant source of energy to another.
• Fossil fuels resources remain abundant.• Transition linked with three factors:• Demand:
• Growth in the amount of energy used incites finding more abundant energy sources.
• Price:• Function of availability and demand.• Higher prices incite finders alternative sources.
• Technology:• Which types of energy forms are harnessed, processed, and delivered to
the final consumers as well as where these activities take place.• Better technology enables access to a wider variety of energy sources.

© Dr. Jean-Paul Rodrigue© Dr. Jean-Paul Rodrigue© Dr. Jean-Paul Rodrigue© Dr. Jean-Paul Rodrigue
1. Factors Behind Energy Transitions
■ Energy Quality• Difference in the ability of a unit of energy to produce goods and
services for people.• One joule of electricity is not the same than one joule of coal.
• Combination of physical, chemical, technical, economic, environmental and social attributes that are unique to each form of energy.

© Dr. Jean-Paul Rodrigue© Dr. Jean-Paul Rodrigue© Dr. Jean-Paul Rodrigue© Dr. Jean-Paul Rodrigue
1. Determinants of Energy Quality
Energy Density Quantity of energy contained per unit mass or volume.
Power Density Rate of energy production per unit of the earth’s area. Usually expressed in watts per square meter (W/m2).
Energy Surplus Difference between energy spent for procurement (extraction, transformation and delivery) and energy provided.
Intermittency Time availability of the energy source.
Spatial distribution Spatial availability of the energy source

© Dr. Jean-Paul Rodrigue© Dr. Jean-Paul Rodrigue© Dr. Jean-Paul Rodrigue© Dr. Jean-Paul Rodrigue
1. Evolution of Energy Sources
15th Century
Mid 19th Cen-tury
Early 20th Cen-tury
Late 20th Cen-tury
Mid 21st Cen-tury
0% 10% 20% 30% 40% 50% 60% 70% 80% 90% 100%
AnimalBiomassCoalOilNatural GasNuclearHydrogen

© Dr. Jean-Paul Rodrigue© Dr. Jean-Paul Rodrigue© Dr. Jean-Paul Rodrigue© Dr. Jean-Paul Rodrigue
1. Total World Electricity Generation by Type of Fuel, 2002
40
19
16
16
7 2
CoalNatural GasNuclearHydroOilOther

© Dr. Jean-Paul Rodrigue© Dr. Jean-Paul Rodrigue© Dr. Jean-Paul Rodrigue© Dr. Jean-Paul Rodrigue
1. Primary Energy Production by Source, United States, 1750-2009
1750 1800 1850 1900 1950 20000
5,000,000
10,000,000
15,000,000
20,000,000
25,000,000
30,000,000
35,000,000
40,000,000
45,000,000
CoalBiomassPetroleumNatural GasHydroelectricNuclear
Billi
on B
TU

© Dr. Jean-Paul Rodrigue© Dr. Jean-Paul Rodrigue© Dr. Jean-Paul Rodrigue© Dr. Jean-Paul Rodrigue
1. Global Energy Systems Transition, (% of market)
20001850 21502050 210019501900
100
80
60
40
20
0
Solids
Liquids
Gases
Wood Coal
Oil
Natural Gas
Hydrogen

© Dr. Jean-Paul Rodrigue© Dr. Jean-Paul Rodrigue© Dr. Jean-Paul Rodrigue© Dr. Jean-Paul Rodrigue
2. Peak Oil
■ Hubbert’s peak• Geologist who predicted in the 1950s that oil production in the
United States would peak in the early 1970s:• US oil production peaked in 1973.
• Assumption of finite resource.• Production starts at zero. • Production then rises to a peak which can never be surpassed.• Once the peak has been passed, production declines until the
resource is depleted.• Peak was estimated to be around 2004-2008:
• One estimate placed it symbolically at Thanksgiving 2005.• Kuwait announced around Thanksgiving 2005 that the world’s second
largest oil field (Burgan) has reached its peak.• As of 2010, peak oil remains unconfirmed.

© Dr. Jean-Paul Rodrigue© Dr. Jean-Paul Rodrigue© Dr. Jean-Paul Rodrigue© Dr. Jean-Paul Rodrigue
2. World Annual Oil Production (1900-2009) and Peak Oil (2010)
1900190119021903190419051906190719081909191019111912191319141915191619171918191919201921192219231924192519261927192819291930193119321933193419351936193719381939194019411942194319441945194619471948194919501951195219531954195519561957195819591960196119621963196419651966196719681969197019711972197319741975197619771978197919801981198219831984198519861987198819891990199119921993199419951996199719981999200020012002200320042005200620072008200920102011201220132014201520162017201820192020202120222023202420252026202720282029203020312032203320342035203620372038203920402041204220432044204520462047204820492050205120522053205420552056205720582059206020612062206320642065206620672068206920702071207220732074207520762077207820792080208120822083208420852086208720882089209020912092209320942095209620972098209921000
5
10
15
20
25
30
2010 Peak
Actual
Bill
ions
of b
arre
ls

© Dr. Jean-Paul Rodrigue© Dr. Jean-Paul Rodrigue© Dr. Jean-Paul Rodrigue© Dr. Jean-Paul Rodrigue
2. Peak Oil
■ The case for Peak Oil• Largest oil fields discovered more than 50 years ago.• The peak of oil discovery year was 1965.• Some large discoveries in the 1970s (Alaska, North Sea), but
none since then.• The last year when more oil was discovered than consumed was
1980.■ Tar sands
• Large supplies, particularly in Canada (Alberta).• A bottleneck in extraction and distribution.• Require a lot of energy to extract and transform into a usable
form.

© Dr. Jean-Paul Rodrigue© Dr. Jean-Paul Rodrigue© Dr. Jean-Paul Rodrigue© Dr. Jean-Paul Rodrigue
3. Energy Markets
■ Importance• Used to be informal and locally oriented (e.g. wood).• The growth in the use of fossil fuels created large and lucrative
energy markets:• Became national and global.• Increasingly capital intensive.
• Contracts between suppliers and customers:• Price, quantity and time of delivery (location).
• Permitted the emergence of large multinational corporations.• Large financial markets:
• Financing activities such as exploration, exploitation, transportation and refining.

© Dr. Jean-Paul Rodrigue© Dr. Jean-Paul Rodrigue© Dr. Jean-Paul Rodrigue© Dr. Jean-Paul Rodrigue
3. The World’s 20 Largest Corporations by Market Value, 2009 ($US millions)
Exxon Mobil
PetroChina
Wal-Mart
Industrial & Commerical Bank of China
China Mobile
Microsoft
AT&T
Johnson & Johnson
Royal Dutch Shell
Procter & Gamble
Chevron
Berkshire Hathaway
China Construction Bank
IBM
Nestle
BP
Petrobas
Roche
BHP Billiton
Total
0 50,000 100,000 150,000 200,000 250,000 300,000 350,000 400,000

© Dr. Jean-Paul Rodrigue© Dr. Jean-Paul Rodrigue© Dr. Jean-Paul Rodrigue© Dr. Jean-Paul Rodrigue
The Breaking of Standard Oil (1908)

© Dr. Jean-Paul Rodrigue© Dr. Jean-Paul Rodrigue© Dr. Jean-Paul Rodrigue© Dr. Jean-Paul Rodrigue
3. West Texas Intermediate, Monthly Nominal Spot Oil Price (1970-2010)
Jan-
70
Jan-
71
Jan-
72
Jan-
73
Jan-
74
Jan-
75
Jan-
76
Jan-
77
Jan-
78
Jan-
79
Jan-
80
Jan-
81
Jan-
82
Jan-
83
Jan-
84
Jan-
85
Jan-
86
Jan-
87
Jan-
88
Jan-
89
Jan-
90
Jan-
91
Jan-
92
Jan-
93
Jan-
94
Jan-
95
Jan-
96
Jan-
97
Jan-
98
Jan-
99
Jan-
00
Jan-
01
Jan-
02
Jan-
03
Jan-
04
Jan-
05
Jan-
06
Jan-
07
Jan-
08
Jan-
09
Jan-
10
0
20
40
60
80
100
120
140
First Oil Shock
Second Oil Shock
Third Oil Shock
A B
C
21
D

© Dr. Jean-Paul Rodrigue© Dr. Jean-Paul Rodrigue© Dr. Jean-Paul Rodrigue© Dr. Jean-Paul Rodrigue
3. Major Oil Price Fluctuations
Price Change Event Price Change Time Frame Cause Nominal Price Change
First Oil Shock October 1973 to March 1974 Yom Kippur War / OPEC oil embargo
From $4.31 to $10.11 (+134.5%)
Second Oil Shock April 1979 to July 1980 Iranian revolution (1978) / Iran-Iraq war (1980)
From $15.85 to $39.50 (+149.2%)
Oil counter shock (A) November 1985 to July 1986 OPEC oversupply / Lower demand
From $30.81 to $11.57 (-62.4%)
First Gulf War (1) July 1990 to November 1990 Iraqi invasion of Kuwait From $18.63 to $32.30 (+73.4%)
Asian Financial Crisis (B) January 1997 to December1998
Debt defaults / Non-USD currency devaluations / Reduced demand
From $25.17 to $11.28 (-55.1%)
"Asian Demand Contagion" (2)
January 1999 to September 2000
Rising demand / OPEC output cutbacks
From $11.28 to $33.88 (+200.3%)
"September 11 Effect" (C) August 2001 to December 2001 Oversupply / American recession From $27.47 to $19.33 (-
29.6%)
Third Oil Shock December 2003 to June 2008Peak oil / Rising demand / Monetary debasement / Speculation
From $32.15 to $133.95 (+316.6%)
Financial Crisis of 2008 (D) July 2008 to February 2009Collapse of asset bubbles / Demand destruction / Global recession
From $133.95 to $39.16 (-70.7%; Dec 2008)

© Dr. Jean-Paul Rodrigue© Dr. Jean-Paul Rodrigue© Dr. Jean-Paul Rodrigue© Dr. Jean-Paul Rodrigue
3. Energy Markets
■ Challenges to energy markets• Supply sources:
• Low diversity of energy sources. Foreign sources. Dependence on oil. Keeping natural resources for future use. Low oil prices instead of an energy policy.
• Affordability:• Economies of scale. Waste involves less profits. Market forces and profit
margins.• Environmental impacts:
• Lobbying against environmental legislation.

© Dr. Jean-Paul Rodrigue© Dr. Jean-Paul Rodrigue© Dr. Jean-Paul Rodrigue© Dr. Jean-Paul Rodrigue
B. COAL
1. Characteristics2. Coal Use3. Challenges

© Dr. Jean-Paul Rodrigue© Dr. Jean-Paul Rodrigue© Dr. Jean-Paul Rodrigue© Dr. Jean-Paul Rodrigue
1. Characteristics
■ Nature• Formed from decayed swamp plant matter that cannot
decompose in the low-oxygen underwater environment.• Coal was the major fuel of the early Industrial Revolution.• High correlation between the location of coal resources and early
industrial centers:• The Midlands of Britain.• Parts of Wales.• Pennsylvania.• Silesia (Poland).• German Ruhr Valley.
• Three grades of coal.

© Dr. Jean-Paul Rodrigue© Dr. Jean-Paul Rodrigue© Dr. Jean-Paul Rodrigue© Dr. Jean-Paul Rodrigue
1. Characteristics
Anthracite
Bituminous
Lignite
0 500 1000 1500 2000
0 20 40 60 80 100
CarbonEnergy
Burned energy (1,000 calories per kg)
Carbon content
(%)
■ Anthracite (7%)• Highest grade; over 85% carbon.• Most efficient to burn.• Lowest sulfur content; the least
polluting.• The most exploited and most
rapidly depleted.■ Bituminous (75%)
• Medium grade coal, about 50-75% carbon content.
• Higher sulfur content and is less fuel-efficient.
• Most abundant coal in the USA.■ Lignite (18%)
• Lowest grade of coal, with about 40% carbon content.
• Low energy content.• Most sulfurous and most
polluting.

© Dr. Jean-Paul Rodrigue© Dr. Jean-Paul Rodrigue© Dr. Jean-Paul Rodrigue© Dr. Jean-Paul Rodrigue
1. Main Coal Regions of the United States
Bituminous
Lignite
Lignite
Bituminous
Powder River Basin(40%)

© Dr. Jean-Paul Rodrigue© Dr. Jean-Paul Rodrigue© Dr. Jean-Paul Rodrigue© Dr. Jean-Paul Rodrigue
1. Global Coal Production, 2002 (M short tons)
760
Production
Not significant

© Dr. Jean-Paul Rodrigue© Dr. Jean-Paul Rodrigue© Dr. Jean-Paul Rodrigue© Dr. Jean-Paul Rodrigue
2. Coal Use
■ Coal use• Thermal coal (about 90% use):
• Used mainly in power stations to produce high pressure steam, which then drives turbines to generate electricity.
• Also used to fire cement and lime kilns.• Until the middle of the 20th Century used in steam engines (“Steam Coal”).
• Coking coal:• Specific type of metallurgical coal derived from bituminous coal.• Used as a source of carbon, for converting a metal ore to metal.• Removing the oxygen in the ore by forcing it to combine with the carbon in
the coal to form CO2.• Used for making iron in blast furnaces (without smoke).
• New redevelopment of the coal industry:• In view of rising energy prices.• “Clean Coal” technologies, less ashes but same CO2.

© Dr. Jean-Paul Rodrigue© Dr. Jean-Paul Rodrigue© Dr. Jean-Paul Rodrigue© Dr. Jean-Paul Rodrigue
2. Coal Consumption, 1965-2009 (in millions of tons of oil equivalent)
1965
1967
1969
1971
1973
1975
1977
1979
1981
1983
1985
1987
1989
1991
1993
1995
1997
1999
2001
2003
2005
2007
2009
0
500
1000
1500
2000
2500
3000
3500Rest of the worldIndiaChinaUSA

© Dr. Jean-Paul Rodrigue© Dr. Jean-Paul Rodrigue© Dr. Jean-Paul Rodrigue© Dr. Jean-Paul Rodrigue
2. Coal as % of Energy Use and Electricity Generation, 1998
South Africa
China
Poland
India
Kazakhstan
Czech Rep.
Australia
South Korea
Ukraine
Slovakia
Denmark
Germany
United States
0 10 20 30 40 50 60 70 80 90 100
Electricity (%)Energy (%)
© Dr. Jean-Paul Rodrigue© Dr. Jean-Paul Rodrigue© Dr. Jean-Paul Rodrigue© Dr. Jean-Paul Rodrigue
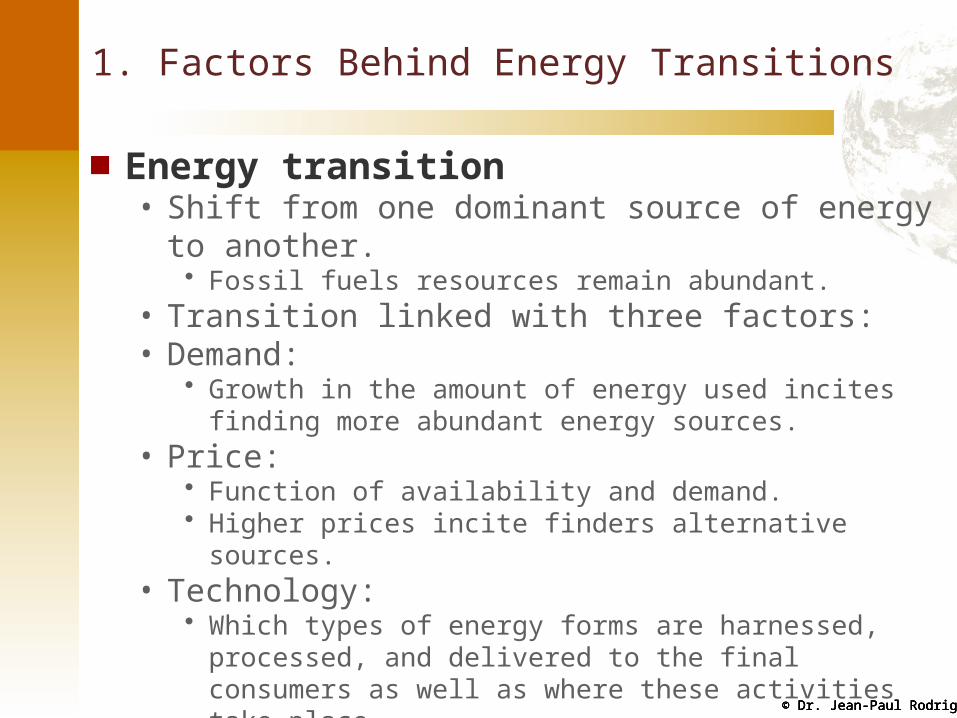
2. Coal Costs per Ton (USD), Selected Markets
1987
1988
1989
1990
1991
1992
1993
1994
1995
1996
1997
1998
1999
2000
2001
2002
2003
2004
2005
2006
2007
2008
2009
0
20
40
60
80
100
120
140
160
Northwest Europe market price
Appalachian spot
Japan CIF

© Dr. Jean-Paul Rodrigue© Dr. Jean-Paul Rodrigue© Dr. Jean-Paul Rodrigue© Dr. Jean-Paul Rodrigue
3. Challenges
■ Advantages of coal use• Easily combustible.• Easy to store and transport.• Relatively inexpensive.• Wide availability of sources.• Technologically simpler to use for energy generation.
■ Disadvantages of coal use• Non-renewable resource.• Combustion by-products (e.g. SO2 and sooth).• Coal mining is generally environmentally damaging.

© Dr. Jean-Paul Rodrigue© Dr. Jean-Paul Rodrigue© Dr. Jean-Paul Rodrigue© Dr. Jean-Paul Rodrigue
C. PETROLEUM
1. The Economic Importance of Petroleum2. Oil Reserves3. The Geopolitics of Petroleum

© Dr. Jean-Paul Rodrigue© Dr. Jean-Paul Rodrigue© Dr. Jean-Paul Rodrigue© Dr. Jean-Paul Rodrigue
1. The Economic Importance of Petroleum
■ Nature• Formation of oil deposits (biotic perspective):
• Decay under pressure of billions of microscopic plants in sedimentary rocks.
• “Oil window”; 7,000 to 15,000 feet.• Created over the last 600 million years.
• A-biotic perspective.• Exploration of new sources of petroleum:
• Related to the geologic history of an area.• Located in sedimentary basins.• About 90% of all petroleum resources have been discovered.
• Production vs. consumption:• Geographical differences.• Contributed to the political problems linked with oil supply.

© Dr. Jean-Paul Rodrigue© Dr. Jean-Paul Rodrigue© Dr. Jean-Paul Rodrigue© Dr. Jean-Paul Rodrigue
1. The Economic Importance of Petroleum
■ Use• Transportation:
• The share of transportation has increased in the total oil consumption.• Accounts for more the 55% of the oil used.• In the US, this share is 70%.• Limited possibility at substitution.
• Other uses (30%):• Lubricant.• Plastics.• Fertilizers.
• Choice of an energy source:• Depend on a number of utility factors.• Favoring the usage of fossil fuels, notably petroleum.

© Dr. Jean-Paul Rodrigue© Dr. Jean-Paul Rodrigue© Dr. Jean-Paul Rodrigue© Dr. Jean-Paul Rodrigue
1. Petroleum Production and Consumption, 2002 (M barrels per day)
9,900
Production
Consumption
Not Included

© Dr. Jean-Paul Rodrigue© Dr. Jean-Paul Rodrigue© Dr. Jean-Paul Rodrigue© Dr. Jean-Paul Rodrigue
1. World Oil Consumption, 1965-2009 (1000s of barrels per day)
1965
1967
1969
1971
1973
1975
1977
1979
1981
1983
1985
1987
1989
1991
1993
1995
1997
1999
2001
2003
2005
2007
2009
0
10,000
20,000
30,000
40,000
50,000
60,000
70,000
80,000
90,000
North America South and Central America Europe & EurasiaMiddle East Africa Asia Pacific

© Dr. Jean-Paul Rodrigue© Dr. Jean-Paul Rodrigue© Dr. Jean-Paul Rodrigue© Dr. Jean-Paul Rodrigue
1. Factors of Oil Dependency
Occurrence Localized large deposits (decades)Transportability Liquid that can be easily transported. Economies of scaleEnergy content High mass / energy released ratioReliability Continuous supply; geopolitically unstableStorability Easily storedFlexibility Many uses (petrochemical industry; plastics)Safety Relatively safe; some risks (transport)Environment Little wastes, CO2 emissionsPrice Relatively low costs

© Dr. Jean-Paul Rodrigue© Dr. Jean-Paul Rodrigue© Dr. Jean-Paul Rodrigue© Dr. Jean-Paul Rodrigue
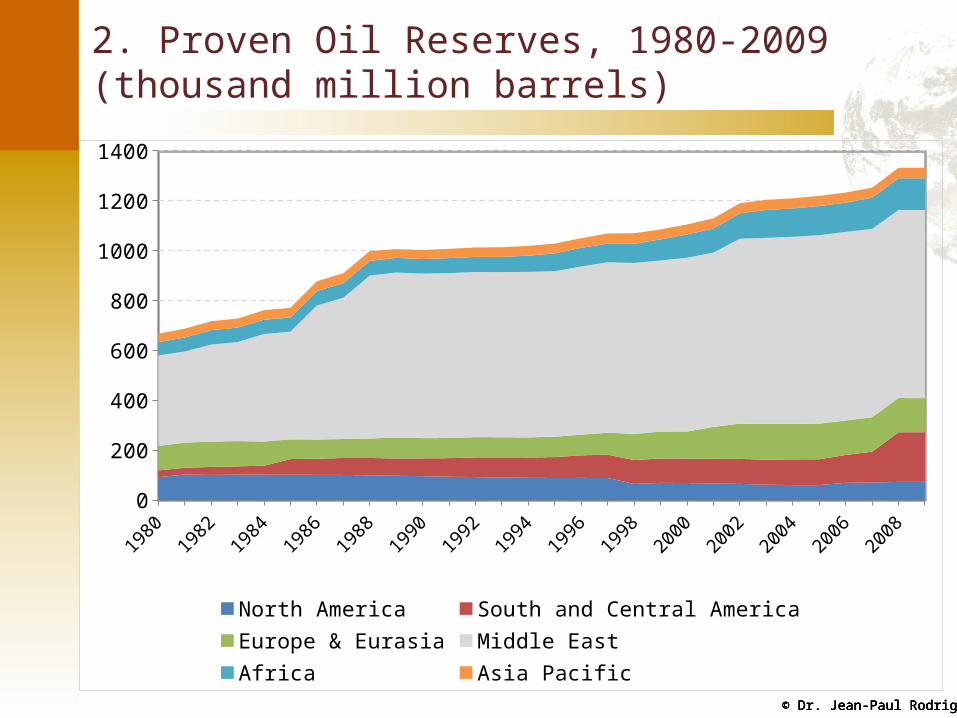
2. Oil Reserves
■ “Scarce Abundance”• The world oil production is currently running at capacity:
• Limited opportunities to expand production.• 20% of the world’s output comes from 14 fields.
• Ghawar:• The world’s largest oil field; been on production since 1951.• Produces approximately 4.5 million barrels of oil per day.• 55 to 60% of Saudi Arabia’s production.• Expected to decline sharply (use of water injection).• Could be 90% depleted.
• OPEC countries may have overstated their reserves:• Production quotas are based upon estimated reserves.• The larger the reserves, the more an OPEC country can export.• In the 1980s, most OPEC reserves doubled “on paper”.• Extraction continues while reserves remain the same(?).
© Dr. Jean-Paul Rodrigue© Dr. Jean-Paul Rodrigue© Dr. Jean-Paul Rodrigue© Dr. Jean-Paul Rodrigue
2. Proven Oil Reserves, 1980-2009 (thousand million barrels)
1980198
1198
2198
3198
4198
5198
6198
7198
8198
9199
0199
1199
2199
3199
4199
5199
6199
7199
8199
9200
0200
1200
2200
3200
4200
5200
6200
7200
8200
90
200
400
600
800
1000
1200
1400
North America South and Central America Europe & EurasiaMiddle East Africa Asia Pacific
© Dr. Jean-Paul Rodrigue© Dr. Jean-Paul Rodrigue© Dr. Jean-Paul Rodrigue© Dr. Jean-Paul Rodrigue
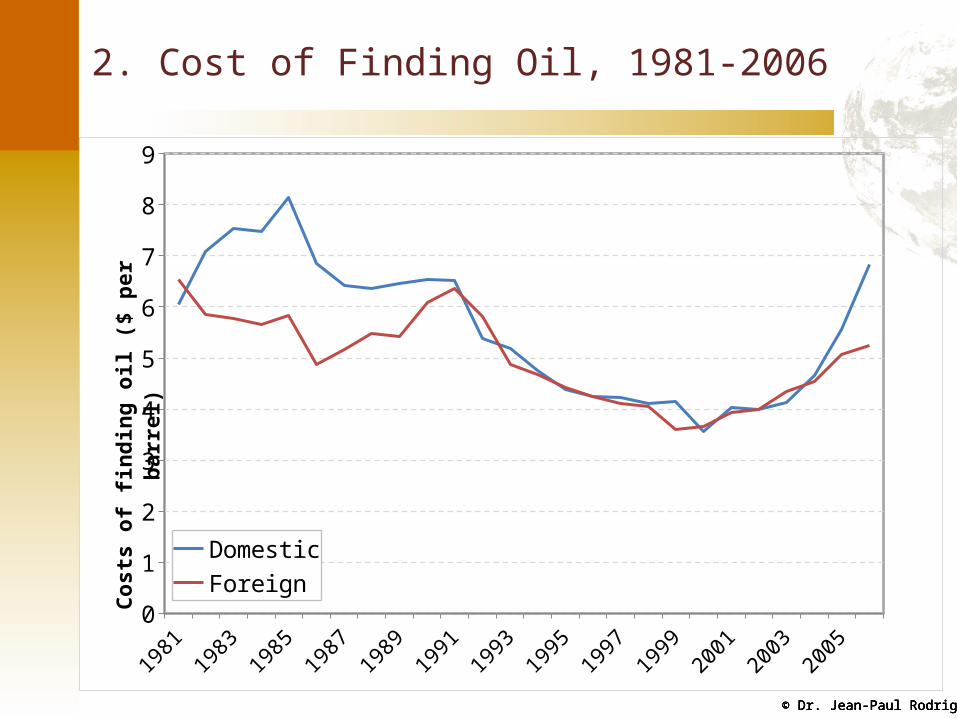
2. Cost of Finding Oil, 1981-2006
1981
1982
1983
1984
1985
1986
1987
1988
1989
1990
1991
1992
1993
1994
1995
1996
1997
1998
1999
2000
2001
2002
2003
2004
2005
2006
0
1
2
3
4
5
6
7
8
9
DomesticForeign
Cost
s of
find
ing
oil (
$ pe
r bar
rel)

© Dr. Jean-Paul Rodrigue© Dr. Jean-Paul Rodrigue© Dr. Jean-Paul Rodrigue© Dr. Jean-Paul Rodrigue
2. The World’s Largest Oil Fields, 2005
Oil Field Output (MBD) % of national output
Status
Ghawar (Saudi Arabia) 4.5 40% Possibly decliningCantarell (Mexico) 2.0 (1.7; 2007,
1.04; 2008)60% Declining
Burgan (Kuwait) 1.7 68% Declining
DaQing (China) 1.0 40% Possibly declining

© Dr. Jean-Paul Rodrigue© Dr. Jean-Paul Rodrigue© Dr. Jean-Paul Rodrigue© Dr. Jean-Paul Rodrigue
2. Oil Production of Some Declining Regions, 1973-2009
1973
1975
1977
1979
1981
1983
1985
1987
1989
1991
1993
1995
1997
1999
2001
2003
2005
2007
2009
0
1,000
2,000
3,000
4,000
5,000
6,000
7,000
8,000
9,000
10,000
North Sea
United States
Mexico
Cantarell Oil Field
Thou
sand
s of
bar
rels
per
day

© Dr. Jean-Paul Rodrigue© Dr. Jean-Paul Rodrigue© Dr. Jean-Paul Rodrigue© Dr. Jean-Paul Rodrigue
2. Major Crude Oil Reserves, 2009 (Thousand Million Barrels)
Saudi ArabiaVenezuela
IranIraq
KuwaitUnited Arab Emirates
Russian FederationLibya
KazakhstanNigeria
CanadaUS
QatarChina
AngolaBrazil
AlgeriaMexicoNorway
Azerbaijan
0 50 100 150 200 250 300
264.6
172.3
137.6
115.0
101.5
97.8
74.2
44.3
39.8
37.2
33.2
28.4
26.8
14.8
13.5
12.9
12.2
11.7
7.1
7.0

© Dr. Jean-Paul Rodrigue© Dr. Jean-Paul Rodrigue© Dr. Jean-Paul Rodrigue© Dr. Jean-Paul Rodrigue
2. Estimated Oil Reserves, Selected OPEC Countries, 1980-1991 (billions of barrels)
1980 1981 1982 1983 1984 1985 1986 1987 1988 1989 1990 19910
20406080
100120140160180200220240260
Iran
Iraq
Kuwait
Saudi Arabia
Venezuela

© Dr. Jean-Paul Rodrigue© Dr. Jean-Paul Rodrigue© Dr. Jean-Paul Rodrigue© Dr. Jean-Paul Rodrigue
2. Remaining Proven Oil Reserves for “Middle Eastern Five” According to Major Assessors, 2005
Iran
Iraq
Kuwait
S. Arabia
UAE
0 50 100 150 200 250 300
Bakhtiari's Estimate
Colin Campbell
BP Statistical Review
Oil & Gas Journal
Billions of barrels

© Dr. Jean-Paul Rodrigue© Dr. Jean-Paul Rodrigue© Dr. Jean-Paul Rodrigue© Dr. Jean-Paul Rodrigue
2. Global Oil Reserves, 2003
Less than 10 billion barrels
10 to 30 billion barrels
30 to 100 billion barrels
More than 100 billion barrels

© Dr. Jean-Paul Rodrigue© Dr. Jean-Paul Rodrigue© Dr. Jean-Paul Rodrigue© Dr. Jean-Paul Rodrigue
2. Export Land Theory
0 1 2 3 4 5 6 7 8 90.0
0.5
1.0
1.5
2.0
2.5
Production (-5% per year)
Consumption (+2.5% per year)
Exports
Time (years)
Mill
ions
of b
arre
ls p
er d
ay
© Dr. Jean-Paul Rodrigue© Dr. Jean-Paul Rodrigue© Dr. Jean-Paul Rodrigue© Dr. Jean-Paul Rodrigue
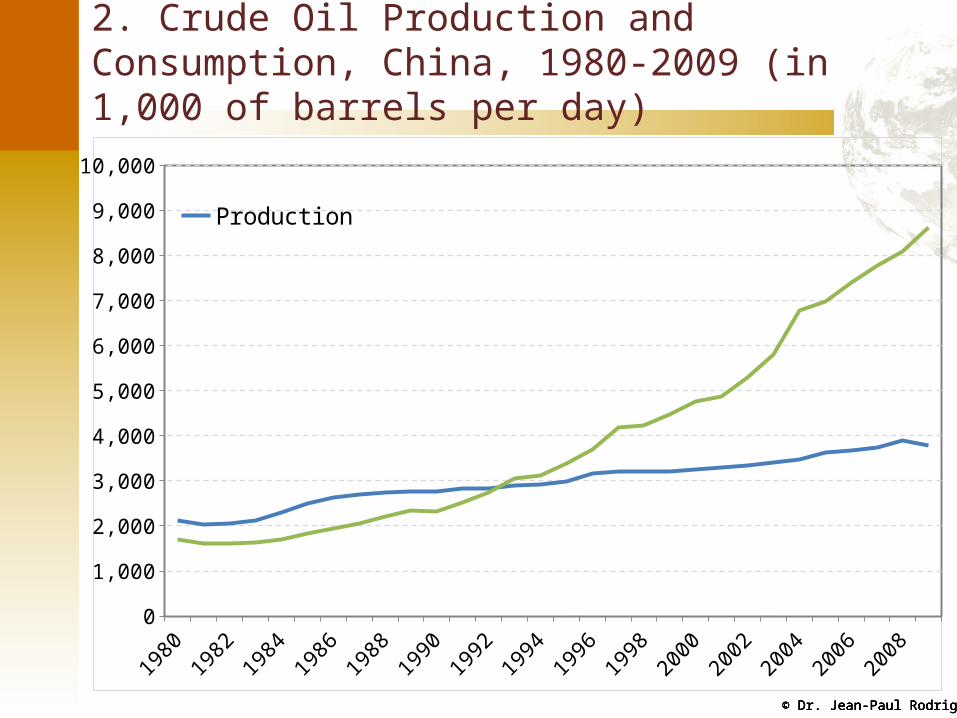
2. Crude Oil Production and Consumption, China, 1980-2009 (in 1,000 of barrels per day)
1980
1982
1984
1986
1988
1990
1992
1994
1996
1998
2000
2002
2004
2006
2008
0
1,000
2,000
3,000
4,000
5,000
6,000
7,000
8,000
9,000
10,000
ProductionConsumption

© Dr. Jean-Paul Rodrigue© Dr. Jean-Paul Rodrigue© Dr. Jean-Paul Rodrigue© Dr. Jean-Paul Rodrigue
2. Petroleum Production, Consumption and Imports, United States, 1949-2009
0
1,000,000
2,000,000
3,000,000
4,000,000
5,000,000
6,000,000
7,000,000
8,000,000
0
10
20
30
40
50
60
70
80
90
100ProductionConsumptionImportsReal oil price
Mill
ions
of b
arre
ls
Dol
lars
per
bar
rel

© Dr. Jean-Paul Rodrigue© Dr. Jean-Paul Rodrigue© Dr. Jean-Paul Rodrigue© Dr. Jean-Paul Rodrigue
3. The Geopolitics of Petroleum
■ The Seven Sisters• Petroleum has for long been the object of geopolitical
confrontations.• The ability to fix the price and the production of oil was first
established in 1928 by the Achnacarry Agreements.• Between the “seven sisters” forming an oil oligopoly.• Major oil multinationals (Exxon, Texaco, British Petroleum, Shell, Gulf,
Standard Oil and Mobil Oil).• Invested massively in extraction infrastructures, especially in the Middle
East.• Several producing countries, most of them in the Third World,
wanted to have a more important share of the incomes of this lucrative market.

© Dr. Jean-Paul Rodrigue© Dr. Jean-Paul Rodrigue© Dr. Jean-Paul Rodrigue© Dr. Jean-Paul Rodrigue
3. The Geopolitics of Petroleum
■ OPEC• Venezuela, Iran, Iraq, Saudi Arabia and Kuwait founded the
Organization of Petroleum Exporting Countries (OPEC) in 1960 at the Baghdad conference.
• Several other oil-producing nations joined thereafter the organization:• Qatar (1961), Indonesia (1962), Libya (1969), Algeria (1970), Nigeria
(1971), Ecuador (1973-1992, left the organization in order to avoid production quotas), The United Arab Emirates (1973) and Gabon (1973-1994).
• From its foundation until the beginning of the 1970s, OPEC was unable to increase oil prices.
• Production was very important in non-member countries.• Difficulty of OPEC members to agree on a common policy.

© Dr. Jean-Paul Rodrigue© Dr. Jean-Paul Rodrigue© Dr. Jean-Paul Rodrigue© Dr. Jean-Paul Rodrigue
3. OPEC Members and Countries with more than 10 Billion Barrels of Oil Reserves

© Dr. Jean-Paul Rodrigue© Dr. Jean-Paul Rodrigue© Dr. Jean-Paul Rodrigue© Dr. Jean-Paul Rodrigue
3. Major Oil Flows and Chokepoints, 2005-6

© Dr. Jean-Paul Rodrigue© Dr. Jean-Paul Rodrigue© Dr. Jean-Paul Rodrigue© Dr. Jean-Paul Rodrigue
3. The Geopolitics of Petroleum
■ A perfect storm?• Booming oil prices after 2004.• Prior oil spikes linked with short lived geopolitical events.• The situation has changed at the beginning of the 21st century.• A production issue:
• Petroleum extraction appears to be running at capacity.• Demand, especially new consumers (China), is going up.
• A distribution issue:• Limited additional tanker and pipeline capacity.
• A refining issue:• Limited additional refining capacity.• No refineries were built in the US since 1974.
© Dr. Jean-Paul Rodrigue© Dr. Jean-Paul Rodrigue© Dr. Jean-Paul Rodrigue© Dr. Jean-Paul Rodrigue
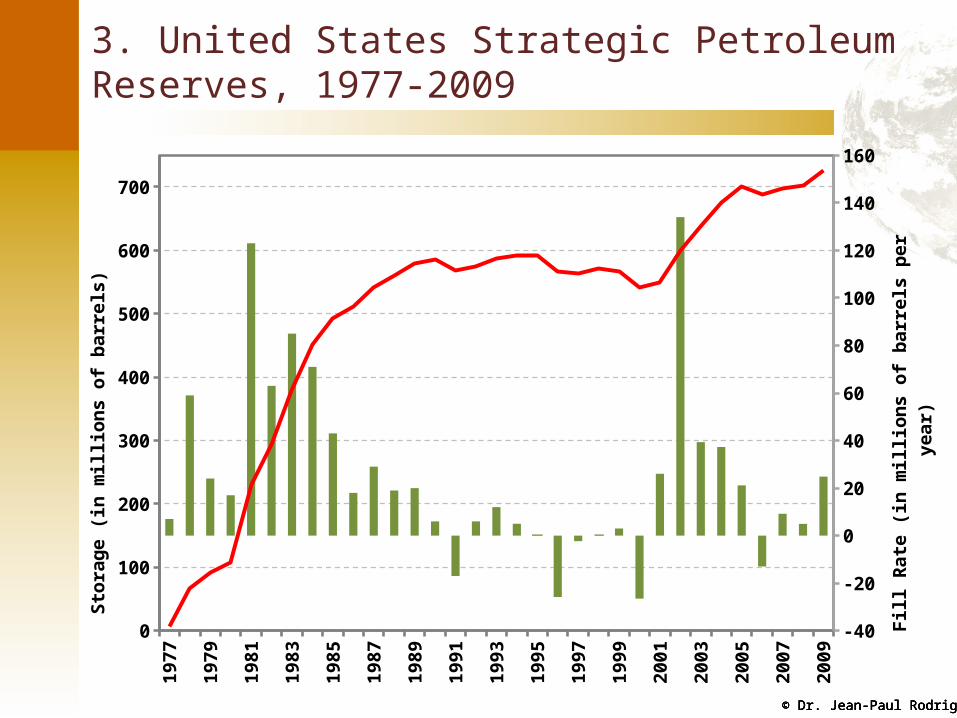
3. United States Strategic Petroleum Reserves, 1977-2009
1977
1978
1979
1980
1981
1982
1983
1984
1985
1986
1987
1988
1989
1990
1991
1992
1993
1994
1995
1996
1997
1998
1999
2000
2001
2002
2003
2004
2005
2006
2007
2008
2009
0
100
200
300
400
500
600
700
-40
-20
0
20
40
60
80
100
120
140
160
Stor
age
(in m
illio
ns o
f bar
rels
)
Fill
Rat
e (in
mill
ions
of b
arre
ls p
er y
ear)

© Dr. Jean-Paul Rodrigue© Dr. Jean-Paul Rodrigue© Dr. Jean-Paul Rodrigue© Dr. Jean-Paul Rodrigue
D. NATURAL GAS
1. Nature and Use2. Availability and Distribution

© Dr. Jean-Paul Rodrigue© Dr. Jean-Paul Rodrigue© Dr. Jean-Paul Rodrigue© Dr. Jean-Paul Rodrigue
1. Nature and Use
■ Natural gas formation• Thermogenic: converted organic material into natural gas due to
high pressure.• Deeper window than oil.
• Biogenic: transformation by microorganisms.■ Composition
• Composed primarily of methane and other light hydrocarbons.• Mixture of 50 to 90% by volume of methane, propane and butane.• “Dry” and “wet” (methane content); “sweet” and “sour” (sulfur
content).• Usually found in association with oil:
• Formation of oil is likely to have natural gas as a by-product.• Often a layer over the petroleum.

© Dr. Jean-Paul Rodrigue© Dr. Jean-Paul Rodrigue© Dr. Jean-Paul Rodrigue© Dr. Jean-Paul Rodrigue
1. Nature and Use
■ Use• Mostly used for energy generation.• Previously, it was often wasted - burned off. • It is now more frequently conserved and used.• Considered the cleanest fossil fuel to use.• The major problem is transporting natural gas, which requires
pipelines.• Gas turbine technology enables to use natural gas to produce
electricity more cheaply than using coal.

© Dr. Jean-Paul Rodrigue© Dr. Jean-Paul Rodrigue© Dr. Jean-Paul Rodrigue© Dr. Jean-Paul Rodrigue
2. Availability and Distribution
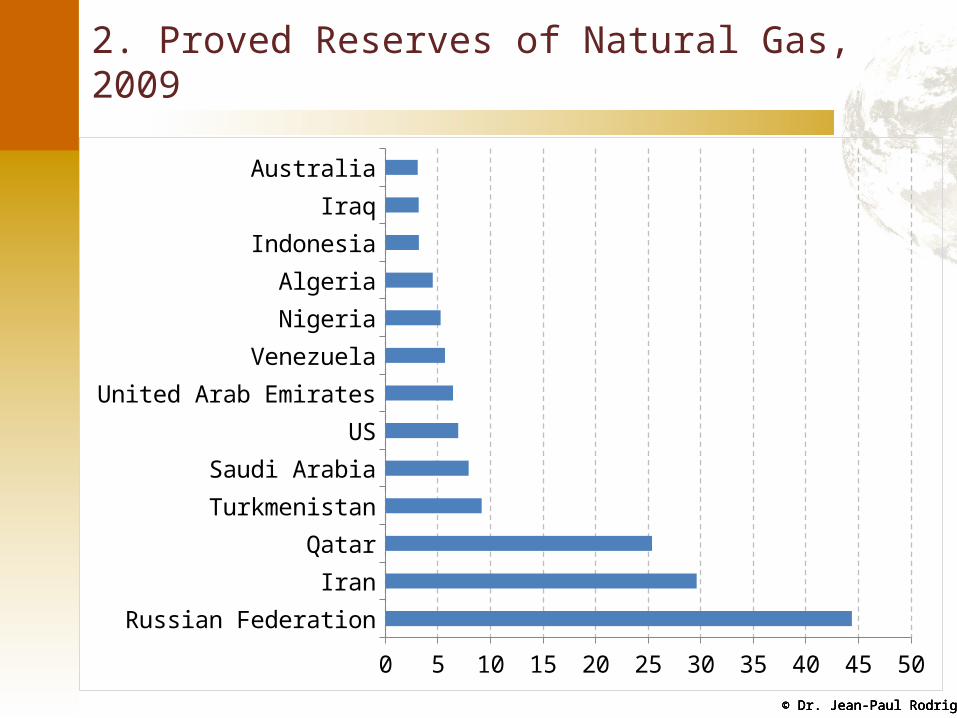
■ Reserves• Substantial reserves likely to satisfy energy needs for the next
100 years.• High level of concentration:
• 45% of the world’s reserves are in Russia and Iran.• Regional concentration of gas resources is more diverse:
• As opposed to oil.• Only 36% of the reserves are in the Middle East.
© Dr. Jean-Paul Rodrigue© Dr. Jean-Paul Rodrigue© Dr. Jean-Paul Rodrigue© Dr. Jean-Paul Rodrigue
2. Proved Reserves of Natural Gas, 2009
Russian Federation
Iran
Qatar
Turkmenistan
Saudi Arabia
US
United Arab Emirates
Venezuela
Nigeria
Algeria
Indonesia
Iraq
Australia
0 5 10 15 20 25 30 35 40 45 50

© Dr. Jean-Paul Rodrigue© Dr. Jean-Paul Rodrigue© Dr. Jean-Paul Rodrigue© Dr. Jean-Paul Rodrigue
2. Global Natural Gas Reserves, 2003
Trillion Cubic Feet (2003)
Less than 10 trillion
10 to 50 trillion
50 to 100 trillion
100 to 200 trillion
More than 200 trillion

© Dr. Jean-Paul Rodrigue© Dr. Jean-Paul Rodrigue© Dr. Jean-Paul Rodrigue© Dr. Jean-Paul Rodrigue
2. Natural Gas
■ Liquefied natural gas (LNG)• Growth of the global demand has created needs to move natural
gas over long distances.• Liquid form of natural gas; easier to transport.• Cryogenic process (-256oF): gas loses 610 times its volume.• Value chain:
• Extraction.• Liquefaction.• Shipping.• Storage and re-gasification.