Genworth 2015 investor day final2
52
1 Genworth MI Canada Inc. 2015 Investor Day December 7 th , 2015 2015 INVESTOR DAY Proven Business Model
-
Upload
genworthfinancial -
Category
Investor Relations
-
view
954 -
download
0
Transcript of Genworth 2015 investor day final2

1Genworth MI Canada Inc.2015 Investor Day
December 7th, 2015
2015 INVESTOR DAY
Proven Business Model

2Genworth MI Canada Inc.2015 Investor Day
Forward-looking and non-IFRS statements
DRIVING VALUE THROUGH CUSTOMIZED SERVICE EXPERIENCE
Public communications, including oral or written communications such as this document, relating to Genworth MI Canada Inc. (the“Company”, “Genworth Canada” or “MIC”) often contain certain forward-looking statements. These forward-looking statementsinclude, but are not limited to, statements with respect to the Company’s future operating and financial results, expectationsregarding premiums written, losses on claims and investment income, the Canadian housing market, and other statements that arenot historical facts. These forward-looking statements may be identified by their use of words such as “may”, “would”, “could”, “will,”“intend”, “plan”, “anticipate”, “believe”, “seek”, “propose”, “estimate”, “expect”, and similar expressions. These statements are basedon the Company’s current assumptions, including assumptions regarding economic, global, political, business, competitive, marketand regulatory matters. These forward-looking statements are inherently subject to significant risks, uncertainties and changes incircumstances, many of which are beyond the control of the Company. The Company’s actual results may differ materially fromthose expressed or implied by such forward-looking statements, including as a result of changes in the facts underlying theCompany’s assumptions, and the other risks described in the Company’s Annual Information Form dated March 23, 2015, its ShortForm Base Shelf Prospectus dated June 18, 2014, the Prospectus Supplements thereto, its most recently issued Management’sDiscussion and Analysis and all documents incorporated by reference in such documents. Management’s current views regardingthe Company’s financial outlook are stated as of the date hereof and may not be appropriate for other purposes. Other than asrequired by applicable laws, the Company undertakes no obligation to publicly update or revise any forward-looking statement,whether as a result of new information, future developments or otherwise.
To supplement its financial statements, the Company uses select non-IFRS financial measures. Non-IFRS financial measuresinclude net operating income, interest and dividend income (net of investment expenses), operating earnings per common share(basic), operating earnings per common share (diluted), shareholders’ equity excluding accumulated other comprehensive income(“AOCI”), operating return on equity and underwriting ratios such as loss ratio, expense ratio and combined ratio. The Companybelieves that these non-IFRS financial measures provide meaningful supplemental information regarding its performance and maybe useful to investors because they allow for greater transparency with respect to key metrics used by management in its financialand operational decision making. Non-IFRS measures do not have standardized meanings and are unlikely to be comparable to anysimilar measures presented by other companies. These measures are defined in the Company’s glossary, which is posted on theCompany’s website at http://investor.genworthmicanada.ca. A reconciliation from non-IFRS financial measures to the most readilycomparable measures calculated in accordance with IFRS, where applicable can be found in the Company’s most recentmanagement’s discussion and analysis, which is posted on the Company’s website and is also available at www.sedar.com.

3Genworth MI Canada Inc.2015 Investor Day
Stuart LevingsPresident and CEO
Strategic Overview

4Genworth MI Canada Inc.2015 Investor Day
Agenda and key themes
Strategic overview
Prudent risk management
Delivering a superior customer experience
Financial management and results
Question and answer session
Proven business model

5Genworth MI Canada Inc.2015 Investor Day
~$3 billion Market capitalization
92 million Shares outstanding
$6.1 billion Total assets
$3.4 billion Shareholders’ equity
Genworth Canada overview
WHO WE ARE
LARGEST private residential mortgage insurer in Canada
Helped ~1M+ families achieve homeownership
Supported 250+ Canadian lenders
WHAT WE DO1
1 2
4 3
Mortgage ApplicationMortgage Insurance Application and Premium
Mortgage Loan Insurance Contract
MARKET FACTS (Sept. 30th, 2015)
• Mandatory for less than 20% down payment
• Covers 100% of loan, secured by property
• Upfront non-refundable premium
• Lender receives protection against loss from mortgage default
• Capital relief for lenders
Homebuyer Mortgage lender(originates mortgage)
Mortgage insurer
Note: Company sources
1. Denotes transactional mortgage insurance.

6Genworth MI Canada Inc.2015 Investor Day
Key accomplishments
DRIVING VALUE THROUGH CUSTOMIZED SERVICE EXPERIENCE
Strong but prudent top line growth
High quality and diversified insurance portfolio1
2015 loss ratiotrending towards lower end
Cumulative 25% recent price increases translate into earnings tailwinds
Strong ROE and EPS / BVPS growth
~34%
Current market share
25%
CREDITSCORE
742
20% to 30% range
Note: Company sources
1. Credit score references the Q3 2015 YTD timeframe.

7Genworth MI Canada Inc.2015 Investor Day
Win-win solutions for borrowers experiencing temporary difficulties
Well-established risk culture supported by advanced risk / underwriting tools
Proven business model
Sound product design
Advanced risk management
Supportive regulatory environment
Proactive loss mitigation
Effective collaboration between mortgage insurance industry and prudential regulators
Mandatory, single up-front premium, prime mortgage product design

8Genworth MI Canada Inc.2015 Investor Day
Key strengths
How we measure success
Market share
High quality, diversified portfolio
EPS and BVPS growth
Strong employee engagement
Strong market presence
Focus on customer experience & operational excellence
Best-in-class technology & processes
Experienced and engaged workforce
IMPRESSIVE LONG-TERM TRACK RECORD
Prudent risk management
20+ years of performance data

9Genworth MI Canada Inc.2015 Investor Day
Served market: first time homebuyers
Purchase price <300K >300K - <=500K >500K
NATIONALVANCOUVERTORONTOCALGARY
…and what our prudent home buyers purchase
What our prudent home buyer profile looks like…
53%
31%
11%5%
<= 100K >100K - 150K >150K - 200K > 200K
53%
28%
13%
5%
<= 35 >35 - <= 45 >45 - <= 55 > 55
Detached Condo Row
69% 13% 12% 47% 17% 19% 52% 25% 21% 72% 10% 10%
3% immigrated to Canada1
67% bought with spouse/partner1
742 average credit score2
Average household
income = $97K
Average borrower age
= 36 years
Avg. price3
$428,000Avg. price3
$322,000Avg. price3
$455,000Avg. price3
$421,000
Note: Company sources.1. Nov14-Oct15 timeframe; Purchase Business only. 2. Credit score references the Q3 2015 YTD timeframe3. Average price represents Greater Calgary Area, Greater Toronto Area and Greater Vancouver Area, ex. re-financings.
10Genworth MI Canada Inc.2015 Investor Day
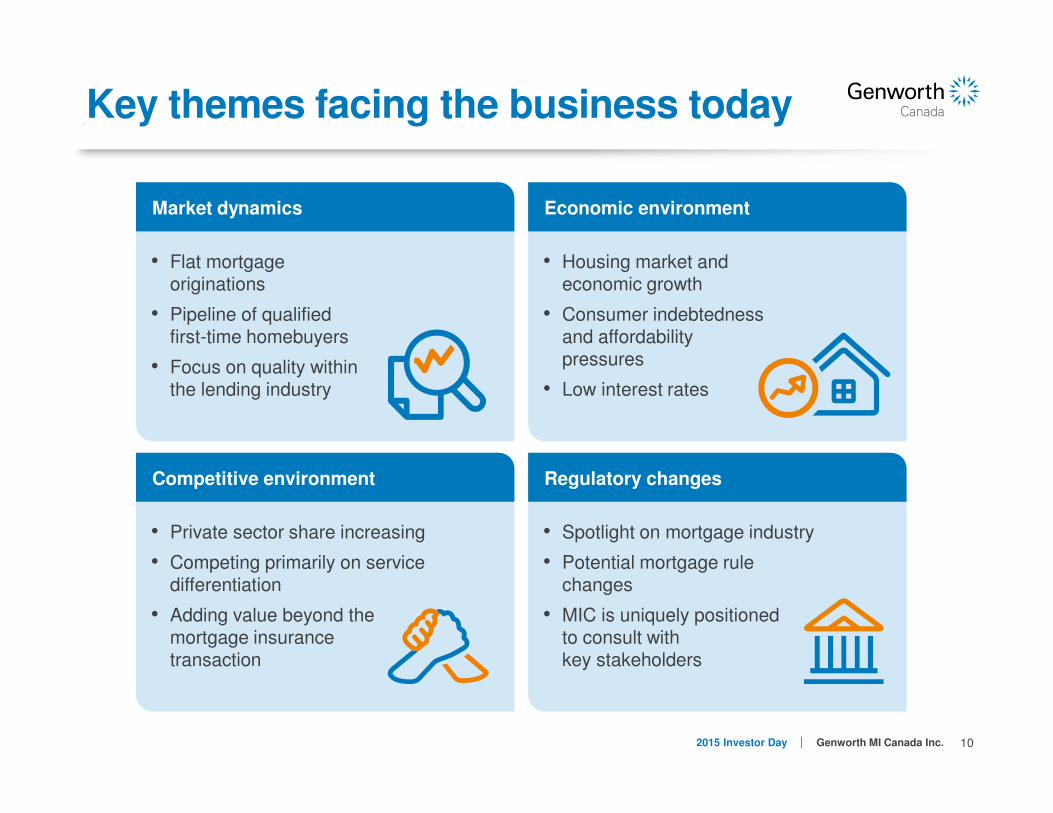
• Spotlight on mortgage industry
• Potential mortgage rule changes
• MIC is uniquely positioned to consult with key stakeholders
Regulatory changes
• Flat mortgage originations
• Pipeline of qualifiedfirst-time homebuyers
• Focus on quality within the lending industry
Market dynamics
• Private sector share increasing
• Competing primarily on service differentiation
• Adding value beyond the mortgage insurance transaction
Competitive environment
• Housing market and economic growth
• Consumer indebtedness and affordability pressures
• Low interest rates
Economic environment
Key themes facing the business today

11Genworth MI Canada Inc.2015 Investor Day
Our top strategic priorities
BUILDING ON SOLID BUSINESS FUNDAMENTALS
1
Prudent market share expansion
4
Strategic expansion; evaluating ancillary opportunities to enhance core mortgage insurance business
3
Proactive loss mitigation programs
(e.g. Homeowner Assistance Program)
2
Navigating 2016 with a keen focus on risk management

12Genworth MI Canada Inc.2015 Investor Day
Craig Sweeney Chief Risk Officer
Prudent Risk Management

13Genworth MI Canada Inc.2015 Investor Day
Risk categories
Strategic planning process & risk appetite
Strategic Operational Legal & Compliance Credit Market InsuranceModel
Strong enterprise risk management
EMERGING RISKS ARE IDENTIFIED, MANAGED & INCORPORATED INTO THE RISK MANAGEMENT PROCESS
Risk management processes & tools
Identification, assessment, measurement, management & controls
Risk monitoring & reporting
Governance framework
Oversight, culture, tone

14Genworth MI Canada Inc.2015 Investor Day
• Portfolio analytics
• Identification of emerging loss trends
• Dynamic underwriting policies
Portfolio Risk management
• Underwriting fundamentals
• Risk limits and triggers
• Robust quality assurance
Manage the quality of new business
Insurance risk framework
RISK PILLARS
• Macro-economic environment
• Housing market trends
• Regional risk factors
Identify & assesskey performance risks

15Genworth MI Canada Inc.2015 Investor Day
Key delinquency drivers
STRONG CORRELATION BETWEEN UE RATE AND MORTGAGE ARREARS RATE
Mortgage arrears and unemployment rate Mortgage arrears and mortgage rate
Sources: Statistics Canada, CBA
0%
1%
2%
3%
4%
5%
6%
7%
8%
9%
10%
0.0%
0.1%
0.2%
0.3%
0.4%
0.5%
200
2
200
4
200
5
200
6
200
7
200
9
201
0
201
1
201
2
201
4
201
5
Mortgage Arrears UE Rate (R)
0%
1%
2%
3%
4%
5%
6%
7%
8%
9%
10%
0.0%
0.1%
0.2%
0.3%
0.4%
0.5%
200
2
200
3
200
4
200
5
200
6
200
7
200
8
200
9
201
0
201
1
201
2
201
3
201
4
201
5
Mortgage Arrears 5 Yr Mtg. Rate
Strong correlation Modest correlation

16Genworth MI Canada Inc.2015 Investor Day
Government policy actions
GOVERNMENT POLICY ACTIONS REDUCE RISK ... QUALITY OF NEW BUSINESS IMPROVES
‘07 Today
Maximum amortization(insured mortgages)
40 years 25 years
LTV1 limit for newmortgages
100% 95%
LTV limit for mortgagerefinancing
95% 80%
LTV limit for investmentproperties
90% 80%
Debt-service criteria for> 80% LTV
No mandated
max
GDS2 capped at 39% &
TDS2 ratio at 44%
Purchase price for> 80% LTV
No max $1 mil.
‘07 / ‘08 ‘14 / ’15 YTD
% > 25 yearamortizations
61%
0%3
% > 95% LTV 14%
% of > 80% LTV refinance mortgages
23%
% of > 80% LTV for investment properties
1%
Average GDS 23% 24%
Average credit score 717 739
Improved credit quality
Note: Company sources
1. Loan-to-value.
2. GDS represents gross debt service ratio, and TDS represents total debt service ratio.
3. % of new originations > 25 year amortizations and over 80% LTV.

17Genworth MI Canada Inc.2015 Investor Day
Limiting stacked risk factors
UNDERWRITING DISCIPLINE LIMITS EXPOSURE TO VULNERABLE BORROWERS
71%
23%
4%1%1%
>90-95 >85-90 >80-85 >75-80 <=75
95 LTV – credit score
6%6%
10%
29%33%
17%
<=660 <=680 <=700 <=740 <=780 780+
28%
35%
21%
17%
>40 >35-40 >30-35 <=30%
95 LTV – TDSR
Stacked risks (% of NIW)
Halifax Montreal Ottawa Toronto Calgary Vancouver National
0.8% 0.8% 1.2% 0.7% 0.9% 0.8% 1.0%
LTV mix - transactional
Note: Company sources.
Based on July ‘14 to June ‘15 New Insurance Written (NIW), purchase only deal, excludes Alt-A.
Stacked Risk = >90% LTV and <= 660 score and >40 total debt service ratio (TDSR).

18Genworth MI Canada Inc.2015 Investor Day
Strong portfolio quality & mix
73% 74% 75% 79% 82%
18% 18% 17%15% 13%
9% 8% 8% 6% 5%
2011 2012 2013 2014 15YTD
>=700 660 - 669 <660
20%
4%
44%
14%
5%
13%
Alberta Atlantic Ontario B.C. Prairies Quebec
2. Based on Company’s estimate.1. % based on transactional new insurance written for 3Q’15 year to date.
Credit score dispersion1 Regional dispersion2 (as at June 30, 2015)
Note: Company sources.
Outstanding balance of insured mortgages as at June 30, 2015 of
$178B

19Genworth MI Canada Inc.2015 Investor Day
1,1771,415
1,2321,047
735 619 517 395 365
108
240387
492
480
342295
268 200
165
484862 1,048
722
437
284
222258
413
561
645 552
554
515
482569 578
183
240
255 262
261
240
252302 314
2007 2008 2009 2010 2011 2012 2013 2014 3Q15
Ontario BC Alberta Quebec Other
Current delinquency rate1
0.29%
0.41%
0.18%
0.25%
0.09%
Delinquency rates
Number of reported delinquencies
REFLECTS MACROECONOMIC ENVIRONMENT & IMPROVED PORTFOLIO QUALITY
Loss ratio 2 19% 31% 42% 33% 37% 33% 25% 20% 20%
3,381 3,401
2,752
2,153
1,830 1,756 1,715
2,940
2,046
Ontario
BCAlberta
Quebec
Other
~50%decline over
5 years
Note: Company sources.
1. Based on outstanding insured mortgages, as at June 30, 2015.
2. Loss ratio in 2009 excludes the impact of the change to the premium recognition curve in the first quarter of 2009.

20Genworth MI Canada Inc.2015 Investor Day
Ho
us
ing
ris
k
Economic riskLow High
High
GTA
GVA
Quebec
Alberta
Regional risk assessment
Market risk
Atlantic
Ontario
Prairies
Targeted underwriting actions Alberta & Saskatchewan
Monitoring housing risk in GTA and GVA
Balanced risk profile Quebec and Ontario
Note: Based on Company estimates.
21Genworth MI Canada Inc.2015 Investor Day
0
200,000
400,000
600,000
800,000
1,000,000
1,200,000
2007 2009 2011 2013 2015100,000
200,000
300,000
400,000
500,000
600,000
700,000
2007 2009 2011 2013 2015
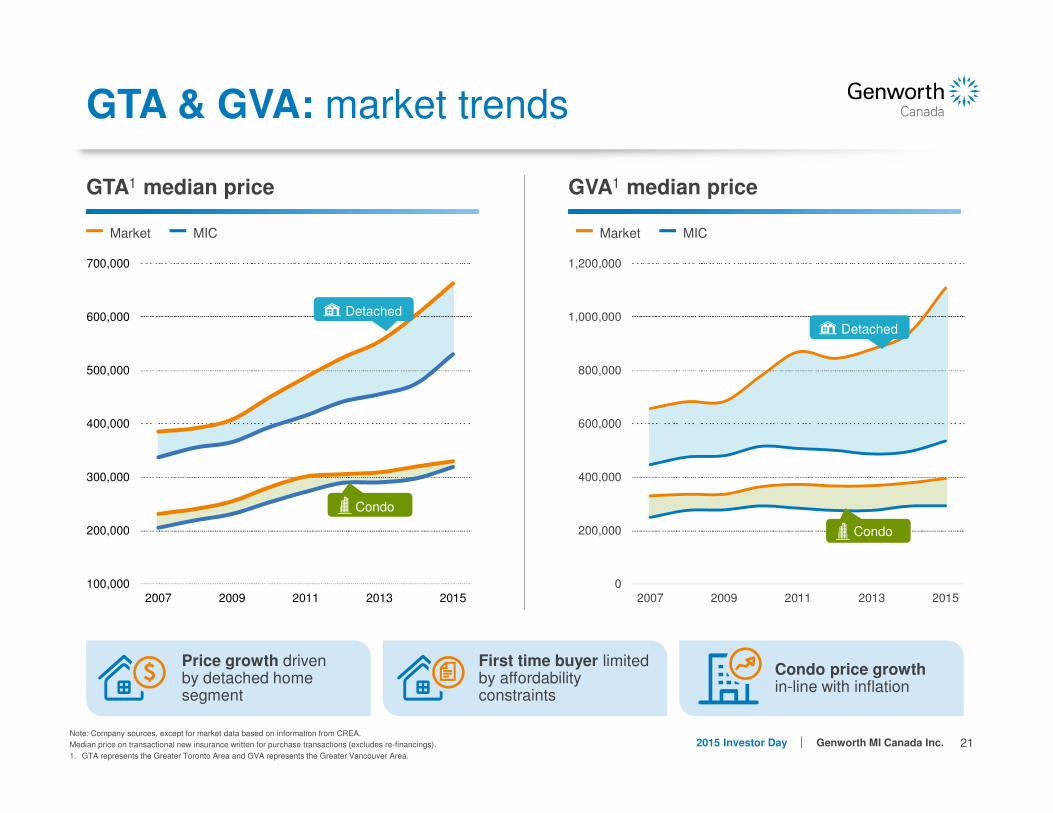
GTA & GVA: market trends
Price growth driven by detached home segment
First time buyer limited by affordability constraints
Condo price growth in-line with inflation
GTA1 median price GVA1 median price
Market MICMarket MIC
Detached
Condo
Detached
Condo
Note: Company sources, except for market data based on information from CREA.
Median price on transactional new insurance written for purchase transactions (excludes re-financings).
1. GTA represents the Greater Toronto Area and GVA represents the Greater Vancouver Area.

22Genworth MI Canada Inc.2015 Investor Day
GTA & GVA: embedded equity
*Estimated outstanding balance of insured mortgages as at June 30, 2015.
Note: GTA represents the Greater Toronto Area and GVA represents the Greater Vancouver Area.
4440
5964
7175
8388
43
51
6772
75 76
84
90
0
20
40
60
80
100
Portfolio <=2009 2010 2011 2012 2013 2014 2015
Effective loan-to-value by book year
GVA
GTA
Original NIW ($B) 65.2 69.4 6.9 6.3 5.2 4.5 4.9 2.5
Remaining NIW ($B)* 27 6.8 2.9 3.7 3.7 3.7 4.5 2.5
STRONG RUN-OFF AND EMBEDDED EQUITY IN OLDER BOOKS REDUCING RISK

23Genworth MI Canada Inc.2015 Investor Day
13%
4%719
747
2007 2008 2009 2010 2011 2012 2013 2014 15YTD
% of <660 credit score Average credit score
GVA portfolio quality
GTA & GVA: lower risk profile
STEADY CREDIT SCORE IMPROVEMENT & DECLINING EXPOSURE TO HIGHER RISK LOANS SINCE 2007
16%
3%
714
747
2007 2008 2009 2010 2011 2012 2013 2014 15YTD
% of <660 credit score Average credit score
GTA portfolio quality
Note: Company sources for transactional new insurance written.
Note: GTA represents the Greater Toronto Area and GVA represents the Greater Vancouver Area.
24Genworth MI Canada Inc.2015 Investor Day
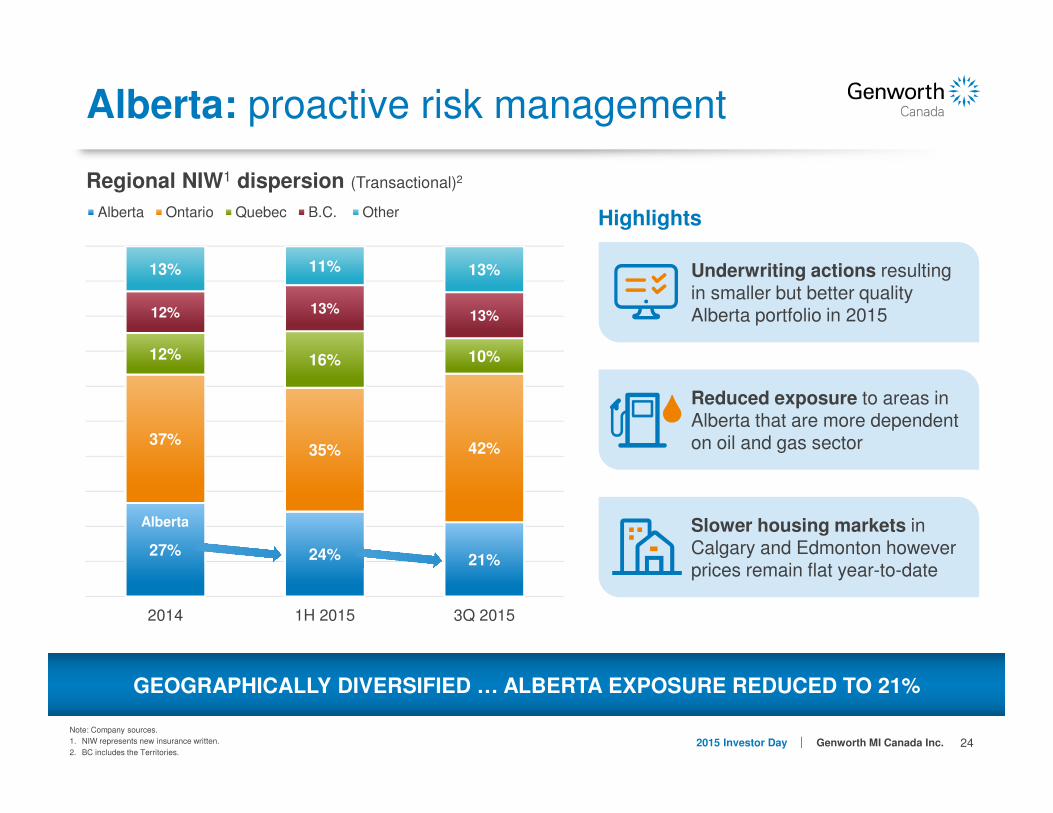
Highlights
Alberta: proactive risk management
GEOGRAPHICALLY DIVERSIFIED … ALBERTA EXPOSURE REDUCED TO 21%
Underwriting actions resulting in smaller but better quality Alberta portfolio in 2015
Reduced exposure to areas in Alberta that are more dependent on oil and gas sector
Slower housing markets in Calgary and Edmonton however prices remain flat year-to-date
27% 24% 21%
37%35% 42%
12% 16% 10%
12% 13% 13%
13% 11% 13%
2014 1H 2015 3Q 2015
Alberta Ontario Quebec B.C. Other
Regional NIW1 dispersion (Transactional)2
Alberta
Note: Company sources.
1. NIW represents new insurance written.
2. BC includes the Territories.
25Genworth MI Canada Inc.2015 Investor Day
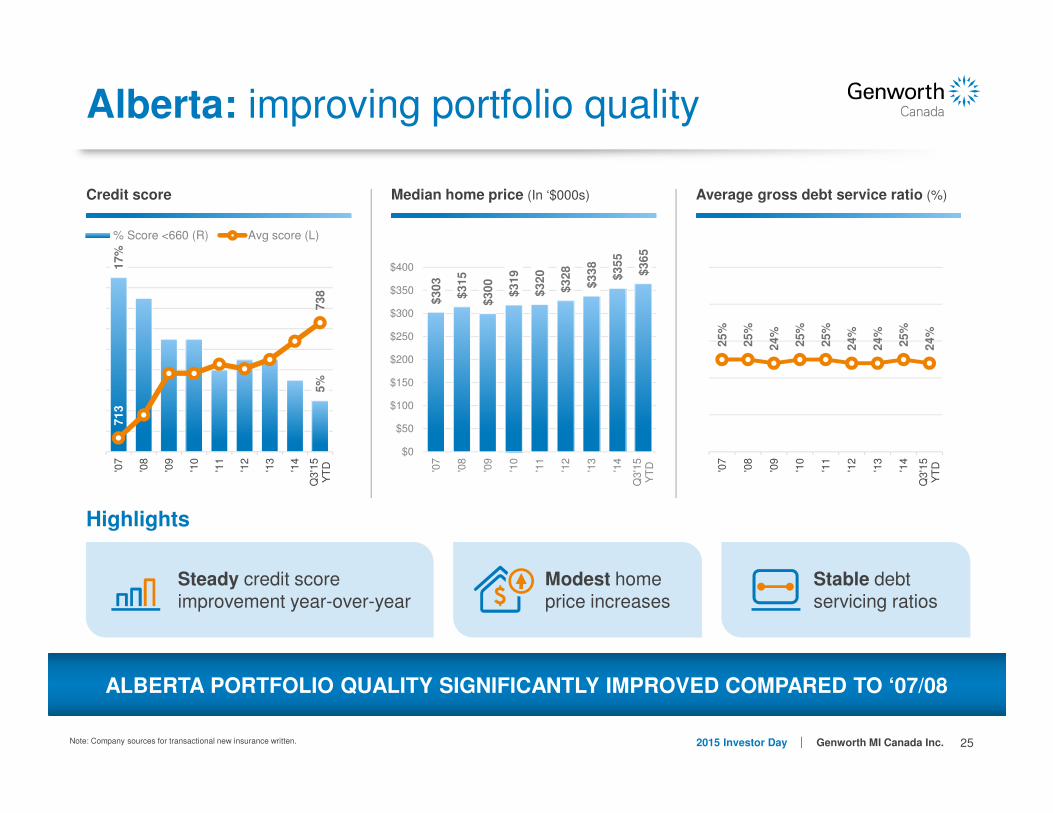
Highlights
Alberta: improving portfolio quality
ALBERTA PORTFOLIO QUALITY SIGNIFICANTLY IMPROVED COMPARED TO ‘07/08
Credit score Average gross debt service ratio (%)
17
%
5%
71
3
73
8
'07
'08
'09
'10
'11
'12
'13
'14
Q3'1
5Y
TD
% Score <660 (R) Avg score (L)
25
%
25
%
24
%
25
%
25
%
24
%
24
%
25
%
24
%
'07
'08
'09
'10
'11
'12
'13
'14
Q3'1
5Y
TD
Steady credit score improvement year-over-year
Modest home price increases
Stable debt servicing ratios
Note: Company sources for transactional new insurance written.
Median home price (In ‘$000s)
$3
03
$3
15
$3
00
$3
19
$3
20
$3
28
$3
38
$3
55
$3
65
$0
$50
$100
$150
$200
$250
$300
$350
$400
'07
'08
'09
'10
'11
'12
'13
'14
Q3'1
5Y
TD

26Genworth MI Canada Inc.2015 Investor Day
2016 annual loss ratio expectations
MIC loss ratio & CBA1 delinquency rates2
PRELIMINARY 2016 ANNUAL LOSS RATIO RANGE: MID-20% TO MID-TO-HIGH 30%
1 Source: Canadian Bankers Association (CBA) and Company sources. 2 2009 excludes the impact of the change to the premium recognition curve in 1Q’09* CBA delinquency rates as of Q2 2015.
• Canada delinquency rate
should benefit from stronger
economy in ‘16
• Higher quality MIC portfolio
since 2009
• Impact of lower oil prices
should be less severe on
MIC’s loss ratio this cycle
2016 Loss Ratio Range
Alberta delq. rate (CBA) (LS)
Canada delq. rate (CBA) (LS)
0%
10%
20%
30%
40%
50%
0.0%
0.1%
0.2%
0.3%
0.4%
0.5%
0.6%
0.7%
0.8%
0.9%
2006 2007 2008 2009 2010 2011 2012 2013 2014 Q3'15YTD*
Canada loss ratio - MIC (RS) Alberta DR-CBA

27Genworth MI Canada Inc.2015 Investor Day
Key takeaways
Prudent risk management
Underwriting actions reducing risk
Well positioned to address regional economic pressures
2016 annual loss ratio range: mid-20% to mid-to-high 30%
Strong portfolio quality

28Genworth MI Canada Inc.2015 Investor Day
Scott GormanSVP, Operations
Delivering a Superior Customer Experience
Debbie McPhersonSVP, Sales & Marketing

29Genworth MI Canada Inc.2015 Investor Day
Customer centric culture
FOCUSED ON DRIVING VALUE THROUGH A SUPERIOR CUSTOMER EXPERIENCE

30Genworth MI Canada Inc.2015 Investor Day
Key takeaways
Competitive differentiation
driven by innovative customer
experience strategy
Risk appetite integrated into our sales and underwriting strategies
Proactive loss mitigation programs provide benefit to lenders, homeowners and MIC
Delivering added value through an integrated and cross-functional approach to customer service
Market share gains achieved through relationships, collaboration and transparency

31Genworth MI Canada Inc.2015 Investor Day
Philip MayersSVP and Chief Financial Officer
Financial Management and Results

32Genworth MI Canada Inc.2015 Investor Day
Proven business model…
Superior customer experience and value added relationships have produced market share gains
Demonstrated results
Prudent risk management driving improved portfolio quality and strong loss performance
Proactive loss mitigation keeps borrowers in their homes and reduces our loss exposure
Loss ratio
Market share (Transactional)1
25% 20% 20%
2013 2014 YTD 2015
28% 34%
Q1 2014 Q3 2015
56% 57%
2014 YTD 2015
Workout penetration rate2
Note: Company sources.
1. Market share based on management estimates.
2. Workout penetration means the ratio (expressed as a percentage) of the number of total workouts approved, including shortfall sales, divided by the number of new delinquencies and re-delinquencies over the same period. Workout penetration ratio measures the number of workouts performed relative to the number of existing workout opportunities and is used to assess the success of the loss mitigation homeowner’s assistance program.

33Genworth MI Canada Inc.2015 Investor Day
Strong earnings profile
114 11184 84
235 255
199 196
349366
283 280
2013 2014 Q3 YTD 2014 Q3 YTD 2015
Note: Company sources.
1. Net Operating Income, Operating EPS (diluted) and Operating ROE are non-IFRS measures. See “Forward looking and non-IFRS statements” at the beginning of the presentation.
2. Pro-forma for 2015 MCT Guideline.
SOLID PROFITABILITY AND FINANCIAL PROFILE
Operating EPS (diluted)1 $ 3.60 $ 3.86 $ 2.96 $ 3.02
BVPS (diluted, incl. AOCI) $ 32.53 $ 35.02 $ 34.57 $ 36.14
Operating ROE1 12% 12% 12% 12%
MCT Ratio 223% 228%2 224% 228%
Long-term debt: Total capital 12% 12% 12% 11%
Investment income net of interest expense
(after taxes)
Underwriting profit (after taxes)
Net operating income1

34Genworth MI Canada Inc.2015 Investor Day
Transactional insurance
$20
$22
$16
$19
2013 2014 Q3 YTD2014
Q3 YTD2015
+$2.6B
+$3.1B
STRONG YoY GROWTH REFLECTS SOLID BUSINESS FUNDAMENTALS
~5-points of market share gains over the past 18 months
Modestly largerorigination market
Two rounds of price increases totaling 25%
$447
$512
$368
$466
$43
$22
$57
2013 2014 Q3 YTD2014
Q3 YTD2015
$555
Average premium rate
2.29% 2.51% 2.45% 2.75%
New insurance written ($ billions)
+$133M$523
$390
Net premiums written ($ millions)
+$108M
YoY impact of price increases
Note: Company sources.

35Genworth MI Canada Inc.2015 Investor Day
Portfolio insurance
$15
$20
$17$16
2013 2014 Q3 YTD2014
Q3 YTD2015
+$4.6B
-$1.3B
$65
$83
$70 $71
2013 2014 Q3 YTD2014
Q3 YTD2015
+$18M+$1M
New insurance written ($ billions) Net premiums written ($ millions)
PROPOSED REGULATORY CHANGE IN 2016 MAY LIMIT VOLUMES…PORTFOLIO INSURED MORTGAGES WOULD BE REQUIRED TO BE SECURITIZED IN GOV’T MBS PROGRAMS
Note: Company sources.
Strong portfolio insurance volumes in recent years have enhanced lender relationships

36Genworth MI Canada Inc.2015 Investor Day
Premiums earned growth
LARGER RECENT BOOKS PROVIDE TAILWIND FOR PREMIUMS EARNED
COMBINATION OF HIGHER INSURED VOLUMES AND PRICE INCREASESEXPECTED TO DRIVE 5%+ GROWTH IN PREMIUMS EARNED IN 2016 AND BEYOND
$272 $234 $254
$1,095 $1,086 $1,127
$370 $443$578
Q3 2013 Q3 2014 Q3 2015
6 years & prior Previous 4 books Most recent
+20% +30%
-1% +4%
-14% +9%$144 $141 $143
$143 $141 $144
$143 $140 $148
$142 $143
2013 2014 2015
Q1 Q2 Q3 Q4
-2%Q3 YTD
+3%Q3 YTD
Q3 YTD
$431 $422 $435
Unearned premiums reserve ($ millions) Premiums earned ($ millions)
FY $573 FY $565$1.7B $1.8B
$2.0B
Note: Company sources.
37Genworth MI Canada Inc.2015 Investor Day
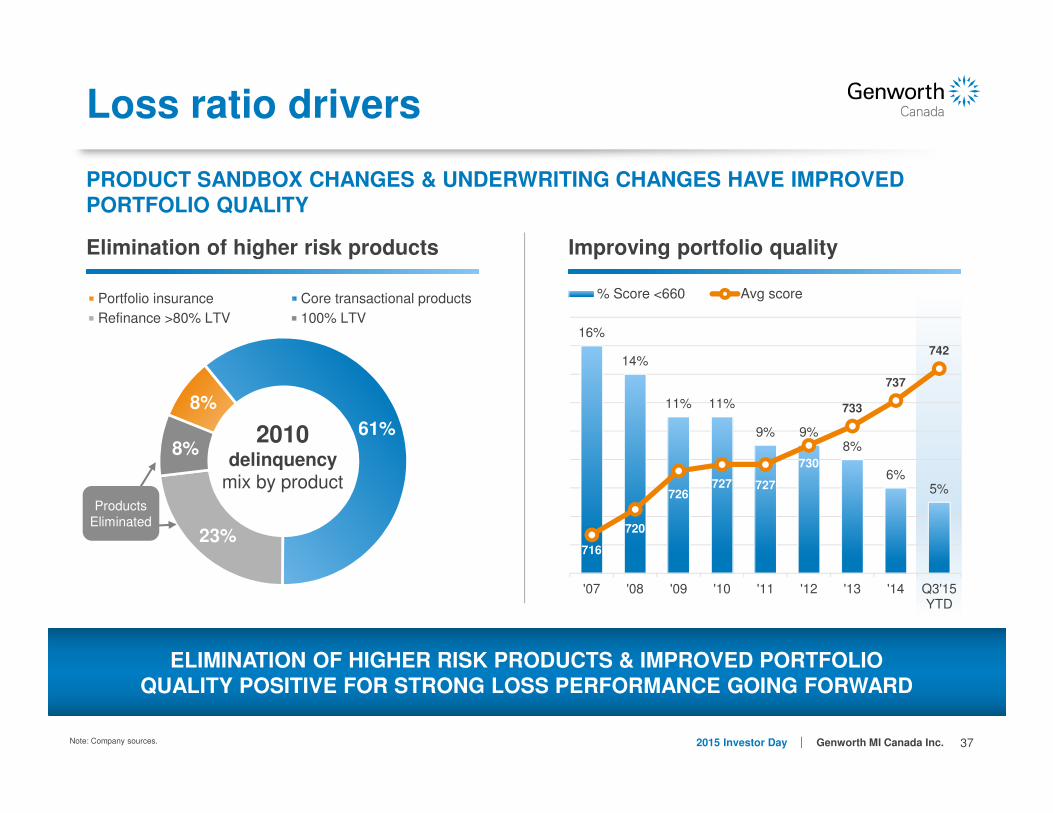
Loss ratio drivers
PRODUCT SANDBOX CHANGES & UNDERWRITING CHANGES HAVE IMPROVED PORTFOLIO QUALITY
ELIMINATION OF HIGHER RISK PRODUCTS & IMPROVED PORTFOLIOQUALITY POSITIVE FOR STRONG LOSS PERFORMANCE GOING FORWARD
Elimination of higher risk products Improving portfolio quality
8%
61%
23%
8%
Portfolio insurance Core transactional products
Refinance >80% LTV 100% LTV
Products Eliminated
16%
14%
11% 11%
9% 9%8%
6%5%
716
720
726727 727
730
733
737
742
'07 '08 '09 '10 '11 '12 '13 '14 Q3'15YTD
% Score <660 Avg score
2010 delinquency
mix by product
Note: Company sources.

38Genworth MI Canada Inc.2015 Investor Day
Underwriting profitability
Combined ratio
STRONG UNDERWRITING PERFORMANCE DRIVING IMPROVED PROFITABILITY
42%33% 37% 33%
25% 20% 18% 20%
15%
17%17%
18%
20%19% 18% 19%
57%50%
53% 51%44%
39% 36% 39%
2009* 2010 2011 2012 2013 2014 Q3 YTD 2014 Q3 YTD 2015
Loss ratio Expense ratio
Potential impact on loss ratio
Improvedportfolio quality
Lowoil prices
• Trending towards lower end of 2015 loss ratio target range of 20% to 30%
• Targeting a mid 20% to mid-to-high 30%loss ratio range for full year 2016
Decreasing loss ratio Increasing loss ratio
Note: Company sources.
* Excludes the impact of change to the premium recognition curve in the first quarter of 2009.
2014/2015 price increases

39Genworth MI Canada Inc.2015 Investor Day
Loss performance & economic scenarios
MI PRICED TO COVER TYPICAL ECONOMIC CYCLE
Illustration:Expected over
economic cycleStress
scenario
Unemployment rate change over 5 years
1% to 2% increase 2% to 4% increase
Cumulative HPA / HPD over 5 years
5% to 7% -15% to -20%
Loss ratio (national)over 5 years
25% to 30% 60% to 70%
Note: Company estimates based upon historical data and performance trends; expected ranges are approximations.Actual results may differ materially from those expressed above.

40Genworth MI Canada Inc.2015 Investor Day
Strong balance sheet
EXPECTED EMBEDDED FUTURE PROFITS ENHANCES SHAREHOLDER VALUE
$26.94$30.62 $32.53
$35.02 $36.14 $36.14
$6.98
2011 2012 2013 2014 Q3 2015 Q3 2015*
Illustration:
Unearned premiums $ 2.0B
Future losses on claims & expenses1 (1.1)
Future pre-tax underwriting income 0.9
Future net income $ 0.6B
Incremental book value per share $ 6.98
($ millions) Sept. 30, 2015
Assets
Cash and investments $ 5,678
Other assets 411
Total assets $ 6,089
Liabilities
Loss reserves 121
Unearned premiums 1,959
Long term debt 432
Other liabilities 220
Total liabilities 2,732
Shareholders’ equity (w/AOCI)
3,357
Total liabilities and shareholders’ equity
$ 6,089
Book value per share (incl. AOCI, diluted)
$2.0B OF UNEARNED PREMIUMS REPRESENT FUTURE REVENUES & PROFITS
Note: Company sources.
1. Theoretical example - future losses on claims and expenses calculated using 55% combined ratio. *Pro-forma.

41Genworth MI Canada Inc.2015 Investor Day
HIGH QUALITY PORTFOLIO CONTRIBUTES ~35% OF NET OPERATING INCOME…PORTFOLIO GROWTH SHOULD PARTIALLY OFFSET YIELD PRESSURE
Well diversified investment portfolio
17% Federal Bonds
Government of Canada bond yields remain unattractive at low levels
17% Fed. Agency / NHA MBS
Federal Agency and NHA MBS provide incremental yield
18% Provincials
Diversified average credit rating of AA
3% Preferred Shares
Preferred shares yields are attractive
5% Emerging Markets Debt (Inv. Grade)
Selective geographic participation focused on non-resource sectors
0% High Dividend Common Shares
Higher level of regulatory capital and ongoing volatility
17%
17%
18%
36%5%
4%
3%
Represents current relative attractiveness
Note: Company sources.
1. Note: as of September 30, 2015.
36% Investment Grade Corporates
Spreads have widened significantly
$5,443$5,678
$235
4Q14 3Q15
$5.7B portfolio1
Duration: 3.8 years1
Book yield: 3.3%1
Cash
Invested assets(C$ millions)

42Genworth MI Canada Inc.2015 Investor Day
Intend to operate moderately above the 220% MCT holding target
Holding company cash and liquid securities of $120 million and leverage of 11%3
Capital management
$19,502
$22,112
$15,919
$19,012
2013 2014 Q3 YTD2014
Q3 YTD2015
Capital required at 220% MCT ($ millions)1
+$3.1B
Transactional new insurance written ($ millions)
$3,159$3,329
$3,448
$38
$116
$120
2013 Jan. 1/15 Q3 2015
Holdco cash2 $85M $143M $120M
MCT ratio 223% 228% 228%
FOCUSED ON DEPLOYING CAPITAL TO SUPPORT ORGANIC GROWTH OPPORTUNITIES
$3,197
+$2.6B
$3,445
$3,568+$248M
+$123M
Flexibility Efficiency
Strength
Note: Company sources.
1. MCT denotes ratio for operating insurance company.
2. Represents capital in addition to capital in operating insurance company.
3. As at Sept. 30, 2015.

43Genworth MI Canada Inc.2015 Investor Day
New capital framework for 2017
COMPANY DOES NOT EXPECT A MATERIAL IMPACT ON CAPITAL REQUIREMENTS
1
New regulatory
capital framework for
mortgage insurers
expected to be
implemented
Jan. 1, 2017
2
Capital framework is
being designed to be
more risk sensitive
by using more loan
level risk attributes
3
New capital framework
is not expected to
change the total dollar
amount of capital
required at holding
target (which reflects
stress testing results
for tail events)
4
Company is working
with OSFI closely and
expects more granular
details on the proposed
framework in the first
half of 2016

44Genworth MI Canada Inc.2015 Investor Day
Key takeaways
Proven business model has positioned
MIC for future financial performance
Price increases & market share gains providing tailwind for premiums written and premiums earned
Track record of solid financial performance reflects proven business model
Improved insurance portfolio quality, positive for loss performance
Strong balance sheet built on conservative investment portfolio and capital strength

45Genworth MI Canada Inc.2015 Investor Day
Stuart LevingsPresident and CEO
Wrap Up

46Genworth MI Canada Inc.2015 Investor Day
Key takeaways
Customer service leader
Deep risk expertise
Sustainable business model
Momentum and staying power
MIC is well-positioned
forfuture
success

47Genworth MI Canada Inc.2015 Investor Day

48Genworth MI Canada Inc.2015 Investor Day
Senior management team
Stuart Levings, President & CEO15+ years of mortgage insurance experience
Mr. Levings assumed his current role as President and Chief Executive Officer in January 2015. Prior to that Mr. Levings served in such senior leadership positions as Senior Vice President, Chief Operating Officer, Senior Vice President, Chief Operations Officer and Senior Vice President, Chief Risk Officer. Mr. Levings joined the Company in July 2000 as the Financial Controller, and has also held positions in finance and product development, including five years as Chief Financial Officer. Before that, Mr. Levings spent seven years with Deloitte & Touche. Mr. Levings holds a CPA, CA professional designation with over 15 years of professional experience in a variety of industry sectors. Mr. Levings holds a Bachelor of Accounting Science degree from the University of South Africa and is a member of both the South African and Canadian Institutes of Chartered Accountants.
Philip Mayers, Chief Financial Officer25+ years of mortgage insurance experience
Mr. Mayers became Chief Financial Officer of the Company in 2009. He has over 25 years of finance and general management experience in financial services businesses. Since joining the Company in 1995, Mr. Mayers has held several senior positions, including Vice President, Finance, Vice President, Operations, and Senior Vice President, Business Development. Prior to joining the Company, he held finance positions with Mortgage Insurance Company of Canada (“MICC”), Esso Petroleum Canada and Deloitte & Touche. He holds CPA, CA and CMA professional designations and has a Master of Accounting degree from the University of Waterloo.

49Genworth MI Canada Inc.2015 Investor Day
Senior management team
Craig Sweeney, Chief Risk Officer15+ years of mortgage insurance experience
Mr. Sweeney has more than 18 years of professional experience in the mortgage and banking industry. Since joining the Company in 1998, Mr. Sweeney has held senior positions in Operations and Business Development, including Director of Risk Operations and Director of Product Development. Mr. Sweeney received an honours Bachelor of Arts degree in Economics from Carleton University in 1994.
Winsor Macdonell, SVP, General Counsel & Secretary15+ years of mortgage insurance experience
Mr. Macdonell is responsible for all of the Company’s legal and compliance matters, as well as government relations. Mr. Macdonell joined the Company in 1999. He was called to the Bar in Ontario in 1994. Prior to joining the Company, he spent three years in the life and property and casualty industry, and prior to that was in private practice. Mr. Macdonell received an honours Bachelor of Commerce degree from Queens University in 1988 and his LL.B. from Dalhousie University in 1992 and his ICD.D in 2014.

50Genworth MI Canada Inc.2015 Investor Day
Senior management team
Debbie McPherson, SVP, Sales and Marketing25+ years of mortgage insurance experience
Ms. McPherson has over 25 years of experience and success in sales and quality management with the Company. Prior to her current position, Ms. McPherson was the Company’s Ontario Regional Sales Director. Ms. McPherson plays an active role in many industry organizations, including the Canadian Association of Accredited Mortgage Professionals, the Canadian Homebuilders Association and the Canadian Real Estate Association. Ms. McPherson graduated from the University of Toronto with a Bachelor of Arts degree.
Scott Gorman, SVP, Operations15+ years of experience
Mr. Gorman has more than 19 years of International Industry and Consulting experience within the Financial Services Industry. Prior to joining Genworth Canada, Mr. Gormanworked for TD Financial Group as VP, Head of Card Operations & Initiatives, and Royal Sun Alliance (RSA) as the Regional Chief Operating Officer for their Asia and Middle East Region as well as VP of RSA’s Canadian National Operations. Mr. Gorman has a Bachelor’s of Commerce from Memorial University of Newfoundland and an MBA from Schulich School of Business, York University.

51Genworth MI Canada Inc.2015 Investor Day
Senior management team
Rhonda Lawson, SVP, Human Resources and Facilities20+ years experience
Ms. Lawson joined the Company early in 2013, and brings more than 20 years of leadership experience in senior human resource management roles with global public and private corporations, including Aviva, Intact (ING Canada), Allianz and TevaPharmaceuticals. Ms. Lawson has held Director roles on a number of corporate and not-for-profit Boards since 1993, most recently as a Director and Chair of the HR Committee on the Boards of DST Engineering Group and Rouge Valley Health Systems (RVHS).
Brian Hurley, Executive Chairman20+ years of mortgage insurance experience
Mr. Hurley led the establishment of Genworth into the Canadian marketplace in 1994 and later led it through its initial public offering in 2009. He stepped down as President and CEO of Genworth Canada and assumed the role of Executive Chairman in January 2015. Mr. Hurley has more than 20 years of senior management experience in the mortgage insurance industry worldwide, including leading Genworth’s activities in key international markets from 2004 to 2009. Prior roles include Senior VP, International of General Electric’s U.S. mortgage insurance business and Senior VP of Sales and Operations. Mr. Hurley graduated from Assumption College in Worcester, Massachusetts with a Bachelor of Science degree in Economics.

52Genworth MI Canada Inc.2015 Investor Day
Investor Relations
Jonathan A. Pinto, MBA, LL.M
Vice President, Investor Relations