Automated Testing Tips Copyright © 2000 Compuware Corporation Mark Nesslar July 15, 2000.
Using Complex Electronics to SIMPLIFY Technology
Gentex Corporation 2000 Annual Report

Corporate Profile 1
Six-Year Financial Summary 2
Letter to Shareholders 4
Simplify – The Product Story 10
Simplify – The Customer Story 12
Simplify – The Consumer Story 14
Information Regarding Common Stock 18
Quarterly Results of Operations 18
Management’s Discussion and Analysis 19
Consolidated Financial Statements 22
Notes to Consolidated Financial Statements 27
Report of Independent Auditors 36
Stock Performance Summary 37
15-Year Summary of Financial Data 38
Corporate Data 40
Directors and Officers 41
Table of Contents
MISSION STATEMENTTo be a smarter organization;a world-class manufacturer withsuperior products and servicedriven by a supportive work cul-ture that encourages people to innovate, excel and continuallyimprove every aspect of the busi-ness.
EXCHANGE/SYMBOLThe Nasdaq Stock Market®/GNTX
Certain matters discussed in this annual
report are “forward-looking statements,”
which involve certain risks and uncertain-
ties, and are subject to change based
on various market, industry and other
important factors. The Company cautions
investors that numerous factors (as out-
lined in the Company’s Form 10-K filed
with the Securities and Exchange Com-
mission and other interim reports) in
some cases may affect in the future the
Company’s actual results, and may cause
those results to differ materially from
those expressed in this annual report.

Introduction and Corporate Profile
1
Using Electronics to SIMPLIFY Technology
Technology drives today’s economy and continues to proliferate in every industry imaginable. That’s fine with us, because since its inception, Gentex has developed advanced electronics in order to SIMPLIFY technology for its customers. That’s been our focus; that’s been our passion.
We also understand that technology needs to be useable, manageable, and above all, current. Becausetechnology is evolving at a breakneck pace, it needs to be delivered to consumers in a timely, flexible and cost-effective manner. In the primary industry we serve –automotive – we do this in a rather unusual way: throughthe rearview mirror.
That’s why Gentex is such an anomaly. On one hand,we’re a successful automotive supplier; on the other,we’re a technology company. It’s a dichotomy that makesus difficult to peg, yet holds the very key to our success.
On the pages that follow, we’ll SIMPLIFY an explanationof what we do and how we do it. It’s only fitting, becauseafter all, if simplifying technology is what delivers value toour customers, it’s ultimately what delivers value to you,our shareholders.
2000 Revenues:
$297.4 million
Employees:
1,599
Divisions:
1. Automotive Products (93% of revenues)
2. Fire Protection Products (7% of revenues)
3. Lighting (in development)
Main Products:
1. NVS® automatic-dimmingmirrors and related electronicfeatures and displays
2. Advanced headlamp controlproducts.
3. Smoke detectors, fire alarmsand signaling devices.
4. Light-emitting diode (LEDs)lighting products (in devel-opment).
Locations:
Four facilities in Zeeland,Michigan; an automotive salesoffice in Livonia, Michigan;automotive sales and engineer-ing subsidiaries in Germany,France, the UK and Japan; andfour regional offices for the FireProtection Products Group.
Fast
Fac
ts

Financial SummarySix-Year Highlights
2
For the years ended December 31, 1995 1996
Net Sales $111,566 $148,708Operating Income 24,962 31,840Net Income 18,895 23,963 Earnings Per Share – Diluted $ 0.28 $ 0.34 Return on Average Equity 22.7% 21.5%Weighted Average Shares Outstanding – Diluted 68,511 71,025Number of Shareholders1 12,120 21,458
Total Assets 109,244 140,378Working Capital 42,011 61,335Current Ratio 4:1 6:1
Cash, and Short- and Long-Term Investments 66,424 82,479 Plant and Equipment – Net 18,942 31,575
Long-Term Debt, including current maturities 0 0Shareholders’ Investment 94,672 127,804Return on Average Assets 19.9% 19.2%
Capital Expenditures 4,862 16,424Depreciation and Amortization 3,202 3,919
Market Performance:High 6 7⁄8 13 3⁄8Low 3 15⁄16 5 1⁄4
Number of Employees 791 1,018
1Includes registered and estimated “street name” shareholders.
In thousands, except current ratio, per share data, return on average equity, return on average assets, market performance data, and number of employees and shareholders.All per share data have been adjusted to reflect the two-for-one stock splits effected in the form of 100 percent common stock dividends issued in June 1996 and June 1998.A 15-year summary of financial data is on pages 38 and 39.

3
Change
1997 1998 1999 2000 2000 vs. 1999
$186,328 $222,292 $262,155 $297,421 13%
47,482 67,343 85,522 90,411 6%
35,230 50,307 64,864 70,544 9%
$ 0.49 $ 0.68 $ 0.86 $ 0.93 8%
23.4% 24.5% 23.4% 19.6%
71,962 73,617 74,996 75,518 1%
15,800 19,669 28,186 37,293 32%
189,783 254,890 337,673 428,129 27%
61,328 100,510 121,745 170,865 40%
5:1 8:1 8:1 10:1
111,422 152,807 220,551 291,459 32%
42,239 59,360 71,338 81,920 15%
0 0 0 0
173,205 237,008 317,051 402,104 27%
21.3% 22.6% 21.9% 18.4%
16,383 24,596 21,968 21,617 -2%
6,418 7,523 9,657 11,334 17%
14 1⁄8 22 34 7⁄8 39 7⁄8
8 1⁄8 10 3⁄4 16 16 3⁄16
1,334 1,400 1,421 1,599 13%
0
50
100
150
200
250
$300
1995 1996 1997 1998 1999 2000
Net Sales (in millions)
0
20
40
60
$80
1995 1996 1997 1998 1999 2000
Net Income (in millions)
0
.20
.40
.60
.80
$1.00
1995 1996 1997 1998 1999 2000
Earnings Per Share

4
Letter to ShareholdersMarch 2, 2001
To Our Shareholders:
The new millennium brought with it numerous opportunities and challenges for Gentex Corporation. We announcedand launched some significant new products, and are moving into some new technological areas that have theprospects to potentially change the way people look at our company in the years to come.
We have significant new automotive mirror programs that have been awarded that will come to fruition over the nextseveral years beginning in August 2001; one major area of emphasis is in the mid-sized, mid-priced segment of the vehicle market. In addition, the Company is progressing on the development of products utilizing the PhotobitCorporation “camera-on-a-chip”image sensing technology. We also have automotive and non-automotive opportu-nities with the new light-emitting diode (LED) technology that was announced in December 1999.
One of the most significant new products announced during the year was the auto-dimming “telematics” mirrorsused for the General Motors OnStar® global communications/navigation system.That project represents the first timea rearview mirror has served as the driver interface for an in-vehicle safety and security information service. Gentex’selectronics expertise, agility and speed to market were the primary reasons GM chose Gentex as its lead developmentpartner on that project.
Based on the initial success of that project, Gentex is now not only developing similar products for other customers,but also is working to integrate portions of the telematics system into the mirror – items that currently are part of thecomplete system but are located elsewhere in the vehicle, and also are supplied by other companies. A good exampleis the new line of microphones that Gentex has developed that will first be available in mirrors in the 2002 model year.
The OnStar system was a fast-track program, and GM had already selected a microphone before Gentex becameinvolved. The microphones used in those mirrors were useful in the passenger cars in which they were installed, butwere not optimized for other noisier or larger vehicle cabins – such as a truck or a sport utility vehicle – or those envi-ronments where voice recognition is/will be required. We saw this as an opportunity and subsequently developed aline of microphones specifically for use in all vehicle environments.
These microphones will also be compatible with voice recognition technology. While the current OnStar and othersystems link drivers directly to a live operator, in the long term we believe this will not be efficient for automakersand we expect that most will change their systems to voice recognition. In order for voice recognition to work well,you first need to start with a very good microphone, and we think that Gentex has made significant progress in this area.
Adding content to our mirrors, similar to what we expect to do with the telematics systems, is the primary way thatGentex has maintained its excellent profit margins in the highly competitive automotive environment. Automakersare clamoring for features to differentiate their products from those of their competitors. Placing electronic featuresin an auto-dimming rearview mirror has proven to be a very efficient way for them to accomplish that goal, offeringspeed to market that could not otherwise be achieved if the features were offered in the vehicle’s instrument panelor overhead console – each of which would require significant time and costs for tooling.
In calendar 2000, over 40 percent of all Gentex interior mirrors included at least one added electronic feature. Thoseproducts with added features, especially the telematics-type mirrors, have given the Company reason to examine itscapacity requirements for the next several years. The Company completed construction and started manufacturinginterior mirrors in its new Riley Street production facility in April 2000.That facility effectively doubles the Company’scapacity for manufacturing simple auto-dimming mirrors to a theoretical 14 million units.

5
Advanced-feature mirrors can help SIMPLIFY
overall vehicle complexityby combining various
electronic features into one module.
With the recent trends toward telematics mirrors, which add significant electronic content to mirrors, the Companyis closely monitoring its capacity requirements for the 2004 model year and beyond. We see this as a positive development in the Company’s history, since several automakers have indicated that they plan to put telematics mirrors across many of their vehicle lines, and they believe that the mirror is the best place for the driver interface forthose systems. And, while we may not be able to produce as many mirrors with our existing building capacity, thetelematics units are higher priced units and have the potential to add revenues and earnings when they utilizeGentex-developed content.
Clockwise from top left: Temperature display, Microphone, GPS Components, Compass display, Low-tire-pressure monitoring, Remote home/garage controls, Remote keyless entry, LED map lamps

6
We are also making substantial progress in the development of products based on the Photobit“camera-on-a-chip”image sensing technology. While the exact applications have not been announced, the first product that will go intoproduction in the 2002 model year will enhance the performance/cost structure of our existing mirror products. Thefirst revenue-producing product that is being developed is an automotive safety product that currently is not available in any vehicle in the world. Automakers are impressed with the product’s performance to date, and areinterested in implementing it in vehicles as early as the 2004 or 2005 model year.
In 1997, Gentex made an initial equity investment in privately held Pasadena, California-based Photobit Corporationin exchange for an exclusive license to its proprietary technology for certain automotive applications. Gentex currently owns about ten percent of that company.
The Company continues to progress on the development of itslight-emitting diode (LED) technology that was announced inDecember 1999. As you may recall, two inventions wereannounced: the basic binary, complementary white (BCW™) LEDand the Orca™ power package. The BCW LED utilizes amber andblue-green LEDs or LED chips to produce white light when properlymixed. The Orca power package utilizes either BCW or monochrome-colored LED chips and maximizes the light output of those chips, poten-tially increasing the light output up to a factor of ten over conventional LEDpackages.
At this time, there are ongoing discussions with key LED chip sources, and the Company is conducting engineeringdevelopment with select automotive customers for the Orca LED power package. Simultaneously, strategic dialogueswith potential alliance partners in the lighting industry, LED component industry and LED chip industry continue.Pilot production Orca LED samples from a new microelectronics line should be available to key customers and partners in the second half of 2001.
From a financial perspective, the Company posted record net income for the year ended December 31, 2000, of $70.5 million, or 93 cents per share, on a 13 percent increase in revenues to $297.4 million. The Company reportednet income of $64.9 million, or 86 cents per share, on revenues of $262.1 million in 1999. Total Night Vision Safety™
(NVS®) Mirror shipments to automotive customers in 2000 increased to a record 6.8 million units for the year, compared with 6.0 million units for the same 1999
period. The positive year-over-year comparison is primarily attributable tostrong unit shipments to Japan and Europe.
Domestic shipments also remain steady despite the fact that the NorthAmerican light vehicle market has softened somewhat. There currently is a relatively low application rate for our mirrors worldwide and they are optional (versus standard) equipment on many vehicle models.When automakers reduce production on light vehicles, we are affected
to the extent that they reduce production on vehicle models that offer our mirror. To date, our mirrors have been offered on the more
popular vehicles and we haven’t been as severely impacted by reductions invehicle production.
7
In addition, our international mirror unit shipments are an increasing part of our total shipments, and the interna-tional portion has been growing at a faster rate than the North American segment. We expect the rate of growth ininternational shipments over the near-term to continue to outpace the growth rate in North America.
Gentex is a unique company operating in a tough environment. We’re simultaneously an automotive supplier and ahigh-tech innovator, a paradox that sets us apart and allows us to provide above-average returns to investors. We’reconfident this can continue if we stay agile and move forward, outpacing the competition in terms of innovation,value and quality. We believe we’ve demonstrated our ability to do that in the past, and plan to prove that we cancontinue to do it in the future.
Thank you for your continued support of our efforts.
Fred T. Bauer Ken L. La GrandChairman and Chief Executive Officer Executive Vice President & Director

Making the Mirror a Strategic Electronic ModuleThis Gentex advanced-feature, automatic-dimming mirror comes with a compass display, light-emitting diodemap lamps, hands-free microphone, OnStar® user interface and more. By combining features in the mirror,Gentex is helping customers reduce complexity by using the mirror as a strategic electronic module.
Positive TrendsMirror sales to offshore customers are growing rapidly, especially in the Asia Pacific region, where sales grewby more than 100% in 2000. Offshore customers received 36% of the mirror units shipped last year.
Over 40% of the interior mirrors Gentex sells come with one or more advanced features (displays, RF com-munications, map lamps, telematics, etc.). By continually reinventing the rearview mirror and making it astrategic electronic module, Gentex provides customers with new, high-tech, profitable features while helpingmaintain the Company’s own profit margins.

Off-Shore
36%North
America
64%
Advanced-Feature
EC Mirrors
40%Base
EC Mirrors
60%
2000 Total Unit Shipments 2000 Interior Mirror Shipments

10
Gentex Products Simplify Complex Technologies
Current telematics systems combine satellite-tracking global positioning systems, cellular telecommunications and operator-assisted information services
to connect the vehicle to the digital world. Gentex mirrors currently house the system’s user interface, but soon will act as the vehicle’s communications portal,
housing telematics antennas, receivers, phones and controllers.

Making the complex simple… that’s what we do.At Gentex, we invent, shape and simplify complextechnologies in order to deliver value-added electro-optical products to customers and consumers alike.
Some “pigeon-hole” us as a rearview mirror supplier,but those who know us well realize that we’re muchmore than that. Our products require state-of-the-artelectronic and chemical laboratories, mechanical engi-neering capabilities and automated manufacturingassembly expertise. The collective skill set of ourresearchers, scientists and technicians mirrors that ofmany of today’s high-tech firms. The main difference:we actually make tangible products, some of which areprofiled on the pages that follow.
Telematics
Telematics is the fastest growing segment of the automotive industry. It delivers various informationsystems to vehicles via telecommunications, essential-ly linking the driver to the burgeoning digital world.Features like e-mail messaging, global positioning sys-tem (GPS) navigation and emergency roadside assis-tance are all made possible by telematics.
But how do you take a feature this complex and put itin a vehicle so that it’s safe, intuitive and easy to use?Gentex helped General Motors grapple with this ques-tion concerning its OnStar® telematics system. Ourdiscussions led to the development of the world’s first telematics mirror – a Gentex automatic-dimmingrearview mirror that acts as the system driver interfacefor OnStar®.
Today, we’re working with other automotive manufac-turers on additional mirror-borne telematics solutions.In our never-ending quest to SIMPLIFY, our goal is tohouse not only the telematics interface in the mirror,but also the GPS antenna and receiver, cell phoneantenna, and/or system controller.
Lighting
Another technology we developed and simplified is in the lighting arena. Gentex has invented a way toproduce high-intensity white light suitable for illumi-nation from light-emitting diodes (LEDs), somethingthat has never been done before.
Our process is innovative yet incredibly simple. We usea combination of amber and blue/green LED chipsthat when properly mixed produce white light.To make our white light – or any color LED for thatmatter – even brighter, we developed a proprietaryhousing, or package, which allows us to get up to 10times more light from a typical LED.
By simplifying LED lighting, we’re developing demandfor our technology from a host of industries, includingautomotive, display, housing, office furniture, electron-ics, aerospace, and others.
Fire Protection
Years ago, we revolutionized the fire protection in-dustry by developing a new type of smoke detector that actually “saw”smoke. It quickly be-came the standardtechnology for use invirtually all commer-cial applications.
Today, we’re developing new sensing technologies tocreate “hybrid” detectors that would better detect dif-ferent types of fires. Smoke, flame and heat can bedetected in a variety of ways, and Gentex continues toadvance and SIMPLIFY these technologies in order todevelop new fire protection products.
Tire-Pressure Monitoring
Recent tire recalls and the belief that under-inflatedtires can lead to accidents have the National HighwayTraffic Safety Administration (NHTSA) mandating thatautomotive manufacturers introduce low-tire-pressurewarning systems over the next several years. But that’snot as simple as it sounds. Redesigning, retooling andmanufacturing instrument panels and/or overheadconsoles to accommodate new features and displaysrequires a costly, time-consuming process that canoften take up to three to five years.
Gentex has helped the industry SIMPLIFY the tech-nology by offering a low-tire-pressure warning systemin an automatic-dimming rearview mirror. It can sim-ply inform the driver that a tire is under-inflated, or itcan display the exact pressure of each individual tire.
11

Gentex Mirrors Simplify Customer Challenges
12
Integrating technology into the vehicle is tough, whether it’s telematics, LED lighting,compass and temperature displays, HomeLink®, tire-pressure warning systems, headlamp control, voice recognition, or TRIP functions. Gentex mirrors help simplify our customers’
challenges by allowing them to get new technology to market fast and affordably, in a safe,flexible, high-performance location that’s easy to service and update.

13
The automotive industry is a tough environment inwhich to operate, yet year after year, Gentex suc-ceeds where others fail. One reason is that ourproducts and technology help SIMPLIFY the com-plex challenges faced by our customers.
Reduce Complexity
Because we can include so much in the rearviewmirror, we can be a single source for a wide variety ofelectronic features, including compass and tempera-ture displays, remote keyless entry receivers, LEDmap lamps, TRIP functions, hands-free cell phones,telematics systems and the like. For our customers,this reduces vehicle build complexity, which resultsin fewer part numbers and easier assembly.
Common Feature Location
Placing advanced electronic features in the mirror –one common location – also makes system diag-nostics easier and allows for commonality acrossdifferent vehicle product lines.
Minimize Costs
Gentex mirror-borne technologies also help theautomotive manufacturers increase revenue andreduce costs. History shows that consumers arewilling to pay for Gentex safety and conveniencefeatures. In addition, placing features in the mirror ismuch less costly than redesigning and retoolingoverhead consoles and instrument panels. Ouradvanced feature automatic-dimming mirrors canalso help reduce the cost of purchasing separateelectronic components, reduce wiring/connectorcosts, and minimize installation costs.
Quick to Market
Gentex products also SIMPLIFY our customers’lives by allowing them to get new electronic featuresto market quickly. The average design and develop-ment cycle in the automotive industry is three tofive years, meaning that by the time a new car hitsthe streets, many times its technology can alreadybe outdated. By placing new features in the rearview mirror, which can be added near the end of the development cycle or as a dealer-installedoption, manufacturers can bring new technologiesto market quicker.
Why
Gen
tex
Suc
ceed
sW
here
Oth
ers
Fail • Highest-quality automatic-
dimming mirror systems
available.
Gentex meets or exceeds all worldwide automotive standards.
• Huge growth potential for
automatic-dimming mirrors.
Worldwide penetration rate is only 10% for interior mirrorsand 4% for exterior mirrors.
• Products are primarily
safety and convenience
features, which consumers
are willing to pay for.
• Gentex is an electronics
technology company.
Focus on bringing new electronicfeatures/devices to market.
• Built-in audience for new
technology.
Our automatic-dimming mirrorsare an ideal location to introducenew technology to vehicles.
• Leveraging technologies into
other industries (windows,
lighting, sensors, etc.).
Gentex helped General Motors develop the world’s first auto-dimming telematics mirror: OnStar®.

Gentex Products Simplify Consumer Tasks
14
During nighttime driving, Gentex automatic-dimming rearview mirrors SIMPLIFY tasks by automatically dimming to eliminate rearview mirror glare and turning your
headlamps on and off at dusk and dawn. They can also lock/unlock your car doors,open your garage, turn on your house lights, and monitor your tire pressure.

15
It’s an obvious truism, but technology is useless unlessit’s useful. It needs to be logical, intuitive, and easy touse. Ideally, technology’s mechanism should be trans-parent, providing benefit to the user while requiringminimum intervention and cognition.
That’s why Gentex mirrors automate basic – yet essen-tial – driving tasks. Our goal is to use complex tech-nologies to bring safety, simplicity and convenience tothe driving experience.
Electrochromic (auto-dimming) Rearview Mirrors
It all started with rearview mirrors. Using a combina-tion of complex electronics and sophisticated lightsensors, we taught mirrors how to prevent temporarynighttime blindness – the afterimage that occurs whenglare from trailing vehicles contacts the eyes. OurNVS® (Night Vision Safety™) mirrors detect and elimi-nate dangerous rearview mirror glare automatically,making nighttime driving safer for consumers aroundthe world.
Headlamp Control
But we didn’t stop there. The mirrors’ built-in, intelli-gent light sensors can be used to help automate a variety of other functions to aid the driver.
One such feature is headlamp control. Gentex mirrorscan automate the process of turning your headlightson and off at dusk and dawn. If fact, our intelligentlight sensors are so smart, they not only know whetherit’s day or night, but also if the vehicle is in a tunnel,overpass, parking garage or similar structure. They can control your headlamps and precisely mimic driver expectations to ensure that you’re never drivingin the dark.
Automotive Microphone Technology
The car of the future will automate tasks (i.e. turningon your radio) via the sound of your voice. However,task automation, and the success of future telematicssystems and car-based cellular phones, hinges onvoice recognition, which demands advanced micro-phone technologies. Gentex recently developed itsown microphone technology designed to be located inautomatic-dimming rearview mirrors. It’s engineered
for superior performance within the harsh, noisy automotive environment, allowing for hands-freephone operation and voice recognition. Once again,Gentex is making driving safer by minimizing con-cerns over driver distraction and automating auxiliarydriving tasks.
RF Communications
Using RF (radio frequency) transmitters and receivers,Gentex mirrors can automate a variety of other tasks,such as locking and unlocking your car doors (remotekeyless entry), opening your garage door and turningon house lights*, or monitoring your tire pressure.Both the interior and exterior mirrors represent excellent locations for housing RF communicationssystems.
An Ideal Location
Locating advanced electronic features in an interiorautomatic-dimming mirror affords a host of benefits tocustomers and consumers alike. Because the mirror is in the driver’s natural line-of-sight, it’s a safe place to locate those features the consumer needs to contin-ually view or interact with, such as a low-tire-pressurewarning display, hands-free phone, GPS system inter-face or compass display.
*Gentex has the exclusive license to integrate Johnson Controls’HomeLink® system into automatic-dimming rearview mirrors.HomeLink is a registered trademark of Johnson Controls.
The display in Gentex’s tire pressure monitoring mirrors can simply warn the driver
of an under-inflated tire or provide the exact tire pressure of each individual tire.


Fin
anci
als
Information Regarding Common Stock 18
Quarterly Results of Operations 18
Management’s Discussion and Analysis 19
Consolidated Financial Statements 22
Notes to Consolidated Financial Statements 27
Report of Independent Auditors 36
Stock Performance Summary 37
15-Year Summary of Financial Data 38

18
Information Regarding Common Stock
Quarterly Results of OperationsIn thousands except per share data
The Company’s common stock trades on The Nasdaq Stock Market®. As of March 1, 2001, there were 2,608 recordholders ofthe Company’s common stock. Ranges of high and low sale prices of the Company’s common stock reported through The Nasdaq Stock Market for the past two fiscal years appear in the following table.
YEAR QUARTER HIGH LOW
1999 First 25 3⁄4 19 3⁄4Second 34 7⁄8 20 1⁄2
Third 32 1⁄4 18 Fourth 29 1⁄16 16
2000 First 39 7⁄8 24 3⁄4
Second 3711⁄16 24 3⁄8
Third 30 1⁄16 20 1⁄2
Fourth 27 1⁄4 16 3⁄16
The Company has never paid any cash dividends on its common stock, and management does not anticipate paying any cashdividends in the foreseeable future.
First Quarter Second Quarter Third Quarter Fourth Quarter2000 1999 2000 1999 2000 1999 2000 1999
Net Sales $73,877 $65,618 $76,756 $66,889 $71,934 $64,146 $74,854 $65,502Gross Profit 32,507 28,993 32,120 29,337 28,550 25,794 31,776 29,211Operating Income 24,494 22,288 23,363 22,159 19,985 18,744 22,570 22,332Net Income 18,550 16,710 18,360 16,537 15,854 14,444 17,780 17,174Diluted Earnings Per Share $ .25 $ .22 $ .24 $ .22 $ .21 $ .19 $ .24 $ .23

Management’s Discussion and Analysis of Results of Operations and Financial Condition
19
RESULTS OF OPERATIONS
The following table sets forth for the periods indicated certain items from the Company’s Consolidated Statements of Incomeexpressed as a percentage of net sales and the percentage change of each such item from that in the indicated previous year.
Percentage of Net Sales Percentage ChangeYear Ended December 31 2000 1999 1998 2000-1999 1999-1998Net Sales 100.0% 100.0% 100.0% 13.5% 17.9%Cost of Goods Sold 58.0 56.8 59.3 15.9 12.8
Gross Profit 42.0 43.2 40.7 10.2 25.4Operating Expenses:
Research and Development 5.7 5.2 5.0 22.9 25.2Selling, General and Administrative 5.9 5.4 5.4 25.5 16.5
Total Operating Expenses 11.6 10.6 10.4 24.2 20.7Operating Income 30.4 32.6 30.3 5.7 27.0
Other Income 4.7 4.1 3.3 32.0 46.1Income Before Provision for Income Taxes 35.1 36.7 33.6 8.6 28.9
Provision for Income Taxes 11.4 12.0 11.0 8.4 28.7Net Income 23.7% 24.7% 22.6% 8.8% 28.9%
RESULTS OF OPERATIONS: 2000 to 1999
Net Sales. Automotive net sales increased by 14% and mir-ror shipments increased by 13%, from 5,960,000 to 6,757,000units, primarily reflecting increased penetration on foreign2000 and 2001 model year vehicles for interior and exteriorelectrochromic Night Vision Safety (NVS) Mirrors. NorthAmerican unit shipments increased by 3%, while overseasunit shipments increased by 39% during 2000. Net sales ofthe Company’s fire protection products increased 2%.
Cost of Goods Sold. As a percentage of net sales, cost ofgoods sold increased from 57% to 58%, primarily reflectingautomotive customer price reductions and the opening of athird automotive manufacturing facility, partially offset byengineering and purchasing cost reductions, improved exterior mirror element glass yields, and increased sales volume spread over fixed overhead expenses.
Operating Expenses. Research and development expensesincreased approximately $3,145,000, and increased from 5% to 6% of net sales, primarily due to additional staffing for new electronic and telematics product development.Selling, general and administrative expenses increased
approximately $3,584,000, and increased from 5% to 6% ofnet sales, primarily reflecting additional staffing in Europeand Japan, including the opening of a new sales and engi-neering office in France, to support the Company’s currentand future overseas sales growth.
Other Income – Net. Investment income increased$4,899,000 in 2000, primarily due to higher investable fundbalances and higher interest rates, and other incomedecreased $1,480,000 in 2000, primarily due to realized equity losses in 2000 compared to realized equity gains in 1999.
Taxes. The provision for federal income taxes varied fromthe statutory rate in 2000 primarily due to Foreign SalesCorporation exempted taxable income from increased foreign sales, and tax-exempt interest income.
Net Income. Net income increased by 9%, primarilyreflecting the increased sales level and investment income,partially offset by reduced gross and operating margins in 2000.

20
RESULTS OF OPERATIONS: 1999 to 1998
Net Sales. Automotive net sales increased by 19% and mirror shipments increased by 22%, from 4,902,000 to5,960,000 units, primarily reflecting increased penetrationon domestic and foreign 1999 and 2000 model year vehiclesfor interior and exterior electrochromic Night Vision Safety(NVS®) Mirrors. North American unit shipments increasedby 22%, aided by record automotive industry productionlevels, while overseas unit shipments increased by 20%during 1999. Net sales of the Company’s fire protectionproducts increased 4%, primarily due to increased sales ofits AC/DC smoke detectors and low current draw strobe.
Cost of Goods Sold. As a percentage of net sales, cost ofgoods sold decreased from 59% to 57%, primarily reflectingproduct cost reductions in connection with the Company’snew in-house glass coating equipment installed in mid-1998, improved exterior mirror element glass yields andincreased sales volume spread over fixed overhead expens-es, partially offset by automotive customer price reductions.
Operating Expenses. Research and development expensesincreased approximately $2,772,000, but remained at 5% of net sales, primarily due to additional staffing for newproduct development and increased engineering chargesfor outside services. Selling, general and administrativeexpenses increased approximately $1,992,000, but remainedat 5% of net sales, primarily reflecting additional staffing inEurope and Japan to support the Company’s current andanticipated future overseas sales growth.
Other Income – Net. Investment income increased$2,569,000 in 1999, primarily due to higher investable fundbalances and higher interest rates. Other income increased$804,000 in 1999, primarily due to realized equity securitiesgains.
Taxes. The provision for income taxes was less than thestatutory rate in 1999, primarily due to higher Foreign SalesCorporation exempted taxable income from increased foreign sales and tax-exempt interest income.
Net Income. Net income increased by 29%, primarilyreflecting the increased sales level and improved gross prof-it in 1999.
LIQUIDITY AND CAPITAL RESOURCES
The Company’s financial condition throughout the periodspresented has remained very strong.
The Company’s current ratio increased from 8.4 in 1999, to9.7 in 2000, primarily as a result of the increase in cash andcash equivalents generated from operations.
Management considers the Company’s working capital ofapproximately $170,865,000 and long-term investments ofapproximately $153,016,000 at December 31, 2000, togeth-er with internally generated cash flow and an unsecured$5,000,000 line of credit from a bank, to be sufficient tocover anticipated cash needs for the foreseeable future.
INFLATION, CHANGING PRICES AND OTHER
In addition to price reductions over the life of its long-termagreements, the Company continues to experience pricingpressures from its automotive customers, which haveaffected, and which will continue to affect, its margins tothe extent that the Company is unable to offset the pricereductions with productivity and yield improvements,engineering and purchasing cost reductions, and increasesin sales volume. In addition, the Company continues toexperience some pressure for raw material cost increases.
The Company currently supplies NVS® Mirrors toDaimlerChrysler AG (North America) and General MotorsCorporation under long-term agreements. The long-termsupply agreement with DaimlerChrysler AG runs throughthe 2003 Model Year, and the GM contract runs through the2004 Model Year for inside mirrors.

21
MARKET RISK DISCLOSURE
The Company is subject to market risk exposures of varying correlations and volatilities, including foreign exchange rate risk,interest rate risk and equity price risk.
The Company has some assets, liabilities and operations outside the United States, which currently are not significant. Becausethe Company sells its automotive mirrors throughout the world, it could be significantly affected by weak economic conditionsin foreign markets that could reduce demand for its products.
The Company manages interest rate risk and default risk in its fixed-income investment portfolio by investing in shorter-termmaturities and investment grade issues. The Company’s fixed-income investments’ maturities at carrying value ($000,000),which closely approximates fair value, and average interest rates are as follows:
Total Balanceas of December 31,
2001 2002 2003 2004 2005 2000 1999U.S. Treasuries
Amount $10.1 $48.9 $22.1 — — $81.1 $66.6Average Interest Rate 6% 6% 6% 6% 6%
Municipal
Amount $12.7 $ 5.6 $ 2.4 $ .4 — $21.1 $32.2Average Interest Rate* 4% 4% 4% 5% 4% 4%
Other
Amount $ 5.5 $ 4.7 $ 9.1 $2.4 $5.5 $27.2 $ 8.5Average Interest Rate 6% 7% 7% 7% 7% 7% 6%
*After-tax
Most of the Company’s equity investments are managed by a number of outside equity fund managers who invest primarilyin large capitalization companies trading on the U.S. stock markets.

Consolidated Balance Sheetsas of December 31, 2000 and 1999
2000 1999ASSETS
Current Assets:
Cash and cash equivalents $110,195,583 $ 69,227,972 Short-term investments 28,246,967 25,505,657 Accounts receivable, less allowances of $350,000 and $325,000 in 2000 and 1999 35,614,669 30,633,501 Inventories 12,087,513 9,975,178 Prepaid expenses and other 4,411,118 2,873,276
Total current assets 190,555,850 138,215,584
Plant and Equipment:
Land, buildings and improvements 40,400,929 26,844,317 Machinery and equipment 84,480,366 68,703,998 Construction-in-process 4,816,097 12,676,977
129,697,392 108,225,292 Less-Accumulated depreciation and amortization (47,777,724) (36,887,239)
81,919,668 71,338,053Other Assets:
Long-term investments 153,016,195 125,816,629 Patents and other assets, net 2,636,980 2,302,504
155,653,175 128,119,133 $428,128,693 $337,672,770
LIABILITIES AND SHAREHOLDERS’ INVESTMENT
Current Liabilities:
Accounts payable $ 9,328,155 $ 8,288,327 Accrued liabilities:
Salaries, wages and vacation 1,973,485 1,758,941 Income taxes 1,805,500 1,215,735 Royalties 3,684,822 2,582,522 Other 2,899,290 2,624,686
Total current liabilities 19,691,252 16,470,211
Deferred Income Taxes 6,333,880 4,151,143
Shareholders’ Investment:
Preferred stock, no par value, 5,000,000 shares authorized; none issued or outstanding — — Common stock, par value $.06 per share; 100,000,000 shares authorized 4,457,465 4,404,739 Additional paid-in capital 92,132,617 79,670,301 Retained earnings 303,213,652 232,669,586 Deferred compensation (2,532,327) (2,070,639)Unrealized gain on investments 4,874,928 2,366,637 Cumulative translation adjustment (42,774) 10,792
Total shareholders' investment 402,103,561 317,051,416 $428,128,693 $337,672,770
22
The accompanying notes are an integral part of these consolidated financial statements.

Consolidated Statements of Incomefor the years ended December 31, 2000, 1999, and 1998
23
2000 1999 1998
Net Sales $297,420,802 $262,155,498 $222,292,053
Cost of Goods Sold 172,467,846 148,820,129 131,900,585 Gross profit 124,952,956 113,335,369 90,391,468
Operating Expenses:
Research and development 16,900,659 13,755,318 10,983,514 Selling, general and administrative 17,641,306 14,057,560 12,065,141
Total operating expenses 34,541,965 27,812,878 23,048,655
Operating income 90,410,991 85,522,491 67,342,813
Other Income:
Interest and dividend income 13,358,636 8,459,607 5,890,612 Other, net 753,439 2,233,658 1,429,705
Total other income 14,112,075 10,693,265 7,320,317
Income before provision for income taxes 104,523,066 96,215,756 74,663,130
Provision for Income Taxes 33,979,000 31,352,000 24,356,000
Net Income $ 70,544,066 $ 64,863,756 $ 50,307,130
Earnings per Share:
Basic $ 0.95 $ 0.89 $ 0.70 Diluted $ 0.93 $ 0.86 $ 0.68
The accompanying notes are an integral part of these consolidated financial statements.

Common Stock Common Stock Shares Amount
BALANCE AS OF DECEMBER 31, 1997 35,399,147 $ 2,123,949
Issuance of common stock and the tax benefitof stock plan transactions 1,023,593 61,416Amortization of deferred compensation — —Stock split 35,836,177 2,150,170Comprehensive Income:
Net income — —
Other comprehensive income:Foreign currency translation adjustment — —Unrealized gain on investments — —
Other comprehensive income — —Comprehensive income — —
BALANCE AS OF DECEMBER 31, 1998 72,258,917 4,335,535
Issuance of common stock and the tax benefitof stock plan transactions 1,153,399 69,204Amortization of deferred compensation — —Comprehensive Income:
Net income — —
Other comprehensive income:Foreign currency translation adjustment — —Unrealized gain on investments — —
Other comprehensive income — —Comprehensive income — —
BALANCE AS OF DECEMBER 31, 1999 73,412,316 4,404,739
Issuance of common stock and the tax benefitof stock plan transactions 878,766 52,726Amortization of deferred compensation — —Comprehensive Income:
Net income — —
Other comprehensive income:Foreign currency translation adjustment — —Unrealized gain on investments — —
Other comprehensive income — —Comprehensive income — —
BALANCE AS OF DECEMBER 31, 2000 74,291,082 $ 4,457,465
Consolidated Statements of Shareholders’ Investmentfor the Years Ended December 31, 2000, 1999 and 1998
24
The accompanying notes are an integral part of these consolidated financial statements.

25
AccumulatedOther Total
Additional Comprehensive Retained Deferred Comprehensive Shareholders’Paid-In Capital Income Earnings Compensation Income (Loss) Investment
$ 53,654,663 $ 117,498,700 ($1,635,623) $ 1,563,488 $ 173,205,177
13,371,605 — — (990,218) — 12,442,803— — — 571,731 — 571,731
(2,150,170) — — — — —
— $50,307,130 50,307,130 — — 50,307,130
— 58,177 — — — —— 423,200 — — — —— 481,377 — — 481,377 481,377— $50,788,507 — — — —
64,876,098 167,805,830 (2,054,110) 2,044,865 237,008,218
14,794,203 — — (759,504) — 14,103,903— — — 742,975 — 742,975
— $64,863,756 64,863,756 — — 64,863,756
— (26,505) — — — —— 359,069 — — — —— 332,564 — — 332,564 332,564— $65,196,320 — — — —
79,670,301 232,669,586 (2,070,639) 2,377,429 317,051,416
12,462,316 — (1,269,959) — 11,245,083— — 808,271 — 808,271
— $70,544,066 70,544,066 — — 70,544,066
— (53,566) — — — —— 2,508,291 — — — —— 2,454,725 — — 2,454,725 2,454,725— $72,998,791 — — — —
$ 92,132,617 $ 303,213,652 $(2,532,327) $ 4,832,154 $ 402,103,561

Consolidated Statements of Cash Flowsfor the years ended December 31, 2000, 1999, and 1998
2000 1999 1998
CASH FLOWS FROM OPERATING ACTIVITIES:
Net income $ 70,544,066 $64,863,756 $50,307,130Adjustments to reconcile net income to net cash provided by operating activities -
Depreciation and amortization 11,334,104 9,656,700 7,522,521(Gain) loss on disposal of equipment 5,026 (112,252) 111,218(Gain) loss on sale of investments 624,457 (1,512,109) (937,360)Deferred income taxes 497,162 719,999 456,474Amortization of deferred compensation 808,271 742,975 571,731Change in assets and liabilities:
Accounts receivable, net (4,981,168) (376,706) (5,741,270)Inventories (2,112,335) (1,248,758) 61,269Prepaid expenses and other (1,202,885) (358,346) (463,089)Accounts payable 1,039,828 685,394 (1,157,323)Accrued liabilities 2,181,213 937,927 1,412,989
Net cash provided by operating activities 78,737,739 73,998,580 52,144,290
CASH FLOWS FROM INVESTING ACTIVITIES:
Activity in Held-To-Maturity SecuritiesSales Proceeds 952,230 — —Maturities and Calls 23,160,550 22,755,000 12,366,000Purchases (23,558,062) (8,753,236) (8,333,178)
Activity in Available-For-Sale SecuritiesSales Proceeds 7,023,476 9,431,697 5,028,187Purchases (34,284,618) (69,912,210) (25,597,708)
Plant and equipment additions (21,617,088) (21,968,447) (24,596,224)Proceeds from sale of plant and equipment 51,200 516,184 52,615Increase in other assets (742,899) (971,246) (247,685)
Net cash used for investing activities (49,015,211) (68,902,258) (41,327,993)
CASH FLOWS FROM FINANCING ACTIVITIES:
Issuance of common stock and tax benefit of stock plan transactions 11,245,083 14,103,903 12,442,803
Net cash provided by financing activities 11,245,083 14,103,903 12,442,803
NET INCREASE IN CASH AND CASH EQUIVALENTS 40,967,611 19, 200,225 23,259,100
CASH AND CASH EQUIVALENTS, beginning of year 69,227,972 50,027,747 26,768,647
CASH AND CASH EQUIVALENTS, end of year $110,195,583 $69,227,972 $50,027,747
26
The accompanying notes are an integral part of these consolidated financial statements.

Notes to Consolidated Financial Statements
27
(1) SUMMARY OF SIGNIFICANT ACCOUNTING AND REPORTING POLICIES
The Company. Gentex Corporation designs, develops, manufactures and markets proprietary electro-optical products: auto-matic rearview mirrors for the automotive industry and fire protection products for the commercial building industry.A substantial portion of the Company’s net sales and accounts receivable result from transactions with domestic and foreignautomotive manufacturers and tier one suppliers. The Company’s fire protection products are primarily sold to domestic distributors and original equipment manufacturers of fire and security systems.
Significant accounting policies of the Company not described elsewhere are as follows:
Consolidation. The consolidated financial statements include the accounts of Gentex Corporation and all of its wholly-ownedsubsidiaries (together the“Company”). All significant intercompany accounts and transactions have been eliminated.
Cash Equivalents. Cash equivalents consist of funds invested in money market accounts.
Investments. The amortized cost, unrealized gains and losses, and market value of securities held to maturity and available forsale are shown as of December 31, 2000 and 1999:
2000 Cost Gains Losses Market ValueU.S. Treasuries $ 80,010,620 $1,109,708 $ (5,062) $ 81,115,266
Municipal 21,070,646 51,298 (29,381) 21,092,563
Other Fixed 27,095,719 175,666 (39,377) 27,232,008
Equity 45,586,289 7,130,465 (735,222) 51,981,532
$173,763,274 $8,467,137 $ (809,042) $181,421,369
1999 U.S. Treasuries $ 66,970,652 $ 66,356 $ (483,687) $ 66,553,321 Municipal 32,175,393 73,203 (140,288) 32,108,308Other Fixed 8,540,658 — (80,997) 8,459,661Equity 39,994,603 4,841,445 (783,134) 44,052,914
$147,681,306 $4,981,004 $(1,488,106) $151,174,204
Fixed income securities, excluding U.S. Treasuries, are considered held to maturity and, accordingly, are carried at amortizedcost. Equity securities and U.S. Treasuries are available for sale, which are recorded at market value. Held to maturity securitiesas of December 31, 2000, have contractual maturities as follows:
Due within one year $18,140,332 Due between one and five years $29,736,354
Due over five years $ 289,679
During 2000, the Company sold approximately $947,000 of securities classified as held to maturity for $952,000. The decisionto sell these securities was based on deterioration in the credit worthiness of the issuer.
Inventories. Inventories include material, direct labor and manufacturing overhead and are valued at the lower of first-in, first-out (FIFO) cost or market.Inventories consisted of the following as of December 31, 2000 and 1999:
2000 1999Raw materials $ 7,362,544 $4,910,081Work-in-process 1,488,326 1,194,632Finished goods 3,236,643 3,870,465
$12,087,513 $9,975,178

28
(1) SUMMARY OF SIGNIFICANT ACCOUNTING AND REPORTING POLICIES, continued
Plant and Equipment. Plant and equipment are stated at cost. Depreciation and amortization are computed for financialreporting purposes using the straight-line method, with estimated useful lives of 7 to 40 years for buildings and improvements,and 3 to 10 years for machinery and equipment.
Patents. The Company’s policy is to capitalize costs incurred to obtain and defend patents. The cost of patents is amortizedover their useful lives. The cost of patents in process is not amortized until issuance. Accumulated amortization was approxi-mately $2,095,000 and $4,961,000 at December 31, 2000 and 1999, respectively. In 2000, fully amortized patents, with an original cost of approximately $3,200,000, were written off. Patent amortization expense was approximately $355,000, $71,000,and $211,000 in 2000, 1999, and 1998, respectively.
Revenue Recognition. The Company’s revenue is generated primarily from sales of its products. Sales are recognized whenthe product is shipped and legal title has passed to the customer.
Advertising and Promotional Materials. All advertising and promotional costs are expensed as incurred and amounted toapproximately $932,000, $808,000, and $640,000 in 2000, 1999, and 1998, respectively.
Repairs and Maintenance. Major renewals and improvements of property and equipment are capitalized, and repairs andmaintenance are expensed as incurred. The Company incurred expenses relating to the repair and maintenance of plant andequipment of approximately $3,182,000, $2,535,000, and $2,165,000 in 2000, 1999, and 1998, respectively.
Self-Insurance. The Company is self-insured for a portion of its risk on workers’ compensation and employee medical costs.The arrangements provide for stop loss insurance to manage the Company’s risk. Operations are charged with the cost ofclaims reported and an estimate of claims incurred but not reported.
Earnings Per Share. The following table reconciles the numerators and denominators used in the calculations of basic anddiluted earnings per share (EPS) for each of the last three years:
2000 1999 1998Numerators:
Numerator for both basic and diluted EPS, net income $70,544,066 $64,863,756 $50,307,130
Denominators:Denominator for basic EPS,weighted-average common shares outstanding 73,941,256 72,999,601 71,611,401Potentially dilutive shares resulting from stock option plans 1,576,877 1,996,713 2,005,319Denominator for diluted EPS 75,518,133 74,996,314 73,616,720
For the years ended December 31, 2000, 1999, and 1998, 373,865, 101,897 and 319,723 shares related to stock option plans werenot included in diluted average common shares outstanding because their effect would be antidilutive.

29
(1) SUMMARY OF SIGNIFICANT ACCOUNTING AND REPORTING POLICIES, continued
Other Comprehensive Income. Statement of Financial Accounting Standards No. 130: “Reporting Comprehensive Income”establishes standards for reporting and display of comprehensive income and its components. Comprehensive income reflectsthe change in equity of a business enterprise during a period from transactions and other events and circumstances from non-owner sources. For Gentex, comprehensive income represents net income adjusted for items such as unrealized gains andlosses on certain investments and foreign currency translation adjustments. The changes in the components of other compre-hensive income (loss) are as follows:
Years Ended December 31, 2000 1999 1998Pre-Tax Tax Expense Pre-Tax Tax Expense Pre-Tax TaxAmount (Credit) Amount (Credit) Amount Expense
Unrealized Gainon Securities $3,858,909 $1,350,618 $552,415 $193,346 $651,075 $227,875
Foreign CurrencyTranslation Adjustments (82,409) (28,843) (40,777) (14,272) 89,503 31,326
Other Comprehensive Income $3,776,500 $1,321,775 $511,638 $179,074 $740,578 $259,201
Foreign Currency Translation. The financial position and results of operations of the Company’s foreign subsidiaries are meas-ured using the local currency as the functional currency. Assets and liabilities are translated at the exchange rate in effect atyear-end. Income statement accounts are translated at the average rate of exchange in effect during the year. The resultingtranslation adjustment is recorded as a separate component of shareholders’ investment.
Estimates. The preparation of financial statements in conformity with accounting principles generally accepted in the UnitedStates requires management to make estimates and assumptions that affect the reported amounts of assets and liabilities anddisclosure of contingent assets and liabilities at the date of the financial statements and the reported amounts of revenues andexpenses during the reporting period. Actual results could differ from those estimates.
New Accounting Standards. In June 1998 and June 2000, the Financial Accounting Standards Board issued SFAS No. 133,“Accounting for Derivative Instruments and Hedging Activities,” and SFAS No. 138, “Accounting for Certain DerivativeInstruments and Certain Hedging Activities – an amendment of SFAS No. 133”, respectively, which establish accounting andreporting standards for all derivative instruments and hedging activities. These statements require an entity to recognize allderivatives as either assets or liabilities in the balance sheet and measure those investments at fair value. The Company isrequired to and will adopt these pronouncements in the first quarter of fiscal 2001 and expects adoption to have minimal effecton its consolidated results of operations, financial position and financial disclosures.
As of December 31, 2000, the Company has not entered into any significant derivative or other off-balance-sheet financingarrangements.
(2) LINE OF CREDIT
The Company has available an unsecured $5,000,000 line of credit from a bank at the lower of the bank’s prime rate or 1.5%above the LIBOR rate. No borrowings were outstanding under this line in 2000 or 1999. No compensating balances arerequired under this line.

30
(3) INCOME TAXES
The provision for income taxes is based on the earnings reported in the accompanying consolidated financial statements.The Company recognizes deferred tax liabilities and assets for the expected future tax consequences of events that have beenincluded in the consolidated financial statements or tax returns. Under this method, deferred tax liabilities and assets are deter-mined based on the cumulative temporary differences between the financial statement and tax bases of assets and liabilitiesusing enacted tax rates in effect for the year in which the differences are expected to reverse. Deferred income tax expense ismeasured by the net change in deferred income tax assets and liabilities during the year.
The components of the provision for income taxes are as follows:
2000 1999 1998Currently payable:
Federal $33,417,000 $30,173,000 $23,900,000State 65,000 459,000 — Total 33,482,000 30,632,000 23,900,000
Net deferred:Federal 497,000 720,000 456,000
Provision for income taxes $33,979,000 $31,352,000 $24,356,000
The currently payable provision is further reduced by the tax benefits associated with the exercise, vesting or disposition ofstock under the stock plans described in Note 6. These reductions totaled approximately $4,878,000, $6,415,000, and$4,227,000, in 2000, 1999, and 1998, respectively.
The effective income tax rates are different from the statutory federal income tax rates for the following reasons:
2000 1999 1998Statutory federal income tax rate 35.0% 35.0% 35.0%State income taxes, net of federal income tax benefit 0.1 0.2 —Foreign Sales Corporation exempted income (2.0) (1.5) (1.3)Tax-exempt investment income (0.4) (0.6) (0.8)Other (0.2) (0.5) (0.3)Effective income tax rate 32.5% 32.6% 32.6%
The tax effect of temporary differences which give rise to deferred tax assets and liabilities at December 31, 2000 and 1999,are as follows:
2000 1999Current Non-Current Current Non-Current
Assets:
Accruals not currently deductible $ 969,589 $ 262,203 $ 762,951 $ 249,603Deferred compensation — 635,326 — 587,122Other 1,109,233 11,880 1,002,721 23,355Total deferred tax assets 2,078,822 909,409 1,765,672 860,080

31
(3) INCOME TAXES, continued
2000 1999Current Non-Current Current Non-Current
Liabilities:
Excess tax over book depreciation — (4,257,983) — (3,395,195)Patent costs — (360,345) — (341,685)Unrealized gain/loss on investments — (2,624,961) — (1,274,343) Other (193,242) — (215,049) — Net deferred taxes $1,885,580 $(6,333,880) $1,550,623 $(4,151,143)
Income taxes paid in cash were approximately $28,302,000, $26,530,000, and $18,815,000 in 2000, 1999, and 1998, respectively.
(4) EMPLOYEE BENEFIT PLAN
The Company has a 401(k) retirement savings plan in which substantially all of its employees may participate. The planincludes a provision for the Company to match a percentage of the employee’s contributions at a rate determined by theCompany’s Board of Directors. In 2000, 1999, and 1998, the Company’s contributions were approximately $620,000, $526,000,and $378,000, respectively.
The Company does not provide health care benefits to retired employees.
(5) SHAREHOLDER PROTECTION RIGHTS PLAN
In August 1991, the Company’s Board of Directors adopted a Shareholder Protection Rights Plan (the Plan). The Plan isdesigned to protect shareholders against unsolicited attempts to acquire control of the Company in a manner that does notoffer a fair price to all shareholders.
Under the Plan, one purchase Right automatically trades with each share of the Company’s common stock. Each Right enti-tles a shareholder to purchase 1/100 of a share of junior participating preferred stock at a price of $40, if any person or groupattempts certain hostile takeover tactics toward the Company. Under certain hostile takeover circumstances, each Right mayentitle the holder to purchase the Company’s common stock at one-half its market value or to purchase the securities of anyacquiring entity at one-half their market value. Rights are subject to redemption by the Company at $.00125 per Right and,unless earlier redeemed, will expire on August 26, 2001. Rights beneficially owned by holders of 15 percent or more of theCompany’s common stock, or their transferees, automatically become void.
(6) STOCK-BASED COMPENSATION PLANS
The Company has three stock option plans, including two employee stock option plans (“Employee Plans”) and a non-employee directors stock option plan (“Director Plan”), and an employee stock purchase plan. The Company accounts for these plans in accordance with APB Opinion No. 25, as amended by FIN44,“Accounting for Certain Transactions InvolvingStock Compensation,”under which no compensation cost has been recognized. Had compensation cost for these plans beendetermined consistent with FASB Statement No. 123, the Company’s net income and earnings per share would have beenreduced to the following pro-forma amounts:

32
(6) STOCK-BASED COMPENSATION PLANS, continued
2000 1999 1998Net Income: As Reported $70,544,066 $64,863,756 $50,307,130
Pro Forma 64,500,375 60,394,893 46,098,379
EPS (diluted): As Reported $ 0.93 $ 0.86 $ 0.68 Pro Forma 0.85 0.81 0.63
Because the Statement 123 method of accounting has not been applied to options granted prior to January 1, 1995, the result-ing pro forma compensation cost may not be representative of that to be expected in future years.
The Company may sell up to 1,600,000 shares of stock to its employees under the Employee Stock Purchase Plan. TheCompany has sold to employees 47,023 shares, 50,550 shares, and 61,748 shares in 2000, 1999, and 1998, respectively, and hassold a total of 471,715 shares through December 31, 2000. The Company sells shares at 85% of the stock’s market price at dateof purchase. The weighted average fair value of shares sold in 2000 was approximately $22.
The Company may grant options for up to 9,000,000 shares under the Employee Plans. The Company has granted options on5,470,900 shares through December 31, 2000. Under the Plans, the option exercise price equals the stock’s market price on dateof grant. The options vest after one to five years, and expire after five to seven years.
A summary of the status of the Company’s employee stock option plans at December 31, 2000, 1999, and 1998, and changesduring the years then ended is presented in the table and narrative below:
2000 1999 1998Shares Wtd. Avg. Shares Wtd. Avg. Shares Wtd. Avg.(000) Ex. price (000) Ex. price (000) Ex. price
Outstanding at Beginning of Year 3,807 $13 4,145 $10 4,706 $ 7Granted 887 27 774 25 761 17Exercised (753) 7 (1,055) 6 (1,267) 6Forfeited (40) 20 (57) 13 (55) 10Expired — — — — — — Outstanding at End of Year 3,901 18 3,807 13 4,145 10Exercisable at End of Year 1,736 12 1,660 9 1,782 7Weighted Average Fair Valueof Options Granted $13 $12 $ 8
Options Outstanding and Exercisable by Price Range As of December 31, 2000
Options Outstanding Options Exercisable
Range of Shares Remaining Weighted-Avg. Shares Weighted-Avg.Exercise Prices Outstanding (000) Contractual Life Exercise Price Exercisable (000) Exercise Price
$ 1 - $10 810 1 $ 8 728 $ 8 $11 - $20 1,669 3 15 851 13$21 - $37 1,422 5 27 157 25
Total 3,901 3 18 1,736 12
33
(6) STOCK-BASED COMPENSATION PLANS, continued
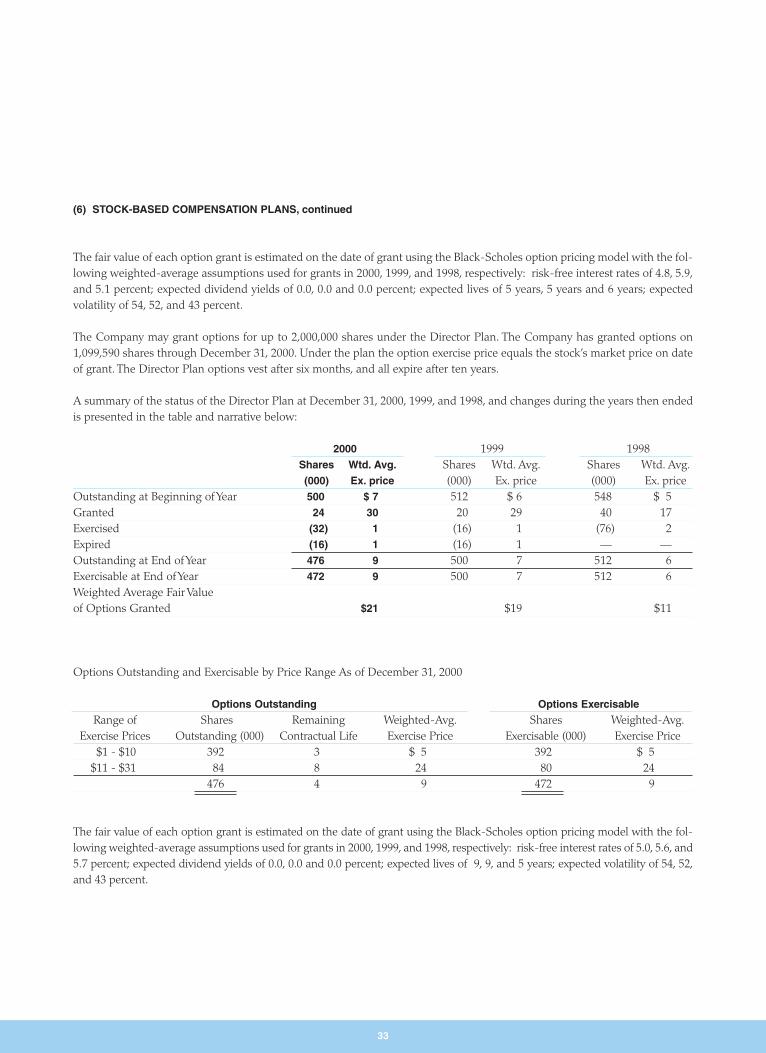
The fair value of each option grant is estimated on the date of grant using the Black-Scholes option pricing model with the fol-lowing weighted-average assumptions used for grants in 2000, 1999, and 1998, respectively: risk-free interest rates of 4.8, 5.9,and 5.1 percent; expected dividend yields of 0.0, 0.0 and 0.0 percent; expected lives of 5 years, 5 years and 6 years; expectedvolatility of 54, 52, and 43 percent.
The Company may grant options for up to 2,000,000 shares under the Director Plan. The Company has granted options on1,099,590 shares through December 31, 2000. Under the plan the option exercise price equals the stock’s market price on dateof grant. The Director Plan options vest after six months, and all expire after ten years.
A summary of the status of the Director Plan at December 31, 2000, 1999, and 1998, and changes during the years then endedis presented in the table and narrative below:
2000 1999 1998Shares Wtd. Avg. Shares Wtd. Avg. Shares Wtd. Avg.(000) Ex. price (000) Ex. price (000) Ex. price
Outstanding at Beginning of Year 500 $ 7 512 $ 6 548 $ 5Granted 24 30 20 29 40 17Exercised (32) 1 (16) 1 (76) 2Expired (16) 1 (16) 1 — —Outstanding at End of Year 476 9 500 7 512 6Exercisable at End of Year 472 9 500 7 512 6Weighted Average Fair Valueof Options Granted $21 $19 $11
Options Outstanding and Exercisable by Price Range As of December 31, 2000
Options Outstanding Options Exercisable
Range of Shares Remaining Weighted-Avg. Shares Weighted-Avg.Exercise Prices Outstanding (000) Contractual Life Exercise Price Exercisable (000) Exercise Price
$1 - $10 392 3 $ 5 392 $ 5$11 - $31 84 8 24 80 24
476 4 9 472 9
The fair value of each option grant is estimated on the date of grant using the Black-Scholes option pricing model with the fol-lowing weighted-average assumptions used for grants in 2000, 1999, and 1998, respectively: risk-free interest rates of 5.0, 5.6, and5.7 percent; expected dividend yields of 0.0, 0.0 and 0.0 percent; expected lives of 9, 9, and 5 years; expected volatility of 54, 52,and 43 percent.

34
(6) STOCK-BASED COMPENSATION PLANS, continued
The Company has a restricted stock plan covering 1,600,000 shares of common stock, the purpose of which is to permit grants ofshares, subject to restrictions, to key employees of the Company as a means of retaining and rewarding them for long-term performance and to increase their ownership in the Company. Shares awarded under the plan entitle the shareholder to all rightsof common stock ownership except that the shares may not be sold, transferred, pledged, exchanged or otherwise disposed ofduring the restriction period. The restriction period is determined by a committee, appointed by the Board of Directors, but maynot exceed ten years. During 2000, 1999, and 1998, 47,800, 31,600, and 64,200 shares, respectively, were granted with restrictionperiods of four to six years at market prices ranging from $18.75 to $37.625 in 2000, $20.72 to $33.063 in 1999, and $14.032 to$19.813 in 1998.The related expense is reflected as a deferred compensation component of shareholders’investment in the accom-panying consolidated financial statements and is being amortized over the applicable restriction periods.
(7) STOCK SPLITS
On May 21, 1998, the Company’s Board of Directors declared a two-for-one stock split effected in the form of a 100% commonstock dividend to shareholders of record on June 5, 1998. The stock split increased the number of shares of common stock thenoutstanding from 35,836,177 to 71,672,354.
Earnings per share and all share data have been restated in all periods prior to the date of the split.
(8) CONTINGENCIES
From time to time, the Company is subject to legal proceedings and claims which arise in the ordinary course of its business. Inthe opinion of management, the amount of ultimate liability with respect to these actions will not materially affect the financialposition or results of operations of the Company.
(9) SEGMENT REPORTING
Statement of Financial Accounting Standards No. 131: “Disclosures About Segments of an Enterprise and Related Information”(SFAS No. 131) requires that a public enterprise report financial and descriptive information about its reportable operating seg-ments subject to certain aggregation criteria and quantitative thresholds. Operating segments are defined by SFAS No. 131 ascomponents of an enterprise about which separate financial information is available that is evaluated regularly by the chief oper-ating decision-makers in deciding how to allocate resources and in assessing performance.

35
(9) SEGMENT REPORTING, continued
2000 1999 1998Revenue:
Automotive ProductsU.S. $154,972,098 $151,222,877 $127,588,319Germany 60,754,241 47,870,761 46,009,639Other 60,127,795 41,979,787 28,518,734
Fire Protection Products 21,566,668 21,082,073 20,175,361Total $297,420,802 $262,155,498 $222,292,053
Operating Income:
Automotive Products $ 86,218,950 $ 81,757,998 $ 63,718,817Fire Protection Products 4,192,041 3,764,493 3,623,996Total $ 90,410,991 $ 85,522,491 $ 67,342,813
Assets:
Automotive Products $119,720,400 $101,257,610 $ 89,252,971Fire Protection Products 4,396,643 4,353,082 3,864,138Other 304,011,650 232,062,078 161,772,449Total $428,128,693 $337,672,770 $254,889,558
Depreciation & Amortization:
Automotive Products $ 10,349,325 $ 8,645,455 $ 6,658,551Fire Protection Products 315,018 323,477 314,522Other 669,761 687,768 549,448Total $ 11,334,104 $ 9,656,700 $ 7,522,521
Capital Expenditures:
Automotive Products $ 21,084,629 $ 19,279,715 $ 19,595,844Fire Protection Products 192,222 322,962 209,867Other 340,237 2,365,770 4,790,513Total $ 21,617,088 $ 21,968,447 $ 24,596,224
Other assets are principally cash, investments, deferred income taxes, and corporate fixed assets.
Automotive Products revenues in the “Other” category are sales to U.S. automotive manufacturing plants in Canada, Mexico and other foreign automotive customers, primarily located in Japan. All non-U.S. sales are invoiced and paid in U.S. dollars.
During the years presented, the Company had three automotive customers which individually accounted for 10% or more of netsales as follows:
*Less than 10%
Customer #1 #2 #32000 40% 20% *1999 44% 22% 11%1998 43% 25% 11%

36
Report of Independent Auditors
To the Board of Directors and Shareholders of Gentex Corporation:
We have audited the accompanying consolidated balance sheets of GENTEX CORPORATION (a Michigan corporation) andsubsidiaries as of December 31, 2000 and 1999, and the related consolidated statements of income, shareholders’ investmentand cash flows for the years ended. These financial statements are the responsibility of the Company’s management. Ourresponsibility is to express an opinion on these financial statements based on our audits. The financial statements of GentexCorporation and subsidiaries for the year ended December 31, 1998, were audited by other auditors whose report datedJanuary 21, 1999, expressed an unqualified opinion on those statements.
We conducted our audits in accordance with auditing standards generally accepted in the United States. Those standardsrequire that we plan and perform the audit to obtain reasonable assurance about whether the financial statements are free of material misstatement. An audit includes examining, on a test basis, evidence supporting the amounts and disclosures in thefinancial statements. An audit also includes assessing the accounting principles used and significant estimates made by management, as well as evaluating the overall financial statement presentation. We believe that our audits provide a reason-able basis for our opinion.
In our opinion, the financial statements referred to above present fairly, in all material respects, the consolidated financial position of Gentex Corporation and subsidiaries at December 31, 2000 and 1999, and the consolidated results of their operations and their cash flows for the years ended in conformity with accounting principles generally accepted in the United States.
Grand Rapids, MichiganJanuary 18, 2001

Stock Performance Summary
37
1995 1996 1997 1998 1999 2000
0
100
200
300
400
500
600
$700
The following graph depicts the cumulative total return of the Company’s common stock compared to the cumulative totalreturn on The Nasdaq Stock Market® Index (all U.S. companies) and the Dow Jones Index for Automobile Parts and EquipmentCompanies (excluding tire and rubber makers). The graph assumes an investment of $100 on the last trading day in 1995, andreinvestment of dividends in all cases.
Gentex Corporation
The Nasdaq Stock Market® (U.S. Companies)
Dow Jones Auto Parts & Equipment Companies (Excluding Tire and Rubber Makers)

15-Year Summary of Financial Data
38
Summary of Operations For The Year 2000 1999 1998 1997 1996
Net Sales $297,421 $262,155 $222,292 $186,328 $148,708Cost of goods sold 172,468 148,820 131,901 118,941 93,583Gross profit 124,953 113,335 90,391 67,387 55,125Gross profit margin 42.0% 43.2% 40.7% 36.2% 37.1%Research and development expenses 16,901 13,755 10,984 9,079 7,538Selling, general & administrative expenses 17,641 14,058 12,065 10,825 15,7481
Operating income 90,411 85,522 67,343 47,482 31,840Percent of net sales 30.4% 32.6% 30.3% 25.5% 21.4%
Interest expense — — — — —Interest and other income 14,112 10,693 7,320 4,707 3,642Income before taxes 104,523 96,216 74,663 52,189 35,482
Percent of net sales 35.1% 36.7% 33.6% 28.0% 23.9%Income taxes 33,979 31,352 24,356 16,959 11,519
Tax rate 32.5% 32.6% 32.6% 32.5% 32.5%Net income 70,544 64,864 50,307 35,230 23,9633
Percent of net sales 23.7% 24.7% 22.6% 18.9% 16.1%Return on average equity 19.6% 23.4% 24.5% 23.4% 21.5%3
Earnings per share – diluted $ 0.93 $ 0.86 $ 0.68 $ 0.49 0.343
Price/earnings ratio range 43-17 41-19 32-16 28-17 40-16Weighted average common shares outstanding – diluted 75,518 74,996 73,617 71,962 71,025Capital expenditures 21,617 21,968 24,596 16,383 16,424
Financial Position At Year-End
Cash and short-term investments $138,443 $ 94,734 $ 74,063 $ 41,131 $ 48,534Long-term investments 153,016 125,817 78,744 70,291 33,945Total current assets 190,556 138,216 115,357 75,919 72,696Total current liabilities 19,691 16,470 14,847 14,591 11,361Working capital 170,865 121,746 100,510 61,328 61,335Plant and equipment – net 81,920 71,338 59,360 42,239 31,575Total assets 428,129 337,673 254,890 189,783 140,378Long-term debt, including current maturities — — — — —Shareholders’ investment 402,104 317,051 237,008 173,205 127,804Debt/equity ratio (including current maturities) — — — — —Common shares outstanding 74,291 73,412 72,259 70,798 69,499Book value per share $ 5.41 $ 4.32 $ 3.28 $ 2.45 $ 1.84
In thousands, except Gross profit margin, Percent of net sales on Income and Net Income, Tax rate, Return on average equity, Per share data, Price/earnings ratio and Debt/Equityratio. All per share data has been adjusted to reflect the two-for-one stock splits effected in the form of 100 percent common stock dividends issued to shareholders in June 1993,June 1996 and June 1998.

39
1995 1994 1993 1992 1991 1990 1989 1988 1987 1986
$111,566 $89,762 $63,664 $45,106 $26,893 $21,203 $23,759 $14,737 $13,795 $12,833 67,767 51,319 38,452 28,949 18,080 14,535 16,115 9,983 8,957 7,98943,799 38,443 25,212 16,157 8,813 6,668 7,644 4,754 4,838 4,844
39.3% 42.8% 39.6% 35.8% 32.8% 31.4% 32.2% 32.3% 35.1% 37.7%5,958 4,904 4,176 3,840 2,308 1,702 1,375 692 698 833
12,879 10,567 7,182 5,458 4,628 4,450 3,569 3,087 2,303 2,8611
24,962 22,972 13,854 6,860 1,876 516 2,700 975 1,837 1,14922.4% 25.6% 21.8% 15.2% 7.0% 2.4% 11.4% 6.6% 13.3% 9.0%
— — 8 173 511 499 224 — 21 232,969 1,698 900 874 1,295 1,165 592 73 117 84
27,931 24,670 14,746 7,561 2,660 1,183 3,069 1,048 1,933 1,21025.0% 27.5% 23.2% 16.8% 9.9% 5.6% 12.9% 7.1% 14.0% 9.4%
9,036 8,204 4,901 2,495 794 65 979 366 780 21032.4% 33.3% 33.2% 33.0% 29.8% 5.5% 31.9% 34.9% 40.4% 17.4%
18,895 16,466 9,845 5,066 1,6542 1,118 2,090 682 1,153 1,00016.9% 18.3% 15.5% 11.2% 6.1% 5.3% 8.8% 4.6% 8.4% 7.8%22.7% 27.2% 23.2% 15.9% 6.1% 4.5% 12.2% 9.1% 17.8% 19.6%
$ 0.28 $ 0.24 $ 0.15 $ 0.08 $ 0.03 $ 0.02 $ 0.04 $ 0.01 $ 0.02 $ 0.02 25-14 36-19 60-17 41-21 64-23 95-34 47-15 43-29 32-12 31-17
68,511 67,975 66,975 64,382 62,133 61,167 54,091 47,324 46,935 46,3244,862 6,160 3,393 4,192 2,218 2,401 4,106 2,824 808 714
$ 34,277 $19,331 $13,307 $ 7,751 $14,294 $10,914 $14,138 $ 542 $ 2,102 $ 1,02232,146 26,282 13,612 6,981 4,330 6,060 1,090 — — —68,611 36,685 27,067 17,812 20,763 15,643 20,117 5,750 6,335 5,08314,050 8,986 5,530 4,044 8,636 1,685 1,854 2,178 1,431 1,02442,011 27,699 21,537 13,768 12,127 13,958 18,263 3,572 4,904 4,05918,942 17,173 13,699 12,504 10,125 9,350 8,003 4,774 2,500 2,062
109,244 80,739 55,191 40,256 37,231 33,877 35,529 10,720 9,012 7,249— — — — 6,095 6,114 6,131 378 269 303
94,672 71,375 49,547 35,450 28,195 25,940 24,249 7,908 7,088 5,787— — — — 22 24 25 5 4 5
67,583 66,038 64,847 63,509 62,129 61,112 60,364 47,523 47,087 46,379$ 1.40 $ 1.08 $ 0.76 $ 0.56 $ 0.45 $ 0.42 $ 0.40 $ 0.17 $ 0.15 $ 0.12
0
100
200
300
400
$500
1996 1997 1998 1999 2000
Total Assets (in millions)
0
1
2
3
4
5
$6
1996 1997 1998 1999 2000
Book Value Per Share
0
100
200
300
400
$500
1996 1997 1998 1999 2000
Shareholders’ Investment (in millions)
1 Includes litigation settlements of $4,000,000 in 1996 and $446,000 in 1986.2 Includes a non-recurring, extraordinary, after-tax charge of $221,000, or one cent per share, due to the costs associated with the mandatory redemption of $6 million in Industrial
Development Revenue Bonds.3 Excluding the patent litigation settlement, net income would have been $26,643,000; earnings per share would have been $0.38; and ROE would have been 24.0%.

Corporate Data
Corporate Headquarters
Gentex Corporation600 N. Centennial StreetZeeland, Michigan 49464616-772-1800
Analyst/Investor Contact
Connie HamblinCorporate SecretaryGentex Corporation600 N. Centennial StreetZeeland, Michigan 49464616-772-1800
Legal Counsel
Varnum Riddering, Schmidtand Howlett LLPBridgewater Place333 Bridge Street, N.W.Grand Rapids, Michigan 49503
Auditors
Ernst & Young LLP171 Monroe Avenue, N.W.Suite 1000Grand Rapids, Michigan 49503
Form 10-K
The Company’s Annual Report filed with the Securities ExchangeCommission on Form 10-K will beprovided without charge to anyshareholder upon written request.It is also available electronicallythrough the Company’s Web site at http://www.gentex.com
40
Gentex Common Stock
The Company’s common stocktrades on The Nasdaq StockMarket® under the symbol GNTX.The common stock has traded over the counter since December1981. As of March 1, 2001, theCompany’s 74,360,238 shares ofcommon stock were owned by2,608 recordholders.
The Company does not have adirect stock purchase plan. Sharesof the Company’s common stockmust be purchased through a stock broker or other registeredsecurities representative.
Inquiries or address changes related to stock certificates should bedirected to American Stock Transfer& Trust Company at the addressbelow.
Transfer Agent
American Stock Transfer& Trust Company40 Wall StreetNew York, New York 10005
Annual Meeting
The Annual Meeting ofShareholders of Gentex Corpor-ation will be held at 4:30 p.m.EDST, Wednesday, May 16, 2001,at the Amway Grand Plaza Hotel,Pantlind Ballroom, Pearl at MonroeGrand Rapids, Michigan
Gentex Market Makers
As of March 1, 2001A.G. Edwards & Sons, Inc.AM Capital, LLCArchipelago, LLCBank of America SecuritiesBear, Stearns & Company, Inc.B-Trade Services, LLCCantor, Fitzgerald & CompanyCredit Suisse First Boston CorporationFidelity Capital MarketsFirst of Michigan CorporationFirst Union Capital MarketsFleet Trading/Div. Fleet SecuritiesGerald Klauer Mattison & CompanyHerzog, Heine, Geduld, Inc.ING Barings Furman Selz, LLCInstinet CorporationIsland System CorporationJ.J.B. Hilliard, W.L. LyonsJ.P. Morgan Chase & CompanyJefferies & Company, Inc.Knight Securities, L.P.Ladenburg, Thalmann & CompanyMcDonald & Company Securities, Inc.Midwest Research First TennesseeMidwest Stock ExchangeNatcity Investments, Inc.Olde Discount CorporationPershing Trading CompanyPrudential Securities, Inc.Raymond, James & AssociatesREDIBook ECN, LLCRobert W. Baird & Company, Inc.Salomon Smith Barney, Inc.Schwab Capital MarketsSherwood Securities CorporationSpear, Leeds & KelloggThe Brass Utility, LLCThe Robinson Humphrey CompanyWeeden and Company, Inc.William Blair & Company

Directors and Officers
Directors
Fred Bauer, 58Chairman of the Board &Chief Executive Officer,Gentex CorporationZeeland, Michigan
Mickey Fouts, 69Chairman of the BoardEquity Services Company(investment services)Castle Rock, Colorado
Kenneth La Grand, 60Executive Vice President,Gentex CorporationZeeland, Michigan
Arlyn Lanting, 60Vice President, FinanceAspen Enterprises, Ltd.(real estate investments)Grand Rapids, Michigan
John Mulder, 64Vice President Customer Relations Gentex CorporationLivonia, Michigan
Frederick Sotok, 66Retired Executive Vice Presidentand Chief Operating OfficerPrince Corporation (manufac-turer of automotive interiorparts that was acquired byJohnson Controls, Inc. in 1996)Holland, Michigan
Ted Thompson, 71Chairman of the BoardX-Rite Incorporated (manufacturer of light andcolor-measuring instruments)Grandville, Michigan
Leo Weber, 71Retired PresidentRobert Bosch Corporation(manufacturer of sophisticatedautomotive components)Farmington Hills, Michigan
Officers
Fred Bauer, 58Chairman of the Board &Chief Executive Officer
Kenneth La Grand, 60Executive Vice President
Jim Hollars, 56Senior Vice President,International
Dennis Alexejun, 49Vice President,North American Automotive Marketing
John Carter, 53Vice President,Engineering/Mechanical
Garth Deur, 44Vice President, BusinessDevelopment and Planning
Scott Edwards, 47Vice President,Fire Protection Products
Enoch Jen, 49Vice President, Financeand Treasurer
John Mulder, 64Vice PresidentCustomer Relations
Connie Hamblin, 39Corporate Secretaryand Director, CorporateCommunications
Board of Directors (shown left to right)
Kenneth La Grand, Frederick Sotok, Mickey Fouts, Fred Bauer, Arlyn Lanting, Ted Thompson, John Mulder, Leo Weber

600 N. Centennial St. • Zeeland, Michigan 49464 • Phone: 616-772-1800 • Fax: 616-772-7348 • Website: www.gentex.com©Gentex Corporation 2001 • Printed in USA