GENSETS Y1Annual 1216 - ARPA-E · Outline ‣ Technology*to*Market ‣ Markets ‣...
38
Technology to Market GENSETS GENerators for Small Electrical and Thermal Systems Program Review Meeting – December 1415, 2016 Denver, CO John R Tuttle, Ph.D. Senior Commercialization Advisor
Transcript of GENSETS Y1Annual 1216 - ARPA-E · Outline ‣ Technology*to*Market ‣ Markets ‣...

Technology to Market GENSETS
GENerators for Small Electrical and Thermal Systems
Program Review Meeting – December 14-15, 2016Denver, CO
John R Tuttle, Ph.D.Senior Commercialization Advisor

Outline‣ Technology to Market‣ Markets‣ GENSETS Techno-‐economic Analysis
1Insert Presentation NameDecember 21, 2016

Technology to Market
2A. Luce, Techno Economic AnalysisAugust 4, 2014

The Genesis of GENSETS‣ High-level thoughts
– Has the potential to make significant Carbon impact– Potentially easy integration into existing residential HVAC hardware– Heat will initially be important to value (to bring down cost of electricity), but a cheap enough 1-kW generator could penetrate other markets
– If low cost enough, could be used to balance solar PV instead of storage– Hindered by perception – combustion BAD, non-combustion GOOD– Market push based on higher cost, technology risk and the need for HVAC supply-chain integration, BUT lower risk than fuel cells…• Long history of R&D on combustion technologies -> lower NRE• Manufacturing is a lower risk -> high yields• Long lifetime (>40,000 hrs) for reasonable cost could be difficult -> high OPEX• Does not benefit from policy or GREEN attributes to assist PUSH
– Of all the program metrics, 5-10 yrs lifetime for ≤ $3000 would be the game-changer– Efficiency gains, when scaled to larger sizes, could be disruptive
3Insert Presentation Name

Technology-to-Market – Year 1‣ Techno-economic Analysis
– Year 1 – focus on differential elements of technology innovation• Project-specific device innovations (materials, designs, BoP)• Cost-performance trades
– Year 2• Higher fidelity version of Y1• Full generator-level cost-performance trades.
4Insert Presentation NameDecember 21, 2016

Technology-to-Market – Year 1‣ Techno-economic analysis – more on this later‣ Technology to Market Plan
– v0.0 – Initial take on value proposition -> wide variation in style / quality– v1.0 –
• Should incorporate 1st-yr’s learning (technical, market, TEA)• Should be more narrative / less “Q&A” style
‣ Pitch Plan– Should be in Presentation format from the start– Year 1 –
• Who are your potential partners going forward?• Good value proposition, TEA, performance data and technical roadmap
– Year 2 –• Targeted follow-on funding sources• Presentation materials that enable conversations in the “weeds” and at higher levels for less- to non-technical audiences
5Insert Presentation NameDecember 21, 2016

Innovation Summit‣ The Innovation Summit is NOT a technical conference – it is an opportunity to MARKET your innovations and team to the broader energy community– 1/3 technology : 1/3 value proposition : 1/3 opportunity– Prepare a 3-minute elevator pitch
• Start at highest elevation (e.g. - µ-CHP impact & opportunity)• Short description of technology innovation and how it will differentiate your product
• Where you are at and where you are going – what’s your commercialization plan
– Bring demos and/or AV adjuncts– Have a handout – one side is your company, the other side is GENSETS
6Insert Presentation NameDecember 21, 2016

Markets
7A. Luce, Techno Economic AnalysisAugust 4, 2014

High-Level Market Thoughts‣ Markets
– Market summary• US market non-existent• Japan is leader due to policy
– Behind the Meter (BtM) opportunity• Solar PV has facilitated Utility acceptance (?) of BtM• BtM generation, with associated controls of other Gen & storage, could side-step the utility relationship
• Res / Comm. customers may make non-economically driven decisions– Military and mobile power are opportunities that will not require full set of performance metrics (cost for consumer / durability for military)
8Insert Presentation Name
70%(220,000)
16%(51,000)
14%(45,000)
0%(600)
Cumulative5Sales5of5µ;CHP5Worldwide
Japan Europe ROW US

Fuel Cell based µ-CHP (PEM)
9
http://www.microchap.info/sofc.htm
Japan / Europe
Germany / UK Germany UK

Fuel Cell based µ-CHP (SOFC)
10
DE / CH DE / UK / NL DEUK

Combustion µ-CHP (Rankine)
11

Combustion µ-CHP (Stirling)
12

Combustion µ-CHP (ICE)
13

Customers
The Micro-CHP Ecosystem
14
Component manufacturer
mCHP unit manufacturer
mCHPdistributor/ marketer
Independent installer
After sales services
Possible sale of electricity to grid
Fuel Supplier
Pipes, filters, chassis
Valves, coolant
Exhaust collector, burners
Engine
CHP technology
Assembly
Residential
Commercial
Repair
Maintenance
Source: Micro Combined Heat & Power (Micro CHP) Market by Type (Engine, Fuel Cell), Technology (Internal Combustion Engine, Rankine Cycle Engine, Stirling Engine, PEMFC, SOFC), Application (Residential, Commercial), & Region - Global Forecast to 2020. A report by Markets and Markets
HVAC
DER (Electric)

Who will be the Market Makers for µ-CHP?‣ HVAC
– Traditional HVAC companies are highly competent in and familiar with HVAC technology, customer, supply chain, etc.• Existing sales & service infrastructure ideal for market entry
– How will they consider the risk of behind the meter (BtM), electrical generation that requires a relationship with the Utility?• HVAC companies - generally conservative – may not be looking to take any technology risk
‣ DER Electrical– New entrants in BtM (Solar City/Tesla) for the Res/Comm market may be better suited to consider µ-CHP as part of a suite of products
– More innovative on financing options
‣ Utilities– May want to participate in BtM – regionally dependent
-> As CHP systems get larger and address front-of-the-meter opportunities, this differentiation becomes more important
15

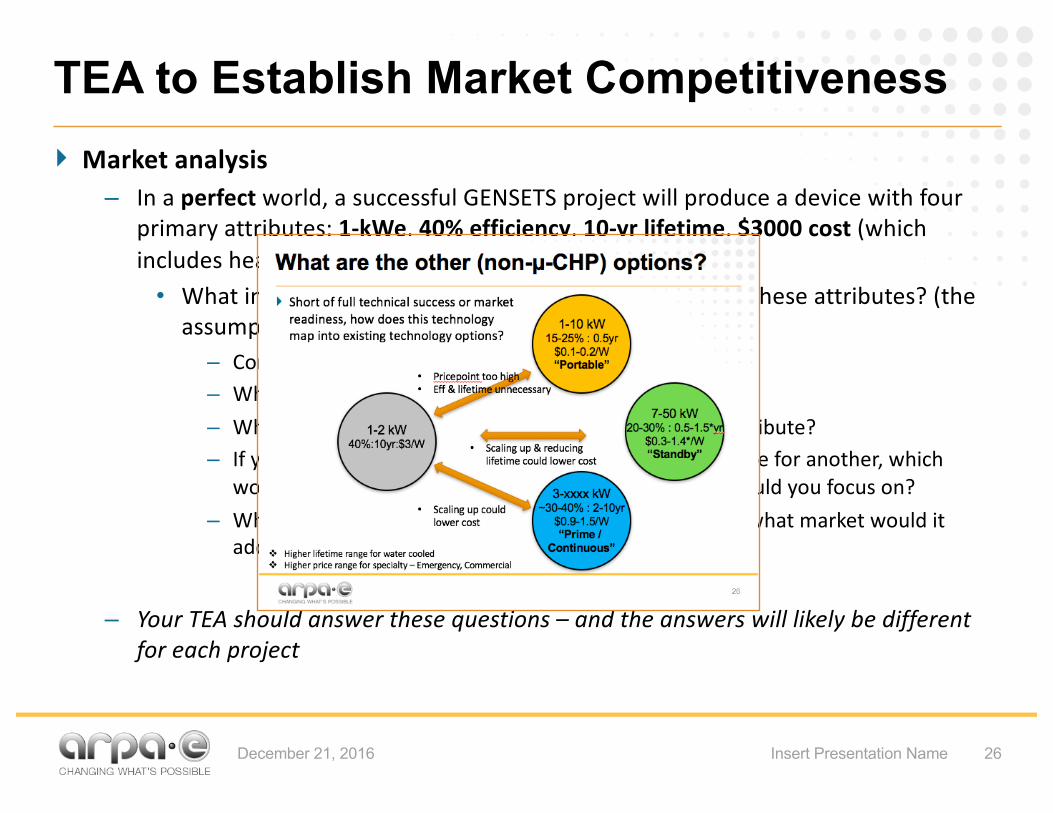
What are the other (non-µ-CHP) options?
16
1-10 kW15-25% : 0.5yr$0.1-0.2/W“Portable”
1-2 kW40%:10yr:$3/W
7-50 kW20-30% : 0.5-1.5*yr
$0.3-1.4*/W“Standby”
3-xxxx kW~30-40% : 2-10yr$0.9-1.5/W“Prime /
Continuous”
‣ Short of full technical success or market readiness, how does this technology map into existing technology options?
• Pricepoint too high• Eff & lifetime unnecessary
• Scaling up & reducing lifetime could lower cost
v Higher lifetime range for water cooledv Higher price range for specialty – Emergency, Commercial
• Scaling up could lower cost
Techno-Economic Analysis
17A. Luce, Techno Economic AnalysisAugust 4, 2014

Metals Processing
Fuels Li-Ion Battery
Solar Cell LCD Display
One Size does not fit allIs your product driven by processing costs or materials costs?
BOM
Utilities
Sources: 1) METALS calculator tool; 2) REMOTE calculator tool; 3) Argonne National Lab; 4) MIT PV Cost Calculator; 5) Display Search Intl.
100%
BOM = Bill of Materials;; Utilities= water, gas, electricity;; Other= everything else incl: processing, labor, equipment, etc..
Other
Process-Driven
Device-Driven
eg. power, chemical industries
eg. widget production, fully-optimized manufacturing
Cost breakdown mix determines TEA development
18

Where to begin
19Insert Presentation NameDecember 21, 2016
Component Level
Device Level
Subsystem Level
Full System Level
Graphics – ITC/Qnergy

Supply Chain for GENSETS Projects
• Where do GENSETS teams focus?• Where are the gaps for implementation?
CHP unitComponent BOP/ Installation
Utility interface/controls
SystemsIntegration
GAP
• Integration with storage tank
• Integration with space heater?
• Radiator for heat rejection
• Heat to cooling?• ……
• Smart-meters• Sensors and
controls for grid integration
• Islanding and blackstarting
• Storage?• Safeties• ……
• Fully-automated system
$3,000 $3,000 + $ $3,000 + $$ $3,000 + $$

GENSETS TEA‣ What might a TEA look like for this Program
– Examine the value proposition of µ-‐CHP for the residential / commercial market• Valuable to do in parallel with device-‐level TEA
– Examine the value proposition of your technology relative to other µ-‐CHP for the residential / commercial market• This requires a full system analysis (including balance-‐of-‐plant) – your device TEA would be an important component of this
– Examine the value proposition of your generator + heat-‐capture device relative to either an internal baseline or other generator devices• This is the level at which we initially want to conduct the analysis!• This analysis can then be used either up the value chain in the CHP market, or in the generator / DER (distributed energy resource) market.
There is no “Right” answer and it is equally about the process as about the product of the analysis!
21Insert Presentation NameDecember 21, 2016

Market Level TEA (Metis Design)
22Insert Presentation NameDecember 21, 2016

Market Level TEA
23Insert Presentation NameDecember 21, 2016

!$500%
$500%
$1,500%
$2,500%
$3,500%
$4,500%
$5,500%
$6,500%
20% 30% 40% 50% 60%
Break&even
)CAP
EX)
Engine)Efficiency)
10!yr%(6%mos.)%
5!yr%(12!mos)%
5!yr%(6%mos.)%
5!yr%(Elec%Only)%
2!yr%(6%mos.)%
System Performance TEA –Capital Cost vs Device Efficiency (η)
24Insert Presentation NameDecember 21, 2016
Break-even CAPEX increases• w/ η (fixed lifetime)• w/ lifetime (fixed η)
• w/ heating mos. (0 -> 12 mos.) Break-even Payback Period
Heating Months
Gas: $10/tcfElec: $0.11/kWh
A (gas:elec) cost combo establishes an η below which it costs more to have engine than grid, even if engine is free.
Higher $/kWh /Lower $/tcf
Lower $/kWh /Higher $/tcf

TEA to Establish Market Competitiveness‣ Market analysis
– In a perfect world, a successful GENSETS project will produce a device with four primary attributes: 1-‐kWe, 40% efficiency, 10-‐yr lifetime, $3000 cost (which includes heat capture)• What in the market has one (1), two (2) or three (3) of these attributes? (the assumption is that one with all four doesn’t exist)– Consider all combinations– Which attribute(s) appear to be the most valuable?– Which of your innovations will have impact on which attribute?– If you reach a point where you have to trade one attribute for another, which
would you choose and what technology components would you focus on?– What would the less-‐than-‐perfect product look like and what market would it
address?
– Your TEA should answer these questions – and the answers will likely be different for each project
25Insert Presentation NameDecember 21, 2016
TEA to Establish Market Competitiveness‣ Market analysis
– In a perfect world, a successful GENSETS project will produce a device with four primary attributes: 1-‐kWe, 40% efficiency, 10-‐yr lifetime, $3000 cost (which includes heat capture)• What in the market has one (1), two (2) or three (3) of these attributes? (the assumption is that one with all four doesn’t exist)– Consider all combinations– Which attribute(s) appear to be the most valuable?– Which of your innovations will have impact on which attribute?– If you reach a point where you have to trade one attribute for another, which
would you choose and what technology components would you focus on?– What would the less-‐than-‐perfect product look like and what market would it
address?
– Your TEA should answer these questions – and the answers will likely be different for each project
26Insert Presentation NameDecember 21, 2016

Device or System Level TEA‣ What are you seeking to accomplish?
– Lowest Capital cost - $/W • In the case of generators,
– ”W” is fixed as the product size– Manufacturing cost $ is minimized based on other marketable attributes such as efficiency and lifetime.
• In the case of solar or wind, – Product size is fixed and one is trying to maximize W– …and is simultaneously trying to minimize manufacturing cost $
– Lowest LCOE - $/kWh• For generators,
– [FIXED COST ($) / estimated total # kWh] + [OPEX COST ($) / kWh]• For solar or wind
– [FIXED COST ($) / estimated total kWh generated]
27Insert Presentation NameDecember 21, 2016

Cost Breakdown
28Insert Presentation NameDecember 21, 2016
‣ Manufacturing Cost - $/Unit – In the case of generators or solar cells / fuel cells,
• [Bill of Materials (BOM) + Cost of Assembly (Labor + Amort. Factory)]/YIELD– BOM
» Purchased materials» Internally manufactured materials (when is this cheaper than buying?)
– Labor» Tradeoff between labor and automation» Tradeoff between complex and simple process
– Amortized factory» How long will it last? When is an “upgrade” better than status-quo?» Contract manufacturing vs Capital purchase
– YIELD» Assembly vs Synthesis» Risk of failure in achieving specification» When it fails, how much product cost is lost or recoverable?

Performance Breakdown
29Insert Presentation NameDecember 21, 2016
‣ Power output or Unit size – W/Unit– In the case of generators,
• Design for electrical (or total) Power (kWe)– Baseline design / performance– Modified design
» Achieving ~40% efficiency» ...80,000 hr lifetime» ...scaling power up or down» Is it baseload or dynamic response?
– In the case of solar.• Design for Size (cm2 for Si solar cell or m2 glass-based thin-film module)
– m2 x W/m2 (performance) determines Power (W)» Core cell technology (Si, CdTe, etc) determines W/m2 range» Manuf process determines performance» Product size and process determines cost

Device level TEA‣ Device analysis
– Your project has proposed to achieve the Program performance metrics by innovating on one or more “baseline” device attributes• This can include a component within the Bill of Materials, a manufacturing process, a manufacturing tool, operating conditions, etc.
30Insert Presentation NameDecember 21, 2016
– A “Waterfall” chart is one way to show, incrementally, how these innovations will improve baseline performance
– This analysis is multi-‐dimensional and interdependent

Cost-Benefit Analysis‣ Cost-‐benefit analysis
– Relative to a baseline, each innovation, or combination of innovations, has a cost-‐benefit relationship
– Examining cost-‐benefit can drive design or pivot decisions
31Insert Presentation NameDecember 21, 2016

Economy of Scale & Replication
32
System Cost: 1kWe vs 100 kWe

Core Device vs Balance of Plant
33
FC Subsystem: 1kWe vs 100 kWe

Comparison*of*BOS*cost*based*upon*Module*Efficiency*:*Fixed*System*Size*(10*MW)
(1) 7.5% 10.0% 12.5% 15.0% 17.5% 20.0% %(Fixed((2)
Inverters 0.25$(((((((((( 0.25$(((((((((( 0.25$(((((((((( 0.25$(((((((((( 0.25$(((((((((( 0.25$(((((((((( 100%
NRE 0.22$(((((((((( 0.17$(((((((((( 0.14$(((((((((( 0.12$(((((((((( 0.11$(((((((((( 0.10$(((((((((( 20%
Mechanical 0.40$(((((((((( 0.30$(((((((((( 0.24$(((((((((( 0.20$(((((((((( 0.17$(((((((((( 0.15$(((((((((( 0%
Site*Work 0.53$(((((((((( 0.44$(((((((((( 0.39$(((((((((( 0.35$(((((((((( 0.33$(((((((((( 0.31$(((((((((( 50%
Ground*Mount 0.34$(((((((((( 0.26$(((((((((( 0.20$(((((((((( 0.17$(((((((((( 0.15$(((((((((( 0.13$(((((((((( 0%
Electrical*InstallaKon 0.69$(((((((((( 0.58$(((((((((( 0.51$(((((((((( 0.46$(((((((((( 0.43$(((((((((( 0.40$(((((((((( 50%
BOS*Total 2.42$(((((((((( 1.99$(((((((((( 1.72$(((((((((( 1.55$(((((((((( 1.43$(((((((((( 1.33$((((((((((
Modules 0.33$(((((((((( 0.76$(((((((((( 1.03$(((((((((( 1.20$(((((((((( 1.32$(((((((((( 1.42$((((((((((
Total 2.75$(((((((((( 2.75$(((((((((( 2.75$(((((((((( 2.75$(((((((((( 2.75$(((((((((( 2.75$((((((((((
(1)((For(a(given(system(size,(an(INCREASE((DECREASE)(in(Module(Efficiency(will(result(in(a(DECREASE((INCREASE)(in(System(AREA(and(NUMBER(of(MODULES,(resulSng(in:(((((U>(DECREASE((INCREASE)(in(Site(Work,(Mechanical(Systems,(Electrical(Wiring,(Ground(Mount(locaSons(and(nonUrecurring(Engineering((NRE)(costs.((The(%(decrease(will(differ(for(each(cost(type;((((U>*NO*CHANGE((NO*CHANGE)(in(#(of(Inverters.
(2)((%(Fixed(refers(to(%(of(cost(that(DOES(NOT(vary(with(System(Size(/(Module(
System Cost Variations§ Balance-of-System (BOS) costs vary with module efficiency§ BOS components vary differently with module efficiency

!$#!!!!
!$0.50!!
!$1.00!!
!$1.50!!
!$2.00!!
!$2.50!!
!$3.00!!
5.0%! 7.5%! 10.0%! 12.5%! 15.0%! 17.5%! 20.0%! 22.5%!
Cost%($
/W)%
Module%Efficiency%
Module%"Price"%%vs.%Efficiency%
System!Total!#!"$2.75"! System!Total!#!"$2.50"! BOS!Cost!Total!
Module!Price!#!"$2.75"! Module!Price!#!"$2.50"!
§ Any Price-Efficiency combination along “Price” line is competitive with another-> Market Competitiveness is NOT JUST efficiency-> In near-term, lower efficiency CIGS is just as good as c-Si
Example: System Price: $2.75/W & $2.50/W
Break-Even ($2.75/W)17.5% Efficiency <->
$1.32/W15.0% Efficiency <->
$1.20/W12.5% Efficiency <->
$1.03/W

Looking Forward‣ Opportunities / Challenges
– Longer-term for µ-CHP market development• Residential CHP may take years to develop unless policy is enacted or a large deployment entity (Solar City) invests in the risk
– Is there a “winning” design?• All other things equal (performance, cost, projected durability), is there any inherent advantage of one generator family over another?
– Highly mature supply chain• Once a design in tested and finalized, scaling to volume is lower risk than other DER technologies like fuel cells or solar PV
• Opportunities for contract manufacturing– Follow-on-funding / access to capital
• Capital will understand the lower manufacturing risk and react accordingly
36Insert Presentation NameDecember 21, 2016

Technology to Market GENSETS
GENerators for Small Electrical and Thermal Systems
THANK YOU
John R Tuttle, Ph.D.Senior Commercialization Advisor
December 21, 2016