Genotyping Issues - The University of Vermontbiology/Classes/296D/15_Geno_Issues.pdf · Turns peaks...
40
Genotyping Issues Chapter 15
Transcript of Genotyping Issues - The University of Vermontbiology/Classes/296D/15_Geno_Issues.pdf · Turns peaks...

Genotyping Issues
Chapter 15

Turns peaks into profiles
Overall goal is to determine a DNA profile:1. Extract and isolate DNA from sample2. PCR amplify DNA
• With fluorescent dye labels3. Separate PCR products4. Detect PCR products5. Analyze peaks and determine the
genotypes

Data Collection
Peak Identification
Data Review by Analyst/Examiner
Color Separation
Peak Sizing
Comparison to Allelic Ladder
Confirmation of Results by Second Analyst/Examiner
Genotype Assignment to Alleles
GeneScan or FMBIO Analysis
software
Genotyper or StaR Call
software
Internal sizing standard
(e.g., GS500-ROX)
Matrix file
Allelic ladder sample
GeneMapperIDsoftware
Expert Systems under Development
(e.g., True Allele)
Figure 15.1, J.M. Butler (2005) Forensic DNA Typing, 2nd Edition © 2005 Elsevier Academic Press

Data Collection Techniques:
Common Electrophoresis Machines ABI • Capillary machine• Currently most commonly used
– 96 capillaries currentlyFMBIO• Polyacrylamide gel• Then scan gel to read bands

Color Separation
• Matrixes files:– Assign the correct color spectra to the correct
fluorescent dye– Subtract overlap between dyes
• Run each dye separately– To determine the true spectra in given
conditions• Then run dyes together
– To determine amount of overlap

Blue (5FAM)
Green (JOE)
Yellow (NED)
Red (ROX)
Separate samples run for each dye colorEach sample contains multiple peaks All peaks labeled with the same dye color
ABI 310 Matrix Samples
ABI 3100 Matrix (Spectral Calibration)
Sample
Blue (5FAM)
Green (JOE)
Yellow (NED)
Red (ROX)
Single sample run containing all dye colorsOnly one peak per dye colorInjected into each capillary of the array
(A) (B)
A separate spectral calibration file is created for each capillary
Figure 14.5, J.M. Butler (2005) Forensic DNA Typing, 2nd Edition © 2005 Elsevier Academic Press

Overlapping Spectra• Although each dye emits its maximum
fluorescence at a different wavelength they do overlap quite a bit
Wavelength (nm)
Fluo
resc
ence
Where laser reads emission
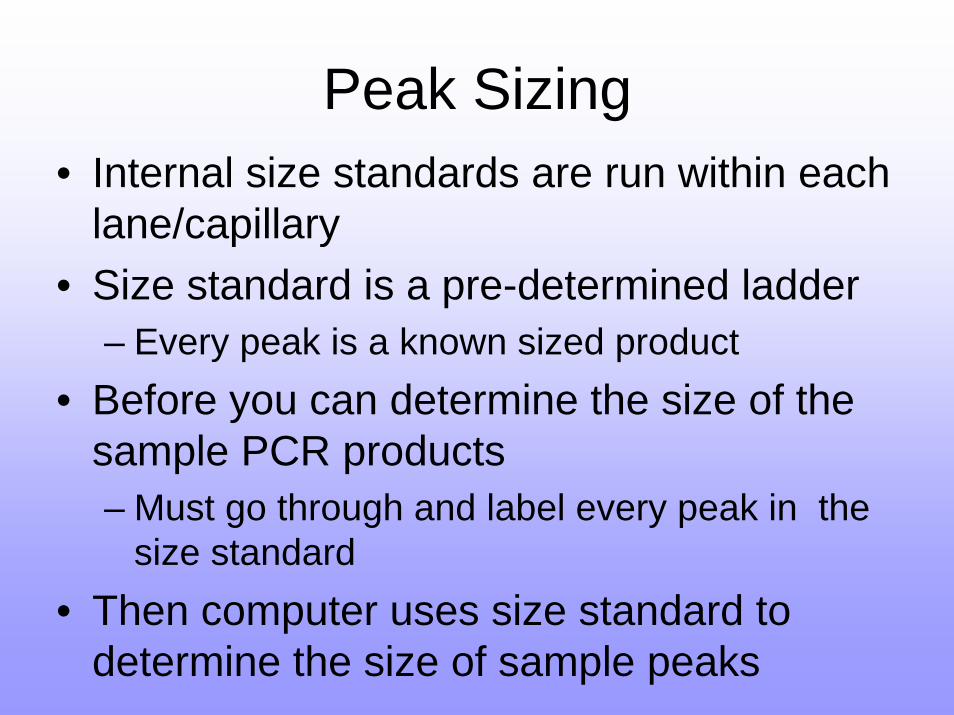
Peak Sizing• Internal size standards are run within each
lane/capillary• Size standard is a pre-determined ladder
– Every peak is a known sized product• Before you can determine the size of the
sample PCR products– Must go through and label every peak in the
size standard• Then computer uses size standard to
determine the size of sample peaks

3550
75 100 139 160 200 250300 340
350400 450 490
500150
DNA fragment peaks in sample
DNA Size
Data Point
147.32 bp147.32 bp
165.05 bp165.05 bp
100
139
150160
200
250
DNA fragment peaks are sized based on the sizing curve produced from the points on the internal size standard
(a)
(b)
Figure 15.2, J.M. Butler (2005) Forensic DNA Typing, 2nd Edition © 2005 Elsevier Academic Press

Size Algorithms
Local Southern Method:• Take two size standard peaks above the
unknown sample• Two size standard peaks below• Therefore can only accurately call
unknown peaks that exist within the 50 bp to 490 bp range
• Any peaks outside this range cannot be called with standard size standard mix

Size Algorithms
Global Southern Method:• Fitting all the size standard peaks onto a
“best fit” line• Then using one line to determine all
unknown peaks• Seems to be more accurate method• Still need to keep within 50 to 490 bp
range

Comparison to Allelic Ladder
• First all peaks are sized– In terms of base pairs
• Then determine the actual allele of each peak
• Allele = the number of repeat units of the STR marker
• Need to be able to compare alleles between different labs with different technologies

Allelic Ladder
• Allelic ladder contains every single allele for the marker within one lane
• Determine the size of all peaks within the allelic ladder
• Then compare sample peaks to the allelic ladder – determine which alleles present
• Sample peaks need to be exactly the same as the allelic ladder to be called with confidence

D3S1358(8 alleles)
VWA(14 alleles)
D16S539(9 alleles) D2S1338
(14 alleles)
Blue panel
Green panel
Yellow panel
Orange panel
D21S11(24 alleles)
D8S1179(12 alleles)
D18S51(23 alleles)
TH01(10 alleles)
FGA low(19 alleles)
FGA high(9 alleles)
250 bp*139bp 200 bp160 bp 300 bp 340 bp 350 bp150 bp
LIZ-labeled GS500 DNA sizing standard
100 bp
Red panel
D19S433(15 alleles)
D5S818(10 alleles)
TPOX(8 alleles)
D13S317(8 alleles)
D7S820(10 alleles)
CSF1PO(10 alleles)
AMEL(2 alleles)
Figure 5.6, J.M. Butler (2005) Forensic DNA Typing, 2nd Edition © 2005 Elsevier Academic Press

Off-ladder Alleles
• Accepted range of any allele– Within 0.5 bp of allelic ladder
• Any peaks that are outside this range are considered “Off-ladder”
• Two types of off ladder peaks:– Peaks that are bigger or smaller than ladder’s
complete range– Peaks that exist between the ladder’s peaks

Off-ladder Alleles
• If allele is smaller than smallest allele in ladder – genotype is written:– CSF1PO < 6
• If allele is larger than largest allele:– CSF1PO > 15
• Alleles between alleles written:– TH01 8.3 (8 repeat units plus 3 bases)– Or TH01 8.x

Off-ladder Alleles
• An expert may call a technically off-ladder allele as the closest allele– For example if the peak is only 0.7 bps off– Or if they know that certain colors always run
a certain amount high or low• Experts should compare any off ladder
alleles to databases of known microvariants– More than 220 microvariants are known for 13
core STR markers
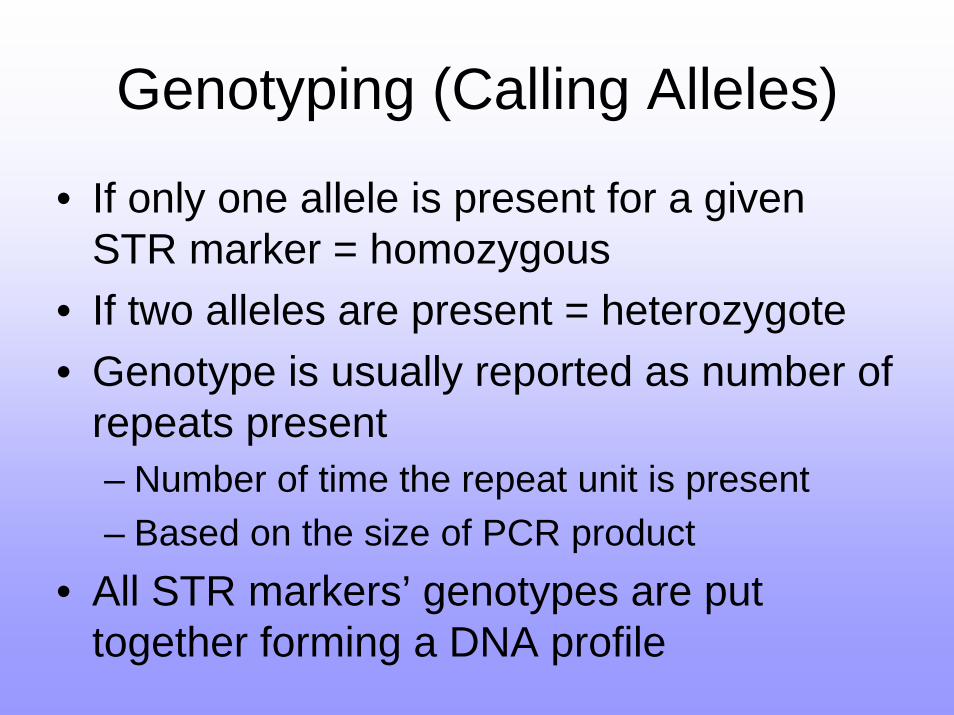
Genotyping (Calling Alleles)
• If only one allele is present for a given STR marker = homozygous
• If two alleles are present = heterozygote• Genotype is usually reported as number of
repeats present– Number of time the repeat unit is present– Based on the size of PCR product
• All STR markers’ genotypes are put together forming a DNA profile

Genotyping Software
Currently software exists that can:• Size all peaks automatically given the size
standard’s known sizes• Then compare unknown peaks to allelic
ladders and determine the alleles automatically
• Convert the alleles into a genotype• Collect all alleles into a DNA profile

COfiler STR data
GeneScan view
Genotyperview
Allele call (repeat number)determined by comparison of peak size (bp) to allelic ladder allele peak sizes run under the same electrophoretic conditions
Peak height in relative fluorescence units (RFUs)

Data Review• All computer analyzed alleles must be
evaluated by a real life expert• Computer algorithms will call alleles based
on the information you feed into it:– The size standard’s expected sizes– The alleles present in the allelic ladder– The acceptable “bin” for each unknown peak
• Natural variations require that a human actually examine the data and verify the alleles make common sense

Allele Binning• Before computer can determine any
alleles• Give computer a base pair size range
– Known as a bin• Based on allelic ladder• Standard recommendation is 0.5 bps
below and above each peak in the ladder• However, the ladder’s alleles may show
variation – Not always at exact same position!

Allele Binning• Say the allelic ladder’s peaks vary by 0.5
bps to either side• Then you set your bin for that allele to be
another 0.5 bp to each side of that range• Therefore your bin will be 2 bps wide• Usually fine for tetranucleotide repeats
– May cause problems with microvariants
Bin

Partial DNA Profiles
• In some conditions only a partial Profile may be obtained
• Usually due to degradation of the DNA or the presence of PCR inhibitors
• Often the smaller PCR products may continue to show up when the larger products do not
• For this reason may decide to go back and re-genotype with mini-STRs

Partial DNA Profiles
• Only some of the genotypes can be obtained
• Significance of a match will go down• Because there are less markers
• Therefore the overall profile is less informative and specific

Mixture Interpretation
• While determining genotypes must also determine whether unknown sample is a mixture
Better chance of identifying that the sample is a mixture when examining:
• More markers; all highly polymorphic• Because more chance that both samples
will be heterozygous – see 3 or 4 peaks

Extra Peaks
• Sometimes extra peaks may not be caused by a mixture
• Possible reasons for extra peaks:– Stutter bands– Incomplete Adenylation of products– True rare anomalies causing extra
chromosomes or chromosomal regions– Mixtures

Extra Peaks
• Sometimes extra peaks caused by technology related artifacts
• Possible reasons for extra peaks:– Strong alleles bleeding through– Dye blobs– Air bubbles– Urea crystals– Sample contaminants that fluoresce

Dye blob
STR alleles
stutter
Pull-up (bleed-through)
spike
Blue channel
Green channel
Yellow channel
Red channel
Figure 15.4, J.M. Butler (2005) Forensic DNA Typing, 2nd Edition © 2005 Elsevier Academic Press
D3S1358
Stutter products
6.0% 7.8%
Incomplete adenylation
D8S1179
-A
+A
-A
+A
Biological (PCR) artifacts
Deciphering Artifacts from the True Alleles

Contamination Possibilities
• Certain contaminants fluoresceWhen DNA is extracted along with any of
the following:• Dyes in fabrics• Chlorophyll from plants• People with certain pathological conditions
– Lead poisoning, Blood Porphyrins• People who took tetracycline antibiotics

Confirmation of Genotypes
• DNA profile is determined by:– Computer software– Expert review– Second expert
• Only when a genotype is confirmed by two experts is it accepted
• Both individuals need to be unaware of each other’s allele calls– Blind allele calls

Interpretation Strategy
Each laboratory must develop a strategy for calling alleles consistently:
• Conduct validation studies of lab equipment and personnel
• Gain experience examining peaks• Learn when to trust the computer and
when changing allele calls is appropriate• Reference literature and databases often
to keep up to date with CODIS markers

A Match?Three possible outcomes of comparing two
DNA profiles:1. Inclusion – if the DNA profiles match
– Probability of seeing this match at random is calculated
2. Exclusion – non-match– The profiles are too different to possibly be
the same individual3. Inconclusive - unknown
– There is not enough data to determine
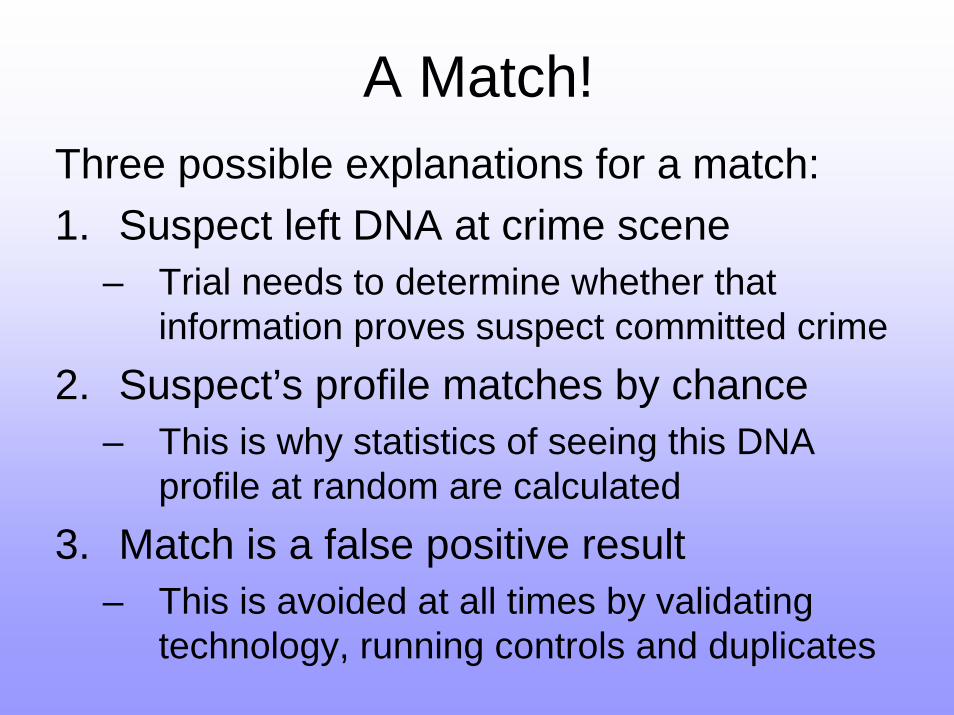
A Match!Three possible explanations for a match:1. Suspect left DNA at crime scene
– Trial needs to determine whether that information proves suspect committed crime
2. Suspect’s profile matches by chance– This is why statistics of seeing this DNA
profile at random are calculated3. Match is a false positive result
– This is avoided at all times by validating technology, running controls and duplicates

Any Questions?
Read Chapter 16

Capillaries
Electrodes for Injection
Figure 14.4, J.M. Butler (2005) Forensic DNA Typing, 2nd Edition © 2005 Elsevier Academic Press

Replace capillary
Refill syringe with polymer solution
Fill buffer vials
Prepare samples(denature, cool, and mix with size standard)
Prepare sample sheet and injection list
Automated Sample Injection, Electrophoresis and Data Collection
Automated Sample Injection, Electrophoresis and Data Collection
Genotype STR alleles
Size DNA Fragments
Perform Data Analysis
GeneScan Software
Genotyper Software
Manually inspect the data
Performed only once per batch of ~96 samples
Allelic ladder every tenth injection
ELECTROPHORESIS and DETECTION steps are simultaneous
Figure 14.2, J.M. Butler (2005) Forensic DNA Typing, 2nd Edition © 2005 Elsevier Academic Press

FMBIO III Gel Imager System
PowerPlex 16 BIO
Penta E
D18S51
D21S11
TH01
D3S1358
Penta D
CSF1PO
D7S820
D13S317
D5S818
D16S539
TPOX
D8S1179
VWA
FGA
Amelogenin

SCAN GELSCAN GEL
Size DNA Fragments
Genotype STR alleles
Pour Gel
Load Samples(allelic ladder every third lane)
Electrophoresis
Pour Gel
Load Samples(allelic ladder every third lane)
Electrophoresis
STaR Call™Genotyping Software
FMBIO II Fluorescence Imaging System
Perform Data Analysis
FMBIO® Analysis Software
ReadImage Software
Manually inspect the data
Post-Electrophoresis
ELECTROPHORESIS and DETECTION steps are separate
Prepare samples: denature, cool, and mix with loading dye
Prepare samples: denature, cool, and mix with loading dye
Figure 14.7, J.M. Butler (2005) Forensic DNA Typing, 2nd Edition © 2005 Elsevier Academic Press

GreenGreen
YellowYellow
BlueBlue
Figure 15.3, J.M. Butler (2005) Forensic DNA Typing, 2nd Edition © 2005 Elsevier Academic Press