Genomic Selection in Sheep: where to now? - EAAP · • FAANG and precision genomics. Tissue...
36
Genomic Selection in Sheep: where to now? John McEwan, Ken Dodds, Suzanne Rowe, Rudi Brauning, Shannon Clarke AgResearch, Invermay, New Zealand EAAP Belfast 29 th August 2016
-
Upload
nguyenduong -
Category
Documents
-
view
216 -
download
2
Transcript of Genomic Selection in Sheep: where to now? - EAAP · • FAANG and precision genomics. Tissue...
Genomic Selection in Sheep: where to now?
John McEwan, Ken Dodds, Suzanne Rowe, Rudi Brauning,Shannon Clarke
AgResearch, Invermay, New ZealandEAAP Belfast 29th August 2016
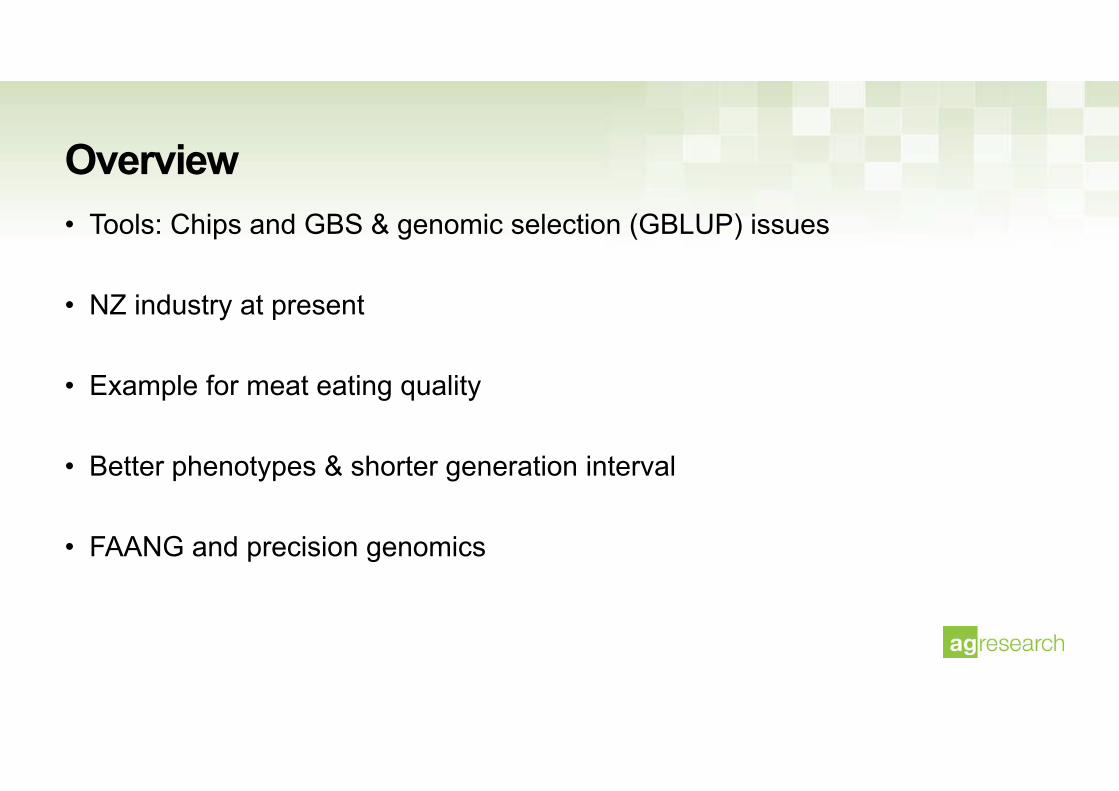
Overview• Tools: Chips and GBS & genomic selection (GBLUP) issues
• NZ industry at present
• Example for meat eating quality
• Better phenotypes & shorter generation interval
• FAANG and precision genomics
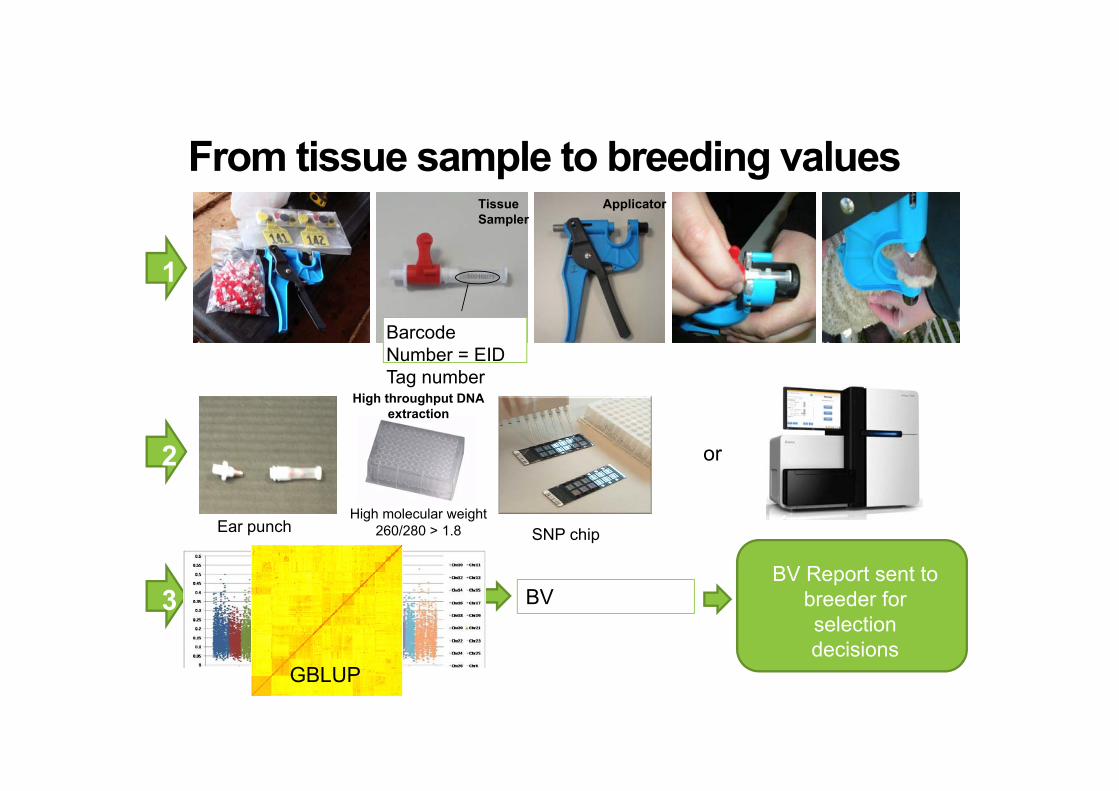
Tissue Sampler
Barcode Number = EID Tag number
Applicator
BVBV Report sent to
breeder for selection decisions
From tissue sample to breeding values
1
2
3
Ear punch SNP chip
High throughput DNAextraction
High molecular weight260/280 > 1.8
or
SNP-BLUPGBLUP
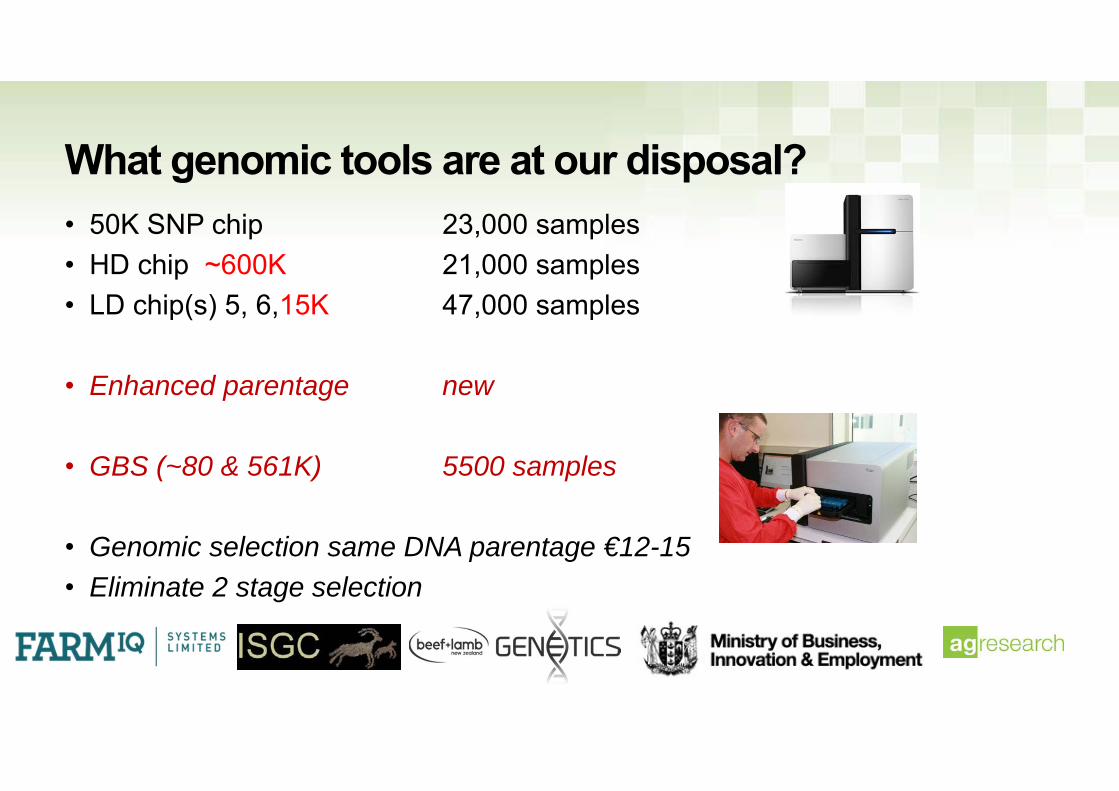
What genomic tools are at our disposal?• 50K SNP chip 23,000 samples• HD chip ~600K 21,000 samples• LD chip(s) 5, 6,15K 47,000 samples
• Enhanced parentage new
• GBS (~80 & 561K) 5500 samples
• Genomic selection same DNA parentage €12-15• Eliminate 2 stage selection
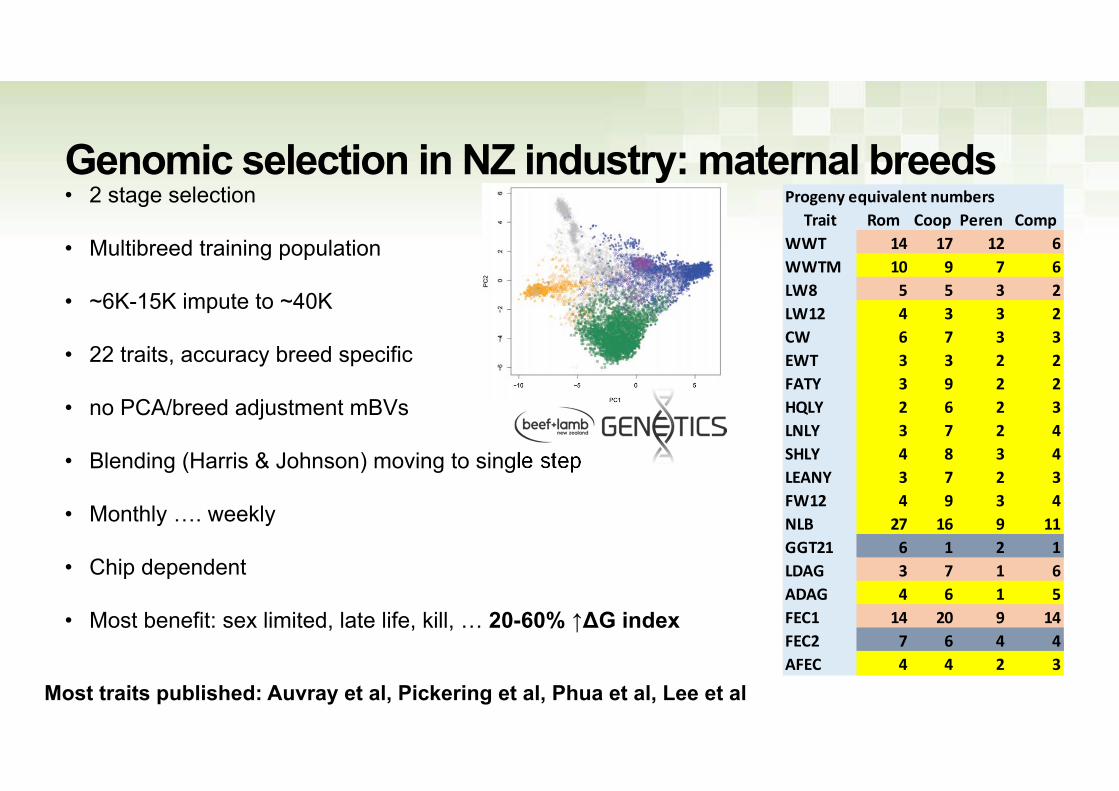
Genomic selection in NZ industry: maternal breeds• 2 stage selection
• Multibreed training population
• ~6K-15K impute to ~40K
• 22 traits, accuracy breed specific
• no PCA/breed adjustment mBVs
• Blending (Harris & Johnson) moving to single step
• Monthly …. weekly
• Chip dependent
• Most benefit: sex limited, late life, kill, … 20-60% ↑ΔG index
Progeny equivalent numbersTrait Rom Coop Peren Comp
WWT 14 17 12 6WWTM 10 9 7 6LW8 5 5 3 2LW12 4 3 3 2CW 6 7 3 3EWT 3 3 2 2FATY 3 9 2 2HQLY 2 6 2 3LNLY 3 7 2 4SHLY 4 8 3 4LEANY 3 7 2 3FW12 4 9 3 4NLB 27 16 9 11GGT21 6 1 2 1LDAG 3 7 1 6ADAG 4 6 1 5FEC1 14 20 9 14FEC2 7 6 4 4AFEC 4 4 2 3
Most traits published: Auvray et al, Pickering et al, Phua et al, Lee et al
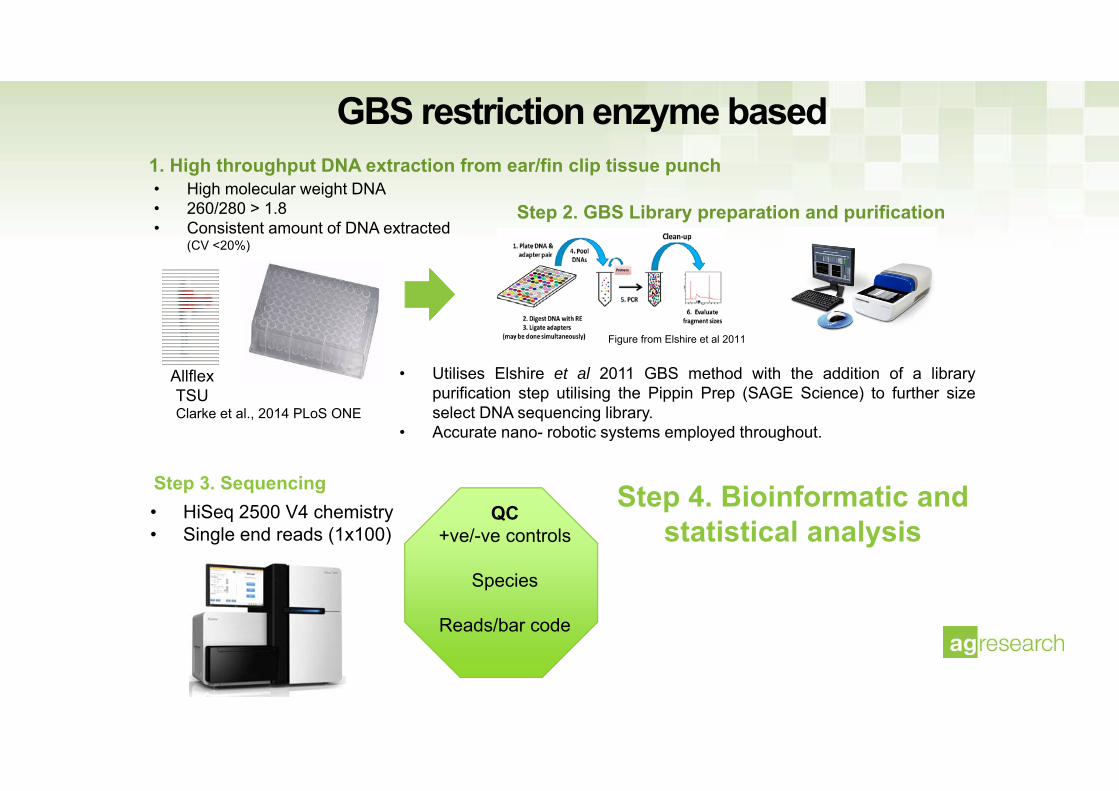
• High molecular weight DNA• 260/280 > 1.8• Consistent amount of DNA extracted
(CV <20%)
1. High throughput DNA extraction from ear/fin clip tissue punch
Step 2. GBS Library preparation and purification
GBS restriction enzyme based
Figure from Elshire et al 2011
• Utilises Elshire et al 2011 GBS method with the addition of a librarypurification step utilising the Pippin Prep (SAGE Science) to further sizeselect DNA sequencing library.
• Accurate nano- robotic systems employed throughout.
• HiSeq 2500 V4 chemistry• Single end reads (1x100)
Step 3. Sequencing Step 4. Bioinformatic and statistical analysis
QC+ve/-ve controls
Species
Reads/bar code
AllflexTSUClarke et al., 2014 PLoS ONE
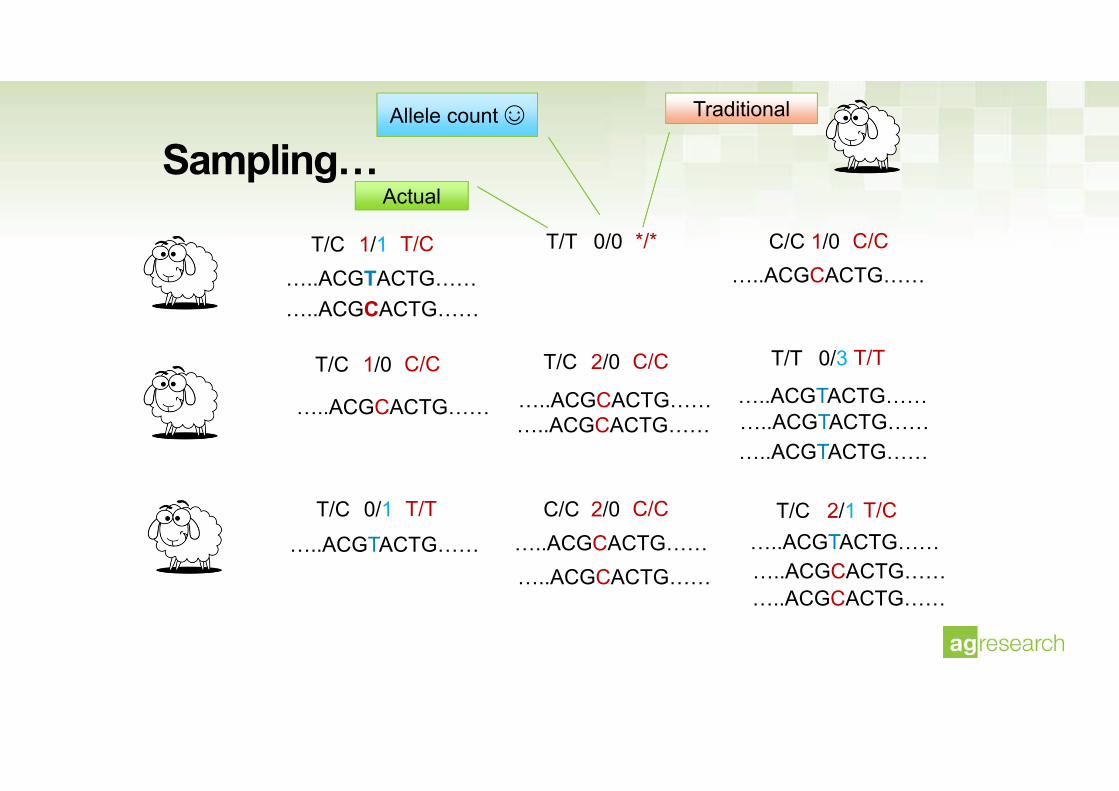
Sampling…
…..ACGTACTG………..ACGCACTG……
1/1 0/0 1/0…..ACGCACTG……
1/0
…..ACGCACTG……
2/0
…..ACGCACTG………..ACGCACTG……
0/3
…..ACGTACTG………..ACGTACTG………..ACGTACTG……
0/1…..ACGTACTG……
2/0…..ACGCACTG………..ACGCACTG……
2/1…..ACGTACTG………..ACGCACTG………..ACGCACTG……
T/C T/T C/C
T/C T/C T/T
T/C C/C T/C
T/C */* C/C
C/C C/C T/T
T/T C/C T/C
Actual
Allele count ☺ Traditional
• unbiased estimates of relatedness via method 1 of VanRaden (2008) adjusted to account for sequence read depth at each individual SNP location including SNPs with zero/missing reads KGD
• allows GBS to be applied at read depths which can be chosen to optimise the information obtained (~2 reads/SNP)
• SNPs with excess heterozygosity, often due to (partial) polyploidy or other duplications can be filtered based on a simple graphical method.
Van Raden 2008 J Dairy Sci. 91:4414-23
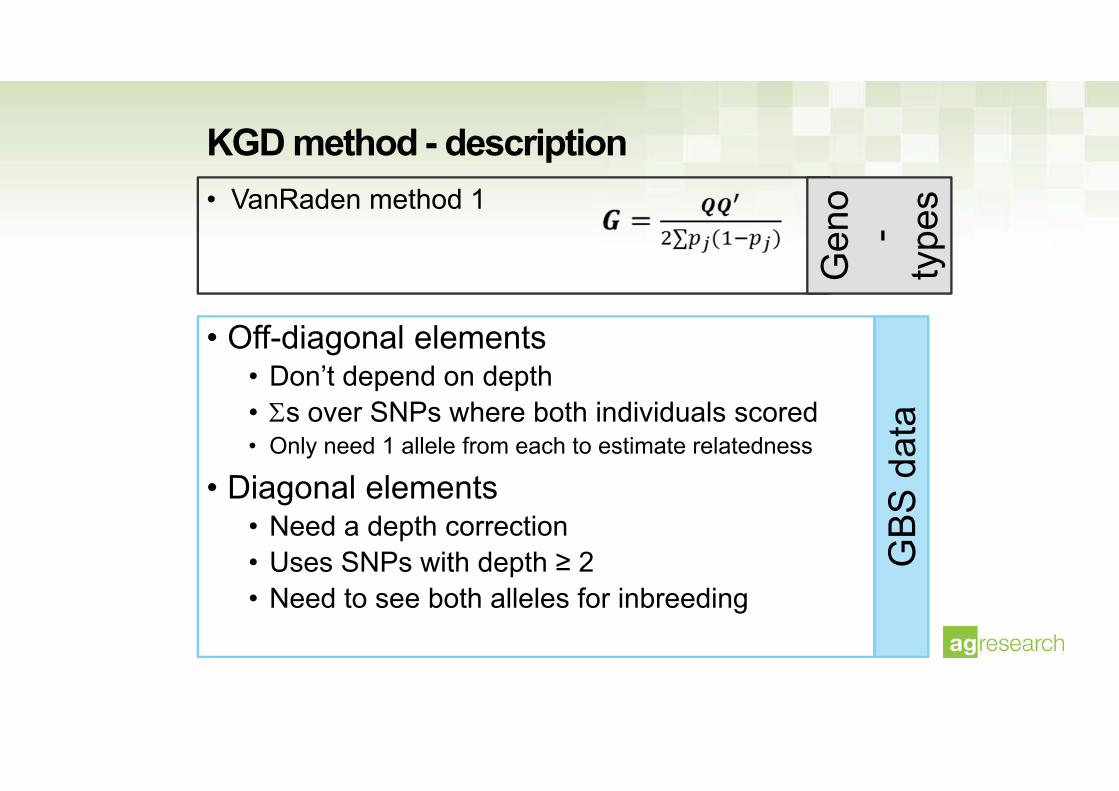
KGD method - description• VanRaden method 1
• Off-diagonal elements• Don’t depend on depth• s over SNPs where both individuals scored• Only need 1 allele from each to estimate relatedness
• Diagonal elements• Need a depth correction• Uses SNPs with depth ≥ 2• Need to see both alleles for inbreeding
GBS
dat
a
Gen
o-
type
s
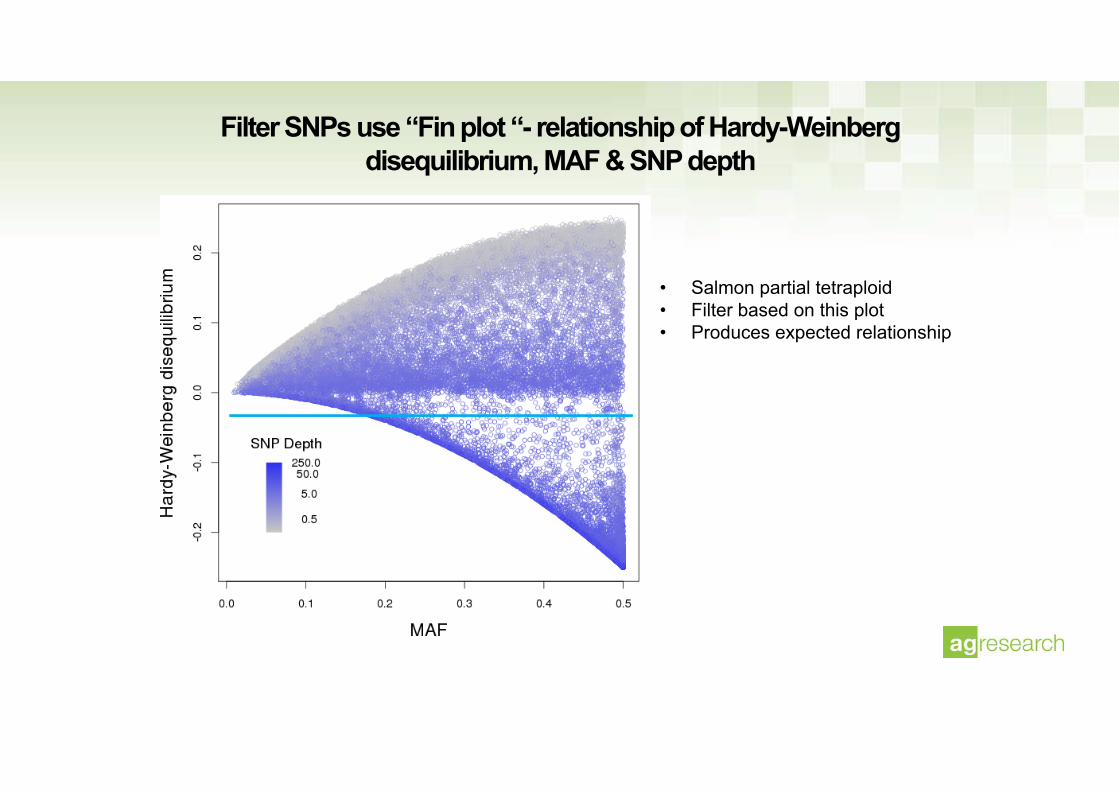
Filter SNPs use “Fin plot “- relationship of Hardy-Weinberg disequilibrium, MAF & SNP depth
• Salmon partial tetraploid• Filter based on this plot• Produces expected relationship

GRM uses
• Parentage • Inbreeding• Breed prediction
• & breed composition
• Co-ancestry
• Estimate h2 without pedigrees• Calculate mBVs GBLUP
• Estimate genetic diversity• E.g. PCA plots via GRM
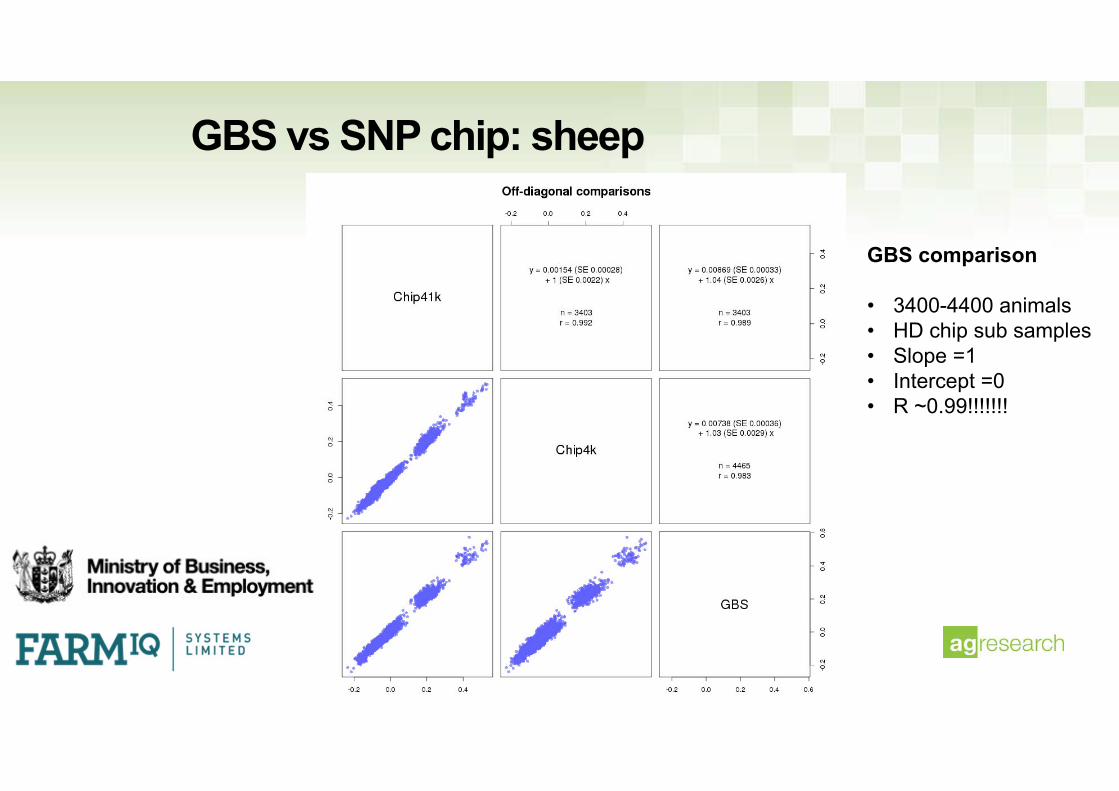
GBS vs SNP chip: sheep
GBS comparison
• 3400-4400 animals• HD chip sub samples• Slope =1• Intercept =0• R ~0.99!!!!!!!
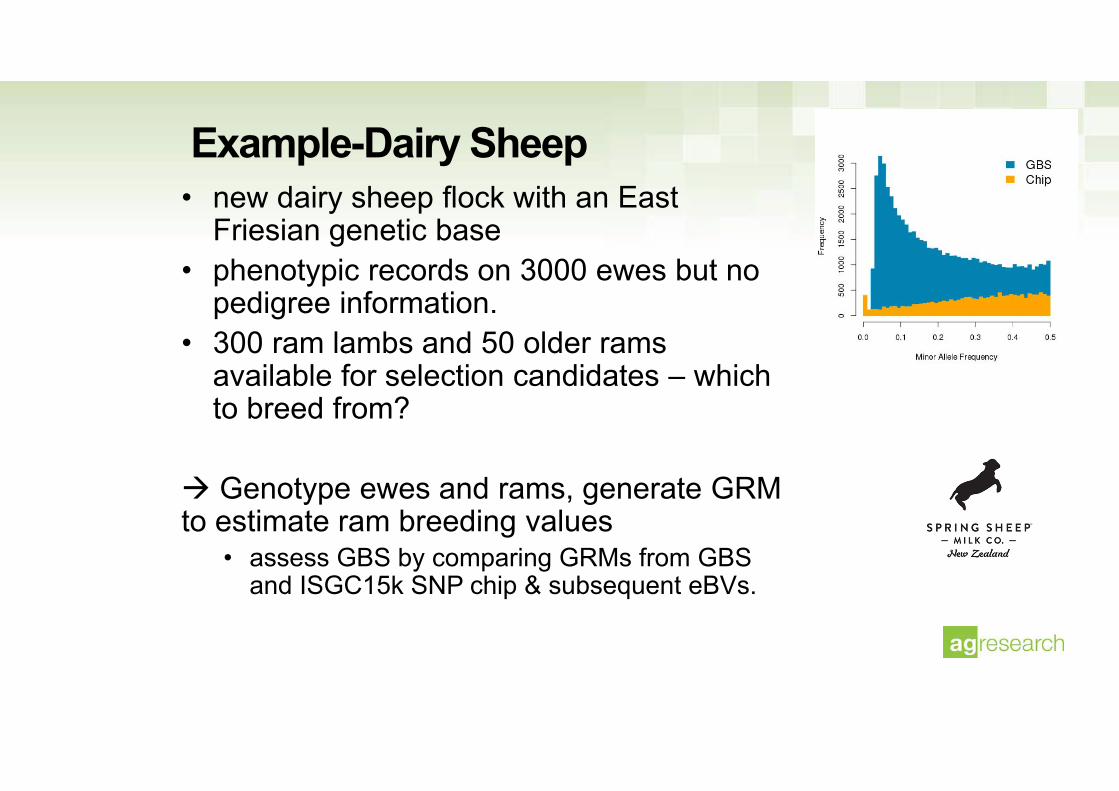
Example-Dairy Sheep• new dairy sheep flock with an East
Friesian genetic base• phenotypic records on 3000 ewes but no
pedigree information. • 300 ram lambs and 50 older rams
available for selection candidates – which to breed from?
Genotype ewes and rams, generate GRM to estimate ram breeding values
• assess GBS by comparing GRMs from GBS and ISGC15k SNP chip & subsequent eBVs.
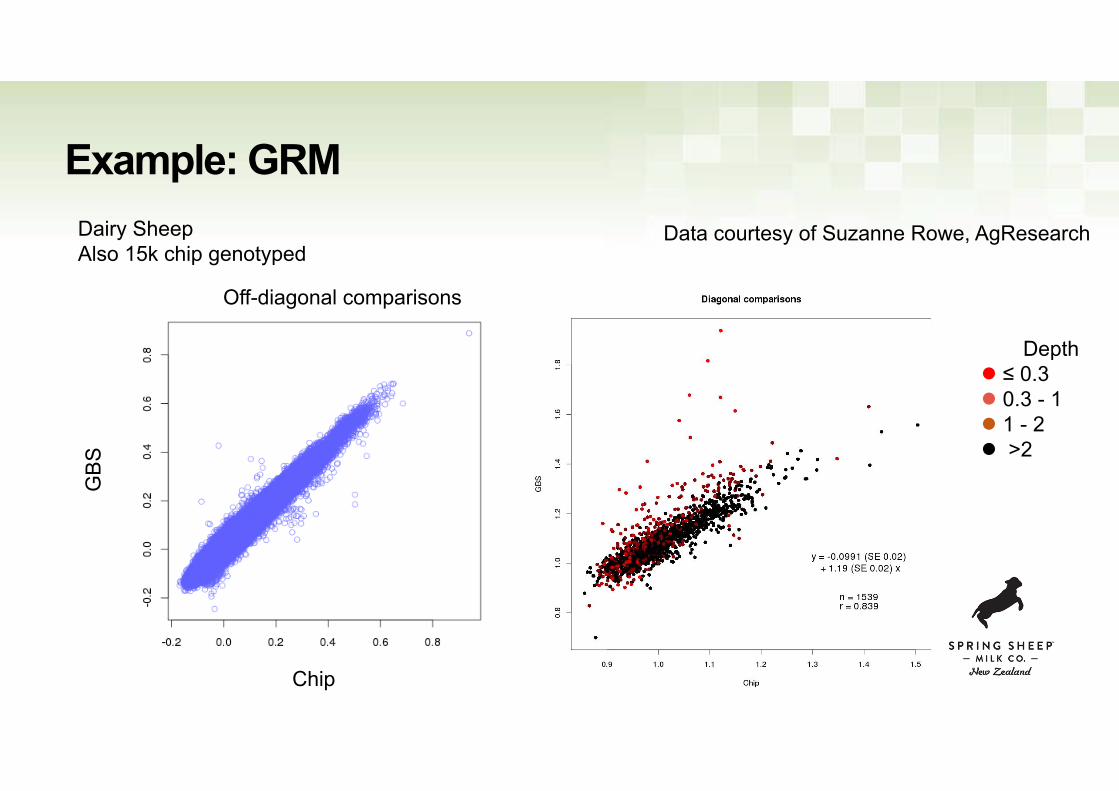
Example: GRM
Depth ≤ 0.3 0.3 - 1 1 - 2 >2
Dairy SheepAlso 15k chip genotyped
Data courtesy of Suzanne Rowe, AgResearch
Chip
Off-diagonal comparisons
GBS
‐10
‐8
‐6
‐4
‐2
0
2
4
6
8
‐15 ‐10 ‐5 0 5 10 15
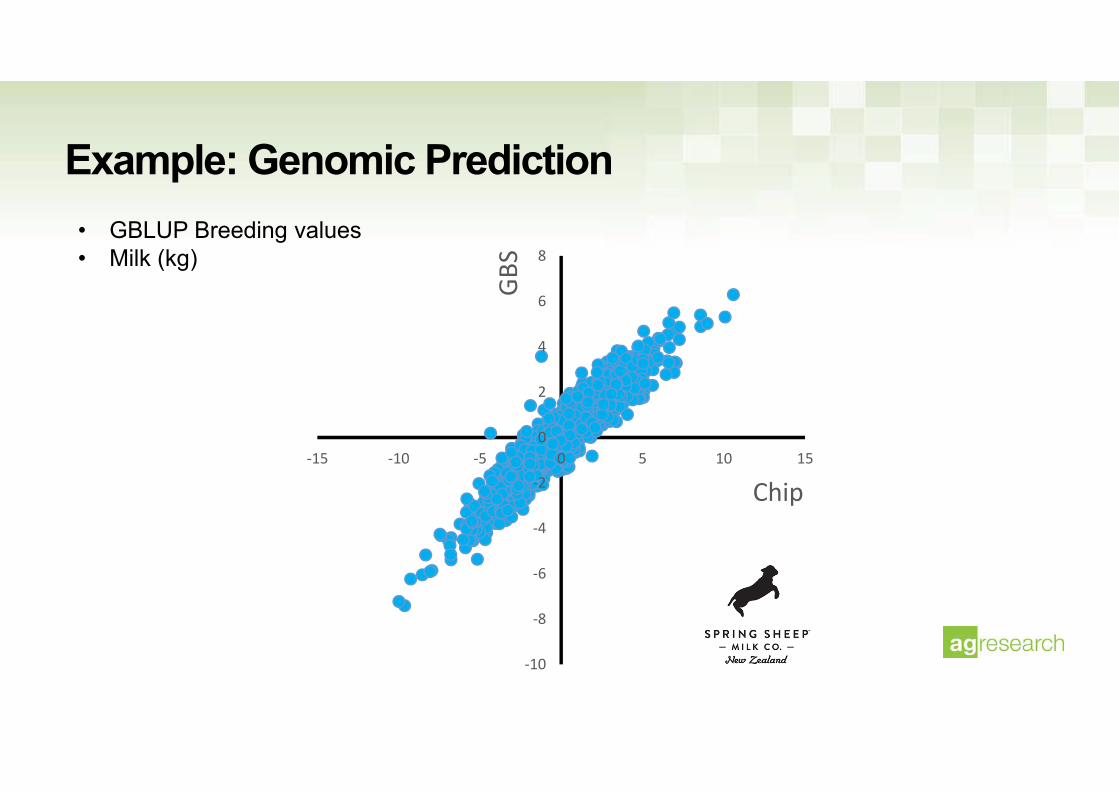
GBS
Chip
• GBLUP Breeding values• Milk (kg)
Example: Genomic Prediction
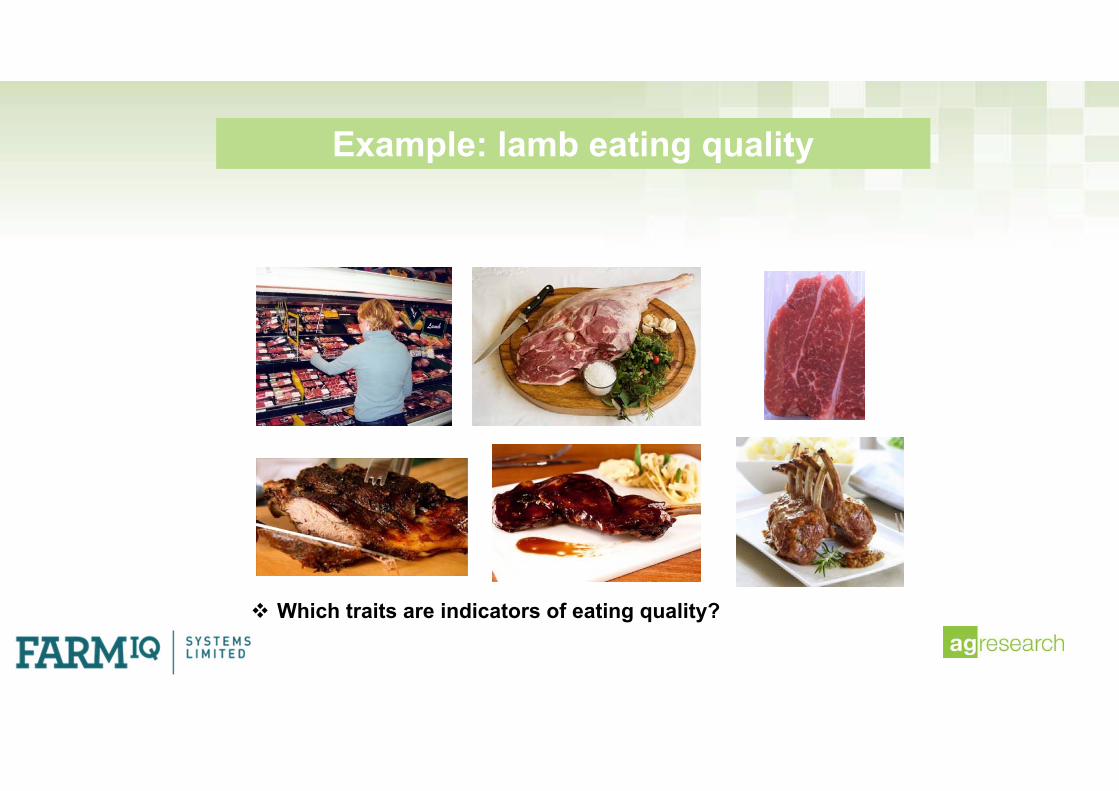
Example: lamb eating quality
Which traits are indicators of eating quality?
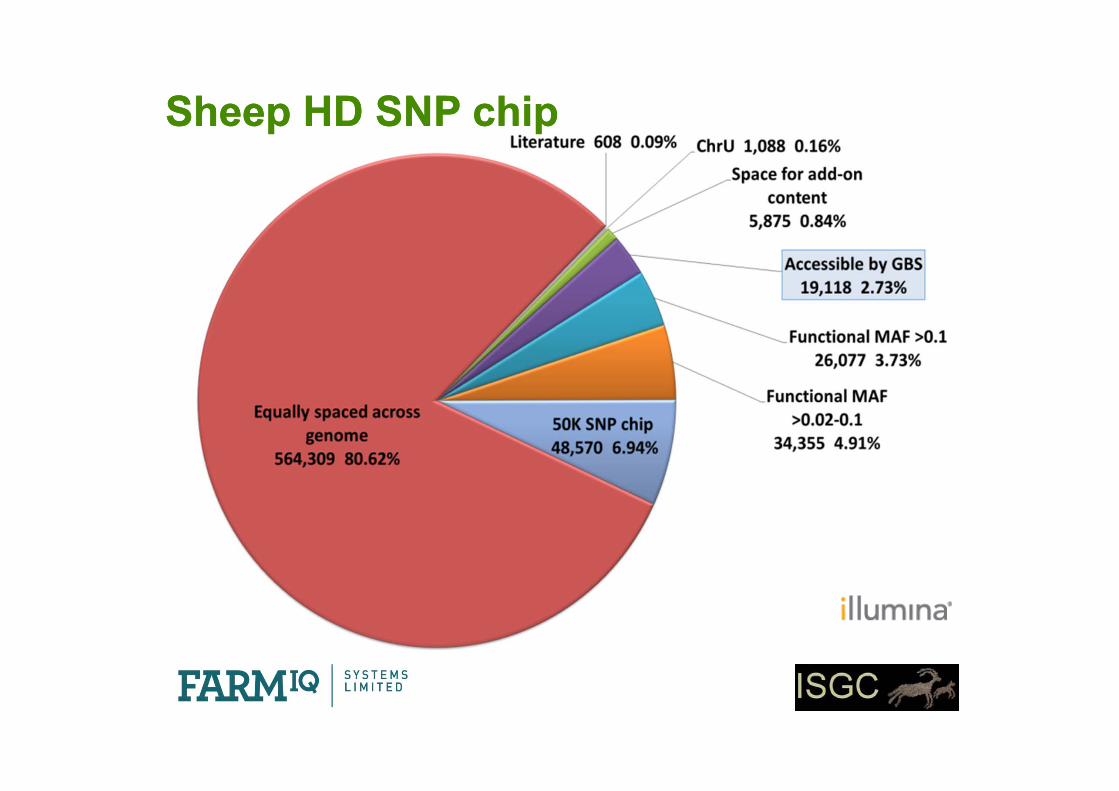
Sheep HD SNP chipSheep HD SNP chip
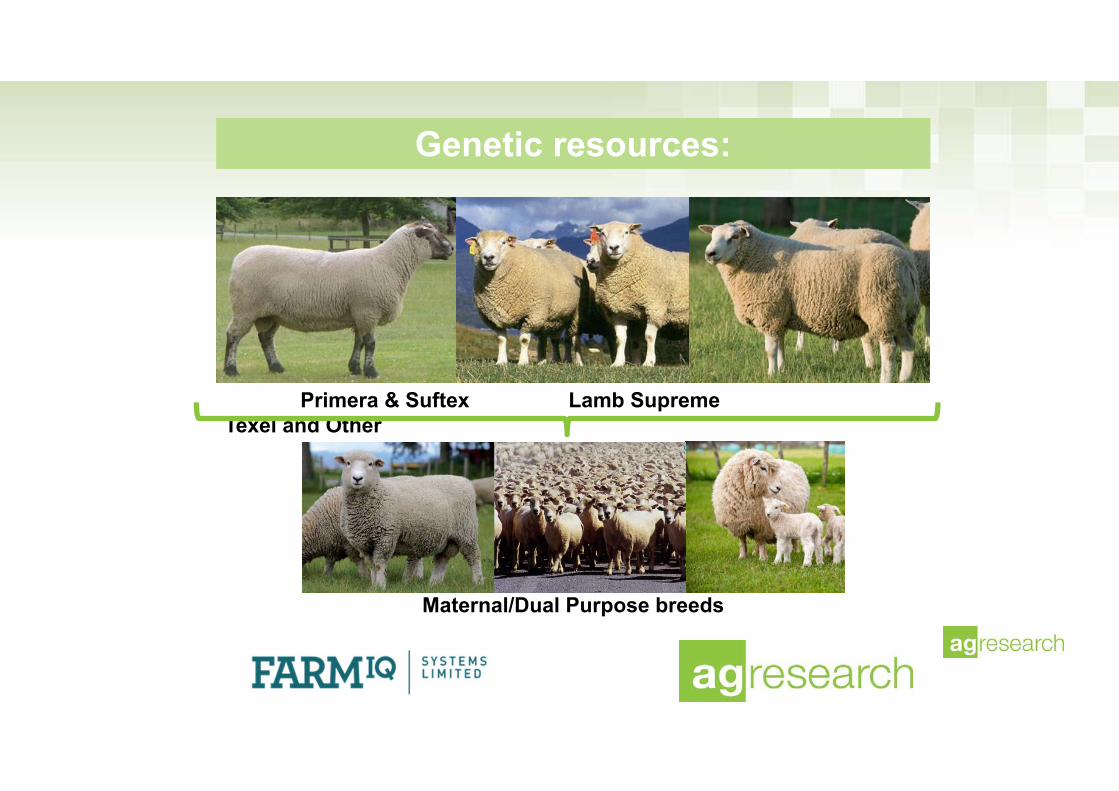
Genetic resources:
Primera & Suftex Lamb Supreme Texel and Other
Maternal/Dual Purpose breeds
19
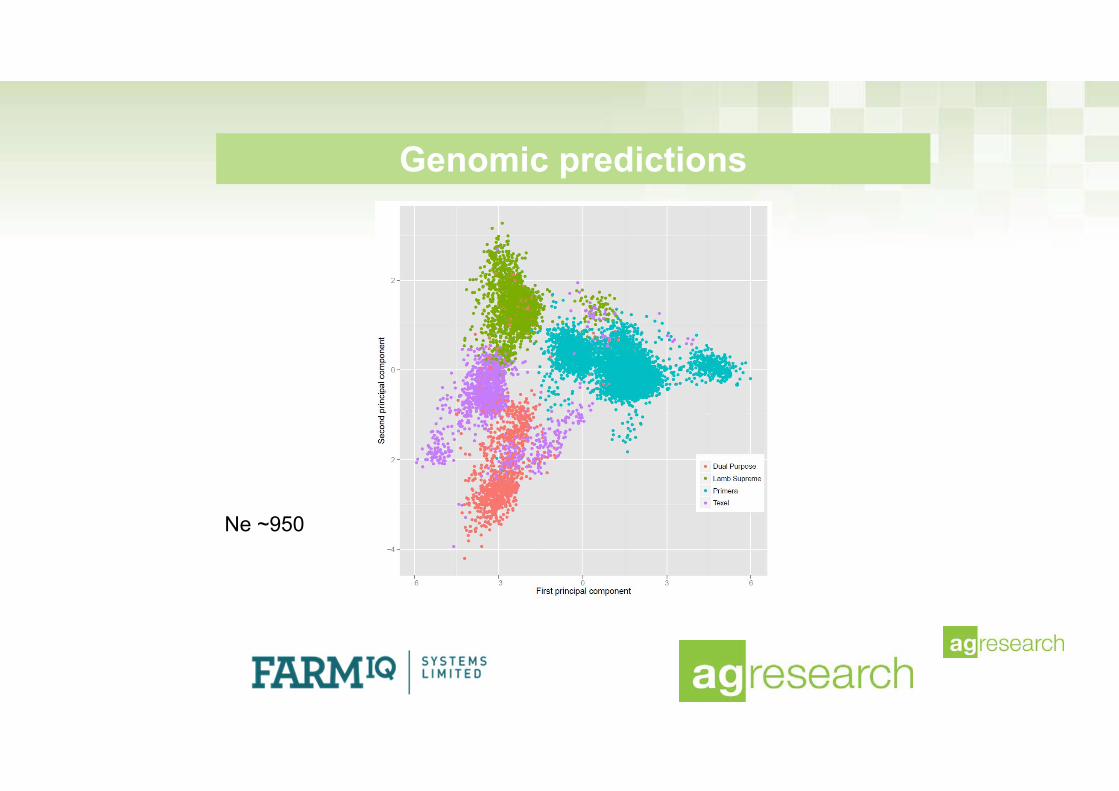
Genomic predictions
Ne ~950
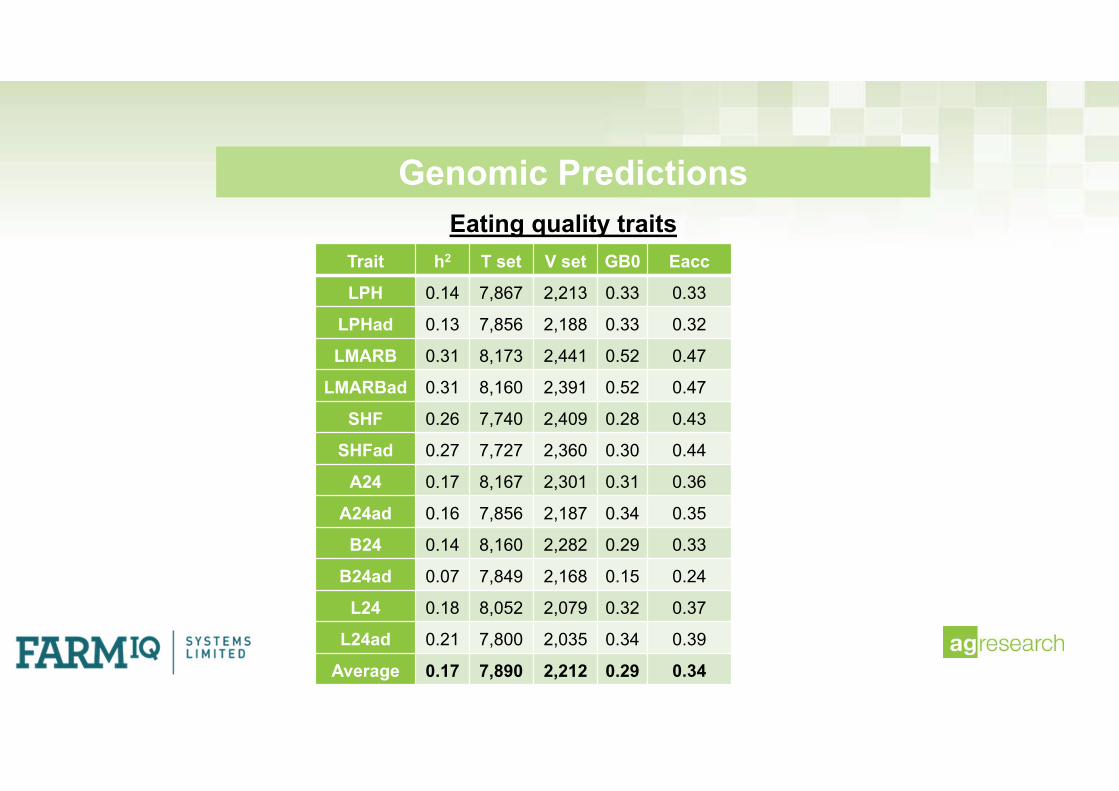
Trait h2 T set V set GB0 Eacc
LPH 0.14 7,867 2,213 0.33 0.33
LPHad 0.13 7,856 2,188 0.33 0.32
LMARB 0.31 8,173 2,441 0.52 0.47
LMARBad 0.31 8,160 2,391 0.52 0.47
SHF 0.26 7,740 2,409 0.28 0.43
SHFad 0.27 7,727 2,360 0.30 0.44
A24 0.17 8,167 2,301 0.31 0.36
A24ad 0.16 7,856 2,187 0.34 0.35
B24 0.14 8,160 2,282 0.29 0.33
B24ad 0.07 7,849 2,168 0.15 0.24
L24 0.18 8,052 2,079 0.32 0.37
L24ad 0.21 7,800 2,035 0.34 0.39
Average 0.17 7,890 2,212 0.29 0.34
Genomic PredictionsEating quality traits

Tenderness (KgF)
Marbling-visual
Colour a (8 weeks 48 h)
Fat depth Eye muscle depth Carcass leg length
Summary
• HD works well high Ne multi-XBreed population
• Benefit mainly in exquisite identification of QTL
• Created 15K chip high imputation accuracy Ventura et al 2015
• Intermediate step imputation to sequence
• 3rd year of beta testing
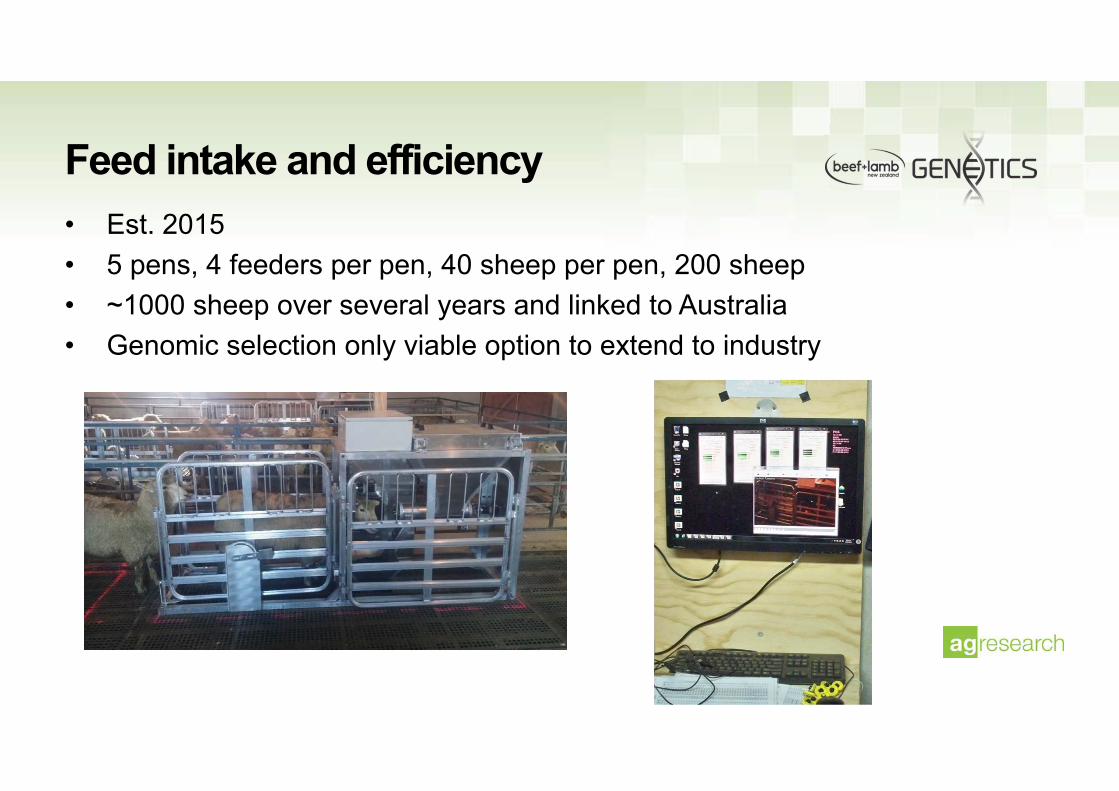
Feed intake and efficiency• Est. 2015• 5 pens, 4 feeders per pen, 40 sheep per pen, 200 sheep• ~1000 sheep over several years and linked to Australia• Genomic selection only viable option to extend to industry

Portable accumulation chambers (PAC)• Measure CH4, CO2 and O2 fluxes ~1hr off pasture• CH4 and (CH4+CO2): heritable, repeatable, high rg across lifetime
• Even after adjustment for liveweight• Predict methane emissions and feed intake cheaply ~10 Euro ~80/day• Measure several times• >7000 measurements, >2500 animals genomic predictions (50K +HD)
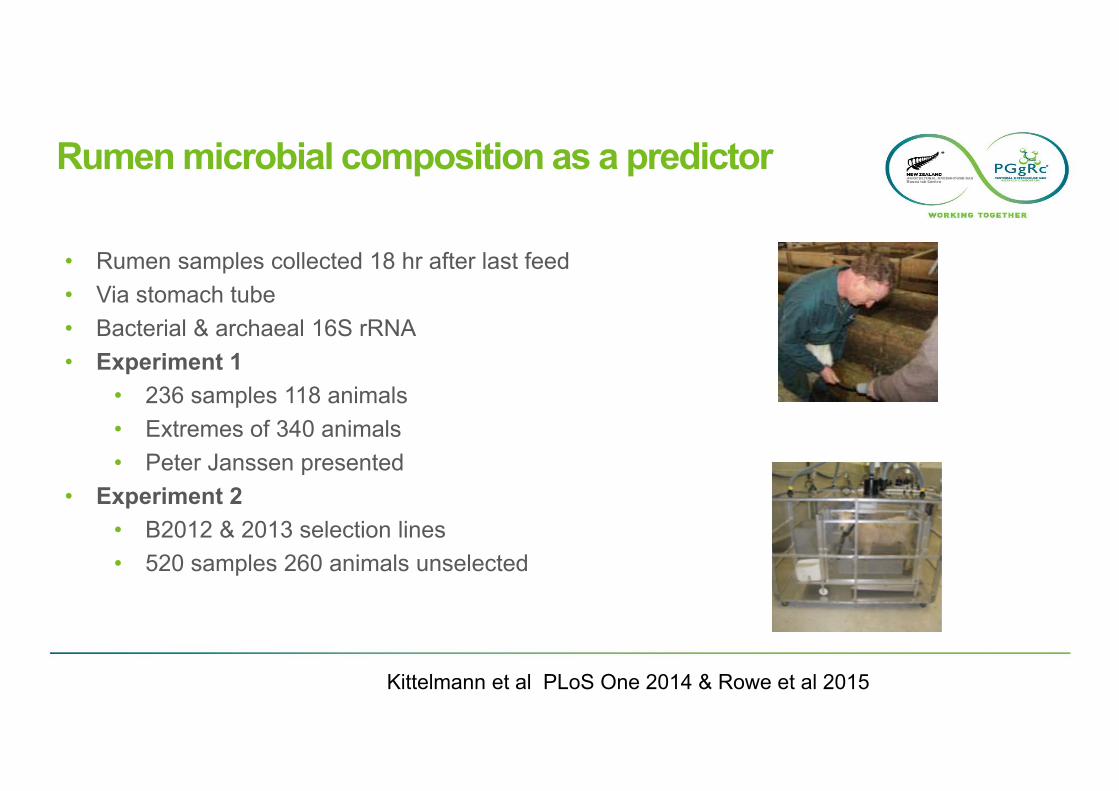
• Rumen samples collected 18 hr after last feed• Via stomach tube• Bacterial & archaeal 16S rRNA• Experiment 1
• 236 samples 118 animals • Extremes of 340 animals• Peter Janssen presented
• Experiment 2• B2012 & 2013 selection lines • 520 samples 260 animals unselected
Rumen microbial composition as a predictor
Kittelmann et al PLoS One 2014 & Rowe et al 2015
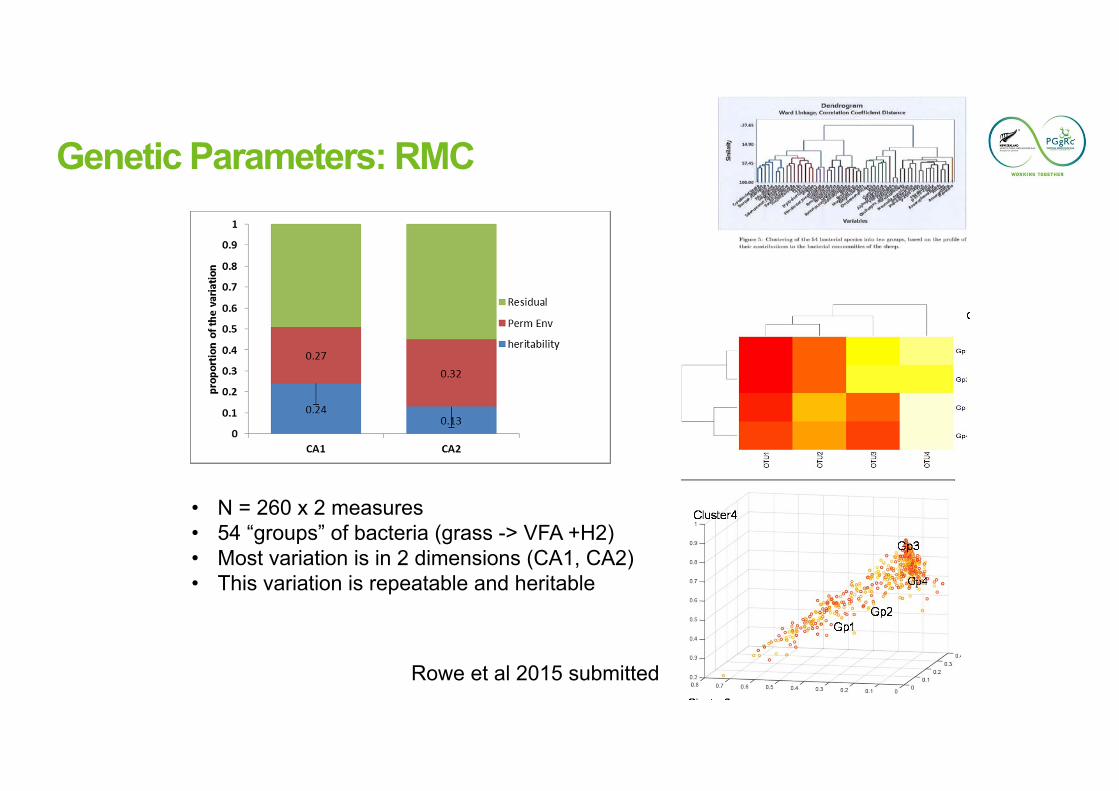
Genetic Parameters: RMC
• N = 260 x 2 measures• 54 “groups” of bacteria (grass -> VFA +H2)• Most variation is in 2 dimensions (CA1, CA2)• This variation is repeatable and heritable
Rowe et al 2015 submitted

RMC Genetic Relationship with Methane
Rowe et al 2015
Evidence suggests genetic relationship RMC and methane traits
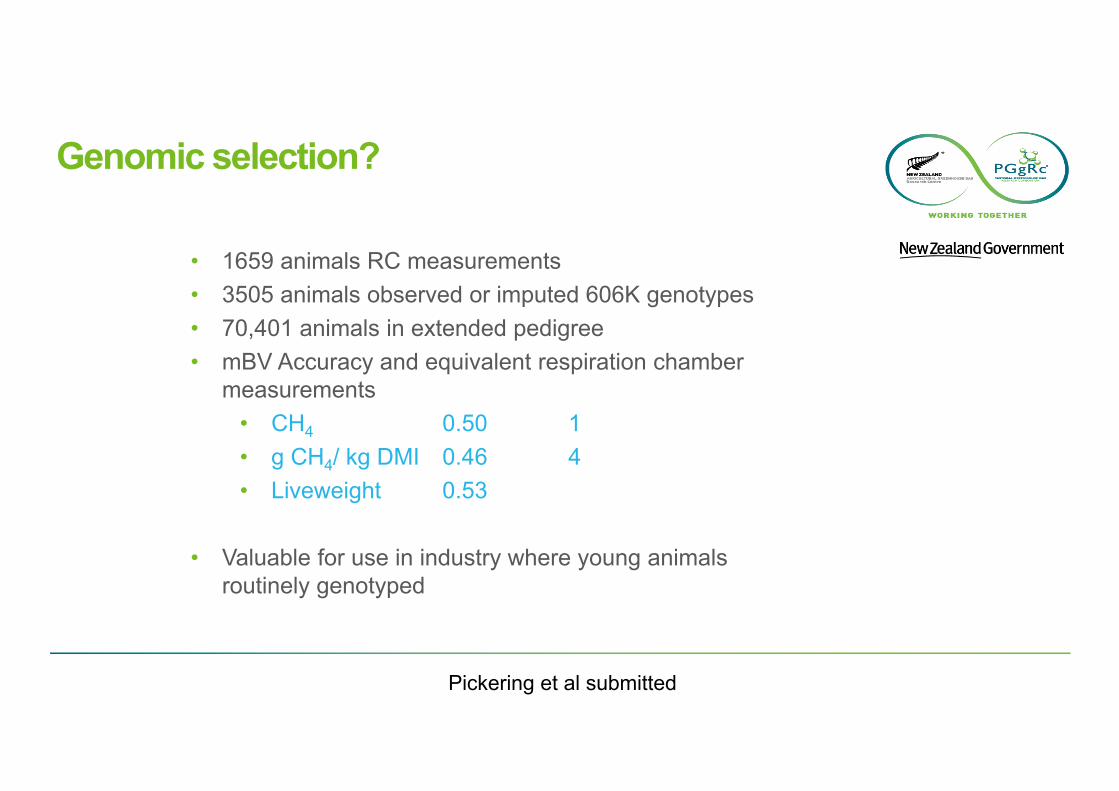
• 1659 animals RC measurements• 3505 animals observed or imputed 606K genotypes• 70,401 animals in extended pedigree• mBV Accuracy and equivalent respiration chamber
measurements • CH4 0.50 1• g CH4/ kg DMI 0.46 4• Liveweight 0.53
• Valuable for use in industry where young animals routinely genotyped
Genomic selection?
Pickering et al submitted

Precision phenotyping• Phenotyping now largest cost & animals in hill country• Difficult to measure: mating & lambing dates, lambing & grazing behaviour• Take advantage of electronics and miniaturisation• Basically put cell phone “fit bit” sensors (GPS, proximity, tilt …) into a tag
• Communicate via distributed wi-fi• Amplify benefits via genomic selection• Power/weight is the current problem

Reduce the generation length!!!• Genomic selection only increases accuracy• However available at a young age!!!
• Potentially before implantation• Take any opportunity to reduce L
• In sheep L= 1 year potentially with JIVET• Use more ram lambs • Use SID AI & “mix of the day”• Better oestrus detection extensive farms• Potential for more than doubling G• Synergistic with precision genomics
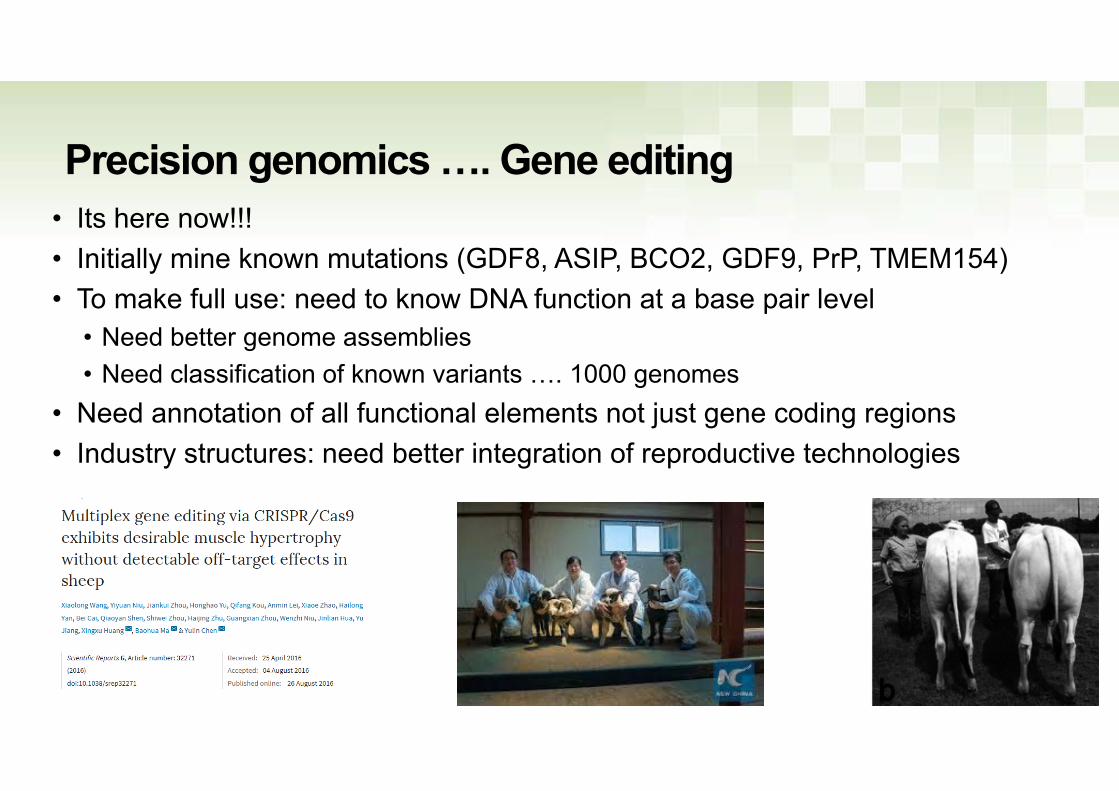
Precision genomics …. Gene editing• Its here now!!! • Initially mine known mutations (GDF8, ASIP, BCO2, GDF9, PrP, TMEM154)• To make full use: need to know DNA function at a base pair level
• Need better genome assemblies• Need classification of known variants …. 1000 genomes
• Need annotation of all functional elements not just gene coding regions• Industry structures: need better integration of reproductive technologies
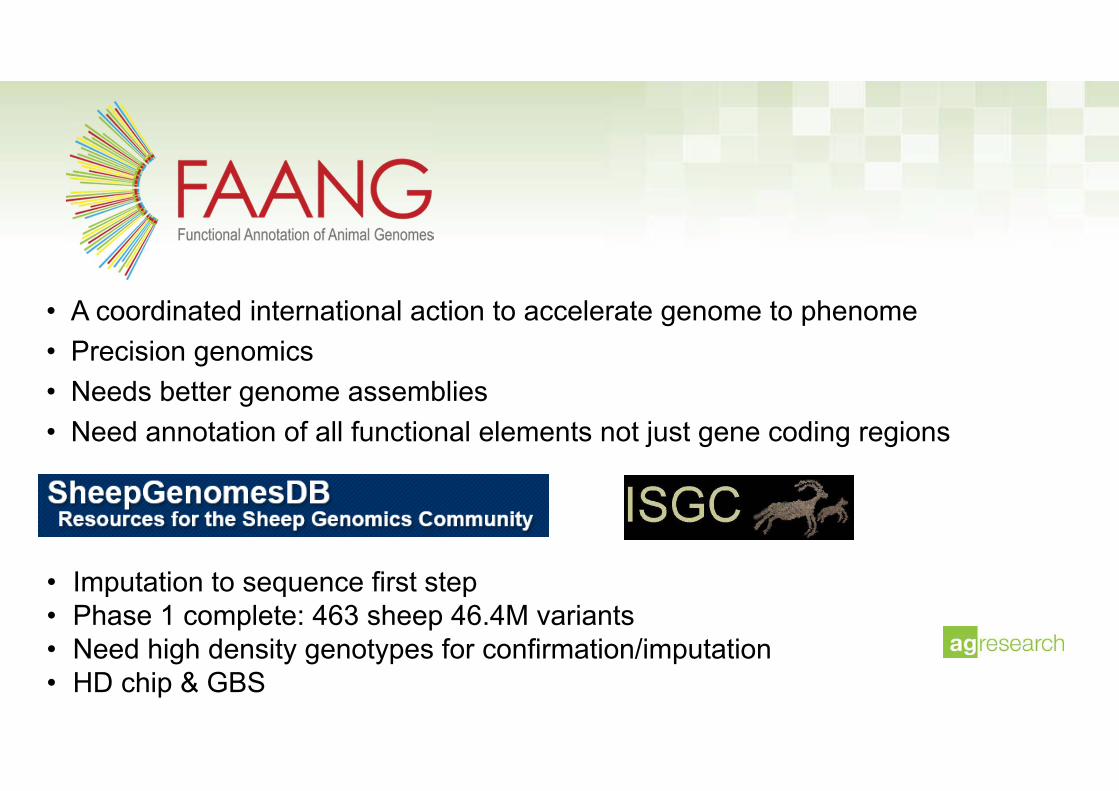
• A coordinated international action to accelerate genome to phenome• Precision genomics • Needs better genome assemblies• Need annotation of all functional elements not just gene coding regions
• Imputation to sequence first step • Phase 1 complete: 463 sheep 46.4M variants• Need high density genotypes for confirmation/imputation• HD chip & GBS
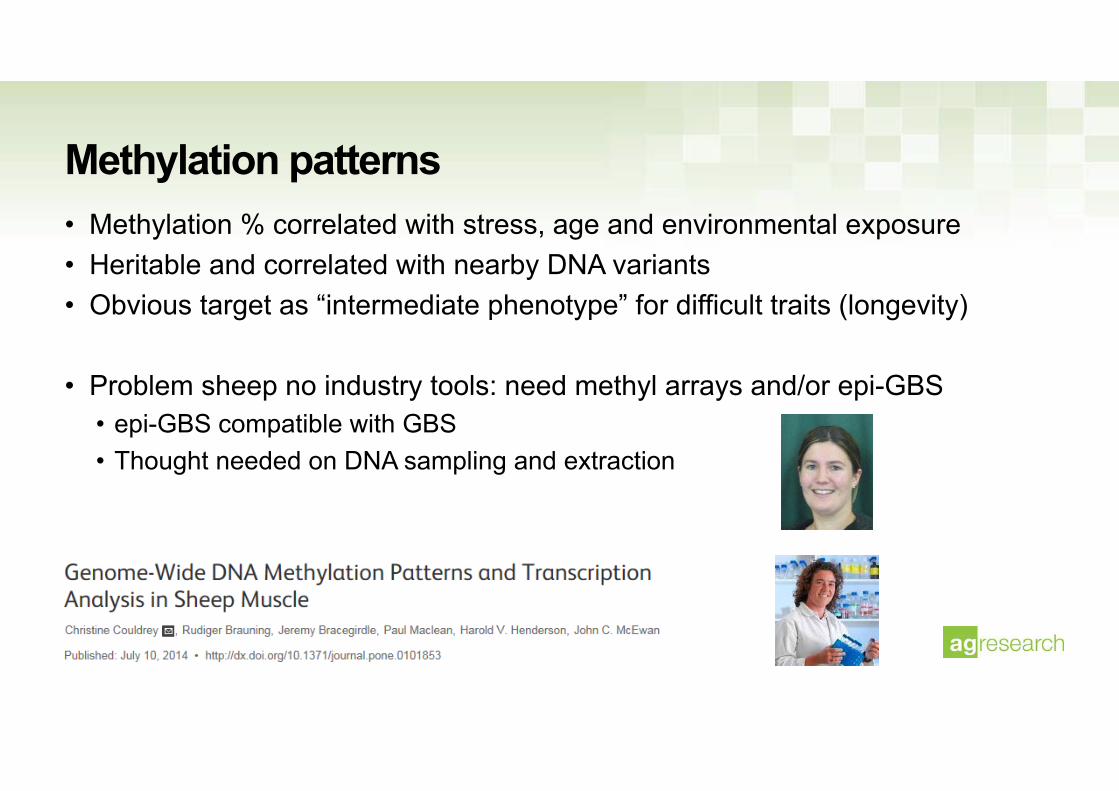
Methylation patterns• Methylation % correlated with stress, age and environmental exposure• Heritable and correlated with nearby DNA variants• Obvious target as “intermediate phenotype” for difficult traits (longevity)
• Problem sheep no industry tools: need methyl arrays and/or epi-GBS• epi-GBS compatible with GBS• Thought needed on DNA sampling and extraction

Conclusions• Shift from DNA parentage to genomic selection for all the ram breeding tier
• Requires <15 Euro/sample for >10,000 SNPs• 2 strategies:
• High throughput low density arrays (+/- imputation)• Genotyping by sequencing no imputation ($ already there for sheep)
• Have to rethink how and what extra traits to measure for maximum benefit• Includes sex limited, late in life, post slaughter & expensive traits
• E.g. maternal weaning weight, ewe longevity, disease resistance, meat eating quality, feed intake, methane• Sustainability and efficiency focus
• generation interval: e.g. JIVET & increased SID AI in stud breeding tier
• Precision genomics (aka gene editing) requires fully annotated genome assemblies. • Hence the FAANG initiative • Interim step is probing intermediate phenotypes via GWAS: epi-GBS and RNAseq• 1000 sheep genomes
KGD
AcknowledgementsGenomics for Production & Security in a Biological Economy
Patricia Johnson (RFI and taggles)Peter Janssen Graham Wood (rumen genomics)L Brito, M Lee (meat quality)
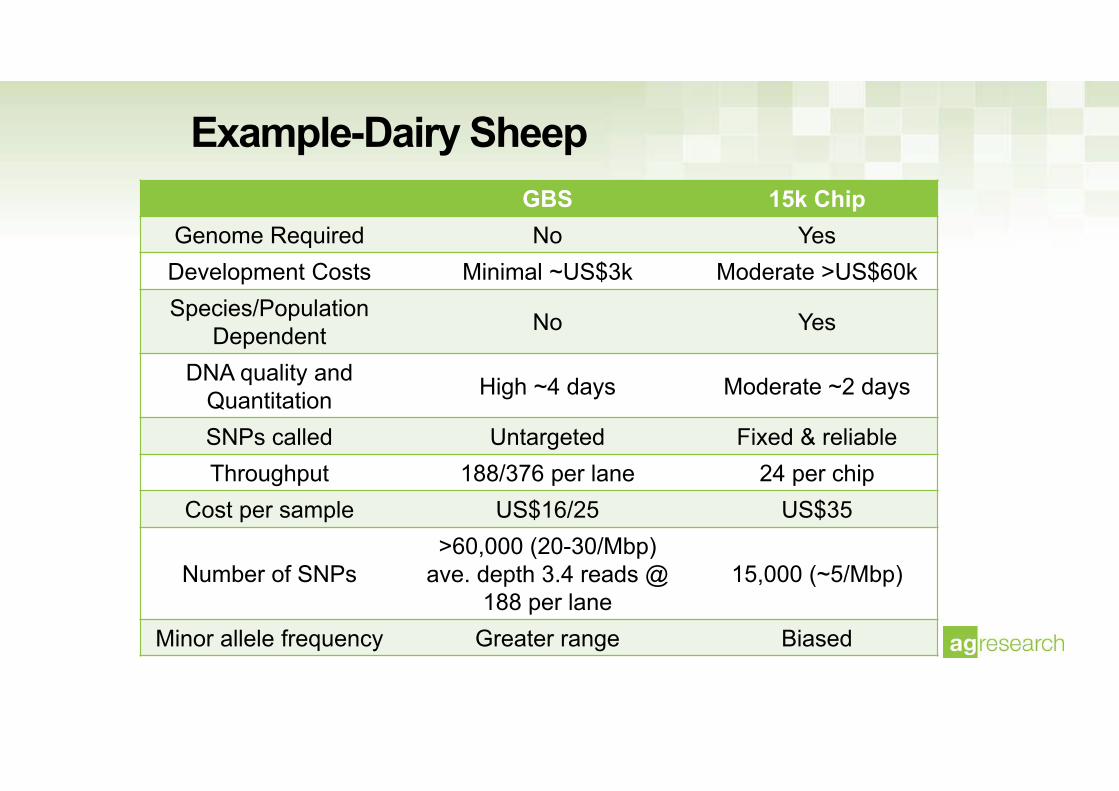
GBS 15k ChipGenome Required No Yes
Development Costs Minimal ~US$3k Moderate >US$60kSpecies/Population
Dependent No Yes
DNA quality and Quantitation High ~4 days Moderate ~2 days
SNPs called Untargeted Fixed & reliableThroughput 188/376 per lane 24 per chip
Cost per sample US$16/25 US$35
Number of SNPs>60,000 (20-30/Mbp)
ave. depth 3.4 reads @ 188 per lane
15,000 (~5/Mbp)
Minor allele frequency Greater range Biased
Example-Dairy Sheep
Back to Sheep…
“Enhanced” parentage chip
Illumina Infinium XT• 96-sample BeadChip
• multispecies • ~800 Parentage SNPs from the 15K chip• Literature SNPs• Enhanced imputation SNPs
Aim is to have all animals in breeding tier genotyped
Contact: [email protected]@agresearch.co.nz