
Genomic data on breast cancer transcript profile ... · modulation by 17beta-hydroxysteroid...
13
Data Article Genomic data on breast cancer transcript profile modulation by 17beta-hydroxysteroid dehydrogenase type 1 and 17-beta-estradiol Juliette A. Aka, Ezequiel-Luis Calvo, Sheng-Xiang Lin n Laboratory of Molecular Endocrinology and Oncology, Centre Hospitalier Universitaire de Québec Research Centre (CHUQ, CHUL) and Department of Molecular Medicine, Laval University, 2705 boulevard Laurier, Québec G1V 4G2, Canada article info Article history: Received 26 October 2016 Accepted 2 November 2016 Available online 9 November 2016 abstract The data presented here are related to the research article entitled “Estradiol-independent modulation of breast cancer transcript profile by 17beta-hydroxysteroid dehydrogenase type 1” (J.A. Aka, E.L. Calvo, S.X. Lin, 2016) [1]. We evaluated the effect of the ster- oidal enzyme 17β-HSD1 and its product, the estrogenic hormone 17-beta-estradiol (E2), on gene transcription profile of breast cancer cells. RNA interference technique was used to knock down the 17β-HSD1 gene (HSD17B1) in the hormone-dependent breast cancer cell line T47D in steroid-deprived medium. Transfected cells were subsequently treated with E2, and microarray analyses (with three contrasts) were used to investigate (i) the effect of 17β-HSD1 expression on breast cancer cell transcript profile in steroid- deprived condition, (ii) the effect of E2 on breast cancer gene expression and (iii) if E2 affects gene regulation by 17β-HSD1. Functional enrichments of the differentially expressed genes were assessed using Ingenuity Pathway Analysis (IPA). Here, we showed data on 140 genes that are induced or repressed 1.5 time or higher (p o 0.05) in the HSD17B1-silenced and E2-treated T47D cells revealed by microarray analysis, and presented the 14 functional terms found in the cancer and in the cell death and survival Contents lists available at ScienceDirect journal homepage: www.elsevier.com/locate/dib Data in Brief http://dx.doi.org/10.1016/j.dib.2016.11.010 2352-3409/& 2016 The Authors. Published by Elsevier Inc. This is an open access article under the CC BY license (http://creativecommons.org/licenses/by/4.0/). DOI of original article: http://dx.doi.org/10.1016/j.jprot.2016.10.001 n Correspondence to: Laboratory of Molecular Endocrinology and Oncology, Axe Molecular Endocrinology and Nephrology, CHUL Research Centre, 2705 Boulevard Laurier, Sainte-Foy, Québec, G1V 4G2 Canada. E-mail addresses: [email protected] (J.A. Aka), [email protected] (S.-X. Lin). Data in Brief 9 (2016) 1000–1012
-
Upload
nguyenxuyen -
Category
Documents
-
view
214 -
download
0
Transcript of Genomic data on breast cancer transcript profile ... · modulation by 17beta-hydroxysteroid...
Contents lists available at ScienceDirect
Data in Brief
Data in Brief 9 (2016) 1000–1012
http://d2352-34(http://c
DOIn Corr
CHUL RE-m
journal homepage: www.elsevier.com/locate/dib
Data Article
Genomic data on breast cancer transcript profilemodulation by 17beta-hydroxysteroiddehydrogenase type 1 and 17-beta-estradiol
Juliette A. Aka, Ezequiel-Luis Calvo, Sheng-Xiang Lin n
Laboratory of Molecular Endocrinology and Oncology, Centre Hospitalier Universitaire de Québec ResearchCentre (CHUQ, CHUL) and Department of Molecular Medicine, Laval University, 2705 boulevard Laurier,Québec G1V 4G2, Canada
a r t i c l e i n f o
Article history:Received 26 October 2016Accepted 2 November 2016Available online 9 November 2016
x.doi.org/10.1016/j.dib.2016.11.01009/& 2016 The Authors. Published by Elsereativecommons.org/licenses/by/4.0/).
of original article: http://dx.doi.org/10.1016espondence to: Laboratory of Molecular Enesearch Centre, 2705 Boulevard Laurier, Saiail addresses: [email protected] (J.A. A
a b s t r a c t
The data presented here are related to the research article entitled“Estradiol-independent modulation of breast cancer transcriptprofile by 17beta-hydroxysteroid dehydrogenase type 1” (J.A. Aka,E.L. Calvo, S.X. Lin, 2016) [1]. We evaluated the effect of the ster-oidal enzyme 17β-HSD1 and its product, the estrogenic hormone17-beta-estradiol (E2), on gene transcription profile of breastcancer cells. RNA interference technique was used to knock downthe 17β-HSD1 gene (HSD17B1) in the hormone-dependent breastcancer cell line T47D in steroid-deprived medium. Transfected cellswere subsequently treated with E2, and microarray analyses (withthree contrasts) were used to investigate (i) the effect of 17β-HSD1expression on breast cancer cell transcript profile in steroid-deprived condition, (ii) the effect of E2 on breast cancer geneexpression and (iii) if E2 affects gene regulation by 17β-HSD1.Functional enrichments of the differentially expressed genes wereassessed using Ingenuity Pathway Analysis (IPA). Here, we showeddata on 140 genes that are induced or repressed 1.5 time or higher(p o 0.05) in the HSD17B1-silenced and E2-treated T47D cellsrevealed by microarray analysis, and presented the 14 functionalterms found in the cancer and in the cell death and survival
vier Inc. This is an open access article under the CC BY license
/j.jprot.2016.10.001docrinology and Oncology, Axe Molecular Endocrinology and Nephrology,nte-Foy, Québec, G1V 4G2 Canada.ka), [email protected] (S.-X. Lin).

SM
TH
DE
E
D
D
J.A. Aka et al. / Data in Brief 9 (2016) 1000–1012 1001
categories revealed by the IPA biological function analysis. Data onIPA Canonical Pathway and network analyses is also presented.Further discussion on gene regulation by 17β-HSD1 and E2 isprovided in the accompanying publication [1].
& 2016 The Authors. Published by Elsevier Inc. This is an openaccess article under the CC BY license
(http://creativecommons.org/licenses/by/4.0/).
Specifications Table
ubject area
Biology ore specificsubject areaBreast cancer
ype of data
Table, Figure ow data wasacquiredMicroarray analysis: microarray was processed using Affymetrix GeneChipWhole Transcript (WT) Sense Target Labeling Assay and quantified Affymetriximage files were analyzed using the Bioconductor package OneChannelGUIinto the statistical software environment R.Bioinformatics analysis: functional enrichment analysis was done using thegene list from the microarray analysis and Ingenuity pathway core analysis(IPA
s
, QIAGEN Redwood City).
ata format Analyzed and filtered data xperimentalfactorsT47D cells were transfected with 17β-HSD1 siRNAs followed by estradioltreatment two days later for an additional two days, and total RNA wasextracted for analysis.
xperimentalfeatures
3�105 T47D cells were transfected in 6-well plates in charcoal-treatedmedium with 200 nM mixed 17β-HSD1 specific siRNAs or with negativecontrol siRNA. Two days later, transfected cells were treated with 1 nMestradiol or ethanol as a vehicle control in fresh charcoal-treated medium andcells were incubated for two additional days before RNA extraction andanalysis.
ata sourcelocation
N/A
ata accessibility
Data is available within this article and available at the NCBI database via GeneExpression Omnibus (GEO accession number GSE77345).Value of the data
� Provide information on genes regulated by 17β-HSD1 and its product estradiol, useful for furtherstudies on breast cancer cell mechanisms.
� Can contribute to elucidate hormone-independent cell growth pathways in hormone-dependentbreast cancer cells.
� May stimulate further research on understanding 17β-HSD1 roles in breast cancer development.
1. Data
Table 1 showed data on gene expression profile in T47D cells (genes regulated 1.5 time or higher)transfected with 17β-HSD1 siRNAs (si17B1) or negative control siRNA (NC), and treated with 1 nM

Table 1List of the 140 genes induced or repressed 1.5 time or higher (po0.05) in T47D cells after transfection with 17β-HSD1 siRNAs(si17B1) or negative control siRNA (NC) for two days and cell treatment with 1 nM estradiol (E2). Data was obtained frommicroarray analysis using contrast NCþE2 vs. si17B1þE2 (see Table 5).
Symbol Description Fold change
CDH10 Cadherin 10, type 2 (T2-cadherin) 5,2IFI44 Interferon-induced protein 44 4,7IFIT2 Interferon-induced protein with tetratricopeptide repeats 2 4,6IFIT3 Interferon-induced protein with tetratricopeptide repeats 3 4,4RSAD2 Radical S-adenosyl methionine domain containing 2 4,3DDX60L DEAD (Asp-Glu-Ala-Asp) box polypeptide 60-like 4,0CCL5 Chemokine (C-C motif) ligand 5 3,4IFIT1 Interferon-induced protein with tetratricopeptide repeats 1 3,4ARL4D ADP-ribosylation factor-like 4D 3,3NAALADL2 N-acetylated alpha-linked acidic dipeptidase-like 2 3,2BTN3A2 Butyrophilin, subfamily 3, member A2 3,1LBA1 Lupus brain antigen 1 3,1DDX60 DEAD (Asp-Glu-Ala-Asp) box polypeptide 60 3,0XAF1 XIAP associated factor 1 2,9MDGA2 MAM domain containing glycosylphosphatidylinositol anchor 2 2,9OAS2 2'-5'-oligoadenylate synthetase 2, 69/71 kDa 2,9RARRES3 Retinoic acid receptor responder (tazarotene induced) 2,9HCP5 HLA complex P5 2,9OASL 2'-5'-oligoadenylate synthetase-like 2,9PARP14 Poly (ADP-ribose) polymerase family, member 14 2,8IFITM3 Interferon induced transmembrane protein 3 (1-8U) 2,8LAMP3 Lysosomal-associated membrane protein 3 2,7AKAP6 A kinase (PRKA) anchor protein 6 2,7PSMB9 Proteasome subunit beta type-9 2,7BTN3A1 Butyrophilin, subfamily 3, member A1 2,7RANBP3L RAN binding protein 3-like 2,6HLA-F Major histocompatibility complex, class I, F 2,5IFITM1 Interferon induced transmembrane protein 1 (9–27) 2,5DDX58 DEAD (Asp–Glu–Ala–Asp) box polypeptide 58 2,5BTN3A3 Butyrophilin, subfamily 3, member A3 2,5ERBB4 V-erb-a erythroblastic leukemia viral oncogene homolog 4 (avian) 2,5HLA-H Major histocompatibility complex, class I, H (pseudogene) 2,4HLA-A Major histocompatibility complex, class I, A 2,4PARP9 Poly (ADP-ribose) polymerase family, member 9 2,4HLA-C Major histocompatibility complex, class I, C 2,3CTSO Cathepsin O 2,3L3MBTL3 L(3)mbt-like 3 (Drosophila) 2,3HLA-E Major histocompatibility complex, class I, E 2,3IFI35 Interferon-induced protein 35 2,3HLA-B Major histocompatibility complex, class I, B 2,3APOL1 Apolipoprotein L, 1 2,3HLA-G Major histocompatibility complex, class I, G 2,3HERC6 Hect domain and RLD 6 2,2HERC5 Hect domain and RLD 5 2,2IFIH1 Interferon induced with helicase C domain 1 2,2SLC46A3 Solute carrier family 46, member 3 2,2VGLL1 Vestigial like 1 (Drosophila) 2,2TAP1 Transporter 1, ATP-binding cassette, sub-family B (MDR/TAP) 2,2FGF12 Fibroblast growth factor 12 2,2PLSCR1 Phospholipid scramblase 1 2,2HLA-A29,1 Major histocompatibility complex class I HLA-A29,1 2,2LGALS3BP Lectin, galactoside-binding, soluble, 3 binding protein 2,2SAMD9 Sterile alpha motif domain containing 9 2,2ATP1B1 Atpase, Naþ/Kþ transporting, beta 1 polypeptide 2,1OAS1 2',5'-oligoadenylate synthetase 1, 40/46kda 2,1PSMB8 Proteasome subunit beta type-9 2,1OAS3 2'-5'-oligoadenylate synthetase 3, 100kda 2,1CENTD1 Centaurin, delta 1 2,1
J.A. Aka et al. / Data in Brief 9 (2016) 1000–10121002

Table 1 (continued )
Symbol Description Fold change
IFI27 Interferon, alpha-inducible protein 27 2,1DHX58 DEXH (Asp–Glu–X-His) box polypeptide 58 2,1STAT2 Signal transducer and activator of transcription 2, 113kda 2,0LAMC1 Laminin, gamma 1 (formerly LAMB2) 2,0THSD7A Thrombospondin, type I, domain containing 7A 2,0TGFB2 Transforming growth factor, beta 2 2,0USP18 Ubiquitin specific peptidase 18 2,0MX1 Interferon-induced GTP-binding protein Mx1 2,0B2M Beta-2-microglobulin 2,0DTX3L Deltex 3-like (Drosophila) 2,0ERAP1 Endoplasmic reticulum aminopeptidase 1 2,0SLC15A3 Solute carrier family 15, member 3 1,9CFB /// C2 Complement factor B /// complement component 2 1,9TNFSF10 Tumor necrosis factor (ligand) superfamily, member 10 1,9ROBO2 Roundabout homolog 2 1,9IL1R1 Interleukin 1 receptor, type I 1,9RAB27B RAB27B, member RAS oncogene family 1,9RTP4 Receptor (chemosensory) transporter protein 4 1,9STAT1 Signal transducer and activator of transcription 1, 91kda 1,9CASP4 Caspase 4, apoptosis-related cysteine peptidase 1,9INSIG2 Insulin induced gene 2 1,9DKFZP434B2016 Similar to hypothetical protein LOC284701 1,9SMARCA1 Nucleosome-remodeling factor subunit SNF2L 1,8LIPH Lipase, member H 1,8ZNFX1 Zinc finger, NFX1-type containing 1 1,8UBP1 Upstream binding protein 1 (LBP-1a) 1,8KLF8 Kruppel-like factor 8 1,8LRRK2 Leucine-rich repeat kinase 2 1,8LTBP1 Latent transforming growth factor beta binding protein 1 1,8EVI1 Ecotropic viral integration site 1 1,8FBXO32 F-box protein 32 1,7BCAS1 Breast carcinoma amplified sequence 1 1,7ALCAM Activated leukocyte cell adhesion molecule 1,7MTERFD3 MTERF domain containing 3 1,6MMP16 Matrix metallopeptidase 16 1,6LOC390345 Similar to ribosomal protein L10 1,6CITED2 Cbp/p300-interacting transactivator with Glu/Asp-rich carboxy-terminal domain 2 1,6CYP4Z2P Cytochrome P450, family 4, subfamily Z, polypeptide 2 pseudogene 1,6RNF43 Ring finger protein 43 1,6ZNF175 Zinc finger protein 175 1,5SEPP1 Selenoprotein P, plasma, 1 1,5EPAS1 Endothelial PAS domain protein 1 1,5FAM115A Family with sequence similarity 115, member A 1,5SEMA6A Semaphorin 6A 1,5NBEA Neurobeachin 1,5CSAD Cysteine sulfinic acid decarboxylase 1,5SNX24 Sorting nexin 24 �1,5RBBP8 Retinoblastoma binding protein 8 �1,5PTTG1 Pituitary tumor-transforming 1 �1,5ELOVL2 Elongation of very long chain fatty acids protein 2 �1,5KCTD6 Potassium channel tetramerisation domain containing 6 �1,5AURKA Aurora kinase A �1,5KIF18A Kinesin family member 18A �1,5ARHGAP11A Rho GTPase activating protein 11A �1,5CDKN3 Cyclin-dependent kinase inhibitor 3 �1,5PRR11 Proline rich 11 �1,5C13orf3 Chromosome 13 open reading frame 3 �1,5SPAG5 Sperm associated antigen 5 �1,6CA8 Carbonic anhydrase VIII �1,6PLK1 Polo-like kinase 1 (Drosophila) �1,6SGOL1 Shugoshin-like 1 (S, pombe) �1,6
J.A. Aka et al. / Data in Brief 9 (2016) 1000–1012 1003

Table 1 (continued )
Symbol Description Fold change
CCNA2 Cyclin A2 �1,6CDC20 Cell division cycle 20 �1,6NUF2 NUF2, NDC80 kinetochore complex component �1,6KIF20A Kinesin family member 20A �1,6ANP32E Acidic (leucine-rich) nuclear phosphoprotein 32 family, member E �1,7RPL22 Ribosomal protein L22 �1,7PBK PDZ binding kinase �1,7PTGES Prostaglandin E synthase �1,7HEY2 Hairy/enhancer-of-split related with YRPW motif 2 �1,8SNORD27 Small nucleolar RNA, C/D box 27 �1,8SLC47A1 Solute carrier family 47, member 1 �1,8ESCO2 Establishment of sister chromatid cohesion N-acetyltransferase 2 �1,9C14orf129 Chromosome 14 open reading frame 129 �1,9FLNA Filamin A, alpha (actin binding protein 280) �1,9CTSD Cathepsin D �2,0RBM24 RNA binding motif protein 24 �2,0POLE3 Polymerase (DNA directed), epsilon 3 (p17 subunit) �2,1LOC440093 Histone H3-like �2,2AHNAK2 AHNAK nucleoprotein 2 �2,2AREG Amphiregulin �2,3RCN2 Reticulocalbin 2, EF-hand calcium binding domain �2,3
Table 2The 14 functional terms found in the cancer category of the IPA biological function analysis of208 genes regulated by 17β-HSD1 and/or estradiol in T47D cells.
Number Functional term
1 Cancer2 Breast cancer3 Delay in tumorigenesis4 Growth of tumor5 Incidence of tumor6 Mammary tumor7 Neoplasia of tumor cell lines8 Triple-negative breast cancer9 Tumorigenesis of breast cancer cell lines10 Tumorigenesis of cells11 Tumorigenesis of mammary
adenocarcinoma12 Tumorigenesis of mammary gland13 Tumorigenesis of mammary tumor14 Tumorigenesis of tumor cell lines
J.A. Aka et al. / Data in Brief 9 (2016) 1000–10121004
estradiol (E2), revealed by microarray analysis with contrast NCþE2 vs. si17B1þE2 (see Table 5 foradditional information). Table 2 showed the 14 functional terms found in the cancer category of theIPA biological function analysis of 208 genes from three fold change lists (genes which fold changeequal or higher than 1.5 in at least one contrast), generated by the three contrasts (NC vs. si17B1; NCvs. NCþE2; and NCþE2 vs. si17B1þE2) of microarray analyses (see Table 5 for contrast description).Table 3 showed the 14 functional terms found in the cell death and survival category of the IPAbiological function analysis of 208 genes generated by the three contrasts of microarray analyses.Table 4 showed data on the IPA network analysis of 208 genes from the three contrasts (NC vs. si17B1;

Table 3The 14 functional terms found in the cell death and survival category of the IPA Biologicalfunction analysis of 208 genes regulated by 17β-HSD1 and/or estradiol in T47D cells.
Number Functional term
1 Apoptosis2 Apoptosis of breast cancer cell lines3 Apoptosis of breast cell lines4 Apoptosis of mammary epithelial cells5 Apoptosis of mammary tumor cells6 Apoptosis of tumor cell lines7 Cell death8 Cell death of tumor cell lines9 Cell survival10 Cell viability11 Cytotoxicity of cells12 Cytotoxicity of cytotoxic T cells13 Cytotoxicity of T lymphocytes14 Necrosis
J.A. Aka et al. / Data in Brief 9 (2016) 1000–1012 1005
NC vs. NCþE2; and NCþE2 vs. si17B1þE2) of the microarray analysis. Figs. 1–4 showed IPA Canonicalpathway analyses for interferon signaling pathway in the NC vs. NCþE2 contrast (Fig. 1), antigenpresentation pathway in the NC vs. si17B1 contrast (Fig. 2), antigen presentation pathway in the NC vs.NCþE2 contrast (Fig. 3), and role of BRCA1 in DNA damage response in the NC vs. NCþE2 contrast(Fig. 4).
2. Experimental design, materials and methods
2.1. Cell culture, siRNA transfections, steroid treatment and RNA preparation
T47D cells were obtained from the American Type Culture Collection (ATCC) and were cultured asdescribed in ref [1]. The detailed procedure of siRNA transfections, steroid treatment and RNA pre-paration have been described in ref [1]. Briefly, two days before transfection, T47D cells were culturedin dextran-coated charcoal-treated medium; on the transfection day, 3�105 cells were reverse-transfected in 6-well plates with 200 nM mixed 17β-HSD1 specific siRNAs [2,3] (si17B1) or withScramble siRNA used as negative control siRNA (NC) using Lipofectamine siRNAMax (Invitrogen), andcells were incubated in steroid deprived medium. Two days after transfection, cell culture media werereplaced by fresh charcoal-treated medium containing either the steroid estradiol (1 nM) or ethanolas a vehicle control (see Table 5), and cells were incubated for two more days before RNA extractionusing Trizol Reagent (Invitogen). The RNA samples included two independent biological replicates,coming from two independent cell culture experiments, for a total of eight RNA samples.
2.2. Microarray processing
RNA samples were processed according to the manufacturer's recommended procedures onGeneChip Whole Transcript (WT) Sense Target Labeling Assay from Affymetrix (http://www.affymetrix.com/support/downloads/manuals/wt_sensetarget_label_manual.pdf). The assay was started with0.2 mg of each T47D cells RNA samples and the protocol is based on the principle of performing onecycle of cDNA synthesis and in vitro transcription (IVT) for target amplification to generate cRNAfollowing by reverse transcription reactions to synthesis the WT cDNA. About 2.7 mg sample of
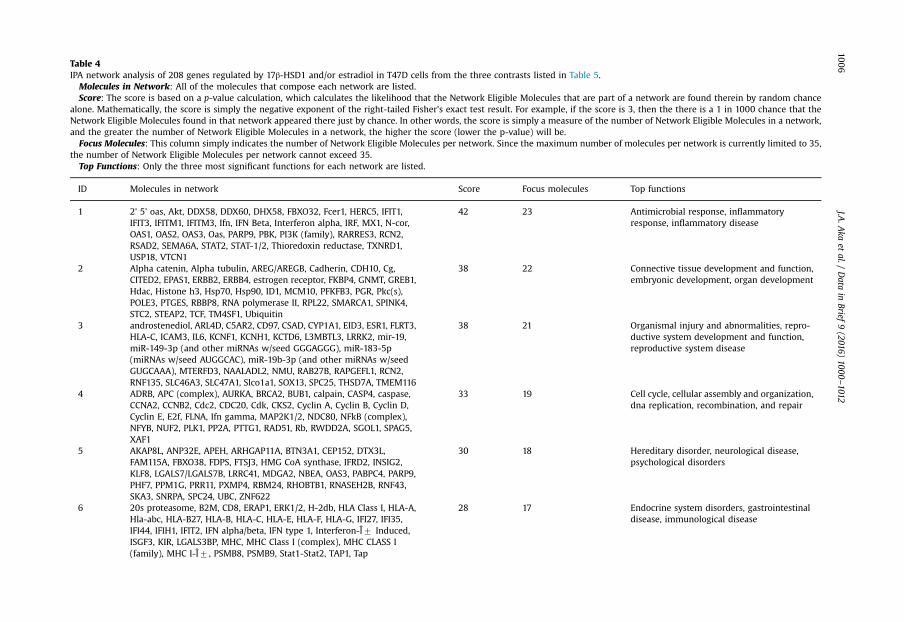
Table 4IPA network analysis of 208 genes regulated by 17β-HSD1 and/or estradiol in T47D cells from the three contrasts listed in Table 5.
Molecules in Network: All of the molecules that compose each network are listed.Score: The score is based on a p-value calculation, which calculates the likelihood that the Network Eligible Molecules that are part of a network are found therein by random chance
alone. Mathematically, the score is simply the negative exponent of the right-tailed Fisher's exact test result. For example, if the score is 3, then the there is a 1 in 1000 chance that theNetwork Eligible Molecules found in that network appeared there just by chance. In other words, the score is simply a measure of the number of Network Eligible Molecules in a network,and the greater the number of Network Eligible Molecules in a network, the higher the score (lower the p-value) will be.
Focus Molecules: This column simply indicates the number of Network Eligible Molecules per network. Since the maximum number of molecules per network is currently limited to 35,the number of Network Eligible Molecules per network cannot exceed 35.
Top Functions: Only the three most significant functions for each network are listed.
ID Molecules in network Score Focus molecules Top functions
1 2' 5' oas, Akt, DDX58, DDX60, DHX58, FBXO32, Fcer1, HERC5, IFIT1,IFIT3, IFITM1, IFITM3, Ifn, IFN Beta, Interferon alpha, IRF, MX1, N-cor,OAS1, OAS2, OAS3, Oas, PARP9, PBK, PI3K (family), RARRES3, RCN2,RSAD2, SEMA6A, STAT2, STAT-1/2, Thioredoxin reductase, TXNRD1,USP18, VTCN1
42 23 Antimicrobial response, inflammatoryresponse, inflammatory disease
2 Alpha catenin, Alpha tubulin, AREG/AREGB, Cadherin, CDH10, Cg,CITED2, EPAS1, ERBB2, ERBB4, estrogen receptor, FKBP4, GNMT, GREB1,Hdac, Histone h3, Hsp70, Hsp90, ID1, MCM10, PFKFB3, PGR, Pkc(s),POLE3, PTGES, RBBP8, RNA polymerase II, RPL22, SMARCA1, SPINK4,STC2, STEAP2, TCF, TM4SF1, Ubiquitin
38 22 Connective tissue development and function,embryonic development, organ development
3 androstenediol, ARL4D, C5AR2, CD97, CSAD, CYP1A1, EID3, ESR1, FLRT3,HLA-C, ICAM3, IL6, KCNF1, KCNH1, KCTD6, L3MBTL3, LRRK2, mir-19,miR-149-3p (and other miRNAs w/seed GGGAGGG), miR-183-5p(miRNAs w/seed AUGGCAC), miR-19b-3p (and other miRNAs w/seedGUGCAAA), MTERFD3, NAALADL2, NMU, RAB27B, RAPGEFL1, RCN2,RNF135, SLC46A3, SLC47A1, Slco1a1, SOX13, SPC25, THSD7A, TMEM116
38 21 Organismal injury and abnormalities, repro-ductive system development and function,reproductive system disease
4 ADRB, APC (complex), AURKA, BRCA2, BUB1, calpain, CASP4, caspase,CCNA2, CCNB2, Cdc2, CDC20, Cdk, CKS2, Cyclin A, Cyclin B, Cyclin D,Cyclin E, E2f, FLNA, Ifn gamma, MAP2K1/2, NDC80, NFkB (complex),NFYB, NUF2, PLK1, PP2A, PTTG1, RAD51, Rb, RWDD2A, SGOL1, SPAG5,XAF1
33 19 Cell cycle, cellular assembly and organization,dna replication, recombination, and repair
5 AKAP8L, ANP32E, APEH, ARHGAP11A, BTN3A1, CEP152, DTX3L,FAM115A, FBXO38, FDPS, FTSJ3, HMG CoA synthase, IFRD2, INSIG2,KLF8, LGALS7/LGALS7B, LRRC41, MDGA2, NBEA, OAS3, PABPC4, PARP9,PHF7, PPM1G, PRR11, PXMP4, RBM24, RHOBTB1, RNASEH2B, RNF43,SKA3, SNRPA, SPC24, UBC, ZNF622
30 18 Hereditary disorder, neurological disease,psychological disorders
6 20s proteasome, B2M, CD8, ERAP1, ERK1/2, H-2db, HLA Class I, HLA-A,Hla-abc, HLA-B27, HLA-B, HLA-C, HLA-E, HLA-F, HLA-G, IFI27, IFI35,IFI44, IFIH1, IFIT2, IFN alpha/beta, IFN type 1, Interferon-Î7 Induced,ISGF3, KIR, LGALS3BP, MHC, MHC Class I (complex), MHC CLASS I(family), MHC I-Î7 , PSMB8, PSMB9, Stat1-Stat2, TAP1, Tap
28 17 Endocrine system disorders, gastrointestinaldisease, immunological disease
J.A.A
kaet
al./Data
inBrief
9(2016)
1000–1012
1006
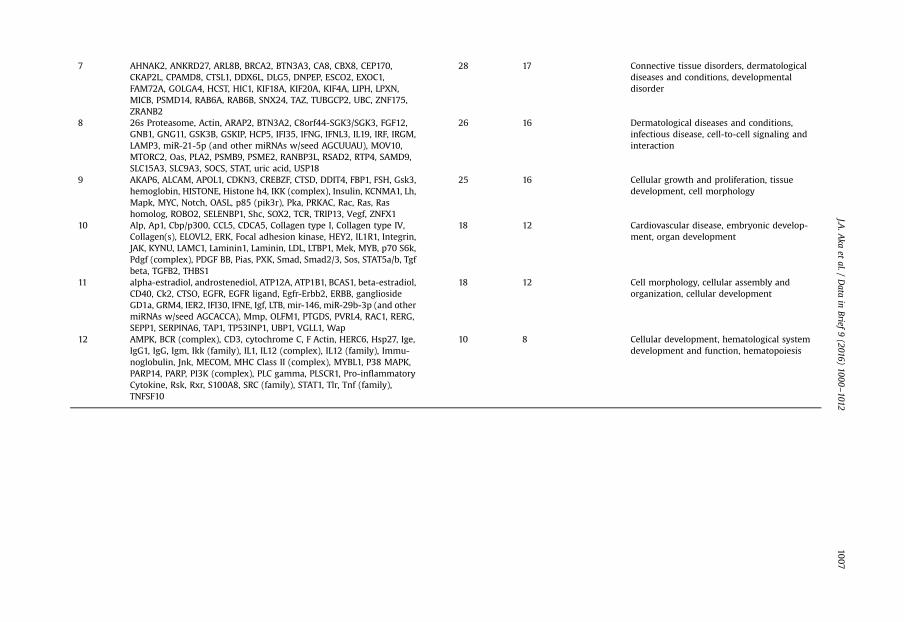
7 AHNAK2, ANKRD27, ARL8B, BRCA2, BTN3A3, CA8, CBX8, CEP170,CKAP2L, CPAMD8, CTSL1, DDX6L, DLG5, DNPEP, ESCO2, EXOC1,FAM72A, GOLGA4, HCST, HIC1, KIF18A, KIF20A, KIF4A, LIPH, LPXN,MICB, PSMD14, RAB6A, RAB6B, SNX24, TAZ, TUBGCP2, UBC, ZNF175,ZRANB2
28 17 Connective tissue disorders, dermatologicaldiseases and conditions, developmentaldisorder
8 26s Proteasome, Actin, ARAP2, BTN3A2, C8orf44-SGK3/SGK3, FGF12,GNB1, GNG11, GSK3B, GSKIP, HCP5, IFI35, IFNG, IFNL3, IL19, IRF, IRGM,LAMP3, miR-21-5p (and other miRNAs w/seed AGCUUAU), MOV10,MTORC2, Oas, PLA2, PSMB9, PSME2, RANBP3L, RSAD2, RTP4, SAMD9,SLC15A3, SLC9A3, SOCS, STAT, uric acid, USP18
26 16 Dermatological diseases and conditions,infectious disease, cell-to-cell signaling andinteraction
9 AKAP6, ALCAM, APOL1, CDKN3, CREBZF, CTSD, DDIT4, FBP1, FSH, Gsk3,hemoglobin, HISTONE, Histone h4, IKK (complex), Insulin, KCNMA1, Lh,Mapk, MYC, Notch, OASL, p85 (pik3r), Pka, PRKAC, Rac, Ras, Rashomolog, ROBO2, SELENBP1, Shc, SOX2, TCR, TRIP13, Vegf, ZNFX1
25 16 Cellular growth and proliferation, tissuedevelopment, cell morphology
10 Alp, Ap1, Cbp/p300, CCL5, CDCA5, Collagen type I, Collagen type IV,Collagen(s), ELOVL2, ERK, Focal adhesion kinase, HEY2, IL1R1, Integrin,JAK, KYNU, LAMC1, Laminin1, Laminin, LDL, LTBP1, Mek, MYB, p70 S6k,Pdgf (complex), PDGF BB, Pias, PXK, Smad, Smad2/3, Sos, STAT5a/b, Tgfbeta, TGFB2, THBS1
18 12 Cardiovascular disease, embryonic develop-ment, organ development
11 alpha-estradiol, androstenediol, ATP12A, ATP1B1, BCAS1, beta-estradiol,CD40, Ck2, CTSO, EGFR, EGFR ligand, Egfr-Erbb2, ERBB, gangliosideGD1a, GRM4, IER2, IFI30, IFNE, Igf, LTB, mir-146, miR-29b-3p (and othermiRNAs w/seed AGCACCA), Mmp, OLFM1, PTGDS, PVRL4, RAC1, RERG,SEPP1, SERPINA6, TAP1, TP53INP1, UBP1, VGLL1, Wap
18 12 Cell morphology, cellular assembly andorganization, cellular development
12 AMPK, BCR (complex), CD3, cytochrome C, F Actin, HERC6, Hsp27, Ige,IgG1, IgG, Igm, Ikk (family), IL1, IL12 (complex), IL12 (family), Immu-noglobulin, Jnk, MECOM, MHC Class II (complex), MYBL1, P38 MAPK,PARP14, PARP, PI3K (complex), PLC gamma, PLSCR1, Pro-inflammatoryCytokine, Rsk, Rxr, S100A8, SRC (family), STAT1, Tlr, Tnf (family),TNFSF10
10 8 Cellular development, hematological systemdevelopment and function, hematopoiesis
J.A.A
kaet
al./Data
inBrief
9(2016)
1000–1012
1007

Table 5Summary of the cell experiments and microarray analyses.
T47D cell transfections and treatment
Time Experiments Well 1 Well 2 Well 3 Well 4
Day1
Transfection with negativecontrol (NC) or 17β-HSD1(si17B1) siRNAs
NC si17B1 NC si17B1
Day3
Addition of estradiol(þE2) or the vehiclecontrol (�)
– – þE2 þE2
Day5
Cell wash and totalRNA extraction
NC si17B1 NCþE2 si17B1þE2
Microarray analysesThree contrasts Contrast 1: NC vs. si17B1 Contrast 2: NC vs. NCþE2 Contrast 3: NCþE2
vs. si17B1þE2Aim List T47D genes impacted
by 17β-HSD1 knockdown insteroid-deprived medium
List genes responsive toestrogen in T47D
To detect if E2impacts gene reg-ulation by 17β-HSD1knockdown
Fig. 1. IPA Canonical Pathway analysis showing the interferon signaling pathway across the NC vs. NCþE2 contrast data.
J.A. Aka et al. / Data in Brief 9 (2016) 1000–10121008
fragmented cDNAs was used to hybridize human oligonucleotide array Gene 1.0 ST (Genechip;Affymetrix). The array comprised more than 750,000 unique 25-mer oligonucleotides constitutingover 28,000 gene-level probe sets of the human genome. The cDNA probe corresponding to eachbiological repetition for each condition was hybridized on separate arrays. After hybridization, chipswere processed using the Affymetrix GeneChip Fluidic Station 450 (protocol F450_0007). Chips werescanned with a GeneChip scanner 3000 7G (Affymetrix) and images were extracted with the

Fig. 2. Canonical pathways by IPA: antigen presentation pathway in the NC vs. si17B1 contrast.
J.A. Aka et al. / Data in Brief 9 (2016) 1000–1012 1009
GeneChip operating software (Affymetrix GCOS v1.4). The microarray processing was performed atthe DNA Biochip Platform service at CHU de Québec - CHUL Research Centre (Québec, Canada).
2.3. Microarray analysis
The microarray analysis has been described in the accompanying paper [1]. Quantified Affymetriximage files (".CEL" files) for each of the treatment conditions (including two independent replicatesper treatment condition) were used to perform the microarray analyses using the Bioconductorpackage OneChannelGUI [4,5] in the statistical software environment R. Three contrasts (see Table 5)were using the RMA method [6]. Data filtering was performed at signal feature level by interquantilerange (IQR) then by intensity. To identify differentially expressed genes, gene expression intensity wascompared using a moderated t-test and a Bayes smoothing approach developed for a low numberof replicates [7], and the false discovery rate was estimated from P-values derived from the moderatedt-test statistics for correction for the effect of multiple testing [8]. Genes were considered to be sig-nificantly differentially expressed if p-values were o0.05. The log2 transformed signal intensities

Fig. 3. Canonical pathways by IPA: antigen presentation pathway in the NC vs. NCþE2 contrast.
J.A. Aka et al. / Data in Brief 9 (2016) 1000–10121010
were averaged, and the mean value was used to compute the fold changes. Genes that were differ-entially expressed 1.5-fold or higher were considered for subsequent analyses. Our microarray data isavailable in the Gene Expression Omnibus (GEO) repository, accession number GSE77345.
2.4. Functional enrichment analysis
Ingenuity pathway analysis (IPAs
, QIAGEN Redwood City, www.qiagen.com/ingenuity) was used toassess the functional enrichment of the 208 modulated genes revealed by the three-contrastmicroarray analysis (genes which fold change equal or higher than 1.5 in at least one contrast).Three analyses made by IPAwere presented here: identification of biological functions, gene networksand canonical pathways (see ref for additional information). Criteria used for the IPA analyses havebeen described in the accompanying research article [1].

Fig. 4. Canonical pathways by IPA: role of BRCA1 in DNA damage response in the NC vs. NCþE2 contrast.
J.A. Aka et al. / Data in Brief 9 (2016) 1000–1012 1011
Acknowledgements
This work was supported by Canadian Institutes of Health Research, Canada, with grant to S.-X. Lin(Principal Investigator for FRN57892).
References
[1] J.A. Aka, E.L. Calvo, S.X. Lin, Estradiol-independent modulation of breast cancer transcript profile by 17beta-hydroxysteroiddehydrogenase type 1, Mol. Cell. Endocrinol. (2016), http://dx.doi.org/10.1016/j.mce.2016.08.026 (Epub ahead of print).
[2] J.A. Aka, M. Mazumdar, C.Q. Chen, D. Poirier, S.X. Lin, 17beta-hydroxysteroid dehydrogenase type 1 stimulates breast cancerby dihydrotestosterone inactivation in addition to estradiol production, Mol. Endocrinol. 24 (4) (2010) 832–845.
[3] J.A. Aka, M. Zerradi, F. Houle, J. Huot, S.X. Lin, 17beta-hydroxysteroid dehydrogenase type 1 modulates breast cancer proteinprofile and impacts cell migration, Breast Cancer Res. 14 (3) (2012) R92.
[4] R.C. Gentleman, V.J. Carey, D.M. Bates, B. Bolstad, M. Dettling, S. Dudoit, B. Ellis, L. Gautier, Y. Ge, J. Gentry, et al., Bio-conductor: open software development for computational biology and bioinformatics, Genome Biol. 5 (10) (2004) R80.
[5] R. Sanges, F. Cordero, R.A. Calogero, oneChannelGUI: a graphical interface to Bioconductor tools, designed for life scientistswho are not familiar with R language, Bioinformatics 23 (24) (2007) 3406–3408.

J.A. Aka et al. / Data in Brief 9 (2016) 1000–10121012
[6] R.A. Irizarry, B. Hobbs, F. Collin, Y.D. Beazer-Barclay, K.J. Antonellis, U. Scherf, T.P. Speed, Exploration, normalization, andsummaries of high density oligonucleotide array probe level data, Biostatistics 4 (2) (2003) 249–264.
[7] G.K. Smyth, J. Michaud, H.S. Scott, Use of within-array replicate spots for assessing differential expression in microarrayexperiments, Bioinformatics 21 (9) (2005) 2067–2075.
[8] Y. Benjamini, D. Drai, G. Elmer, N. Kafkafi, I. Golani, Controlling the false discovery rate in behavior genetics research, Behav.Brain Res. 125 (1-2) (2001) 279–284.