GenomeStudio Methylation Module v1.8 User Guide … · viii Part # 11319130 Rev. B Ta b le of...
114
FOR RESEARCH USE ONLY ILLUMINA PROPRIETARY Part # 11319130 Rev. B November 2010 GenomeStudio ® Methylation Module v1.8 User Guide
Transcript of GenomeStudio Methylation Module v1.8 User Guide … · viii Part # 11319130 Rev. B Ta b le of...
FOR RESEARCH USE ONLY
ILLUMINA PROPRIETARY Part # 11319130 Rev. BNovember 2010
GenomeStudio®
Methylation Module v1.8User Guide

Notice
This document and its contents are proprietary to Illumina, Inc. and its affiliates ("Illumina"), and are intended solely for the contractual use of its customer in connection with the use of the product(s) described herein and for no other purpose. This document and its contents shall not be used or distributed for any other purpose and/or otherwise communicated, disclosed, or reproduced in any way whatsoever without the prior written consent of Illumina. Illumina does not convey any license under its patent, trademark, copyright, or common-law rights nor similar rights of any third parties by this document.
The instructions in this document must be strictly and explicitly followed by qualified and properly trained personnel in order to ensure the proper and safe use of the product(s) described herein. All of the contents of this document must be fully read and understood prior to using such product(s).
FAILURE TO COMPLETELY READ AND EXPLICITLY FOLLOW ALL OF THE INSTRUCTIONS CONTAINED HEREIN MAY RESULT IN DAMAGE TO THE PRODUCT(S), INJURY TO PERSONS, INCLUDING TO USERS OR OTHERS, AND DAMAGE TO OTHER PROPERTY.
ILLUMINA DOES NOT ASSUME ANY LIABILITY ARISING OUT OF THE IMPROPER USE OF THE PRODUCT(S) DESCRIBED HEREIN (INCLUDING PARTS THEREOF OR SOFTWARE) OR ANY USE OF SUCH PRODUCT(S) OUTSIDE THE SCOPE OF THE EXPRESS WRITTEN LICENSES OR PERMISSIONS GRANTED BY ILLUMINA IN CONNECTION WITH CUSTOMER'S ACQUISITION OF SUCH PRODUCT(S).
FOR RESEARCH USE ONLY
© 2009–2010 Illumina, Inc. All rights reserved.
Illumina, illuminaDx, Solexa, Making Sense Out of Life, Oligator, Sentrix, GoldenGate, GoldenGate Indexing, DASL, BeadArray, Array of Arrays, Infinium, BeadXpress, VeraCode, IntelliHyb, iSelect, CSPro, GenomeStudio, Genetic Energy, HiSeq, HiScan, Eco, and TruSeq are registered trademarks or trademarks of Illumina, Inc. All other brands and names contained herein are the property of their respective owners.
GenomeStudio Methylation Module v1.8 User Guide iii

iv Part # 11319130 Rev. B
No
tic
e

Revision History
Part # Revision Date Description of Change
11319130 B November 2010
11319130 A November 2008 Initial GenomeStudio release.
GenomeStudio Methylation Module v1.8 User Guide v

vi Part # 11319130 Rev. B
Revis
ion
His
tory
Table of Contents
Notice . . . . . . . . . . . . . . . . . . . . . . . . . . . . . . . . . . . . . . . . . . . . . . . . . . . . . . iii
Revision History . . . . . . . . . . . . . . . . . . . . . . . . . . . . . . . . . . . . . . . . . . . . . . v
Table of Contents . . . . . . . . . . . . . . . . . . . . . . . . . . . . . . . . . . . . . . . . . . . . .vii
List of Tables . . . . . . . . . . . . . . . . . . . . . . . . . . . . . . . . . . . . . . . . . . . . . . . . ix
Chapter 1 Overview . . . . . . . . . . . . . . . . . . . . . . . . . . . . . . . . . . .1
Introduction . . . . . . . . . . . . . . . . . . . . . . . . . . . . . . . . . . . . . . . . . . . . . . . . . 2Audience and Purpose . . . . . . . . . . . . . . . . . . . . . . . . . . . . . . . . . . . . . . . . . 3Installing the Methylation Module. . . . . . . . . . . . . . . . . . . . . . . . . . . . . . . . . 4Methylation Module Workflow . . . . . . . . . . . . . . . . . . . . . . . . . . . . . . . . . . . 6
Chapter 2 Creating a New Project . . . . . . . . . . . . . . . . . . . . . . . .7
Introduction . . . . . . . . . . . . . . . . . . . . . . . . . . . . . . . . . . . . . . . . . . . . . . . . . 8Starting the Methylation Module . . . . . . . . . . . . . . . . . . . . . . . . . . . . . . . . . 9Selecting an Assay Type . . . . . . . . . . . . . . . . . . . . . . . . . . . . . . . . . . . . . . 10Choosing a Project Location . . . . . . . . . . . . . . . . . . . . . . . . . . . . . . . . . . . 11Selecting Your Project Data . . . . . . . . . . . . . . . . . . . . . . . . . . . . . . . . . . . . 12Defining Groupsets and Groups. . . . . . . . . . . . . . . . . . . . . . . . . . . . . . . . . 14Defining the Analysis Type and Parameters. . . . . . . . . . . . . . . . . . . . . . . . 17Creating a Mask File. . . . . . . . . . . . . . . . . . . . . . . . . . . . . . . . . . . . . . . . . . 19
Chapter 3 Viewing Your Data. . . . . . . . . . . . . . . . . . . . . . . . . . .21
Introduction . . . . . . . . . . . . . . . . . . . . . . . . . . . . . . . . . . . . . . . . . . . . . . . . 22Scatter Plots . . . . . . . . . . . . . . . . . . . . . . . . . . . . . . . . . . . . . . . . . . . . . . . . 23
Scatter Plot Functions . . . . . . . . . . . . . . . . . . . . . . . . . . . . . . . . . . . . . 24Scatter Plot Context Menu Selections. . . . . . . . . . . . . . . . . . . . . . . . . 27Finding Items in the Scatter Plot . . . . . . . . . . . . . . . . . . . . . . . . . . . . . 28
Histogram Plots . . . . . . . . . . . . . . . . . . . . . . . . . . . . . . . . . . . . . . . . . . . . . 33Histogram Plot Context Menu . . . . . . . . . . . . . . . . . . . . . . . . . . . . . . 34
Heat Maps . . . . . . . . . . . . . . . . . . . . . . . . . . . . . . . . . . . . . . . . . . . . . . . . . 36Heat Map Tools Menu . . . . . . . . . . . . . . . . . . . . . . . . . . . . . . . . . . . . . 37Heat Map Context Menu . . . . . . . . . . . . . . . . . . . . . . . . . . . . . . . . . . . 38
Cluster Analysis Dendrograms . . . . . . . . . . . . . . . . . . . . . . . . . . . . . . . . . . 39Similarities and Distances . . . . . . . . . . . . . . . . . . . . . . . . . . . . . . . . . . 39Analyzing Clusters . . . . . . . . . . . . . . . . . . . . . . . . . . . . . . . . . . . . . . . . 40Dendrogram Context Menu Selections . . . . . . . . . . . . . . . . . . . . . . . . 42Viewing the Sub-Tree List Directly in the Dendrogram . . . . . . . . . . . . 43
Copy/Paste Gene Clusters . . . . . . . . . . . . . . . . . . . . . . . . . . . . . . . . . . . . . 45From Scatter Plot to Dendrogram . . . . . . . . . . . . . . . . . . . . . . . . . . . . 45From Dendrogram to Scatter Plot . . . . . . . . . . . . . . . . . . . . . . . . . . . . 45
GenomeStudio Methylation Module v1.8 User Guide vii
Tab
le o
f C
on
ten
ts
Chapter 4 Applying Methylation Algorithms . . . . . . . . . . . . . . . 47Methylation Analysis Algorithms . . . . . . . . . . . . . . . . . . . . . . . . . . . . . . . . .48Normalization Methods and Algorithms . . . . . . . . . . . . . . . . . . . . . . . . . . .49
Average Normalization . . . . . . . . . . . . . . . . . . . . . . . . . . . . . . . . . . . . .49Normalization to Internal Controls. . . . . . . . . . . . . . . . . . . . . . . . . . . . .49Background Subtraction . . . . . . . . . . . . . . . . . . . . . . . . . . . . . . . . . . . .50
Differential Methylation Analysis Algorithms . . . . . . . . . . . . . . . . . . . . . . . .51Illumina Custom Model . . . . . . . . . . . . . . . . . . . . . . . . . . . . . . . . . . . . .51Mann-Whitney Model . . . . . . . . . . . . . . . . . . . . . . . . . . . . . . . . . . . . . .51T-Test Model . . . . . . . . . . . . . . . . . . . . . . . . . . . . . . . . . . . . . . . . . . . . .52
Chapter 5 Comparing Methylation and Gene Expression Data 53
Introduction . . . . . . . . . . . . . . . . . . . . . . . . . . . . . . . . . . . . . . . . . . . . . . . . .54Importing Gene Expression Data. . . . . . . . . . . . . . . . . . . . . . . . . . . . . . . . .55Visualize the Correlation of Methylation and Expression Levels Data. . . . .58
Chapter 6 User Interface Reference . . . . . . . . . . . . . . . . . . . . . 59
Introduction . . . . . . . . . . . . . . . . . . . . . . . . . . . . . . . . . . . . . . . . . . . . . . . . .60Detachable Docking Windows. . . . . . . . . . . . . . . . . . . . . . . . . . . . . . . . . . .61
Control Probe Profile Table . . . . . . . . . . . . . . . . . . . . . . . . . . . . . . . . . .61Infinium Methylation Controls Dashboard. . . . . . . . . . . . . . . . . . . . . . .63GoldenGate Methylation Control Summary Graph . . . . . . . . . . . . . . . .70Group Methylation Profile Table . . . . . . . . . . . . . . . . . . . . . . . . . . . . . .72Sample Methylation Profile Table . . . . . . . . . . . . . . . . . . . . . . . . . . . . .80Samples Table. . . . . . . . . . . . . . . . . . . . . . . . . . . . . . . . . . . . . . . . . . . .88Project Window . . . . . . . . . . . . . . . . . . . . . . . . . . . . . . . . . . . . . . . . . . .90Log Window . . . . . . . . . . . . . . . . . . . . . . . . . . . . . . . . . . . . . . . . . . . . .90
Main Window Menus . . . . . . . . . . . . . . . . . . . . . . . . . . . . . . . . . . . . . . . . . .91Context Menus . . . . . . . . . . . . . . . . . . . . . . . . . . . . . . . . . . . . . . . . . . . . . .94
Appendix A Sample Sheet Format. . . . . . . . . . . . . . . . . . . . . . . . 97
Introduction . . . . . . . . . . . . . . . . . . . . . . . . . . . . . . . . . . . . . . . . . . . . . . . . .98Data Section . . . . . . . . . . . . . . . . . . . . . . . . . . . . . . . . . . . . . . . . . . . . . . . .99Sample Sheet Template . . . . . . . . . . . . . . . . . . . . . . . . . . . . . . . . . . . . . .100Sample Sheet Examples . . . . . . . . . . . . . . . . . . . . . . . . . . . . . . . . . . . . . .101
Technical Assistance . . . . . . . . . . . . . . . . . . . . . . . 103
viii Part # 11319130 Rev. B
List of Tables
Table 1 Scatter Plot Control Panel Functions and Descriptions . . . . . . . . . . . . . . . 24Table 2 Scatter Plot Tools Menu Item Descriptions . . . . . . . . . . . . . . . . . . . . . . . . 26Table 3 Scatter Plot Context Menu Item Descriptions . . . . . . . . . . . . . . . . . . . . . . 27Table 4 Histogram Plot Context Menu Item Descriptions. . . . . . . . . . . . . . . . . . . . 35Table 5 Heat Map Tools Menu Item Descriptions. . . . . . . . . . . . . . . . . . . . . . . . . . 37Table 6 Heat Map Context Menu Item Descriptions . . . . . . . . . . . . . . . . . . . . . . . . 38Table 7 Dendrogram Context Menu Selections . . . . . . . . . . . . . . . . . . . . . . . . . . . 43Table 8 Control Probe Profile Table . . . . . . . . . . . . . . . . . . . . . . . . . . . . . . . . . . . . 62Table 9 GoldenGate Assay Control Summary Graph . . . . . . . . . . . . . . . . . . . . . . . 71
Table 10 Group Methylation Profile Table, Infinium HD Assay . . . . . . . . . . . . . . . . . 73Table 11 Group Methylation Profile Table, Infinium Assay . . . . . . . . . . . . . . . . . . . . 76Table 12 Group Methylation Profile Table, GoldenGate Assay. . . . . . . . . . . . . . . . . 79Table 13 Sample Methylation Profile Table, Infinium HD Assay . . . . . . . . . . . . . . . . 81Table 14 Sample Methylation Profile Table, Infinium Assay . . . . . . . . . . . . . . . . . . . 84Table 15 Sample Methylation Profile Table, GoldenGate Assay. . . . . . . . . . . . . . . . 86Table 16 Samples Table, Infinium Assay. . . . . . . . . . . . . . . . . . . . . . . . . . . . . . . . . . 88Table 17 Samples Table, GoldenGate Assay . . . . . . . . . . . . . . . . . . . . . . . . . . . . . . 89Table 18 Main Menu Elements and Functions . . . . . . . . . . . . . . . . . . . . . . . . . . . . . 91Table 19 Context Menu Elements and Functions . . . . . . . . . . . . . . . . . . . . . . . . . . . 94Table 20 Data Section, Required and Optional Columns . . . . . . . . . . . . . . . . . . . . . 99Table 21 Illumina General Contact Information. . . . . . . . . . . . . . . . . . . . . . . . . . . . 103Table 22 Illumina Customer Support Telephone Numbers . . . . . . . . . . . . . . . . . . . 103
GenomeStudio Methylation Module v1.8 User Guide ix

Lis
t o
f Tab
les
x Part # 11319130 Rev. B
Ch
ap
ter 1
Overview
Introduction . . . . . . . . . . . . . . . . . . . . . . . . . . . . . . . . . . . . . . . . . . . . . . . . . . . . . 2
Audience and Purpose. . . . . . . . . . . . . . . . . . . . . . . . . . . . . . . . . . . . . . . . . . . . . 3
Installing the Methylation Module . . . . . . . . . . . . . . . . . . . . . . . . . . . . . . . . . . . . 4
Methylation Module Workflow . . . . . . . . . . . . . . . . . . . . . . . . . . . . . . . . . . . . . . . 6
GenomeStudio Methylation Module v1.8 User Guide 1
Ove
rvie
w
IntroductionDNA methylation is an important regulatory mechanism of gene expression in many eukaryotic cell types. In humans and most mammals, DNA methylation mostly affects the cytosine base (C) when it is followed by a guanosine (G). Thus, in these organisms, DNA methylation generally occurs at CpG sites.
The pattern of methylation is cell-type-specific and established during the development of an organism. Changes in methylation patterns play critical roles in the regulation of gene expression in development, differentiation, and diseases such as multiple sclerosis, diabetes, schizophrenia, aging, and cancers.
The GenomeStudio Methylation Module is a software application you can use to analyze methylation data from scanned microarray images collected from the Illumina iScan System, HiScan or HiScanSQ System, BeadXpress Reader, or BeadArray Reader. You can also use the resulting GenomeStudio output files with most standard data analysis programs.
The GenomeStudio Methylation Module allows you to perform two types of data analysis:
Methylation Analysis—calculating methylation levelsDifferential Methylation Analysis—determining whether methylation levels have changed between a reference group and another experimental group.
You can perform these analyses on individual samples, or on groups of samples treated as replicates.
The GenomeStudio Methylation Module includes tools that provide a quick, visual means for exploratory analysis, including:
Line plotsBar graphsScatter plotsHistogramsDendrogramsBox plotsHeat mapsControl summary reports
Also included with the GenomeStudio Methylation Module are the following powerful data visualization and analysis tools:
Illumina Genome Viewer (IGV)Illumina Chromosome Browser (ICB)Methylation/Gene Expression Comparison Tool
This manual describes Illumina’s GenomeStudio Methylation Module software application and its component tools, and presents guidelines for evaluating the quality of your methylation experiments.
For information abut the IGV and the ICB, see the GenomeStudio Framework User Guide.
2 Part # 11319130 Rev. B

Au
die
nc
e a
nd
Pu
rpos
e
Audience and Purpose
This guide is written for researchers who want to use the GenomeStudio Methylation Module software application to analyze data obtained by performing one or more of the following assays:
Illumina’s Infinium Assay for MethylationIllumina’s Infinium HD Assay for MethylationIllumina’s GoldenGate Assay for MethylationIllumina’s VeraCode Assay for Methylation
This guide includes procedures and user interface information for the GenomeStudio Methylation Module. For information about performing Methylation assays, see the related Methylation Assay Guide.
GenomeStudio Methylation Module v1.8 User Guide 3
Ove
rvie
w
Installing the Methylation ModuleTo install the GenomeStudio Methylation Module:
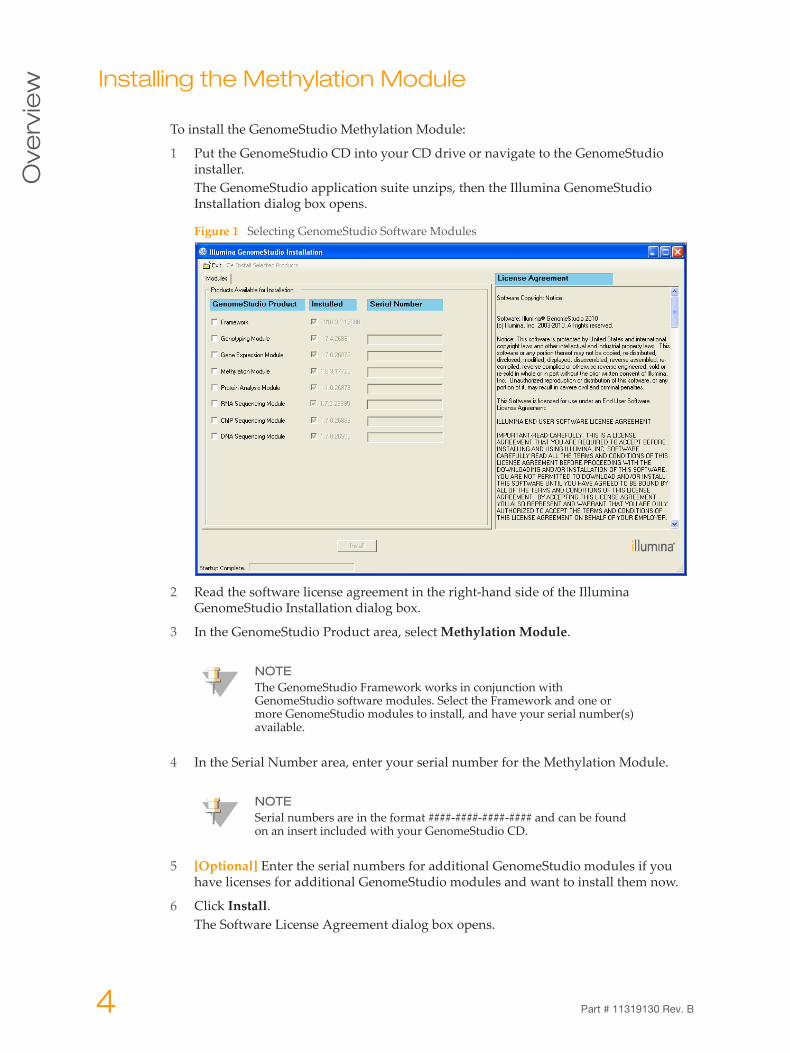
1 Put the GenomeStudio CD into your CD drive or navigate to the GenomeStudio installer. The GenomeStudio application suite unzips, then the Illumina GenomeStudio Installation dialog box opens.
Figure 1 Selecting GenomeStudio Software Modules
2 Read the software license agreement in the right-hand side of the Illumina GenomeStudio Installation dialog box.
3 In the GenomeStudio Product area, select Methylation Module.
4 In the Serial Number area, enter your serial number for the Methylation Module.
5 [Optional] Enter the serial numbers for additional GenomeStudio modules if you have licenses for additional GenomeStudio modules and want to install them now.
6 Click Install.The Software License Agreement dialog box opens.
NOTEThe GenomeStudio Framework works in conjunction with GenomeStudio software modules. Select the Framework and one or more GenomeStudio modules to install, and have your serial number(s) available.
NOTESerial numbers are in the format ####-####-####-#### and can be found on an insert included with your GenomeStudio CD.
4 Part # 11319130 Rev. B
Insta
lling
the
Me
thy
latio
n M
odu
le
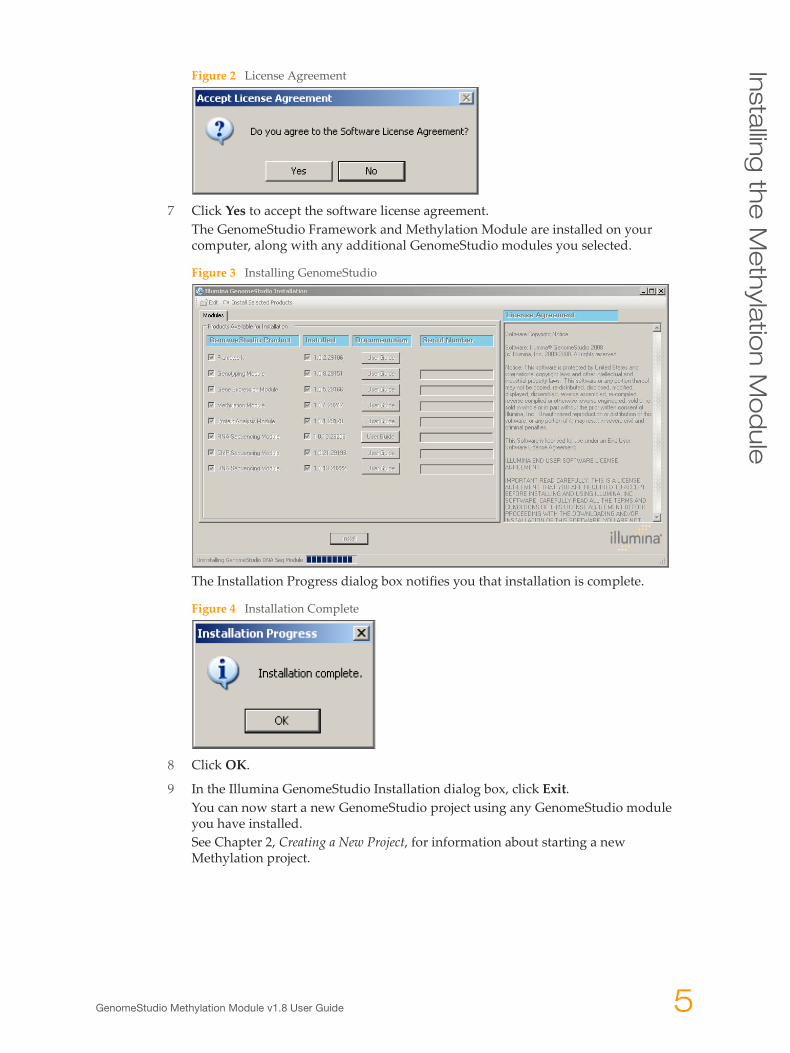
Figure 2 License Agreement
7 Click Yes to accept the software license agreement.The GenomeStudio Framework and Methylation Module are installed on your computer, along with any additional GenomeStudio modules you selected.
Figure 3 Installing GenomeStudio
The Installation Progress dialog box notifies you that installation is complete.
Figure 4 Installation Complete
8 Click OK.
9 In the Illumina GenomeStudio Installation dialog box, click Exit.You can now start a new GenomeStudio project using any GenomeStudio module you have installed.See Chapter 2, Creating a New Project, for information about starting a new Methylation project.
GenomeStudio Methylation Module v1.8 User Guide 5

Ove
rvie
w
Methylation Module WorkflowThe basic workflow for methylation is shown in Figure 5.
Figure 5 GenomeStudio Methylation Module Workflow
6 Part # 11319130 Rev. B
Ch
ap
ter 2
Creating a New Project
Introduction . . . . . . . . . . . . . . . . . . . . . . . . . . . . . . . . . . . . . . . . . . . . . . . . . . . . . 8
Starting the Methylation Module . . . . . . . . . . . . . . . . . . . . . . . . . . . . . . . . . . . . . 9
Selecting an Assay Type . . . . . . . . . . . . . . . . . . . . . . . . . . . . . . . . . . . . . . . . . . 10
Choosing a Project Location . . . . . . . . . . . . . . . . . . . . . . . . . . . . . . . . . . . . . . . 11
Selecting Your Project Data . . . . . . . . . . . . . . . . . . . . . . . . . . . . . . . . . . . . . . . . 12
Defining Groupsets and Groups . . . . . . . . . . . . . . . . . . . . . . . . . . . . . . . . . . . . 14
Defining the Analysis Type and Parameters. . . . . . . . . . . . . . . . . . . . . . . . . . . . 17
Creating a Mask File . . . . . . . . . . . . . . . . . . . . . . . . . . . . . . . . . . . . . . . . . . . . . 19
GenomeStudio Methylation Module v1.8 User Guide 7

Cre
atin
g a
Ne
w P
roje
ct
IntroductionUsing the intensity files produced by the Illumina iScan System, HiScan or HiScanSQ System, or BeadArray Reader, GenomeStudio's Methylation Module allows you to produce data tables containing:
CpG locus listsMethylation levels for individual CpG loci (normalized or raw)Associated hybridization intensities in the red and green channelsInformation about system controls
In addition, GenomeStudio's Differential Methylation Analysis capability allows you to produce data tables determining the probability that the methylation level between two samples or groups of samples has changed.
Using these data tables, GenomeStudio's data visualization tools can create sophisticated plotting analyses, including:
Bar plotsLine plots and scatter plotsHeat mapsHistogramsCluster analysis dendrogramsControl summary reports
For another level of analysis, you can also use the Illumina Genome Viewer (IGV), the Illumina Chromosome Browser (ICB), or a tool included in the Methylation Module that compares methylation with gene expression levels.
To run a methylation analysis, you must first define a GenomeStudio project. Within a project, you define one or more groupsets, one or more groups (sample sets that can be compared against each other for the purpose of identifying differences in methylation), and one or more analyses. For more information about groups and groupsets, see Defining Groupsets and Groups on page 14.
In the simplest experiment, each group may have only one sample. However, if your experiment includes replicate samples, or samples that belong to similar biological conditions, you can assign these to the same group.
In a project and within a group, GenomeStudio averages the values for each gene across the samples. Its algorithms automatically take advantage of the replicates' statistical power to provide a sensitive determination of methylation detection and differential methylation.
The GenomeStudio Project Wizard walks you through each step of creating a project:Starting the Methylation moduleDefining a projectCreating groupsets and groupsApplying normalization, methylation analysis, and differential methylation analysis algorithms
NOTEFor more information about the IGV and the ICB, see the GenomeStudio Framework User Guide. For more information about the Methylation/Gene Expression Comparison Tool, see Chapter 5, Comparing Methylation and Gene Expression Data of this manual.
8 Part # 11319130 Rev. B
Sta
rting
the
Me
thyla
tion
Mo
du
le
Starting the Methylation Module
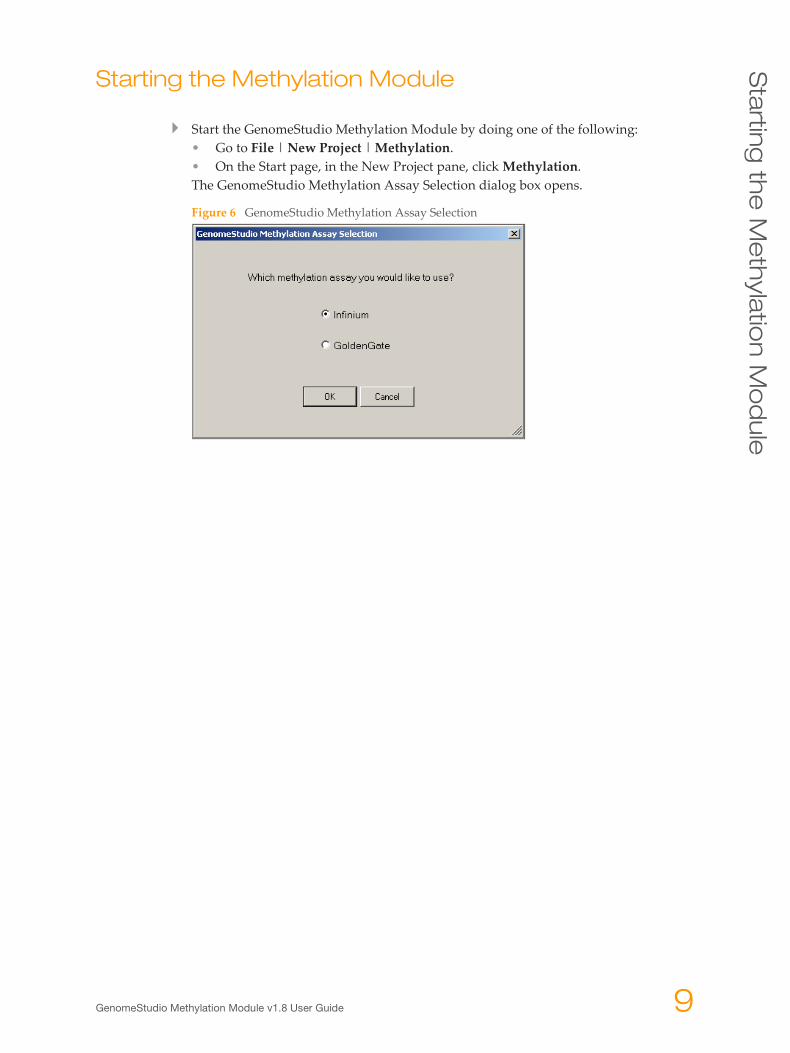
Start the GenomeStudio Methylation Module by doing one of the following:• Go to File | New Project | Methylation.• On the Start page, in the New Project pane, click Methylation.The GenomeStudio Methylation Assay Selection dialog box opens.
Figure 6 GenomeStudio Methylation Assay Selection
GenomeStudio Methylation Module v1.8 User Guide 9

Cre
atin
g a
Ne
w P
roje
ct
Selecting an Assay Type1 Select the Infinium or GoldenGate assay, as appropriate for the run you are analyzing, then click OK.The examples in the following sections of this chapter reflect the choices available if you select Infinium and might not match the choices shown on your screen.
Figure 7 GenomeStudio Project Wizard - Welcome
2 Click Next to continue.The GenomeStudio Project Wizard - Methylation Assay Type dialog box opens.
Figure 8 GenomeStudio Project Wizard - Methylation Assay Type
3 Verify that the assay type is correct, and click Next.The GenomeStudio Project Wizard - Project Location dialog box opens.
10 Part # 11319130 Rev. B
Ch
oosin
g a
Pro
jec
t Lo
ca
tion
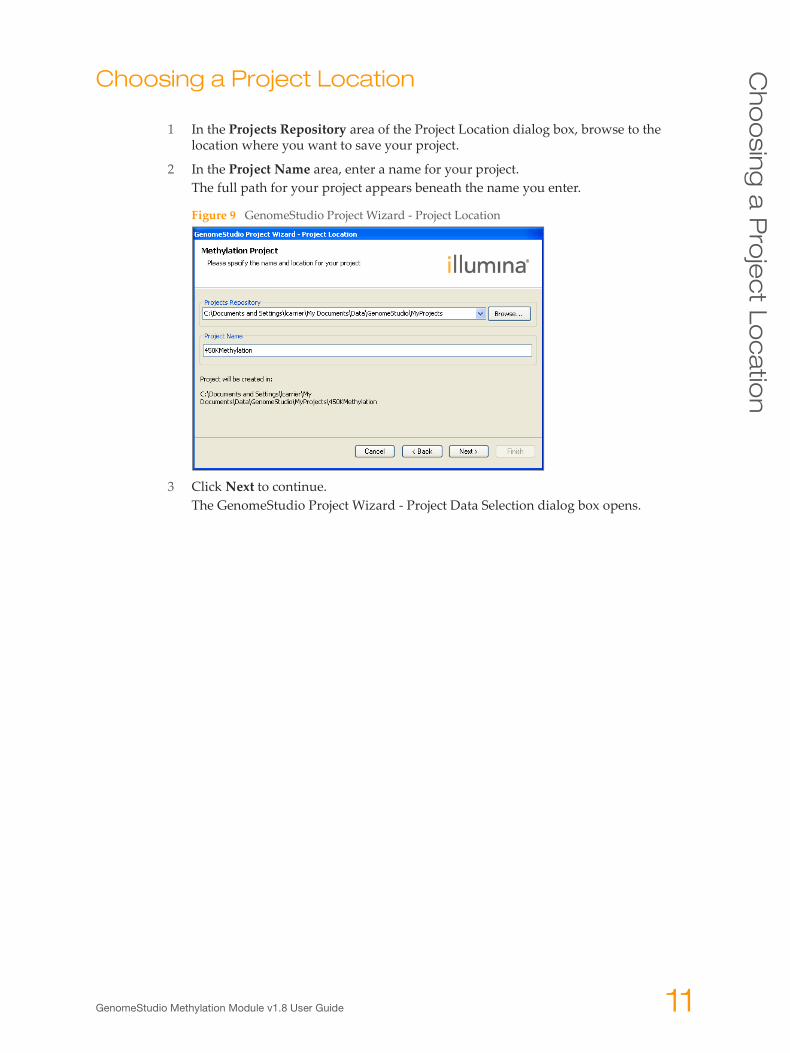
Choosing a Project Location
1 In the Projects Repository area of the Project Location dialog box, browse to the location where you want to save your project.
2 In the Project Name area, enter a name for your project.The full path for your project appears beneath the name you enter.
Figure 9 GenomeStudio Project Wizard - Project Location
3 Click Next to continue.The GenomeStudio Project Wizard - Project Data Selection dialog box opens.
GenomeStudio Methylation Module v1.8 User Guide 11
Cre
atin
g a
Ne
w P
roje
ct
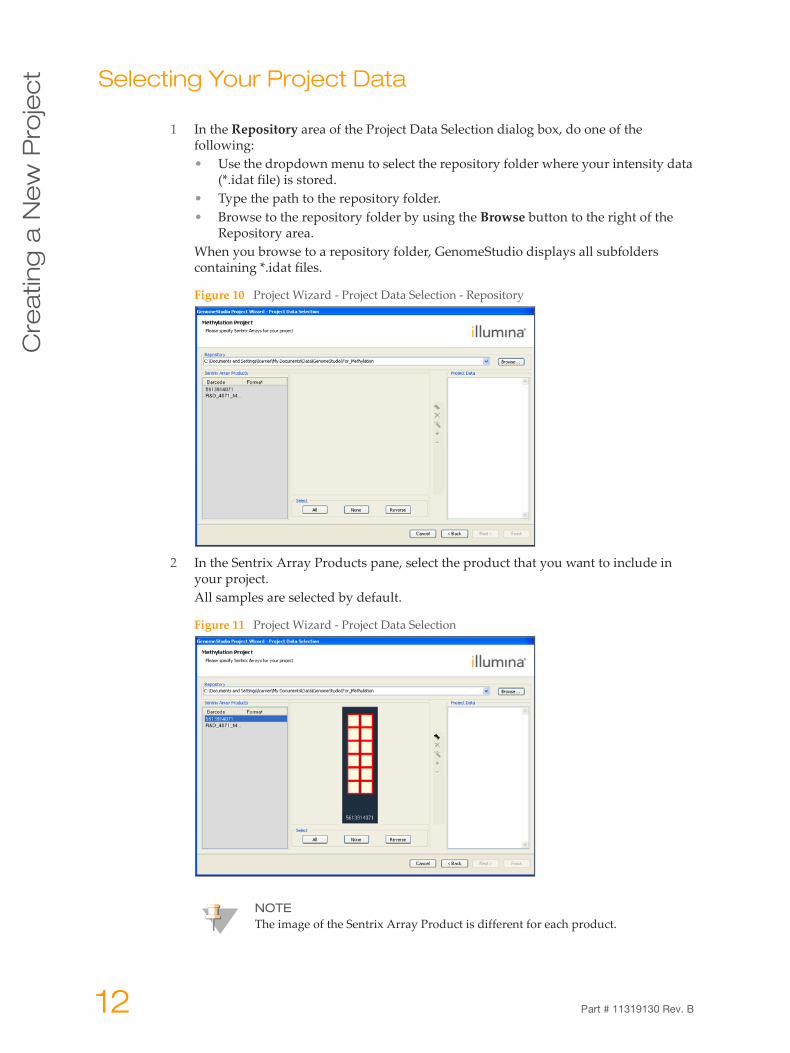
Selecting Your Project Data1 In the Repository area of the Project Data Selection dialog box, do one of the following:• Use the dropdown menu to select the repository folder where your intensity data
(*.idat file) is stored.• Type the path to the repository folder.• Browse to the repository folder by using the Browse button to the right of the
Repository area.When you browse to a repository folder, GenomeStudio displays all subfolders containing *.idat files.
Figure 10 Project Wizard - Project Data Selection - Repository
2 In the Sentrix Array Products pane, select the product that you want to include in your project.All samples are selected by default.
Figure 11 Project Wizard - Project Data Selection
NOTEThe image of the Sentrix Array Product is different for each product.
12 Part # 11319130 Rev. B
Se
lec
ting
You
r Pro
jec
t Da
ta
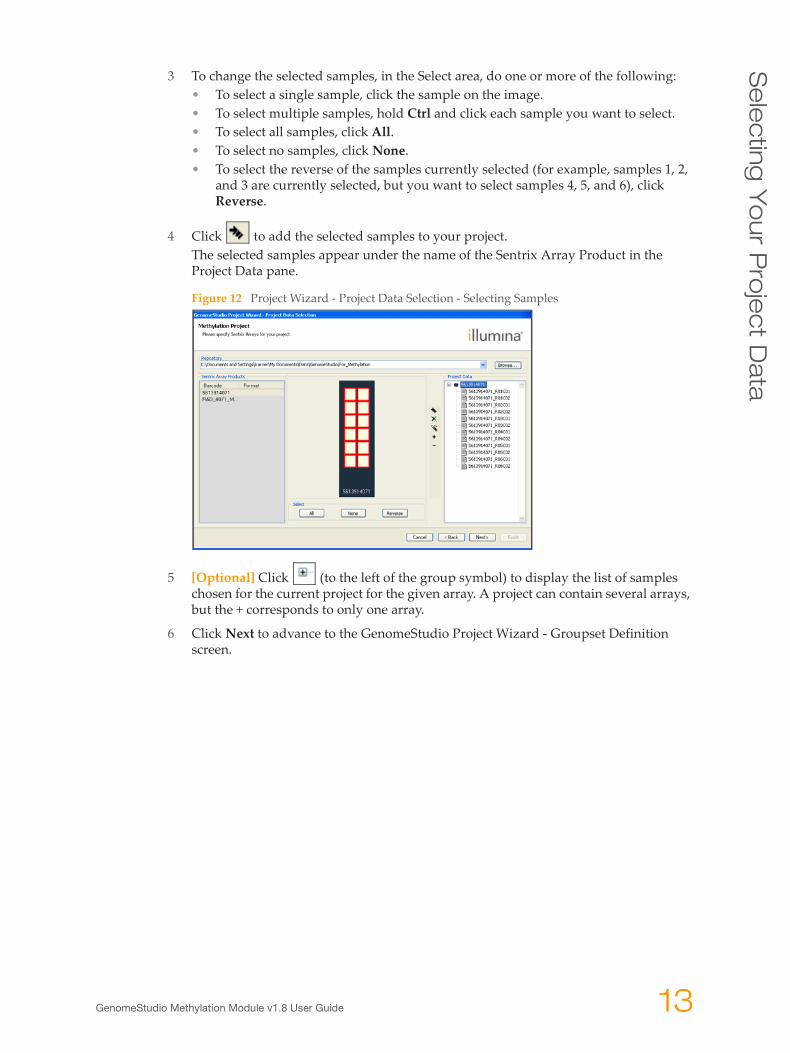
3 To change the selected samples, in the Select area, do one or more of the following:• To select a single sample, click the sample on the image.• To select multiple samples, hold Ctrl and click each sample you want to select.• To select all samples, click All.• To select no samples, click None.• To select the reverse of the samples currently selected (for example, samples 1, 2,
and 3 are currently selected, but you want to select samples 4, 5, and 6), click Reverse.
4 Click to add the selected samples to your project.The selected samples appear under the name of the Sentrix Array Product in the Project Data pane.
Figure 12 Project Wizard - Project Data Selection - Selecting Samples
5 [Optional] Click (to the left of the group symbol) to display the list of samples chosen for the current project for the given array. A project can contain several arrays, but the + corresponds to only one array.
6 Click Next to advance to the GenomeStudio Project Wizard - Groupset Definition screen.
GenomeStudio Methylation Module v1.8 User Guide 13
Cre
atin
g a
Ne
w P
roje
ct
Defining Groupsets and GroupsGenomeStudio projects are structured in a hierarchical manner.
A project includes one or more groupsets.
A groupset is a collection of groups that you choose to be analyzed simultaneously.
A groupset includes one or more groups.
A group is a set of arrays that share a functional relationship (e.g., replicates, zero time points, reference group). Within a groupset, an array can be included in more than one group (e.g., analyzed individually in addition to being analyzed as a member of a reference group).
Perform the following steps to define a groupset for your project.
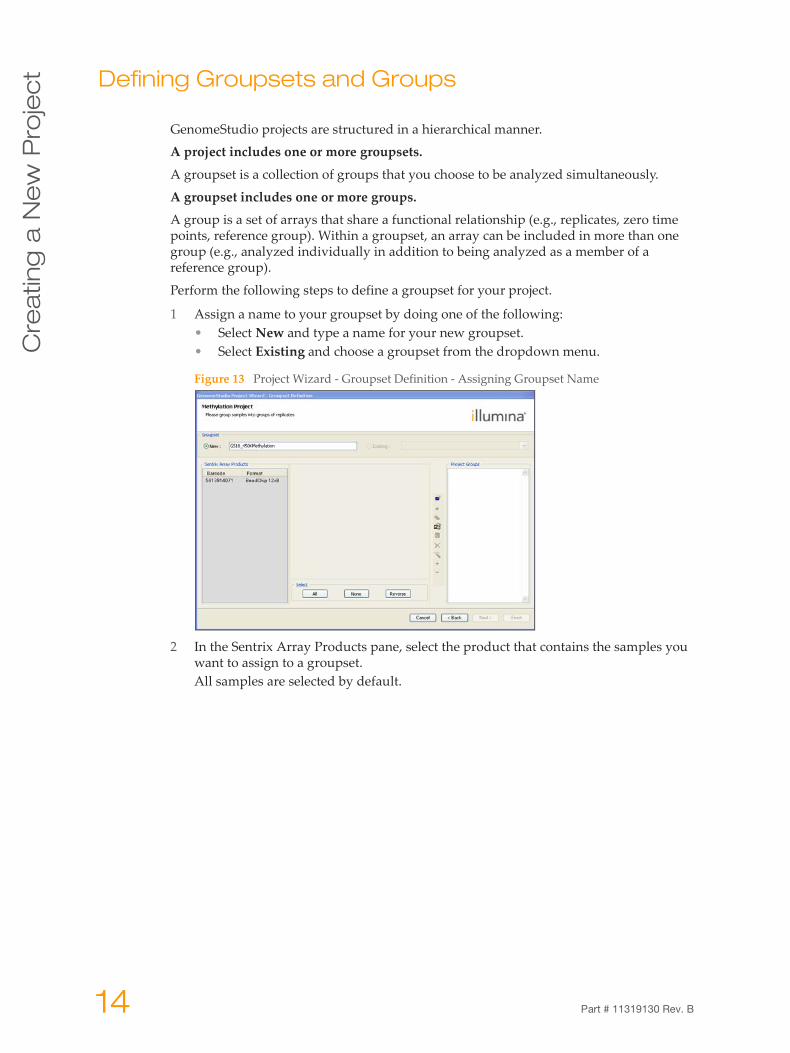
1 Assign a name to your groupset by doing one of the following:• Select New and type a name for your new groupset.• Select Existing and choose a groupset from the dropdown menu.
Figure 13 Project Wizard - Groupset Definition - Assigning Groupset Name
2 In the Sentrix Array Products pane, select the product that contains the samples you want to assign to a groupset.All samples are selected by default.
14 Part # 11319130 Rev. B
De
finin
g G
rou
pse
ts a
nd
Gro
ups
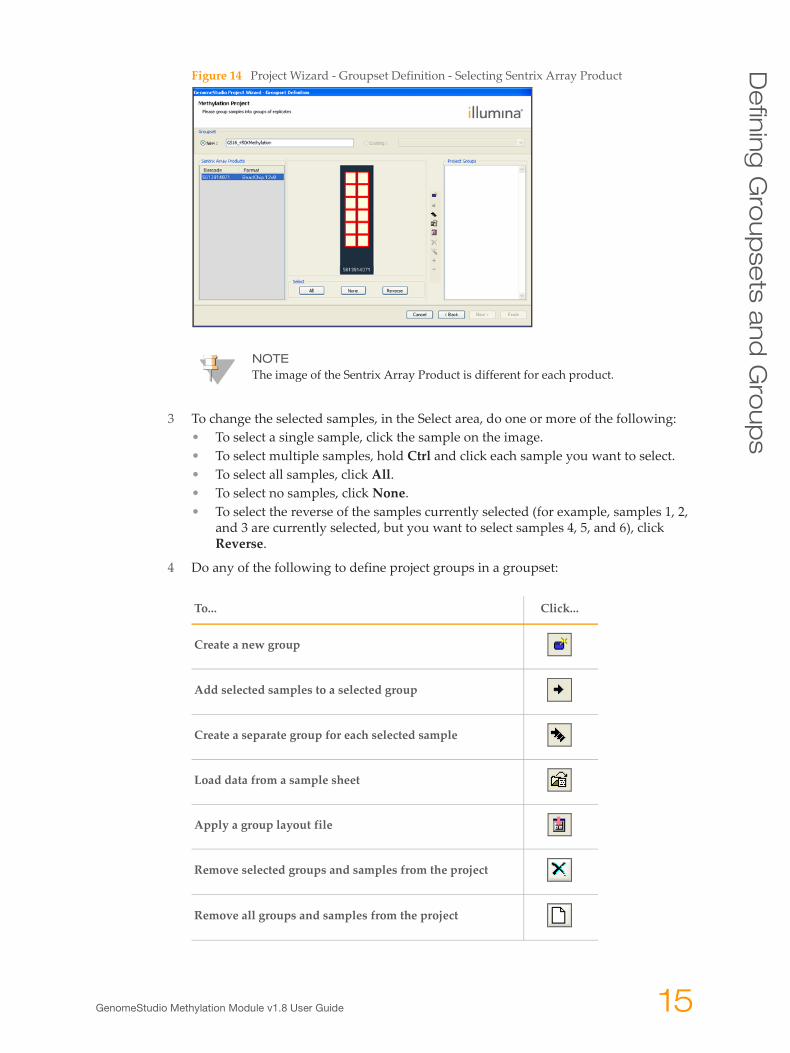
Figure 14 Project Wizard - Groupset Definition - Selecting Sentrix Array Product
3 To change the selected samples, in the Select area, do one or more of the following:• To select a single sample, click the sample on the image.• To select multiple samples, hold Ctrl and click each sample you want to select.• To select all samples, click All.• To select no samples, click None.• To select the reverse of the samples currently selected (for example, samples 1, 2,
and 3 are currently selected, but you want to select samples 4, 5, and 6), click Reverse.
4 Do any of the following to define project groups in a groupset:
NOTEThe image of the Sentrix Array Product is different for each product.
To... Click...
Create a new group
Add selected samples to a selected group
Create a separate group for each selected sample
Load data from a sample sheet
Apply a group layout file
Remove selected groups and samples from the project
Remove all groups and samples from the project
GenomeStudio Methylation Module v1.8 User Guide 15
Cre
atin
g a
Ne
w P
roje
ct
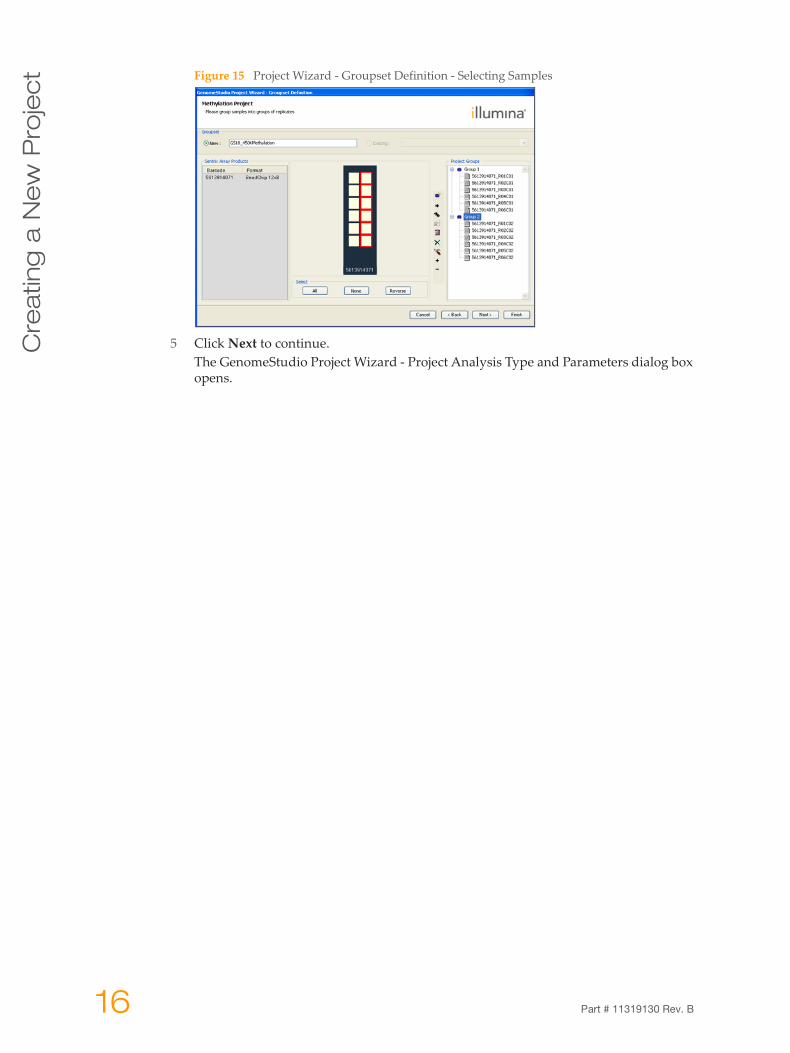
Figure 15 Project Wizard - Groupset Definition - Selecting Samples5 Click Next to continue.The GenomeStudio Project Wizard - Project Analysis Type and Parameters dialog box opens.
16 Part # 11319130 Rev. B
De
finin
g th
e A
na
lysis
Ty
pe
an
d P
ara
me
ters
Defining the Analysis Type and Parameters
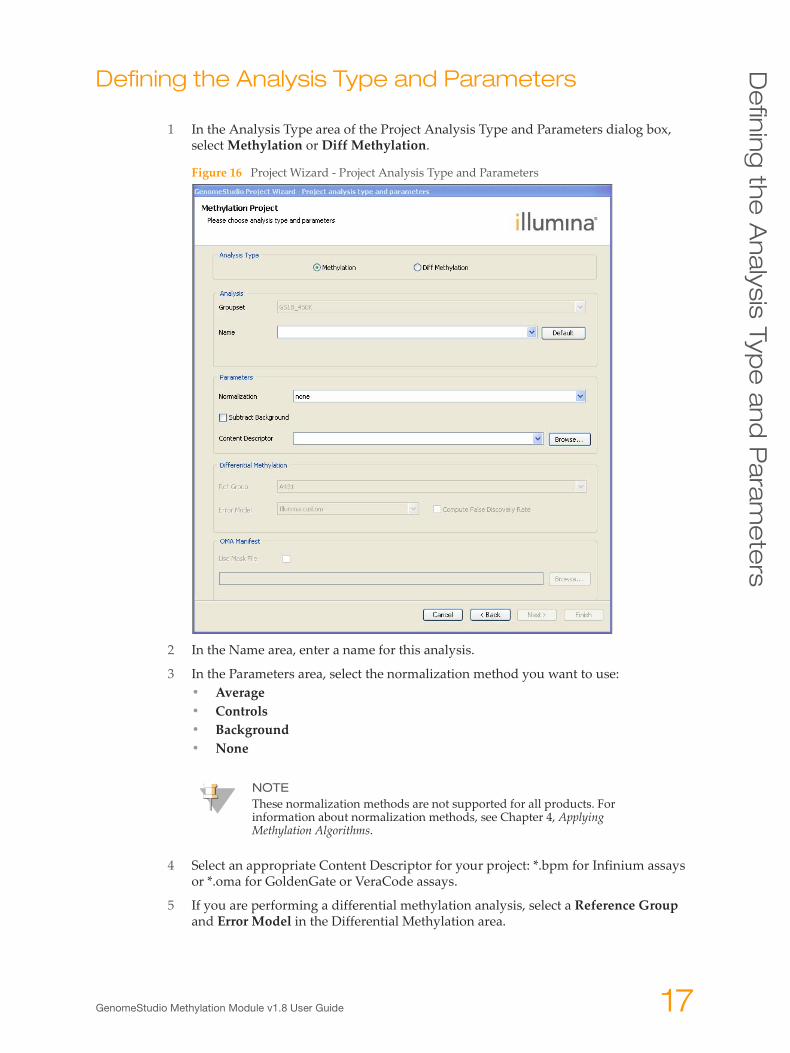
1 In the Analysis Type area of the Project Analysis Type and Parameters dialog box, select Methylation or Diff Methylation.
Figure 16 Project Wizard - Project Analysis Type and Parameters
2 In the Name area, enter a name for this analysis.
3 In the Parameters area, select the normalization method you want to use:• Average• Controls• Background• None
4 Select an appropriate Content Descriptor for your project: *.bpm for Infinium assays or *.oma for GoldenGate or VeraCode assays.
5 If you are performing a differential methylation analysis, select a Reference Group and Error Model in the Differential Methylation area.
NOTEThese normalization methods are not supported for all products. For information about normalization methods, see Chapter 4, Applying Methylation Algorithms.
GenomeStudio Methylation Module v1.8 User Guide 17
Cre
atin
g a
Ne
w P
roje
ct
6 If you want to compute the false discovery rate, select the Compute false discoveryrate check box.
7 [Optional, GoldenGate assay only] Select the Use Mask File check box and browse to the location of the mask file you want to use.The mask file must contain the following columns:• TargetID• ProbeID• 0/1To create a mask file, copy the TargetID and ProbeID columns from the table, and add the 0/1 column in Excel.For more information about mask files, see the section Creating a Mask File on page 19.
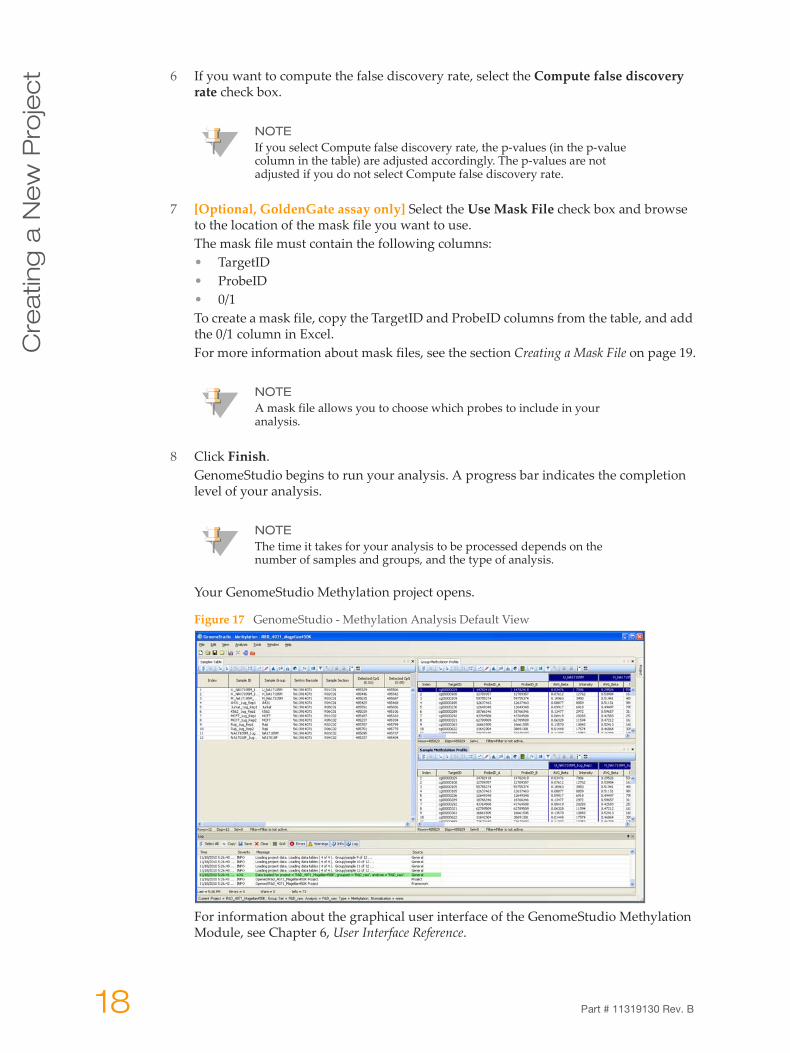
8 Click Finish. GenomeStudio begins to run your analysis. A progress bar indicates the completion level of your analysis.
Your GenomeStudio Methylation project opens.
Figure 17 GenomeStudio - Methylation Analysis Default View
For information about the graphical user interface of the GenomeStudio Methylation Module, see Chapter 6, User Interface Reference.
NOTEIf you select Compute false discovery rate, the p-values (in the p-value column in the table) are adjusted accordingly. The p-values are not adjusted if you do not select Compute false discovery rate.
NOTEA mask file allows you to choose which probes to include in your analysis.
NOTEThe time it takes for your analysis to be processed depends on the number of samples and groups, and the type of analysis.
18 Part # 11319130 Rev. B
Cre
atin
g a
Mas
k F
ile
Creating a Mask File
Some custom GoldenGate assay probes may not provide reproducibly robust results and should be removed from analysis. The detection p-value reported in GenomeStudio can be used as an objective measure of overall probe performance.
To exclude a probe:
1 Export the TargetID and ProbeID columns from the Group Methylation Profile table or the Sample Methylation Profile table.
2 Create an additional column, in which 1 represents the probe to display, and 0 represents the probe to hide.
3 Save the mask file as a *.csv file in the same repository where the content descriptor file is stored. The mask file need not conform to a naming convention.
NOTEIllumina recommends excluding probes that have a detection p-value of greater than 0.05 in the assay; however, you may define your own criteria.
NOTEAny *.csv file present in the same repository as Content Descriptor files will appear in the Experiment Parameters pulldown menu. To avoid confusion, Illumina advises the use of separate repositories for Content Descriptor and for SAM/BeadChip data.
GenomeStudio Methylation Module v1.8 User Guide 19

Cre
atin
g a
Ne
w P
roje
ct
Figure 18 Mask File Example20 Part # 11319130 Rev. B
Ch
ap
ter 3
Viewing Your Data
Introduction . . . . . . . . . . . . . . . . . . . . . . . . . . . . . . . . . . . . . . . . . . . . . . . . . . . . 22
Scatter Plots . . . . . . . . . . . . . . . . . . . . . . . . . . . . . . . . . . . . . . . . . . . . . . . . . . . 23
Histogram Plots . . . . . . . . . . . . . . . . . . . . . . . . . . . . . . . . . . . . . . . . . . . . . . . . . 33
Heat Maps . . . . . . . . . . . . . . . . . . . . . . . . . . . . . . . . . . . . . . . . . . . . . . . . . . . . . 36
Cluster Analysis Dendrograms. . . . . . . . . . . . . . . . . . . . . . . . . . . . . . . . . . . . . . 39
Copy/Paste Gene Clusters . . . . . . . . . . . . . . . . . . . . . . . . . . . . . . . . . . . . . . . . 45
GenomeStudio Methylation Module v1.8 User Guide 21
Vie
win
g Y
ou
r D
ata
IntroductionThis chapter describes the data visualization functions of the GenomeStudio Methylation Module, which are used to create:
Scatter plotsHistogram plotsHeat mapsDendrogramsControl summary reports
Use these tools to explore the data you generate using Bead Studio’s Methylation Analysis or Differential Methylation Analysis (described in Chapter 4).
22 Part # 11319130 Rev. B
Sc
atte
r Plo
ts
Scatter Plots
Once you have performed a methylation analysis or differential methylation analysis, you can create scatter plots of your data.
To create a scatter plot:
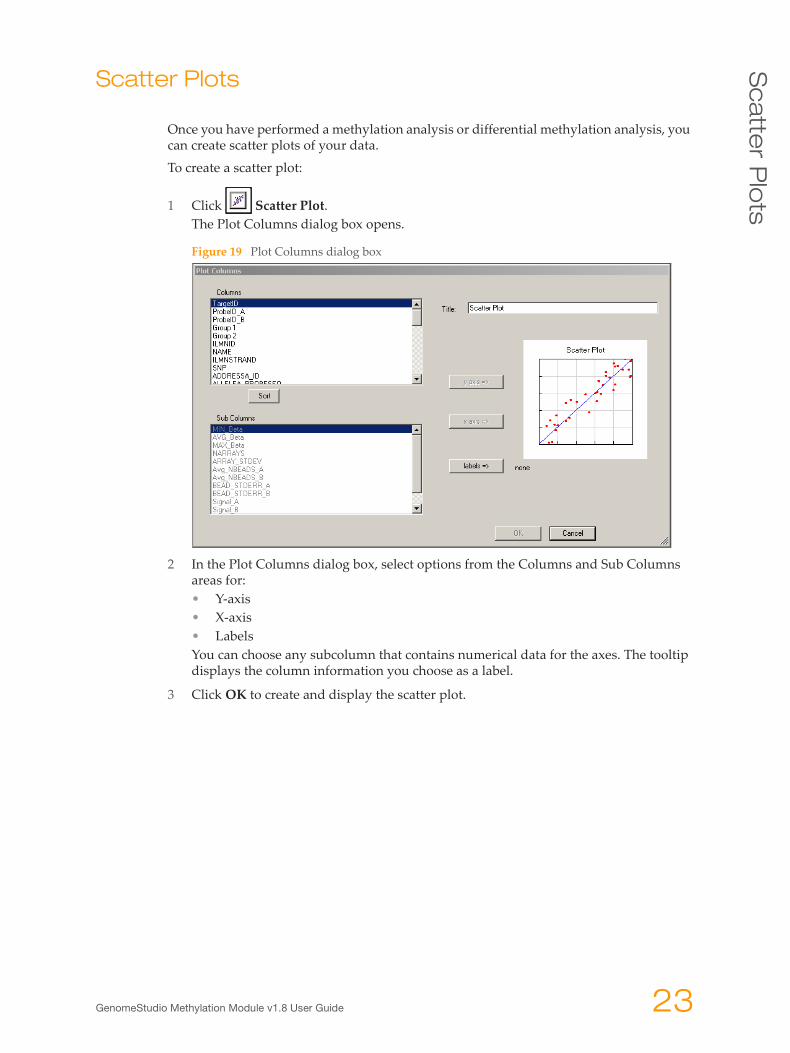
1 Click Scatter Plot.The Plot Columns dialog box opens.
Figure 19 Plot Columns dialog box
2 In the Plot Columns dialog box, select options from the Columns and Sub Columns areas for:• Y-axis• X-axis• LabelsYou can choose any subcolumn that contains numerical data for the axes. The tooltip displays the column information you choose as a label.
3 Click OK to create and display the scatter plot.
GenomeStudio Methylation Module v1.8 User Guide 23
Vie
win
g Y
ou
r D
ata
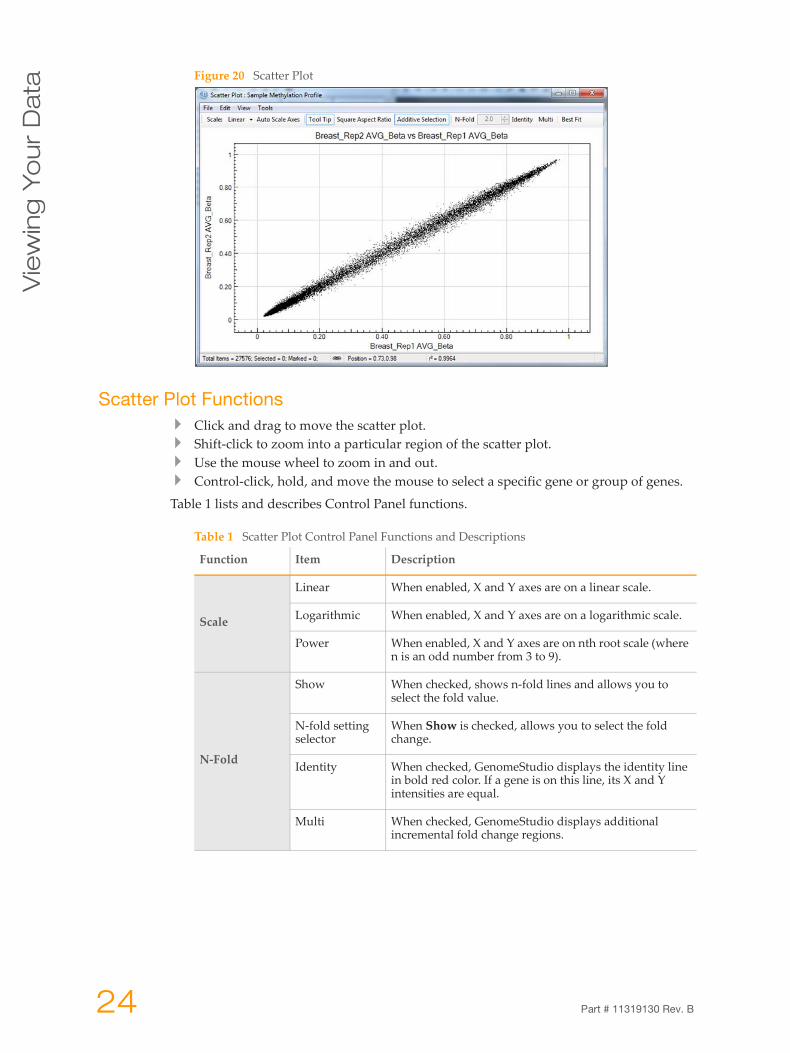
Figure 20 Scatter Plot
Scatter Plot FunctionsClick and drag to move the scatter plot.Shift-click to zoom into a particular region of the scatter plot.Use the mouse wheel to zoom in and out.Control-click, hold, and move the mouse to select a specific gene or group of genes.
Table 1 lists and describes Control Panel functions.
Table 1 Scatter Plot Control Panel Functions and Descriptions
Function Item Description
Scale
Linear When enabled, X and Y axes are on a linear scale.
Logarithmic When enabled, X and Y axes are on a logarithmic scale.
Power When enabled, X and Y axes are on nth root scale (where n is an odd number from 3 to 9).
N-Fold
Show When checked, shows n-fold lines and allows you to select the fold value.
N-fold setting selector
When Show is checked, allows you to select the fold change.
Identity When checked, GenomeStudio displays the identity line in bold red color. If a gene is on this line, its X and Y intensities are equal.
Multi When checked, GenomeStudio displays additional incremental fold change regions.
24 Part # 11319130 Rev. B
Sc
atte
r Plo
ts
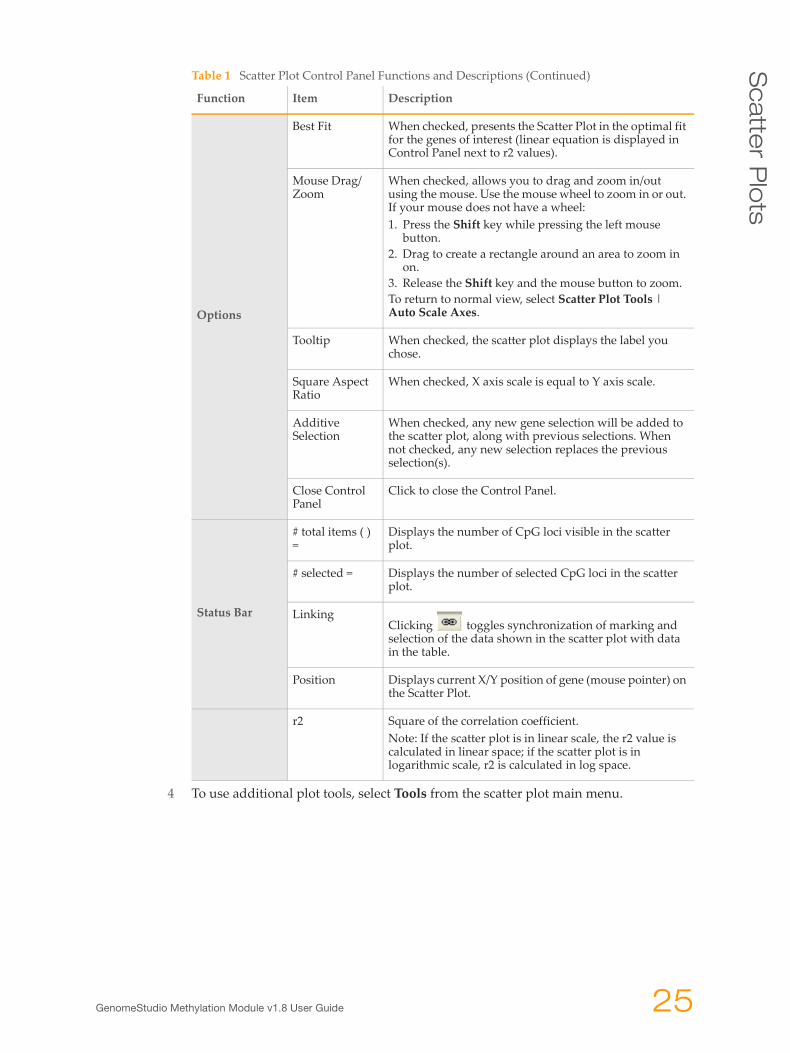
4 To use additional plot tools, select Tools from the scatter plot main menu.
Options
Best Fit When checked, presents the Scatter Plot in the optimal fit for the genes of interest (linear equation is displayed in Control Panel next to r2 values).
Mouse Drag/Zoom
When checked, allows you to drag and zoom in/out using the mouse. Use the mouse wheel to zoom in or out. If your mouse does not have a wheel:1. Press the Shift key while pressing the left mouse
button.2. Drag to create a rectangle around an area to zoom in
on.3. Release the Shift key and the mouse button to zoom.To return to normal view, select Scatter Plot Tools | Auto Scale Axes.
Tooltip When checked, the scatter plot displays the label you chose.
Square Aspect Ratio
When checked, X axis scale is equal to Y axis scale.
Additive Selection
When checked, any new gene selection will be added to the scatter plot, along with previous selections. When not checked, any new selection replaces the previous selection(s).
Close Control Panel
Click to close the Control Panel.
Status Bar
# total items ( ) =
Displays the number of CpG loci visible in the scatter plot.
# selected = Displays the number of selected CpG loci in the scatter plot.
LinkingClicking toggles synchronization of marking and selection of the data shown in the scatter plot with data in the table.
Position Displays current X/Y position of gene (mouse pointer) on the Scatter Plot.
r2 Square of the correlation coefficient.Note: If the scatter plot is in linear scale, the r2 value is calculated in linear space; if the scatter plot is in logarithmic scale, r2 is calculated in log space.
Table 1 Scatter Plot Control Panel Functions and Descriptions (Continued)
Function Item Description
GenomeStudio Methylation Module v1.8 User Guide 25

Vie
win
g Y
ou
r D
ata
Figure 21 Scatter Plot Tools Menu
Table 2 lists and describes the various scatter plot tools.
Table 2 Scatter Plot Tools Menu Item Descriptions
Tool Name Description
Find ItemsOpens the Find Items dialog box, where you can enter a list of items separated by commas or load a search item list from a text file.
Select RegionConverts the cursor to a crosshair tool, which you can use to draw a boundary around any region in the scatter plot. All loci within the boundary are selected.
Select All Selects all CpG loci in the scatter plot. Loci are displayed in the currently-selected color.
Clear Selection Clears any previous selections.
Reverse Selection Reverses the current selection (selects items that are unselected).
Marked List
Includes operations you can perform on items you mark in the scatter plot:• View in Web Browser—Displays a list of the marked items in
a web browser.• Save in Text File—Brings up the Save Marked Items List As
dialog box and allows you to save genes in a file in a location you specify.
• Show Item Symbols—Shows item symbols.
Auto Scale Axes Automatically scales the X and Y axes of the scatter plot.
Copy Image Copies the current image to the clipboard.
26 Part # 11319130 Rev. B
Sc
atte
r Plo
ts
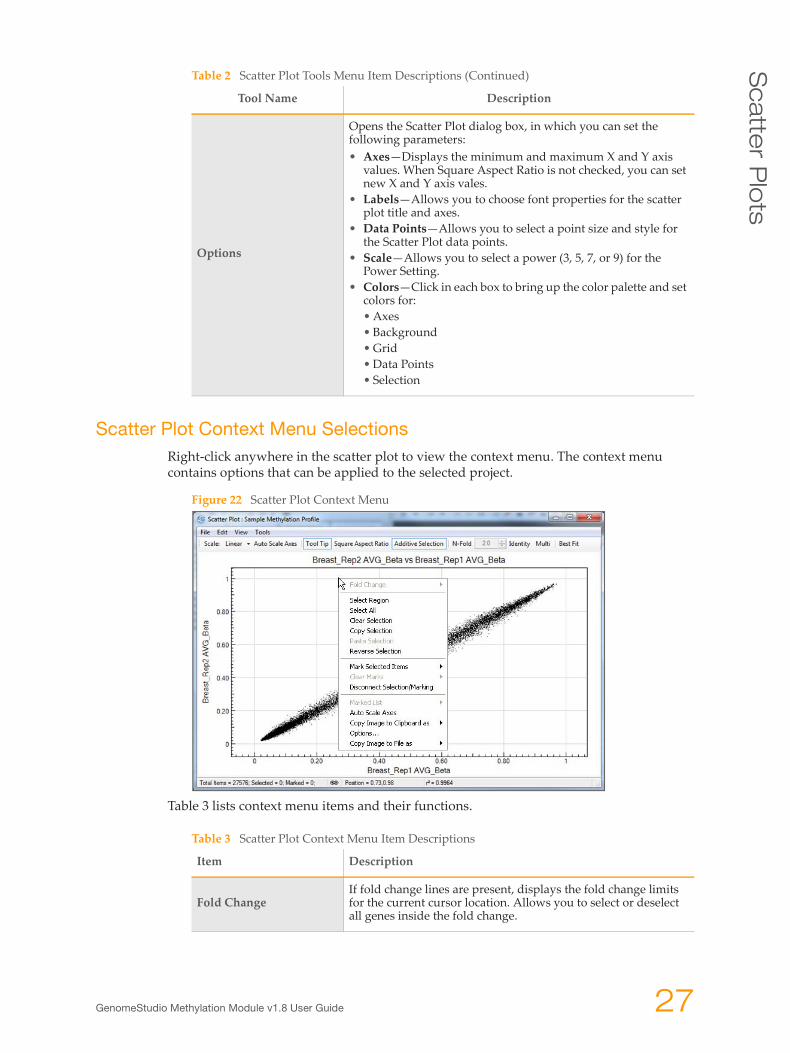
Scatter Plot Context Menu SelectionsRight-click anywhere in the scatter plot to view the context menu. The context menu contains options that can be applied to the selected project.
Figure 22 Scatter Plot Context Menu
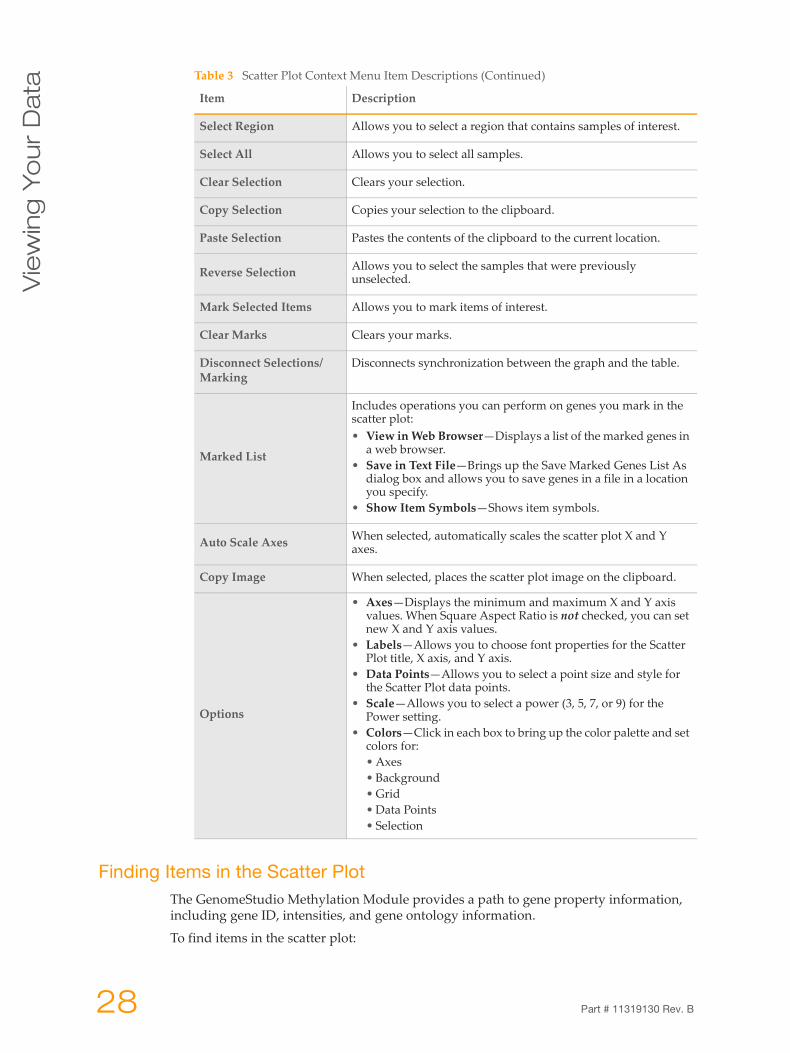
Table 3 lists context menu items and their functions.
Options
Opens the Scatter Plot dialog box, in which you can set the following parameters:• Axes—Displays the minimum and maximum X and Y axis
values. When Square Aspect Ratio is not checked, you can set new X and Y axis vales.
• Labels—Allows you to choose font properties for the scatter plot title and axes.
• Data Points—Allows you to select a point size and style for the Scatter Plot data points.
• Scale—Allows you to select a power (3, 5, 7, or 9) for the Power Setting.
• Colors—Click in each box to bring up the color palette and set colors for:• Axes• Background• Grid• Data Points• Selection
Table 2 Scatter Plot Tools Menu Item Descriptions (Continued)
Tool Name Description
Table 3 Scatter Plot Context Menu Item Descriptions
Item Description
Fold ChangeIf fold change lines are present, displays the fold change limits for the current cursor location. Allows you to select or deselect all genes inside the fold change.
GenomeStudio Methylation Module v1.8 User Guide 27
Vie
win
g Y
ou
r D
ata
Finding Items in the Scatter PlotThe GenomeStudio Methylation Module provides a path to gene property information, including gene ID, intensities, and gene ontology information.
To find items in the scatter plot:
Select Region Allows you to select a region that contains samples of interest.
Select All Allows you to select all samples.
Clear Selection Clears your selection.
Copy Selection Copies your selection to the clipboard.
Paste Selection Pastes the contents of the clipboard to the current location.
Reverse Selection Allows you to select the samples that were previously unselected.
Mark Selected Items Allows you to mark items of interest.
Clear Marks Clears your marks.
Disconnect Selections/Marking
Disconnects synchronization between the graph and the table.
Marked List
Includes operations you can perform on genes you mark in the scatter plot:• View in Web Browser—Displays a list of the marked genes in
a web browser.• Save in Text File—Brings up the Save Marked Genes List As
dialog box and allows you to save genes in a file in a location you specify.
• Show Item Symbols—Shows item symbols.
Auto Scale Axes When selected, automatically scales the scatter plot X and Y axes.
Copy Image When selected, places the scatter plot image on the clipboard.
Options
• Axes—Displays the minimum and maximum X and Y axis values. When Square Aspect Ratio is not checked, you can set new X and Y axis values.
• Labels—Allows you to choose font properties for the Scatter Plot title, X axis, and Y axis.
• Data Points—Allows you to select a point size and style for the Scatter Plot data points.
• Scale—Allows you to select a power (3, 5, 7, or 9) for the Power setting.
• Colors—Click in each box to bring up the color palette and set colors for:• Axes• Background• Grid• Data Points• Selection
Table 3 Scatter Plot Context Menu Item Descriptions (Continued)
Item Description
28 Part # 11319130 Rev. B
Sc
atte
r Plo
ts
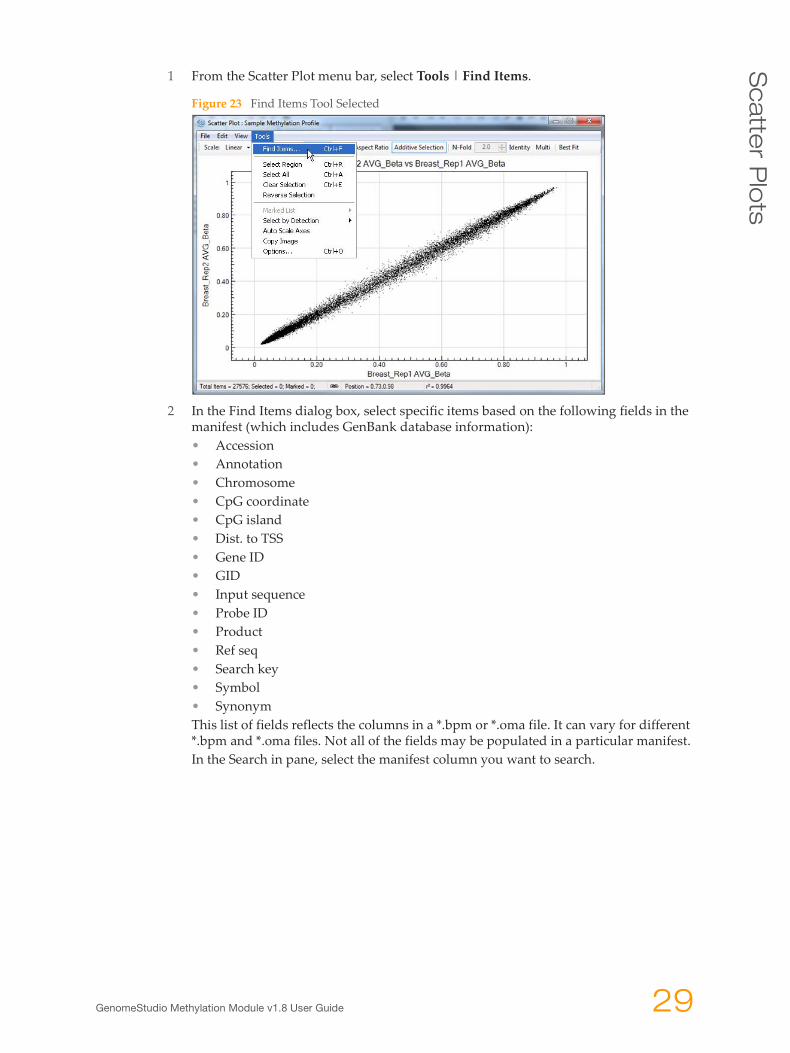
1 From the Scatter Plot menu bar, select Tools | Find Items.
Figure 23 Find Items Tool Selected
2 In the Find Items dialog box, select specific items based on the following fields in the manifest (which includes GenBank database information):• Accession• Annotation• Chromosome• CpG coordinate• CpG island• Dist. to TSS• Gene ID• GID• Input sequence• Probe ID• Product• Ref seq• Search key• Symbol• SynonymThis list of fields reflects the columns in a *.bpm or *.oma file. It can vary for different *.bpm and *.oma files. Not all of the fields may be populated in a particular manifest.In the Search in pane, select the manifest column you want to search.
GenomeStudio Methylation Module v1.8 User Guide 29
Vie
win
g Y
ou
r D
ata
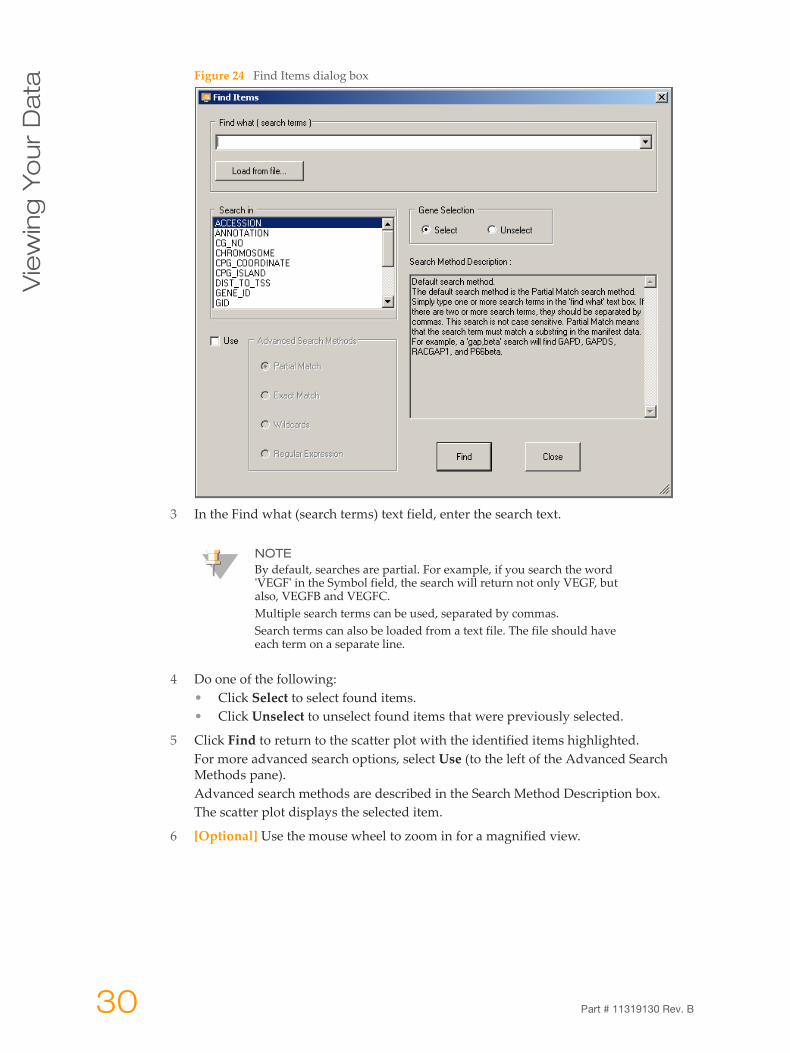
Figure 24 Find Items dialog box
3 In the Find what (search terms) text field, enter the search text.
4 Do one of the following:• Click Select to select found items.• Click Unselect to unselect found items that were previously selected.
5 Click Find to return to the scatter plot with the identified items highlighted.For more advanced search options, select Use (to the left of the Advanced Search Methods pane).Advanced search methods are described in the Search Method Description box.The scatter plot displays the selected item.
6 [Optional] Use the mouse wheel to zoom in for a magnified view.
NOTEBy default, searches are partial. For example, if you search the word 'VEGF' in the Symbol field, the search will return not only VEGF, but also, VEGFB and VEGFC.Multiple search terms can be used, separated by commas.Search terms can also be loaded from a text file. The file should have each term on a separate line.
30 Part # 11319130 Rev. B
Sc
atte
r Plo
ts
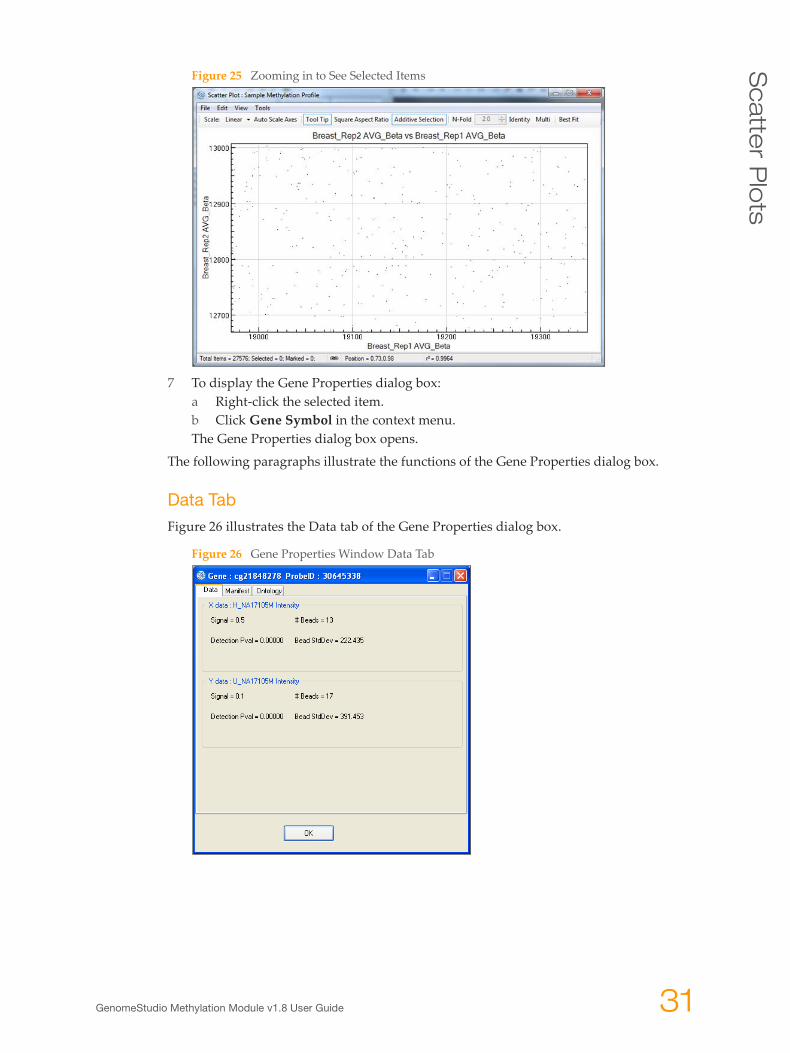
Figure 25 Zooming in to See Selected Items
7 To display the Gene Properties dialog box:a Right-click the selected item.b Click Gene Symbol in the context menu.The Gene Properties dialog box opens.
The following paragraphs illustrate the functions of the Gene Properties dialog box.
Data Tab
Figure 26 illustrates the Data tab of the Gene Properties dialog box.
Figure 26 Gene Properties Window Data Tab
GenomeStudio Methylation Module v1.8 User Guide 31
Vie
win
g Y
ou
r D
ata
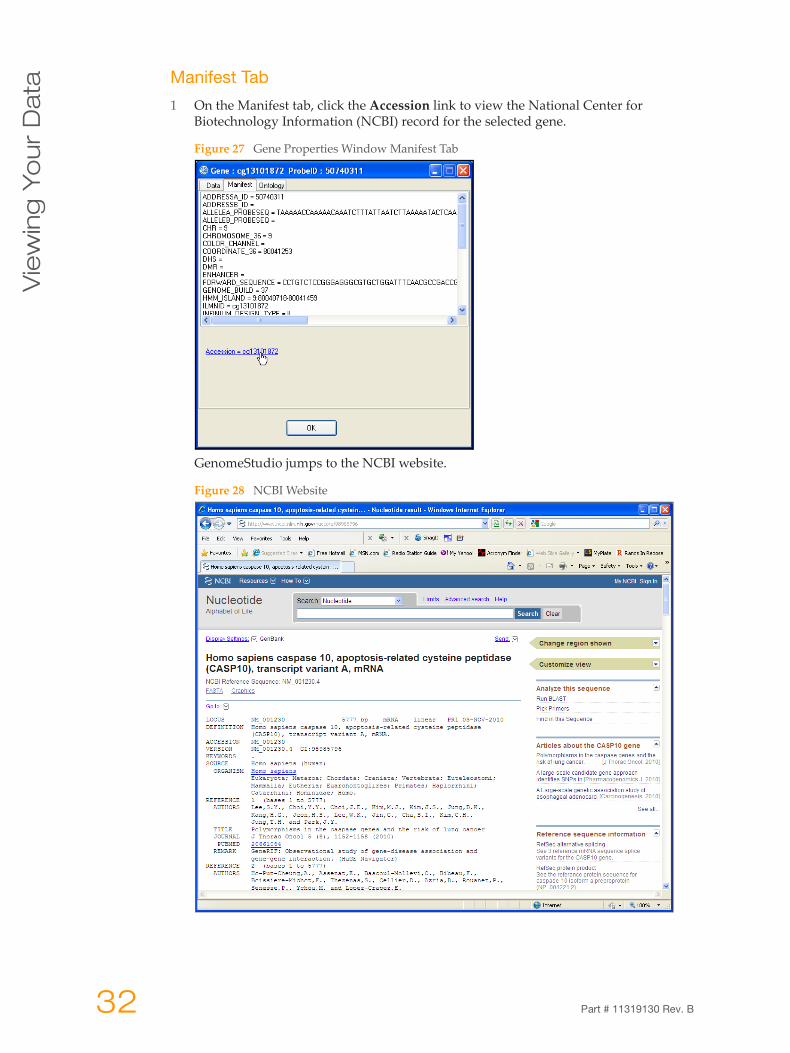
Manifest Tab
1 On the Manifest tab, click the Accession link to view the National Center for Biotechnology Information (NCBI) record for the selected gene.
Figure 27 Gene Properties Window Manifest Tab
GenomeStudio jumps to the NCBI website.
Figure 28 NCBI Website
32 Part # 11319130 Rev. B
His
tog
ram
Plo
ts
Histogram Plots
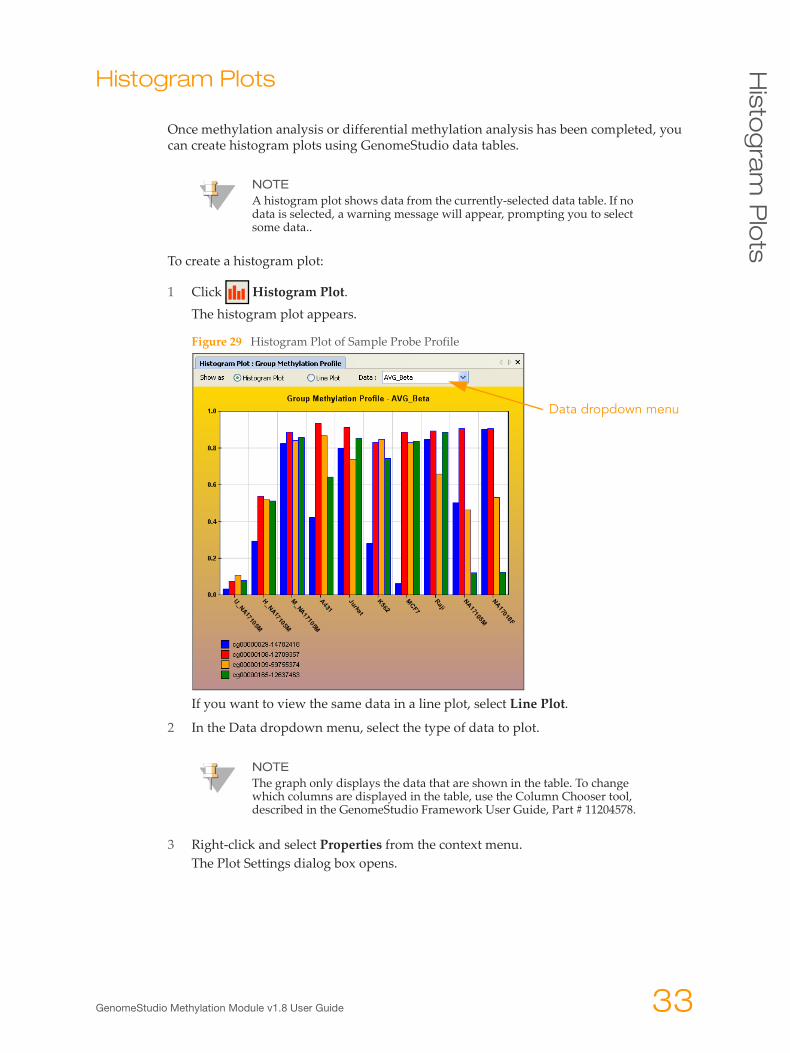
Once methylation analysis or differential methylation analysis has been completed, you can create histogram plots using GenomeStudio data tables.
To create a histogram plot:
1 Click Histogram Plot.The histogram plot appears.
Figure 29 Histogram Plot of Sample Probe Profile
If you want to view the same data in a line plot, select Line Plot.
2 In the Data dropdown menu, select the type of data to plot.
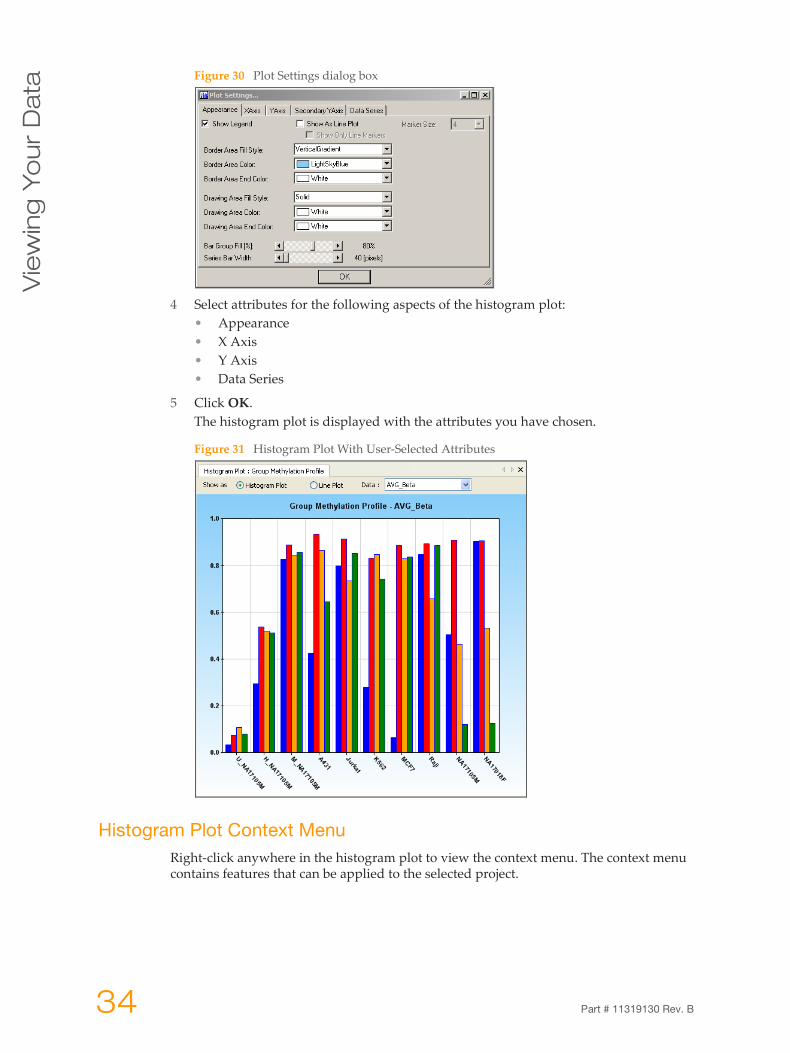
3 Right-click and select Properties from the context menu.The Plot Settings dialog box opens.
NOTEA histogram plot shows data from the currently-selected data table. If no data is selected, a warning message will appear, prompting you to select some data..
NOTEThe graph only displays the data that are shown in the table. To change which columns are displayed in the table, use the Column Chooser tool, described in the GenomeStudio Framework User Guide, Part # 11204578.
Data dropdown menu
GenomeStudio Methylation Module v1.8 User Guide 33
Vie
win
g Y
ou
r D
ata
Figure 30 Plot Settings dialog box
4 Select attributes for the following aspects of the histogram plot:• Appearance• X Axis• Y Axis• Data Series
5 Click OK.The histogram plot is displayed with the attributes you have chosen.
Figure 31 Histogram Plot With User-Selected Attributes
Histogram Plot Context Menu Right-click anywhere in the histogram plot to view the context menu. The context menu contains features that can be applied to the selected project.
34 Part # 11319130 Rev. B
His
tog
ram
Plo
ts
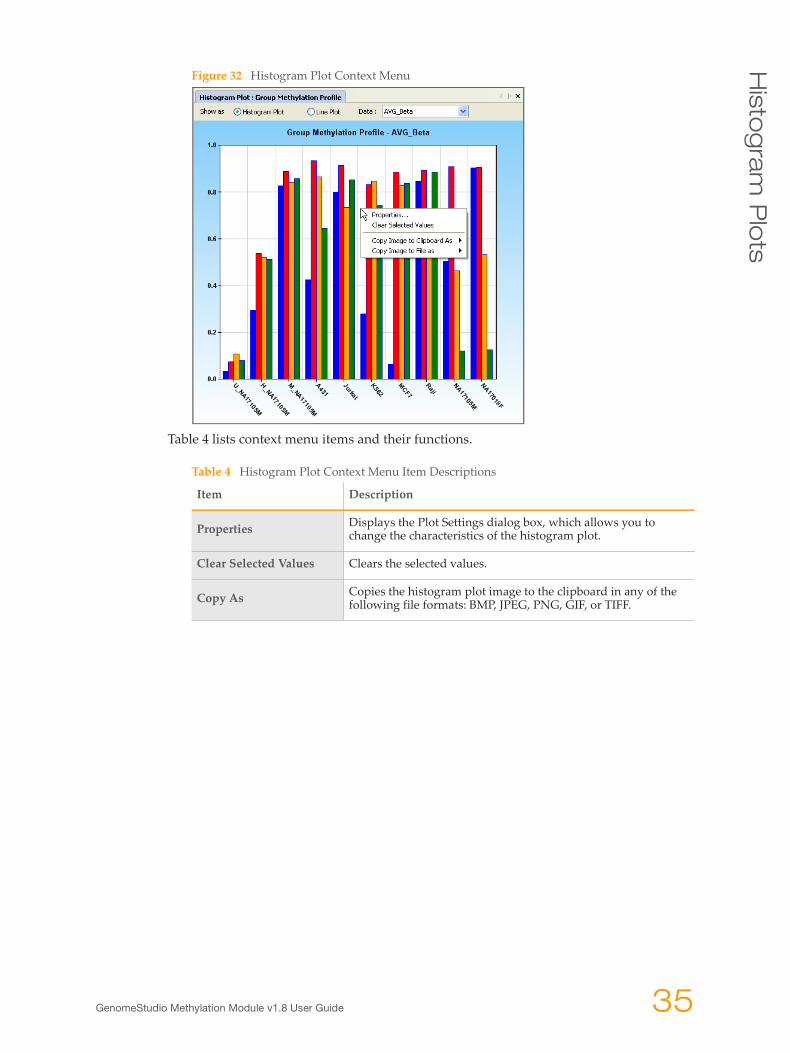
Figure 32 Histogram Plot Context Menu
Table 4 lists context menu items and their functions.
Table 4 Histogram Plot Context Menu Item Descriptions
Item Description
Properties Displays the Plot Settings dialog box, which allows you to change the characteristics of the histogram plot.
Clear Selected Values Clears the selected values.
Copy As Copies the histogram plot image to the clipboard in any of the following file formats: BMP, JPEG, PNG, GIF, or TIFF.
GenomeStudio Methylation Module v1.8 User Guide 35
Vie
win
g Y
ou
r D
ata
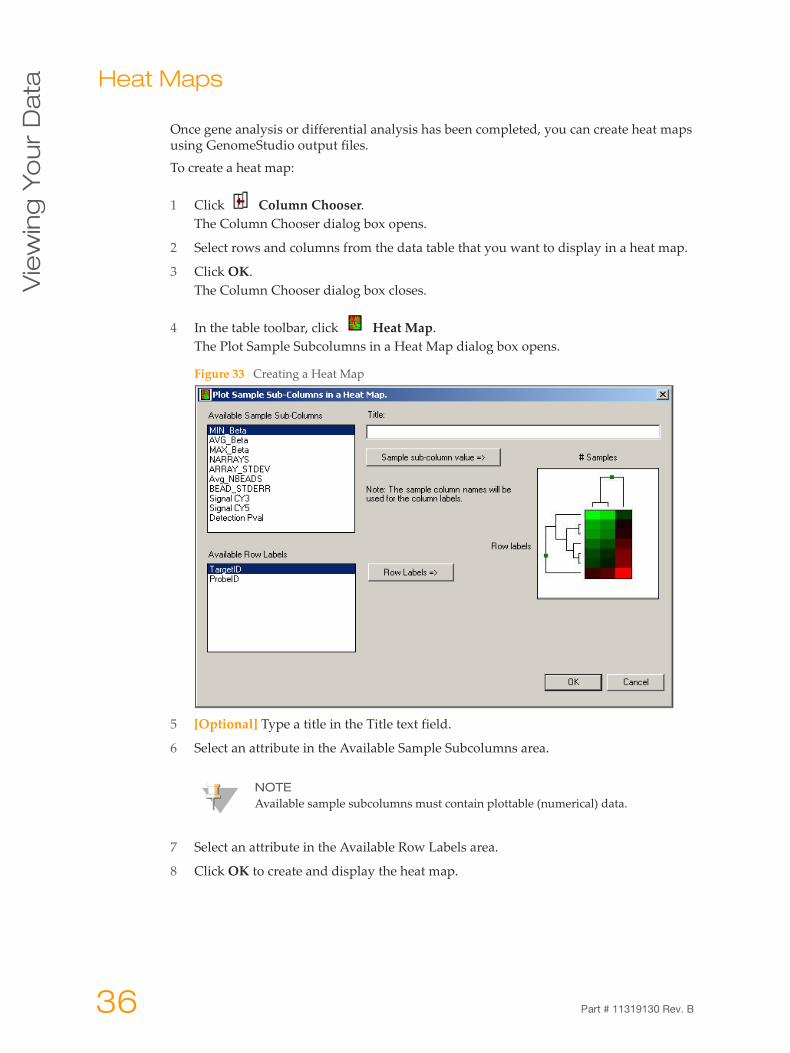
Heat MapsOnce gene analysis or differential analysis has been completed, you can create heat maps using GenomeStudio output files.
To create a heat map:
1 Click Column Chooser. The Column Chooser dialog box opens.
2 Select rows and columns from the data table that you want to display in a heat map.
3 Click OK.The Column Chooser dialog box closes.
4 In the table toolbar, click Heat Map.The Plot Sample Subcolumns in a Heat Map dialog box opens.
Figure 33 Creating a Heat Map
5 [Optional] Type a title in the Title text field.
6 Select an attribute in the Available Sample Subcolumns area.
7 Select an attribute in the Available Row Labels area.
8 Click OK to create and display the heat map.
NOTEAvailable sample subcolumns must contain plottable (numerical) data.
36 Part # 11319130 Rev. B

He
at M
aps
Figure 34 Heat Map
Heat Map Tools Menu To use additional heat map tools:
1 On the menu bar, click Tools.
2 Select Cluster or Generate Presentation Image.
Figure 35 Heat Map Tools Menu
Table 5 describes the available heat map tools.
Table 5 Heat Map Tools Menu Item Descriptions
Tool Description
ClusterDisplays the Cluster Options window, from which you can select whether to cluster rows or columns, as well as which hierarchical clustering method to use (COR, ACOR, Manhattan, or Euclidian). See “Cluster Analysis Dendrograms” on page 39 for more information about clustering methods.
Generate Presentation Image
Displays the Presentation Image Setup window, from which you can configure and generate a presentation image.
GenomeStudio Methylation Module v1.8 User Guide 37
Vie
win
g Y
ou
r D
ata
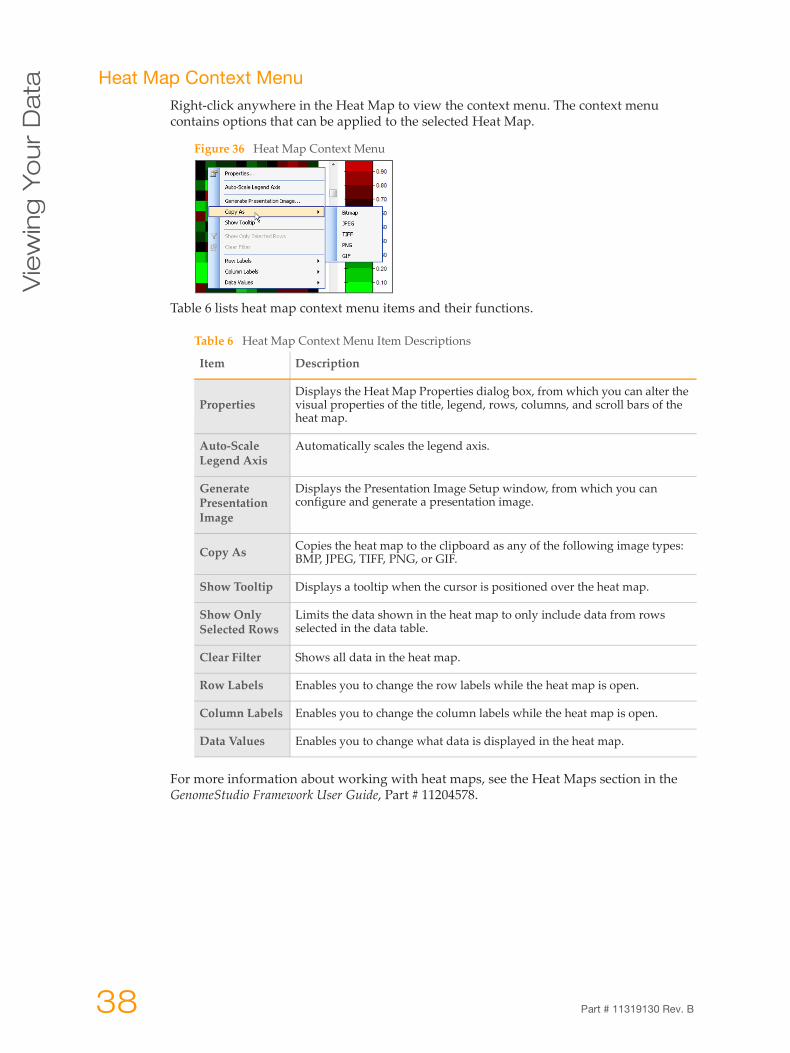
Heat Map Context MenuRight-click anywhere in the Heat Map to view the context menu. The context menu contains options that can be applied to the selected Heat Map.
Figure 36 Heat Map Context Menu
Table 6 lists heat map context menu items and their functions.
For more information about working with heat maps, see the Heat Maps section in the GenomeStudio Framework User Guide, Part # 11204578.
Table 6 Heat Map Context Menu Item Descriptions
Item Description
PropertiesDisplays the Heat Map Properties dialog box, from which you can alter the visual properties of the title, legend, rows, columns, and scroll bars of the heat map.
Auto-Scale Legend Axis
Automatically scales the legend axis.
Generate Presentation Image
Displays the Presentation Image Setup window, from which you can configure and generate a presentation image.
Copy As Copies the heat map to the clipboard as any of the following image types: BMP, JPEG, TIFF, PNG, or GIF.
Show Tooltip Displays a tooltip when the cursor is positioned over the heat map.
Show Only Selected Rows
Limits the data shown in the heat map to only include data from rows selected in the data table.
Clear Filter Shows all data in the heat map.
Row Labels Enables you to change the row labels while the heat map is open.
Column Labels Enables you to change the column labels while the heat map is open.
Data Values Enables you to change what data is displayed in the heat map.
38 Part # 11319130 Rev. B
Cluste
r An
alysis
De
nd
rog
rams
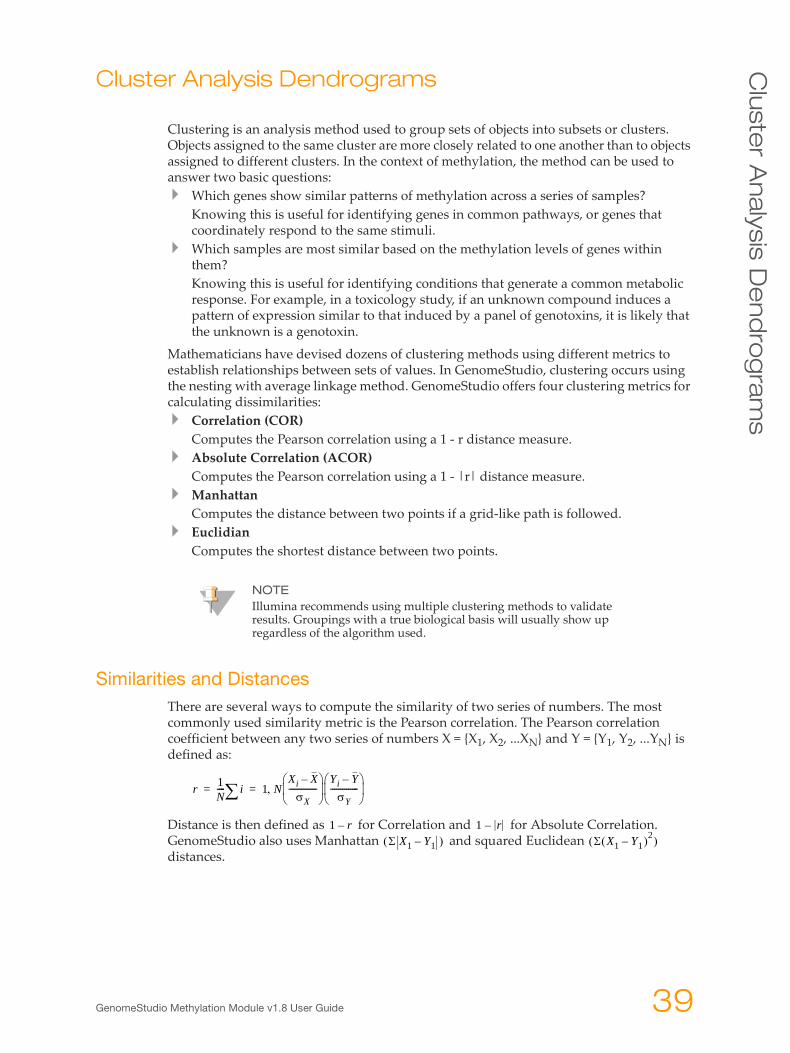
Cluster Analysis Dendrograms
Clustering is an analysis method used to group sets of objects into subsets or clusters. Objects assigned to the same cluster are more closely related to one another than to objects assigned to different clusters. In the context of methylation, the method can be used to answer two basic questions:
Which genes show similar patterns of methylation across a series of samples?Knowing this is useful for identifying genes in common pathways, or genes that coordinately respond to the same stimuli.Which samples are most similar based on the methylation levels of genes within them?Knowing this is useful for identifying conditions that generate a common metabolic response. For example, in a toxicology study, if an unknown compound induces a pattern of expression similar to that induced by a panel of genotoxins, it is likely that the unknown is a genotoxin.
Mathematicians have devised dozens of clustering methods using different metrics to establish relationships between sets of values. In GenomeStudio, clustering occurs using the nesting with average linkage method. GenomeStudio offers four clustering metrics for calculating dissimilarities:
Correlation (COR)Computes the Pearson correlation using a 1 - r distance measure.Absolute Correlation (ACOR)Computes the Pearson correlation using a 1 - |r| distance measure.ManhattanComputes the distance between two points if a grid-like path is followed.EuclidianComputes the shortest distance between two points.
Similarities and DistancesThere are several ways to compute the similarity of two series of numbers. The most commonly used similarity metric is the Pearson correlation. The Pearson correlation coefficient between any two series of numbers X = {X1, X2, ...XN} and Y = {Y1, Y2, ...YN} is defined as:
Distance is then defined as for Correlation and for Absolute Correlation. GenomeStudio also uses Manhattan and squared Euclidean distances.
NOTEIllumina recommends using multiple clustering methods to validate results. Groupings with a true biological basis will usually show up regardless of the algorithm used.
r 1N---- i∑ 1 N
Xi X–σX
--------------⎝ ⎠⎜ ⎟⎛ ⎞ Yi Y–
σY--------------⎝ ⎠⎜ ⎟⎛ ⎞
,= =
1 r– 1 r–Σ X1 Y1–( ) Σ X1 Y1–( )2( )
GenomeStudio Methylation Module v1.8 User Guide 39
Vie
win
g Y
ou
r D
ata
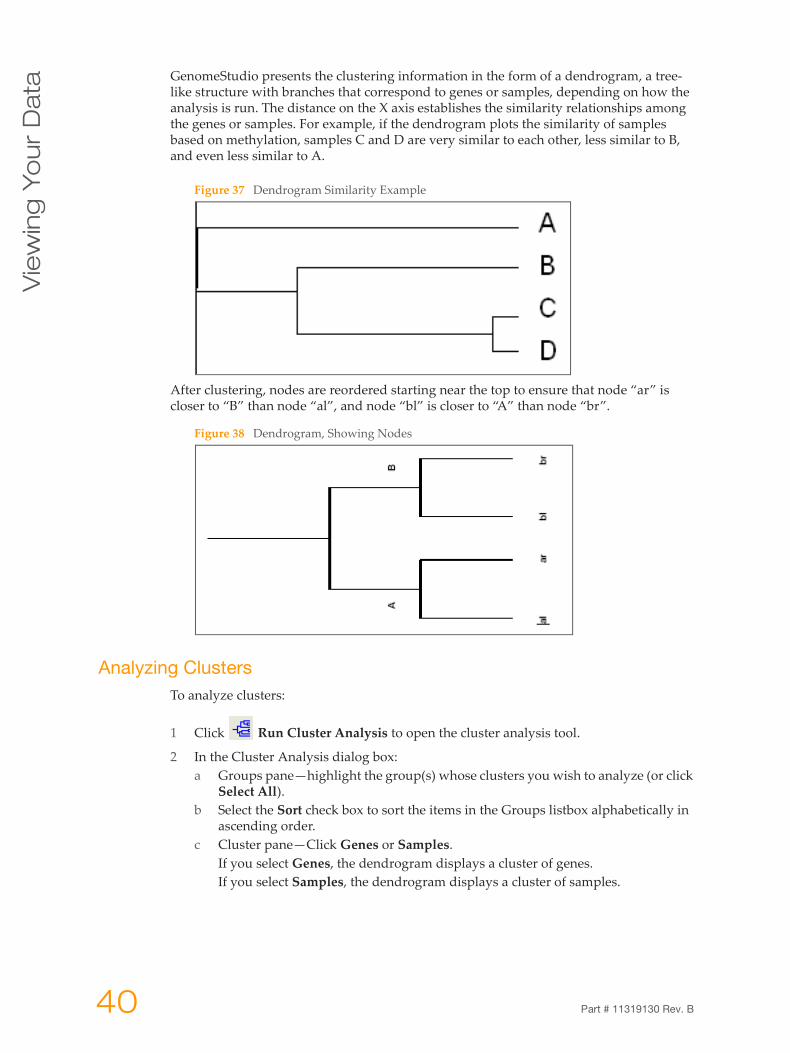
GenomeStudio presents the clustering information in the form of a dendrogram, a tree-like structure with branches that correspond to genes or samples, depending on how the analysis is run. The distance on the X axis establishes the similarity relationships among the genes or samples. For example, if the dendrogram plots the similarity of samples based on methylation, samples C and D are very similar to each other, less similar to B, and even less similar to A.
Figure 37 Dendrogram Similarity Example
After clustering, nodes are reordered starting near the top to ensure that node “ar” is closer to “B” than node “al”, and node “bl” is closer to “A” than node “br”.
Figure 38 Dendrogram, Showing Nodes
Analyzing ClustersTo analyze clusters:
1 Click Run Cluster Analysis to open the cluster analysis tool.
2 In the Cluster Analysis dialog box:a Groups pane—highlight the group(s) whose clusters you wish to analyze (or click
Select All).b Select the Sort check box to sort the items in the Groups listbox alphabetically in
ascending order.c Cluster pane—Click Genes or Samples.
If you select Genes, the dendrogram displays a cluster of genes. If you select Samples, the dendrogram displays a cluster of samples.
40 Part # 11319130 Rev. B
Cluste
r An
alysis
De
nd
rog
rams
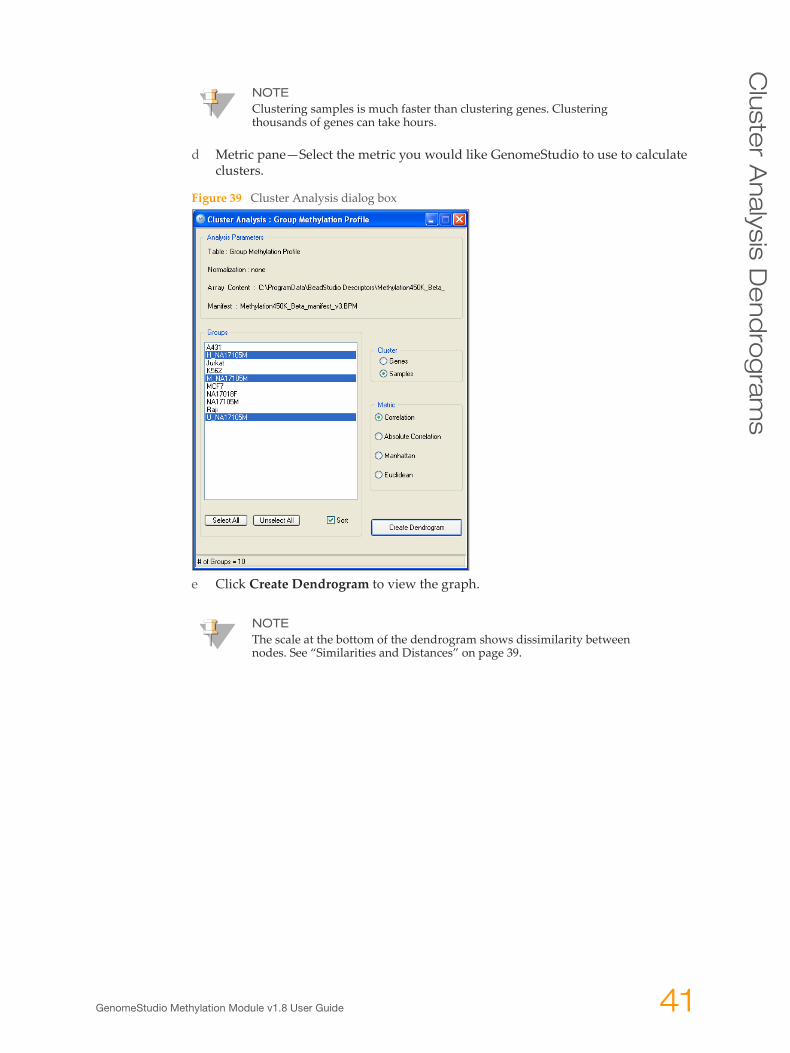
d Metric pane—Select the metric you would like GenomeStudio to use to calculate clusters.
Figure 39 Cluster Analysis dialog box
e Click Create Dendrogram to view the graph.
NOTEClustering samples is much faster than clustering genes. Clustering thousands of genes can take hours.
NOTEThe scale at the bottom of the dendrogram shows dissimilarity between nodes. See “Similarities and Distances” on page 39.
GenomeStudio Methylation Module v1.8 User Guide 41
Vie
win
g Y
ou
r D
ata
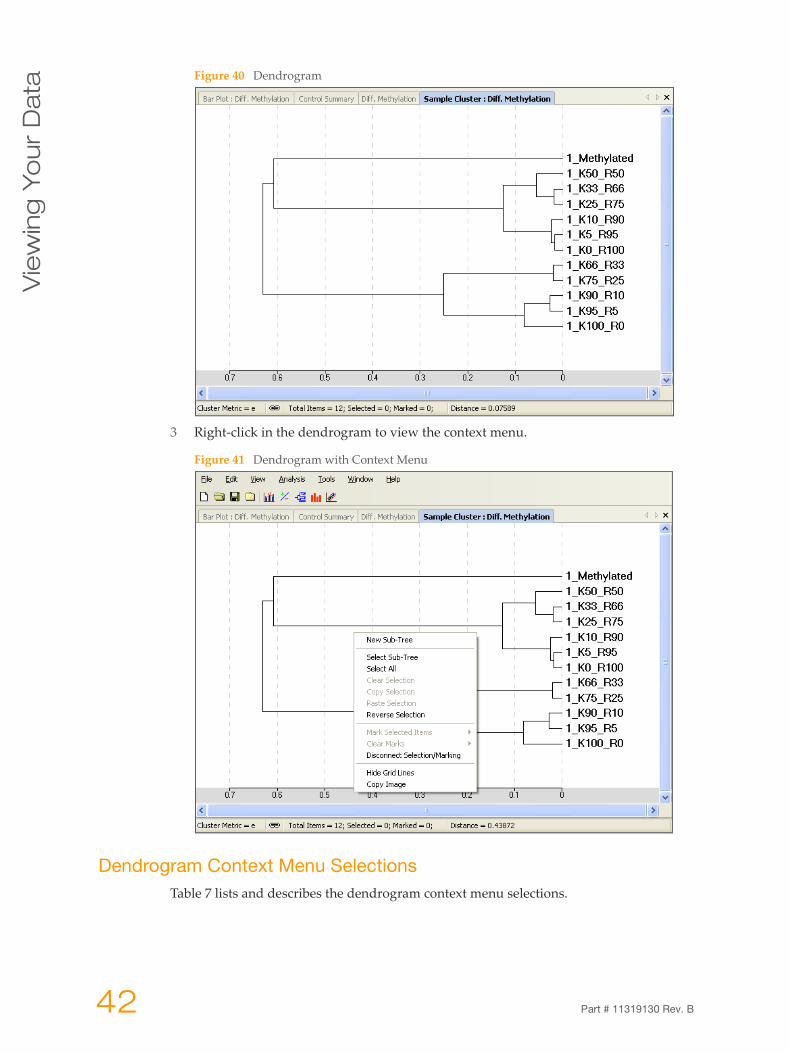
Figure 40 Dendrogram
3 Right-click in the dendrogram to view the context menu.
Figure 41 Dendrogram with Context Menu
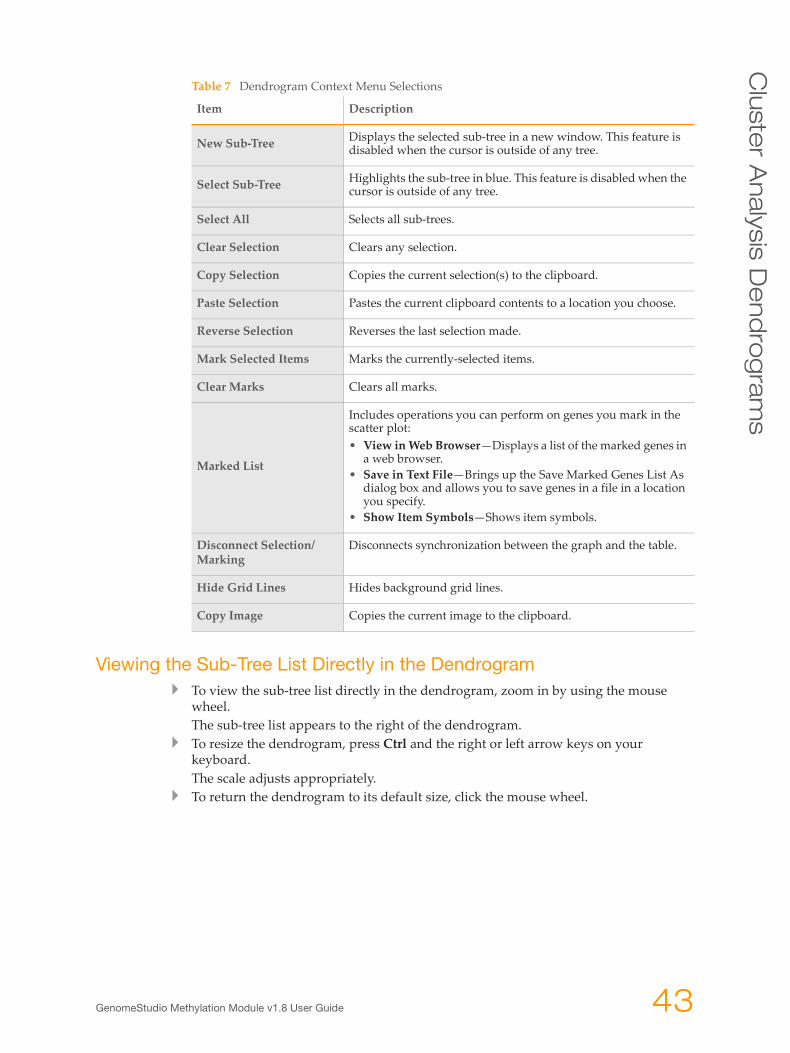
Dendrogram Context Menu SelectionsTable 7 lists and describes the dendrogram context menu selections.
42 Part # 11319130 Rev. B
Cluste
r An
alysis
De
nd
rog
rams
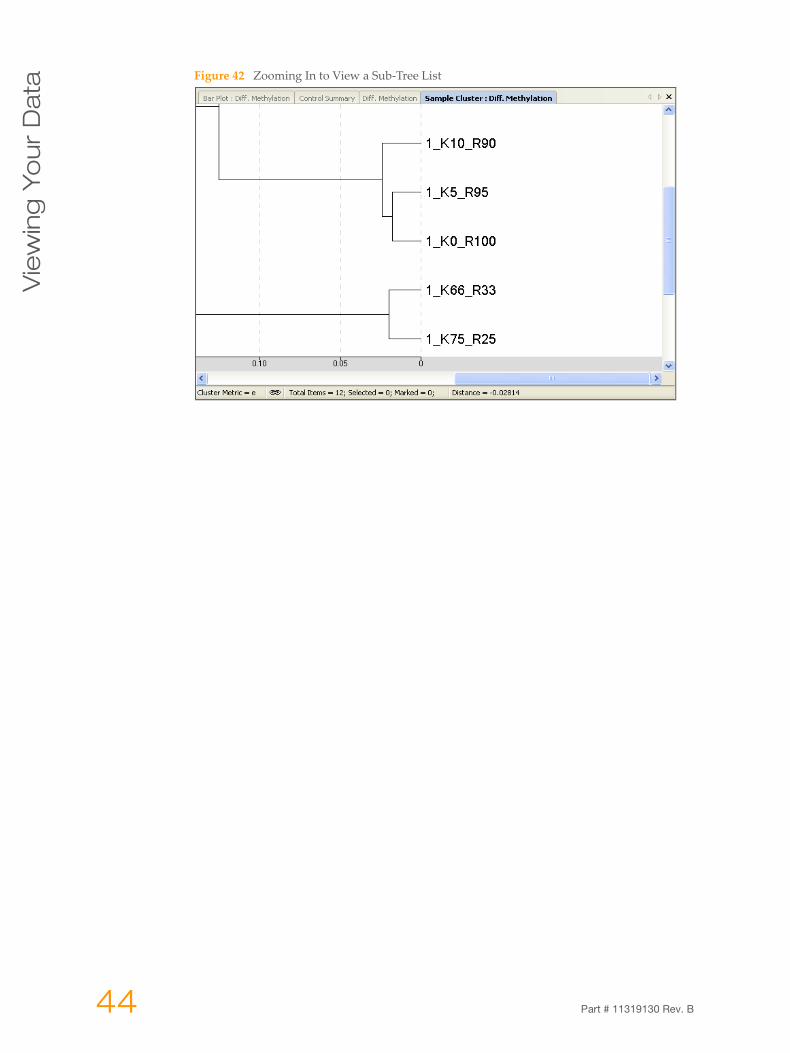
Viewing the Sub-Tree List Directly in the DendrogramTo view the sub-tree list directly in the dendrogram, zoom in by using the mouse wheel. The sub-tree list appears to the right of the dendrogram. To resize the dendrogram, press Ctrl and the right or left arrow keys on your keyboard. The scale adjusts appropriately. To return the dendrogram to its default size, click the mouse wheel.
Table 7 Dendrogram Context Menu Selections
Item Description
New Sub-Tree Displays the selected sub-tree in a new window. This feature is disabled when the cursor is outside of any tree.
Select Sub-Tree Highlights the sub-tree in blue. This feature is disabled when the cursor is outside of any tree.
Select All Selects all sub-trees.
Clear Selection Clears any selection.
Copy Selection Copies the current selection(s) to the clipboard.
Paste Selection Pastes the current clipboard contents to a location you choose.
Reverse Selection Reverses the last selection made.
Mark Selected Items Marks the currently-selected items.
Clear Marks Clears all marks.
Marked List
Includes operations you can perform on genes you mark in the scatter plot:• View in Web Browser—Displays a list of the marked genes in
a web browser.• Save in Text File—Brings up the Save Marked Genes List As
dialog box and allows you to save genes in a file in a location you specify.
• Show Item Symbols—Shows item symbols.
Disconnect Selection/Marking
Disconnects synchronization between the graph and the table.
Hide Grid Lines Hides background grid lines.
Copy Image Copies the current image to the clipboard.
GenomeStudio Methylation Module v1.8 User Guide 43
Vie
win
g Y
ou
r D
ata
Figure 42 Zooming In to View a Sub-Tree List
44 Part # 11319130 Rev. B
Co
py/P
aste
Ge
ne
Cluste
rs
Copy/Paste Gene Clusters
You can copy and paste gene clusters from a scatter plot to a dendrogram and vice versa.
From Scatter Plot to Dendrogram1 In the scatter plot, do one of the following:
• Select Tools | Select Region from the pulldown menu.• Open the context menu and click Select Region.
2 Using the crosshair tool, draw a shape around the genes you want to copy.The selected genes change color (blue by default, or the color you have set in Scatter Plot Options).
3 Open the context menu and click Copy Selection.
4 To paste the selection into the dendrogram, do one of the following:• Select Tools | Paste Selection from the pulldown menu.• Open the context menu and click Paste Selection.
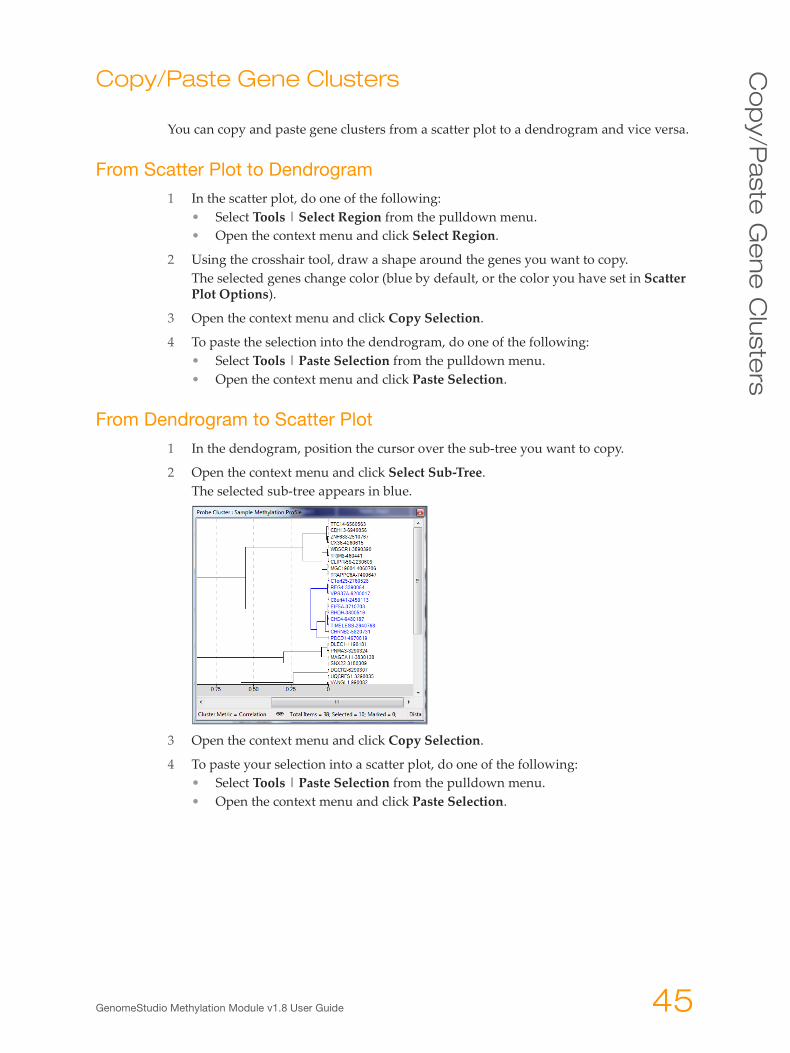
From Dendrogram to Scatter Plot
1 In the dendogram, position the cursor over the sub-tree you want to copy.
2 Open the context menu and click Select Sub-Tree.The selected sub-tree appears in blue.
3 Open the context menu and click Copy Selection.
4 To paste your selection into a scatter plot, do one of the following:• Select Tools | Paste Selection from the pulldown menu.• Open the context menu and click Paste Selection.
GenomeStudio Methylation Module v1.8 User Guide 45

Vie
win
g Y
ou
r D
ata
46 Part # 11319130 Rev. B
Ch
ap
ter 4
Applying Methylation
Algorithms
Methylation Analysis Algorithms . . . . . . . . . . . . . . . . . . . . . . . . . . . . . . . . . . . . 48
Normalization Methods and Algorithms. . . . . . . . . . . . . . . . . . . . . . . . . . . . . . . 49
Differential Methylation Analysis Algorithms . . . . . . . . . . . . . . . . . . . . . . . . . . . 51
GenomeStudio Methylation Module v1.8 User Guide 47
Ap
ply
ing
Me
thyla
tio
n A
lgo
rith
ms
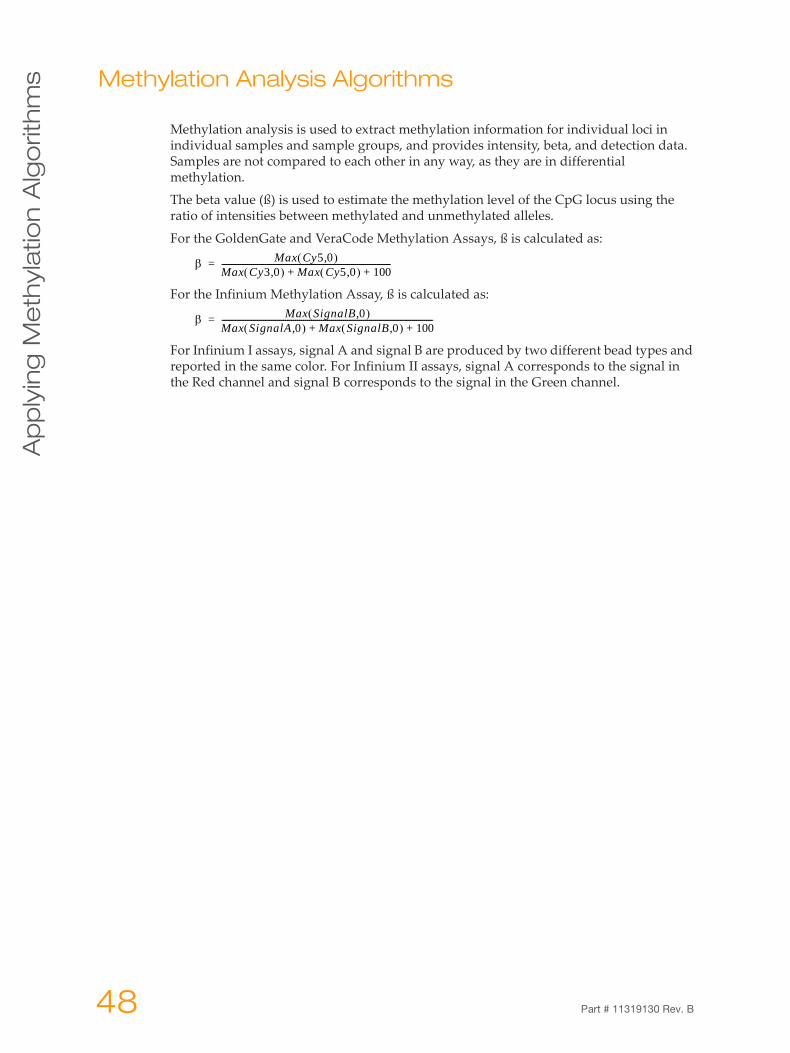
Methylation Analysis AlgorithmsMethylation analysis is used to extract methylation information for individual loci in individual samples and sample groups, and provides intensity, beta, and detection data. Samples are not compared to each other in any way, as they are in differential methylation.
The beta value (ß) is used to estimate the methylation level of the CpG locus using the ratio of intensities between methylated and unmethylated alleles.
For the GoldenGate and VeraCode Methylation Assays, ß is calculated as:
For the Infinium Methylation Assay, ß is calculated as:
For Infinium I assays, signal A and signal B are produced by two different bead types and reported in the same color. For Infinium II assays, signal A corresponds to the signal in the Red channel and signal B corresponds to the signal in the Green channel.
β Max Cy5 0,( )Max Cy3 0,( ) Max Cy5 0,( ) 100+ +-------------------------------------------------------------------------------------=
β Max SignalB 0,( )Max SignalA 0,( ) Max SignalB 0,( ) 100+ +----------------------------------------------------------------------------------------------------------=
48 Part # 11319130 Rev. B
No
rma
liza
tion
Me
tho
ds a
nd
Alg
orith
ms
Normalization Methods and Algorithms
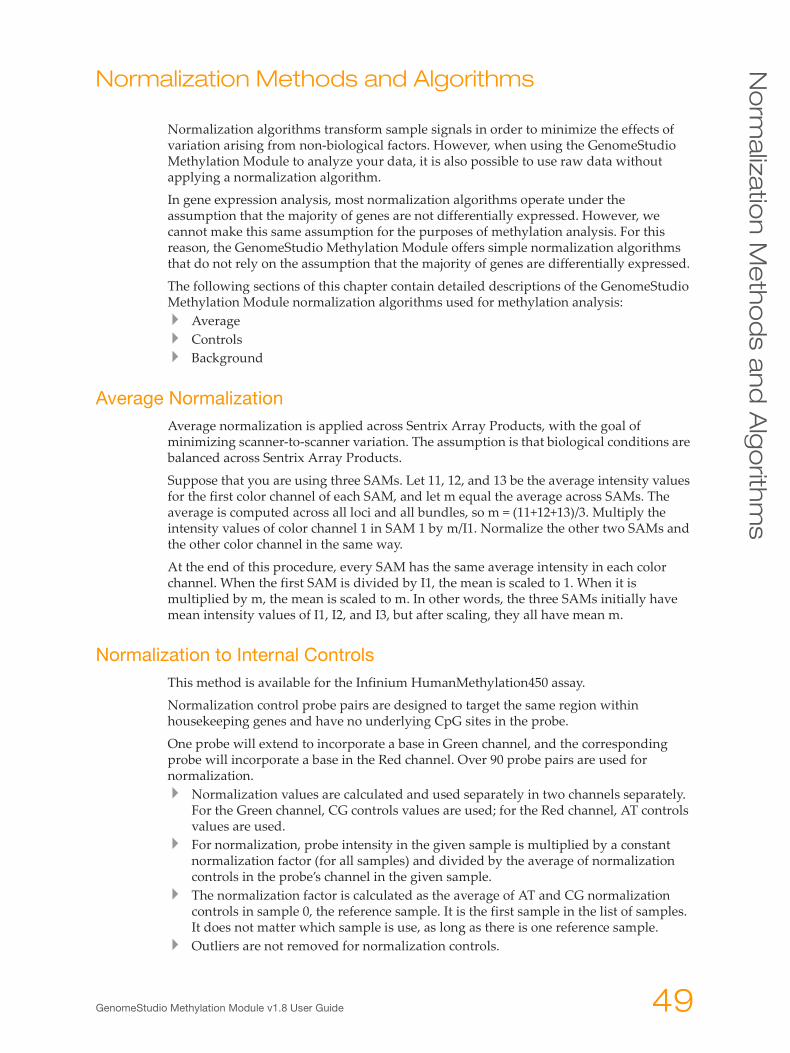
Normalization algorithms transform sample signals in order to minimize the effects of variation arising from non-biological factors. However, when using the GenomeStudio Methylation Module to analyze your data, it is also possible to use raw data without applying a normalization algorithm.
In gene expression analysis, most normalization algorithms operate under the assumption that the majority of genes are not differentially expressed. However, we cannot make this same assumption for the purposes of methylation analysis. For this reason, the GenomeStudio Methylation Module offers simple normalization algorithms that do not rely on the assumption that the majority of genes are differentially expressed.
The following sections of this chapter contain detailed descriptions of the GenomeStudio Methylation Module normalization algorithms used for methylation analysis:
AverageControlsBackground
Average NormalizationAverage normalization is applied across Sentrix Array Products, with the goal of minimizing scanner-to-scanner variation. The assumption is that biological conditions are balanced across Sentrix Array Products.
Suppose that you are using three SAMs. Let 11, 12, and 13 be the average intensity values for the first color channel of each SAM, and let m equal the average across SAMs. The average is computed across all loci and all bundles, so m = (11+12+13)/3. Multiply the intensity values of color channel 1 in SAM 1 by m/I1. Normalize the other two SAMs and the other color channel in the same way.
At the end of this procedure, every SAM has the same average intensity in each color channel. When the first SAM is divided by I1, the mean is scaled to 1. When it is multiplied by m, the mean is scaled to m. In other words, the three SAMs initially have mean intensity values of I1, I2, and I3, but after scaling, they all have mean m.
Normalization to Internal ControlsThis method is available for the Infinium HumanMethylation450 assay.
Normalization control probe pairs are designed to target the same region within housekeeping genes and have no underlying CpG sites in the probe.
One probe will extend to incorporate a base in Green channel, and the corresponding probe will incorporate a base in the Red channel. Over 90 probe pairs are used for normalization.
Normalization values are calculated and used separately in two channels separately. For the Green channel, CG controls values are used; for the Red channel, AT controls values are used.For normalization, probe intensity in the given sample is multiplied by a constant normalization factor (for all samples) and divided by the average of normalization controls in the probe’s channel in the given sample. The normalization factor is calculated as the average of AT and CG normalization controls in sample 0, the reference sample. It is the first sample in the list of samples. It does not matter which sample is use, as long as there is one reference sample.Outliers are not removed for normalization controls.
GenomeStudio Methylation Module v1.8 User Guide 49
Ap
ply
ing
Me
thyla
tio
n A
lgo
rith
ms
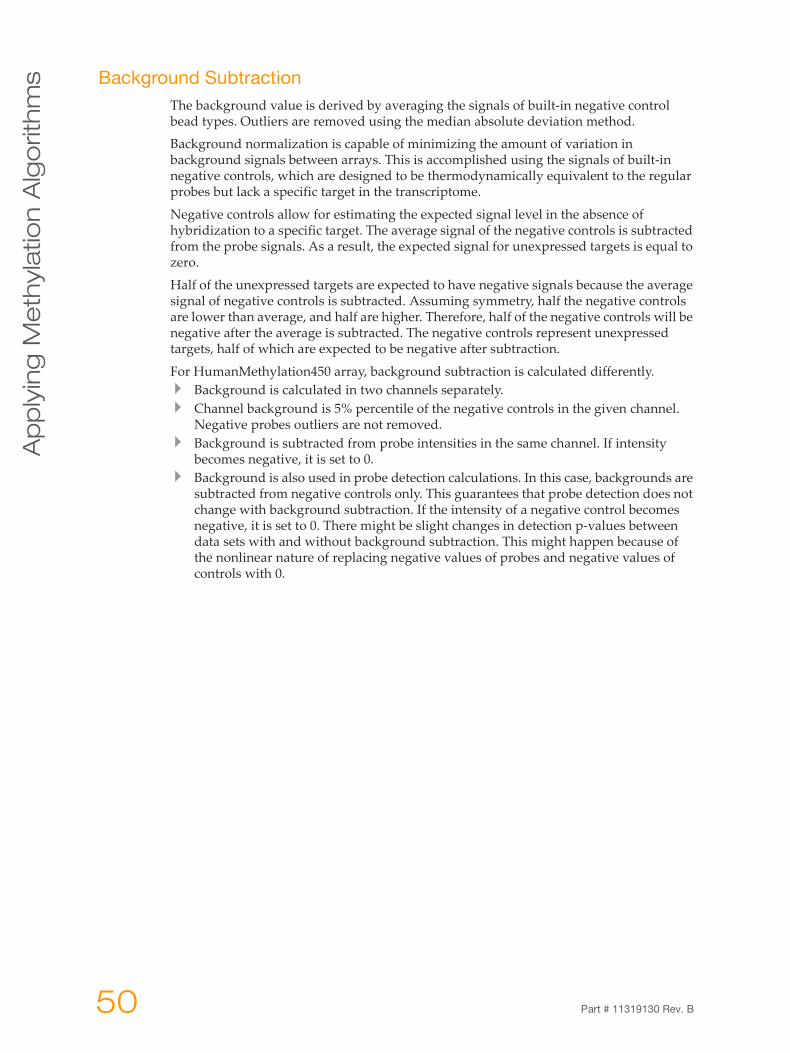
Background SubtractionThe background value is derived by averaging the signals of built-in negative control bead types. Outliers are removed using the median absolute deviation method.
Background normalization is capable of minimizing the amount of variation in background signals between arrays. This is accomplished using the signals of built-in negative controls, which are designed to be thermodynamically equivalent to the regular probes but lack a specific target in the transcriptome.
Negative controls allow for estimating the expected signal level in the absence of hybridization to a specific target. The average signal of the negative controls is subtracted from the probe signals. As a result, the expected signal for unexpressed targets is equal to zero.
Half of the unexpressed targets are expected to have negative signals because the average signal of negative controls is subtracted. Assuming symmetry, half the negative controls are lower than average, and half are higher. Therefore, half of the negative controls will be negative after the average is subtracted. The negative controls represent unexpressed targets, half of which are expected to be negative after subtraction.
For HumanMethylation450 array, background subtraction is calculated differently.Background is calculated in two channels separately. Channel background is 5% percentile of the negative controls in the given channel. Negative probes outliers are not removed. Background is subtracted from probe intensities in the same channel. If intensity becomes negative, it is set to 0. Background is also used in probe detection calculations. In this case, backgrounds are subtracted from negative controls only. This guarantees that probe detection does not change with background subtraction. If the intensity of a negative control becomes negative, it is set to 0. There might be slight changes in detection p-values between data sets with and without background subtraction. This might happen because of the nonlinear nature of replacing negative values of probes and negative values of controls with 0.
50 Part # 11319130 Rev. B
Diffe
ren
tial M
eth
yla
tion
An
alysis
Alg
orith
ms
Differential Methylation Analysis Algorithms
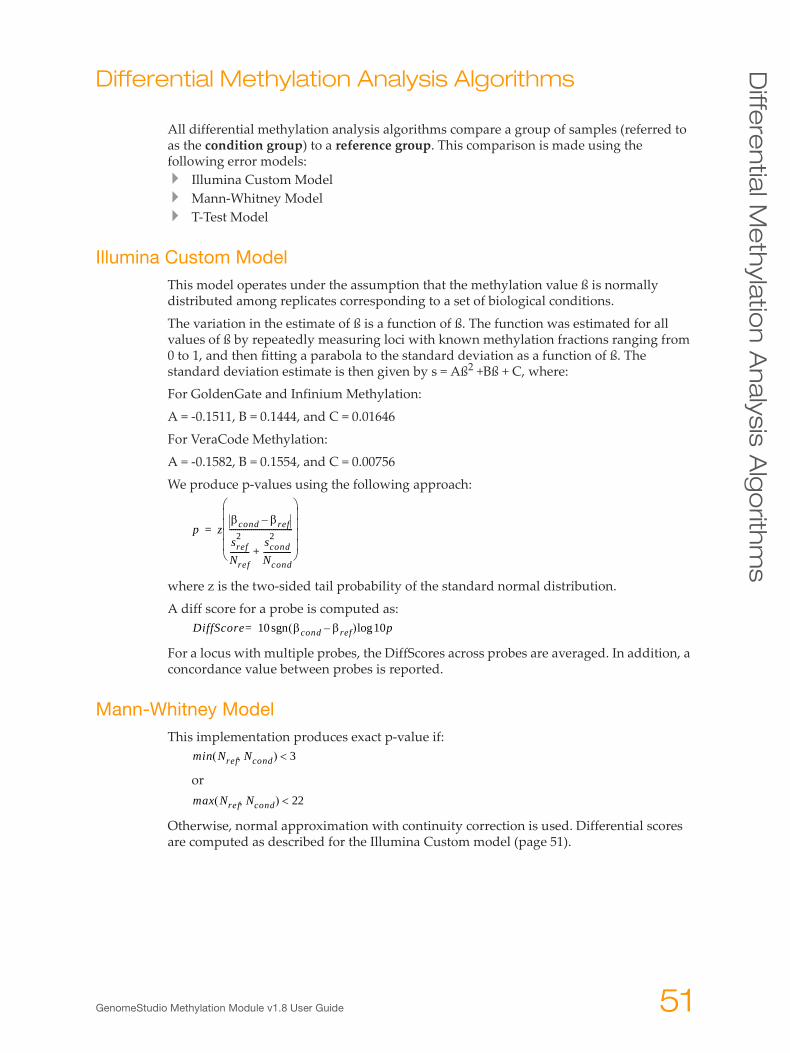
All differential methylation analysis algorithms compare a group of samples (referred to as the condition group) to a reference group. This comparison is made using the following error models:
Illumina Custom ModelMann-Whitney ModelT-Test Model
Illumina Custom ModelThis model operates under the assumption that the methylation value ß is normally distributed among replicates corresponding to a set of biological conditions.
The variation in the estimate of ß is a function of ß. The function was estimated for all values of ß by repeatedly measuring loci with known methylation fractions ranging from 0 to 1, and then fitting a parabola to the standard deviation as a function of ß. The standard deviation estimate is then given by s = Aß2 +Bß + C, where:
For GoldenGate and Infinium Methylation:
A = -0.1511, B = 0.1444, and C = 0.01646
For VeraCode Methylation:
A = -0.1582, B = 0.1554, and C = 0.00756
We produce p-values using the following approach:
where z is the two-sided tail probability of the standard normal distribution.
A diff score for a probe is computed as:
For a locus with multiple probes, the DiffScores across probes are averaged. In addition, a concordance value between probes is reported.
Mann-Whitney ModelThis implementation produces exact p-value if:
or
Otherwise, normal approximation with continuity correction is used. Differential scores are computed as described for the Illumina Custom model (page 51).
p zβcond βref–
sref2
Nref----------
scond2
Ncond--------------+
--------------------------------
⎝ ⎠⎜ ⎟⎜ ⎟⎜ ⎟⎜ ⎟⎛ ⎞
=
DiffScore 10 βcond βref–( ) 10log psgn=
min Nref Ncond,( ) 3<
max Nref Ncond,( ) 22<
GenomeStudio Methylation Module v1.8 User Guide 51
Ap
ply
ing
Me
thyla
tio
n A
lgo
rith
ms
T-Test ModelWhen either the reference group or a condition group contains at least two samples, variance is estimated across replicate samples. Otherwise, variance is estimated from bead-to-bead variation. We use t-test with the assumption of equal variance. Differential scores are computed the same way as described for the Illumina Custom model (page 51).
52 Part # 11319130 Rev. B

Ch
ap
ter 5
Comparing Methylation and
Gene Expression Data
Introduction . . . . . . . . . . . . . . . . . . . . . . . . . . . . . . . . . . . . . . . . . . . . . . . . . . . . 54
Importing Gene Expression Data. . . . . . . . . . . . . . . . . . . . . . . . . . . . . . . . . . . . 55
Visualize the Correlation of Methylation and Expression Levels Data . . . . . . . . 58
GenomeStudio Methylation Module v1.8 User Guide 53
Co
mp
arin
g M
eth
yla
tio
n a
nd
Ge
ne
Ex
pre
ssio
n D
ata
IntroductionThis chapter describes how to analyze the correlation between:levels of DNA methylation for particular CpG loci levels of the expression of this gene in the same sample
Use the Methylation/Gene Expression Comparison tool if you have expression data collected for the genes present on the BeadChip or in the OMA pool (oligo pool for the Methylation Assay).
54 Part # 11319130 Rev. B

Imp
ortin
g G
en
e E
xp
ressio
n D
ata
Importing Gene Expression Data
GenomeStudio gene expression data tables can be exported from the GenomeStudio Gene Expression Module and saved as tab-delimited (*.txt) data files for use with the GenomeStudio Methylation Module.
In order to perform a comparison between gene expression and methylation data, the sample names in the methylation project must match the sample names in the gene expression data file.
To import gene expression data from the GenomeStudio Gene Expression Module into the GenomeStudio Methylation Module, identify a gene expression data file in tab-delimited (*.txt) format that you want to import into the GenomeStudio Methylation Module. Prepare a gene lookup table if the identification of probes in the expression file is different from the TargetID used in the Methylation manifest. The first column in the Lookup table should be a Gene Expression unique probe identifier, and the second column should be a corresponding Methylation probe identifier.
1 In the main menu, select Analysis | Import Gene Expression Data.
Figure 43 Importing Gene Expression Data
The Import Gene Expression Data dialog box opens.
Figure 44 Import Gene Expression dialog box
GenomeStudio Methylation Module v1.8 User Guide 55
Co
mp
arin
g M
eth
yla
tio
n a
nd
Ge
ne
Ex
pre
ssio
n D
ata
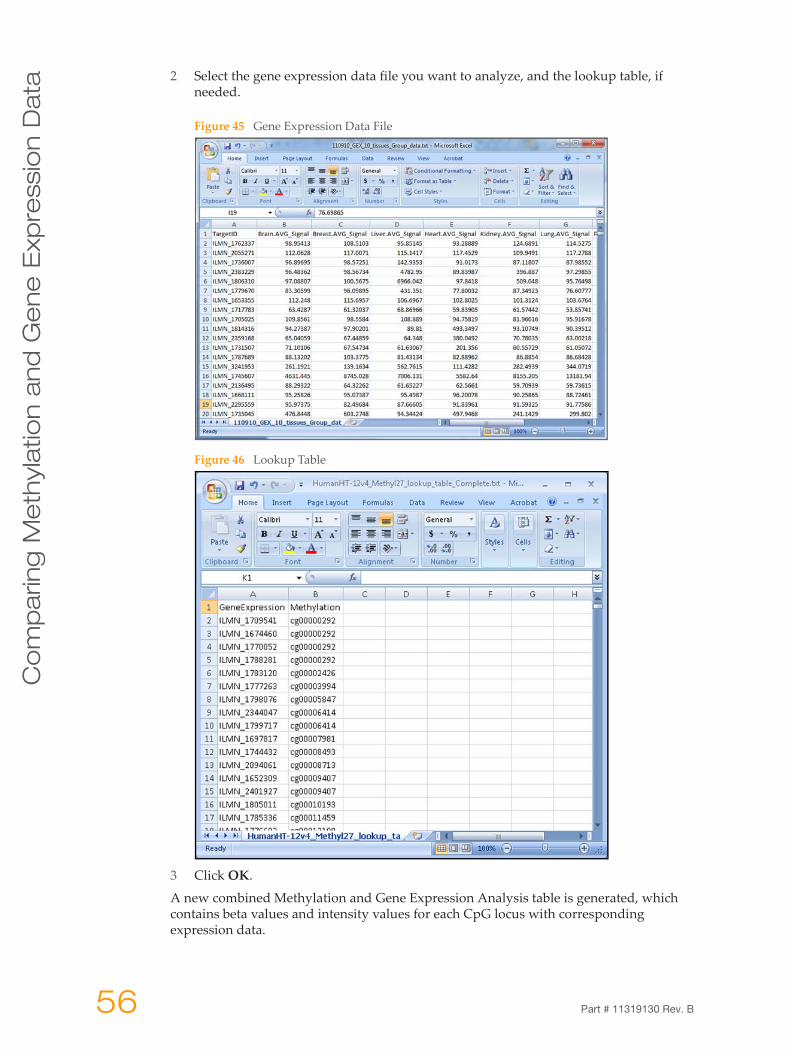
2 Select the gene expression data file you want to analyze, and the lookup table, if needed.
Figure 45 Gene Expression Data File
Figure 46 Lookup Table
3 Click OK.
A new combined Methylation and Gene Expression Analysis table is generated, which contains beta values and intensity values for each CpG locus with corresponding expression data.
56 Part # 11319130 Rev. B
Imp
ortin
g G
en
e E
xp
ressio
n D
ata
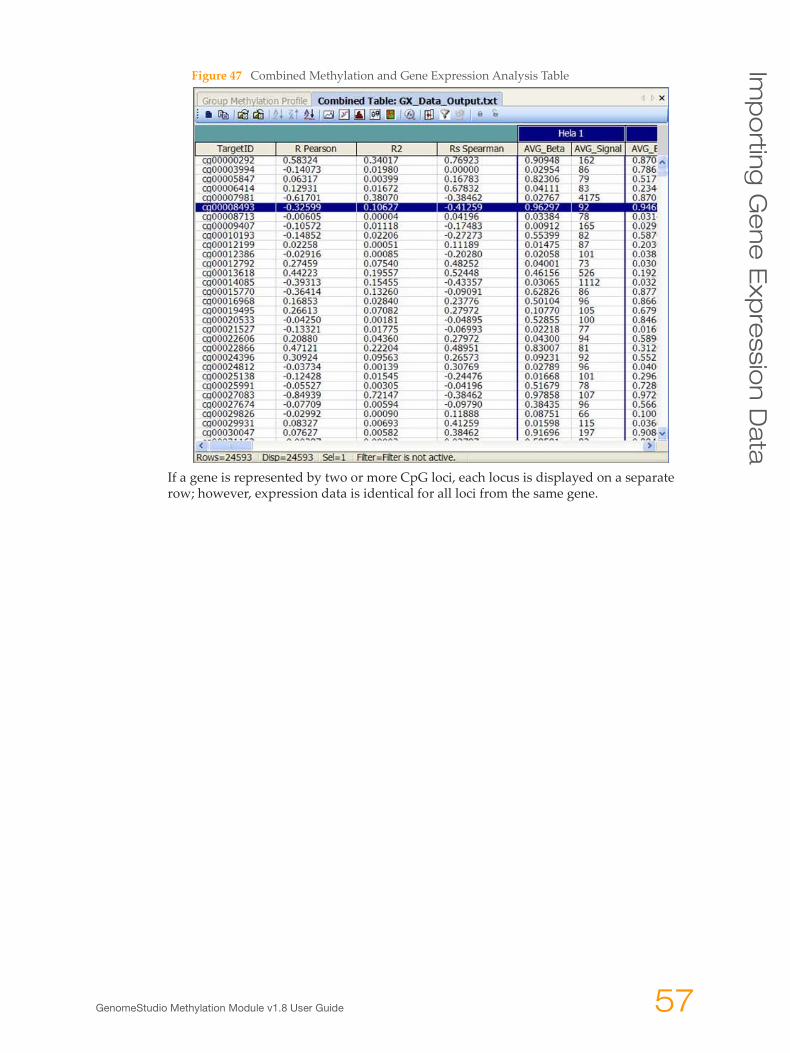
Figure 47 Combined Methylation and Gene Expression Analysis Table
If a gene is represented by two or more CpG loci, each locus is displayed on a separate row; however, expression data is identical for all loci from the same gene.
GenomeStudio Methylation Module v1.8 User Guide 57
Co
mp
arin
g M
eth
yla
tio
n a
nd
Ge
ne
Ex
pre
ssio
n D
ata
Visualize the Correlation of Methylation andExpression Levels Data
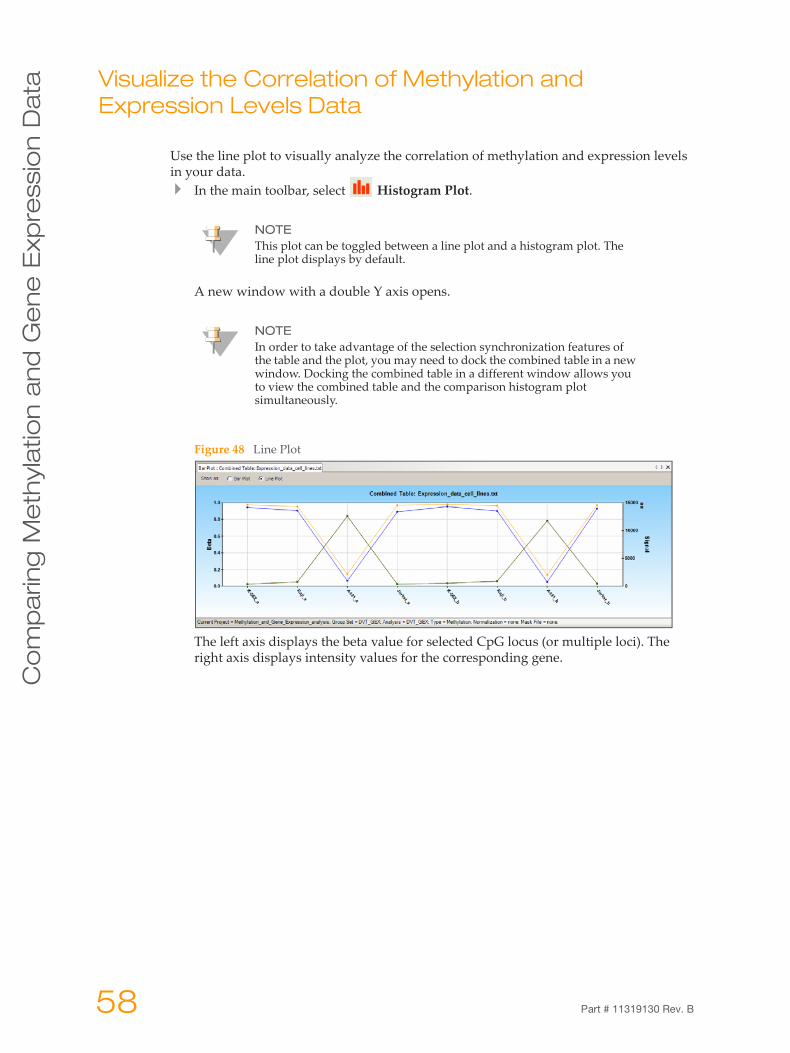
Use the line plot to visually analyze the correlation of methylation and expression levels in your data.
In the main toolbar, select Histogram Plot.
A new window with a double Y axis opens.
Figure 48 Line Plot
The left axis displays the beta value for selected CpG locus (or multiple loci). The right axis displays intensity values for the corresponding gene.
NOTEThis plot can be toggled between a line plot and a histogram plot. The line plot displays by default.
NOTEIn order to take advantage of the selection synchronization features of the table and the plot, you may need to dock the combined table in a new window. Docking the combined table in a different window allows you to view the combined table and the comparison histogram plot simultaneously.
58 Part # 11319130 Rev. B
Ch
ap
ter 6
User Interface Reference
Introduction . . . . . . . . . . . . . . . . . . . . . . . . . . . . . . . . . . . . . . . . . . . . . . . . . . . . 60
Detachable Docking Windows. . . . . . . . . . . . . . . . . . . . . . . . . . . . . . . . . . . . . . 61
Main Window Menus . . . . . . . . . . . . . . . . . . . . . . . . . . . . . . . . . . . . . . . . . . . . . 91
Context Menus. . . . . . . . . . . . . . . . . . . . . . . . . . . . . . . . . . . . . . . . . . . . . . . . . . 94
GenomeStudio Methylation Module v1.8 User Guide 59
Use
r In
terf
ac
e R
efe
ren
ce
IntroductionThis chapter includes descriptions of the detachable docking windows, main window menus, and context menus available in the GenomeStudio Methylation Module.
60 Part # 11319130 Rev. B
De
tac
hab
le D
oc
kin
g W
ind
ows
Detachable Docking Windows
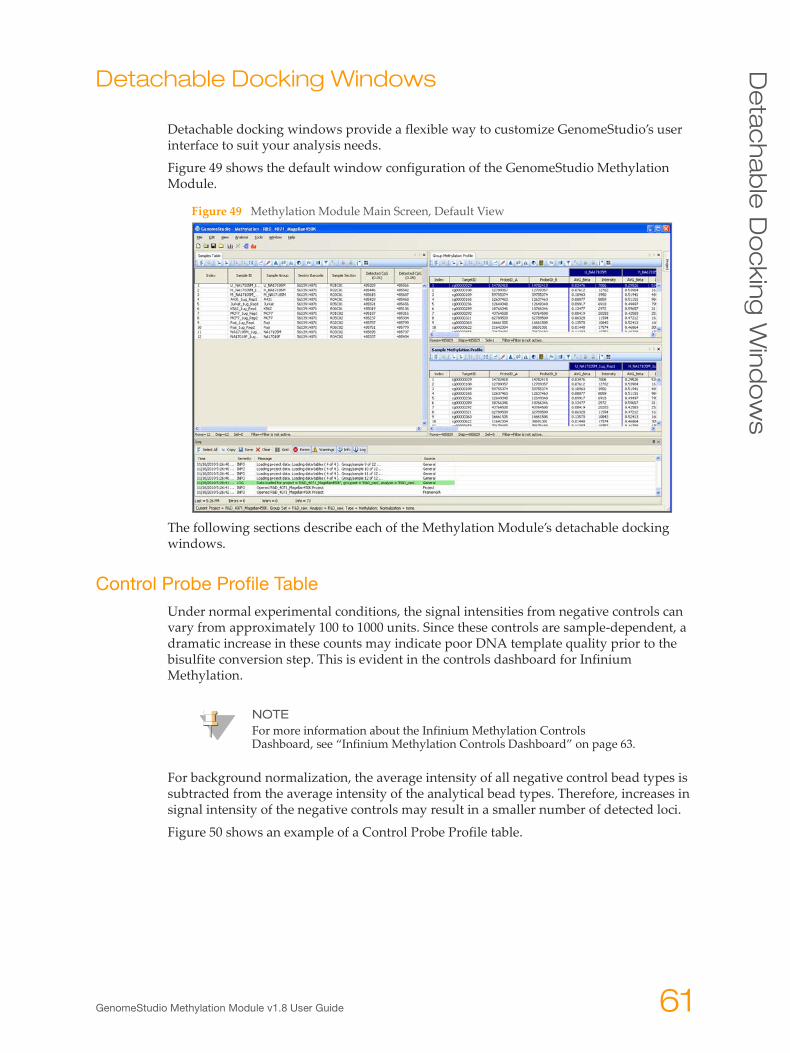
Detachable docking windows provide a flexible way to customize GenomeStudio’s user interface to suit your analysis needs.
Figure 49 shows the default window configuration of the GenomeStudio Methylation Module.
Figure 49 Methylation Module Main Screen, Default View
The following sections describe each of the Methylation Module’s detachable docking windows.
Control Probe Profile TableUnder normal experimental conditions, the signal intensities from negative controls can vary from approximately 100 to 1000 units. Since these controls are sample-dependent, a dramatic increase in these counts may indicate poor DNA template quality prior to the bisulfite conversion step. This is evident in the controls dashboard for Infinium Methylation.
For background normalization, the average intensity of all negative control bead types is subtracted from the average intensity of the analytical bead types. Therefore, increases in signal intensity of the negative controls may result in a smaller number of detected loci.
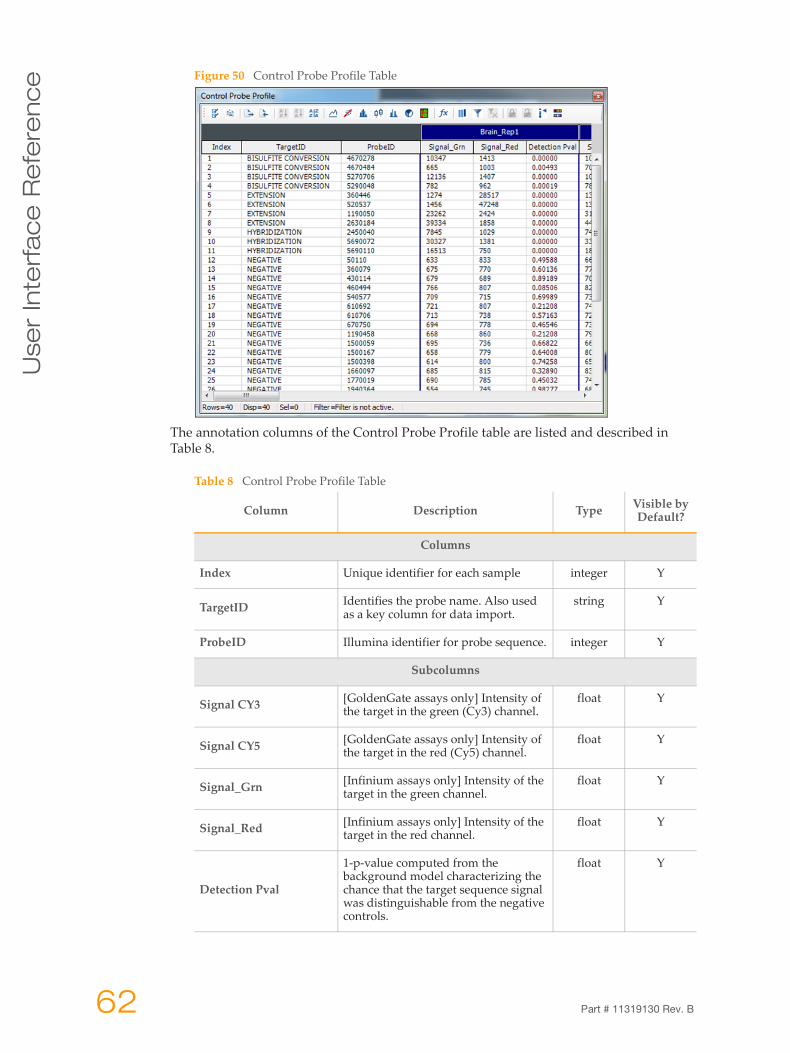
Figure 50 shows an example of a Control Probe Profile table.
NOTEFor more information about the Infinium Methylation Controls Dashboard, see “Infinium Methylation Controls Dashboard” on page 63.
GenomeStudio Methylation Module v1.8 User Guide 61
Use
r In
terf
ac
e R
efe
ren
ce
Figure 50 Control Probe Profile TableThe annotation columns of the Control Probe Profile table are listed and described in Table 8.
Table 8 Control Probe Profile Table
Column Description Type Visible by Default?
Columns
Index Unique identifier for each sample integer Y
TargetID Identifies the probe name. Also used as a key column for data import.
string Y
ProbeID Illumina identifier for probe sequence. integer Y
Subcolumns
Signal CY3 [GoldenGate assays only] Intensity of the target in the green (Cy3) channel.
float Y
Signal CY5 [GoldenGate assays only] Intensity of the target in the red (Cy5) channel.
float Y
Signal_Grn [Infinium assays only] Intensity of the target in the green channel.
float Y
Signal_Red [Infinium assays only] Intensity of the target in the red channel.
float Y
Detection Pval
1-p-value computed from the background model characterizing the chance that the target sequence signal was distinguishable from the negative controls.
float Y
62 Part # 11319130 Rev. B
De
tac
hab
le D
oc
kin
g W
ind
ows
Infinium Methylation Controls DashboardIf you have a project with Infinium data, you can view Infinium Methylation Controls in GenomeStudio by going to Analysis | View Controls Dashboard.
The following sections include descriptions of the Infinium Methylation Controls:Staining ControlsExtension ControlsHybridization ControlsTarget Removal ControlsBisulfite Conversion ControlsG/T Mismatch Controls (HumanMethylation27)Specificity ControlsNegative ControlsNon-polymorphic Controls
Staining Controls
Staining controls are used to examine the efficiency of the staining step in both the red and green channels. These controls are independent of the hybridization and extension step.
The performance of the staining controls should be monitored in both the red channel and the green channel.
AVG_Signal[GoldenGate assays only] Average intensity of the bead type/target in the group.
float N
NARRAYS [GoldenGate assays only] Number of samples in the group.
integer N
ARRAY_STDEV
[GoldenGate assays only] Standard deviation associated with sample-to-sample variability within the group (undefined when the group contains a single sample).
string N
Avg_NBEADS Average number of beads per bead type representing probes for the gene.
integer N
BEAD_STDERR Standard error associated with bead-to-bead variability for the target.
float N
Table 8 Control Probe Profile Table (Continued)
Column Description Type Visible by Default?
NOTEInfinium Methylation Controls are available for Infinium Methylation projects only. For information about GoldenGate controls, see “GoldenGate Methylation Control Summary Graph” on page 70.
GenomeStudio Methylation Module v1.8 User Guide 63
Use
r In
terf
ac
e R
efe
ren
ce
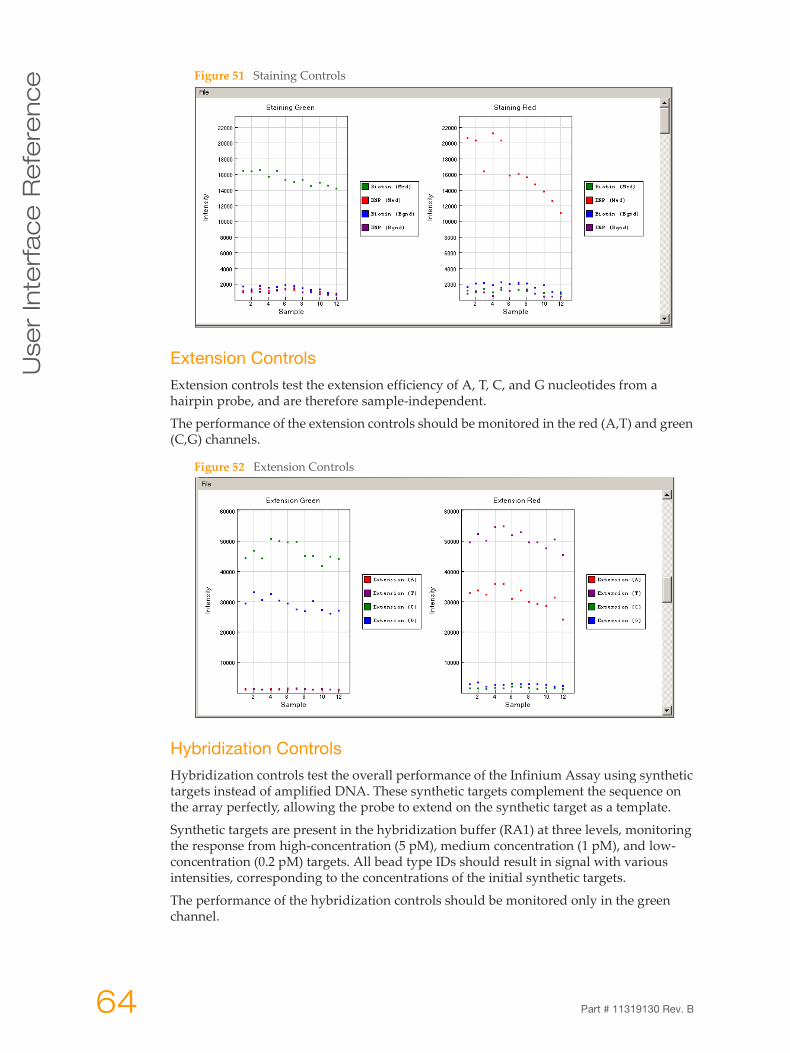
Figure 51 Staining ControlsExtension Controls
Extension controls test the extension efficiency of A, T, C, and G nucleotides from a hairpin probe, and are therefore sample-independent.
The performance of the extension controls should be monitored in the red (A,T) and green (C,G) channels.
Figure 52 Extension Controls
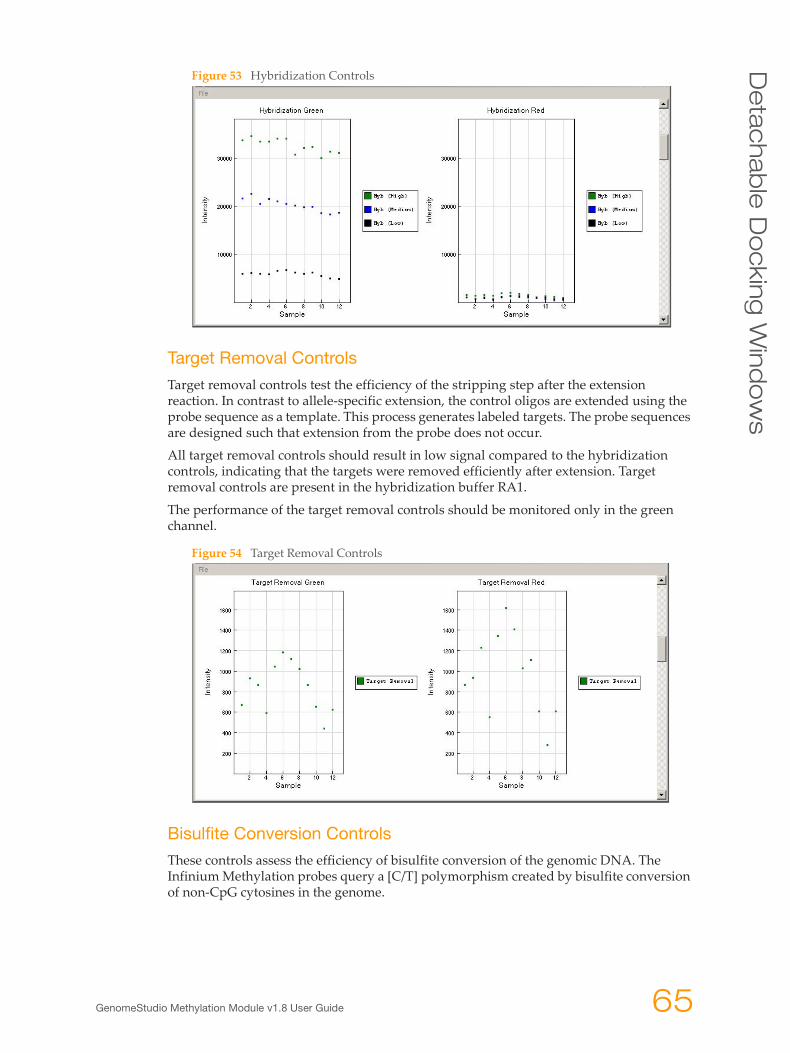
Hybridization Controls
Hybridization controls test the overall performance of the Infinium Assay using synthetic targets instead of amplified DNA. These synthetic targets complement the sequence on the array perfectly, allowing the probe to extend on the synthetic target as a template.
Synthetic targets are present in the hybridization buffer (RA1) at three levels, monitoring the response from high-concentration (5 pM), medium concentration (1 pM), and low-concentration (0.2 pM) targets. All bead type IDs should result in signal with various intensities, corresponding to the concentrations of the initial synthetic targets.
The performance of the hybridization controls should be monitored only in the green channel.
64 Part # 11319130 Rev. B
De
tac
hab
le D
oc
kin
g W
ind
ows
Figure 53 Hybridization Controls
Target Removal Controls
Target removal controls test the efficiency of the stripping step after the extension reaction. In contrast to allele-specific extension, the control oligos are extended using the probe sequence as a template. This process generates labeled targets. The probe sequences are designed such that extension from the probe does not occur.
All target removal controls should result in low signal compared to the hybridization controls, indicating that the targets were removed efficiently after extension. Target removal controls are present in the hybridization buffer RA1.
The performance of the target removal controls should be monitored only in the green channel.
Figure 54 Target Removal Controls
Bisulfite Conversion Controls
These controls assess the efficiency of bisulfite conversion of the genomic DNA. The Infinium Methylation probes query a [C/T] polymorphism created by bisulfite conversion of non-CpG cytosines in the genome.
GenomeStudio Methylation Module v1.8 User Guide 65
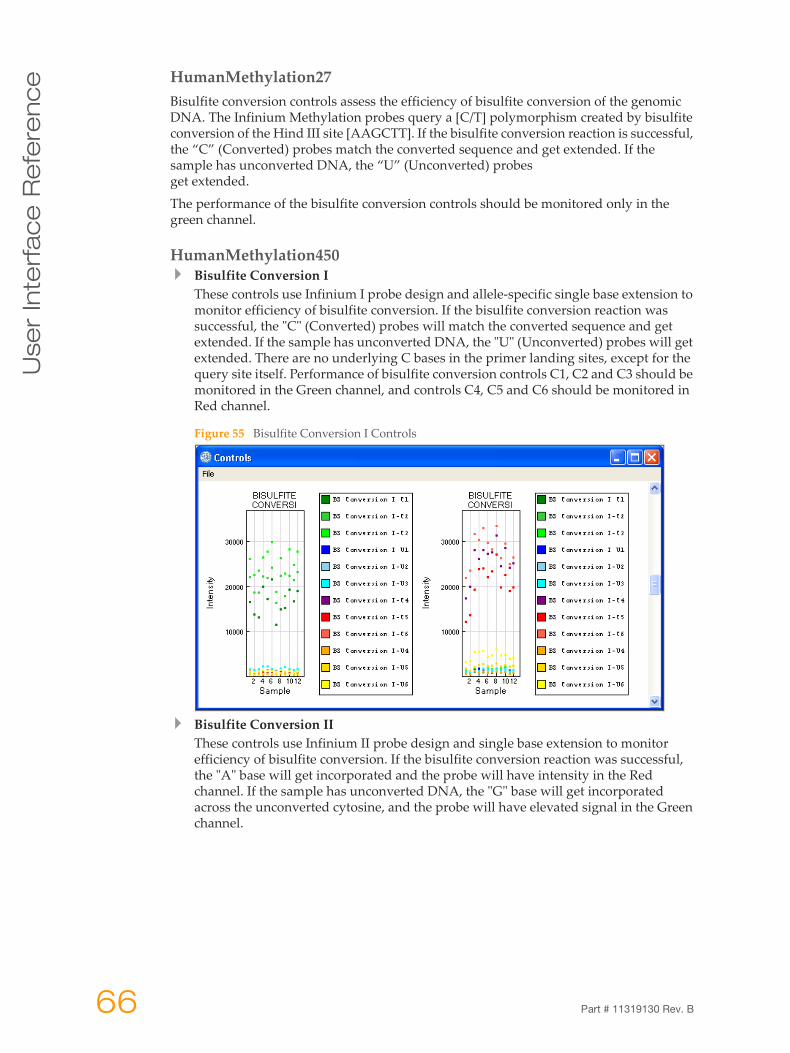
Use
r In
terf
ac
e R
efe
ren
ce
HumanMethylation27Bisulfite conversion controls assess the efficiency of bisulfite conversion of the genomic DNA. The Infinium Methylation probes query a [C/T] polymorphism created by bisulfite conversion of the Hind III site [AAGCTT]. If the bisulfite conversion reaction is successful, the “C” (Converted) probes match the converted sequence and get extended. If the sample has unconverted DNA, the “U” (Unconverted) probes get extended.
The performance of the bisulfite conversion controls should be monitored only in the green channel.
HumanMethylation450Bisulfite Conversion IThese controls use Infinium I probe design and allele-specific single base extension to monitor efficiency of bisulfite conversion. If the bisulfite conversion reaction was successful, the "C" (Converted) probes will match the converted sequence and get extended. If the sample has unconverted DNA, the "U" (Unconverted) probes will get extended. There are no underlying C bases in the primer landing sites, except for the query site itself. Performance of bisulfite conversion controls C1, C2 and C3 should be monitored in the Green channel, and controls C4, C5 and C6 should be monitored in Red channel.
Figure 55 Bisulfite Conversion I Controls
Bisulfite Conversion IIThese controls use Infinium II probe design and single base extension to monitor efficiency of bisulfite conversion. If the bisulfite conversion reaction was successful, the "A" base will get incorporated and the probe will have intensity in the Red channel. If the sample has unconverted DNA, the "G" base will get incorporated across the unconverted cytosine, and the probe will have elevated signal in the Green channel.
66 Part # 11319130 Rev. B
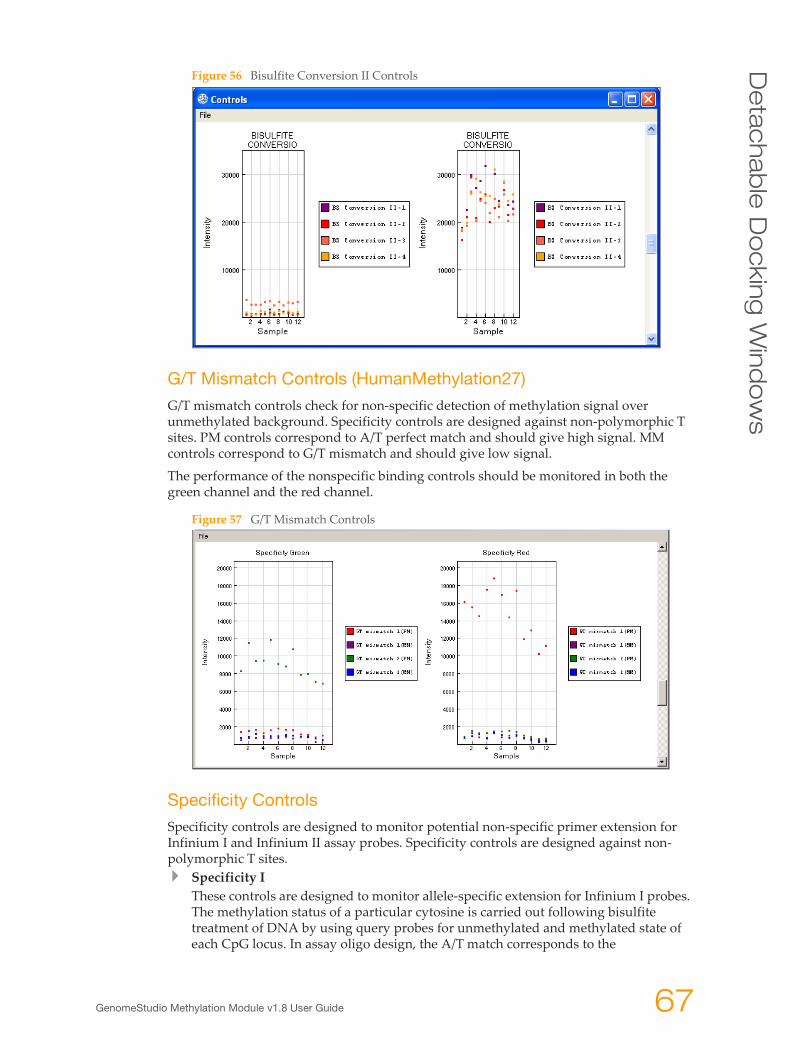
De
tac
hab
le D
oc
kin
g W
ind
ows
Figure 56 Bisulfite Conversion II Controls
G/T Mismatch Controls (HumanMethylation27)
G/T mismatch controls check for non-specific detection of methylation signal over unmethylated background. Specificity controls are designed against non-polymorphic T sites. PM controls correspond to A/T perfect match and should give high signal. MM controls correspond to G/T mismatch and should give low signal.
The performance of the nonspecific binding controls should be monitored in both the green channel and the red channel.
Figure 57 G/T Mismatch Controls
Specificity Controls
Specificity controls are designed to monitor potential non-specific primer extension for Infinium I and Infinium II assay probes. Specificity controls are designed against non-polymorphic T sites.
Specificity IThese controls are designed to monitor allele-specific extension for Infinium I probes. The methylation status of a particular cytosine is carried out following bisulfite treatment of DNA by using query probes for unmethylated and methylated state of each CpG locus. In assay oligo design, the A/T match corresponds to the
GenomeStudio Methylation Module v1.8 User Guide 67
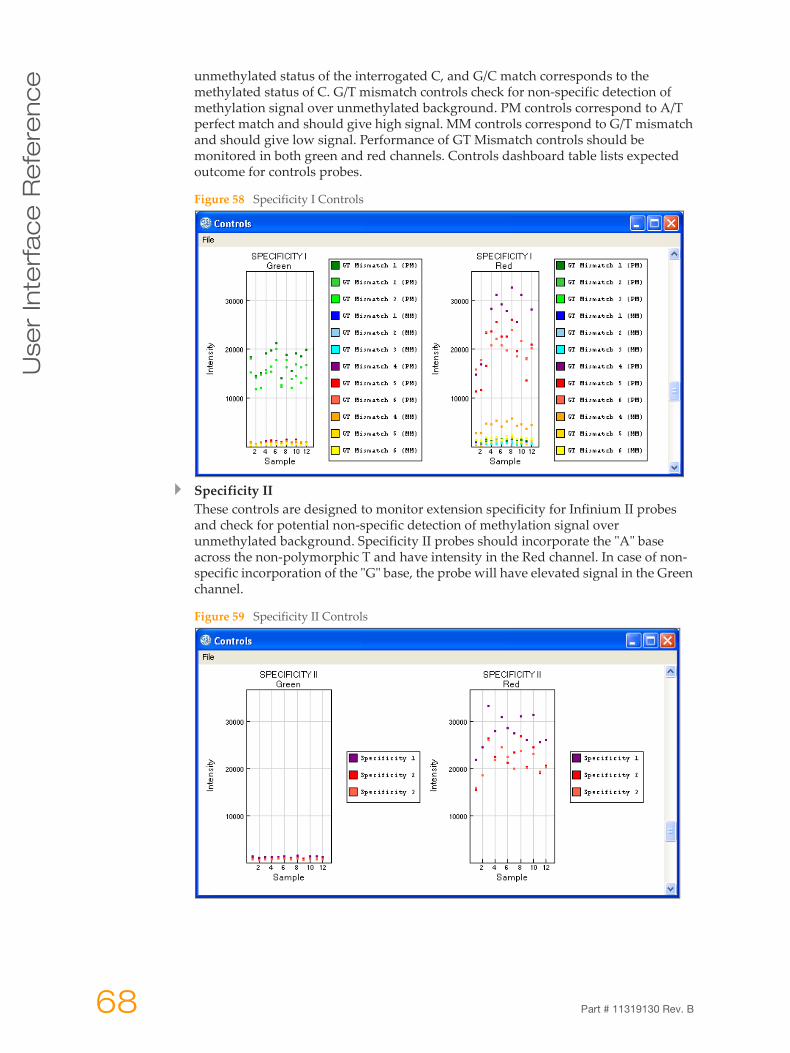
Use
r In
terf
ac
e R
efe
ren
ce
unmethylated status of the interrogated C, and G/C match corresponds to themethylated status of C. G/T mismatch controls check for non-specific detection of methylation signal over unmethylated background. PM controls correspond to A/T perfect match and should give high signal. MM controls correspond to G/T mismatch and should give low signal. Performance of GT Mismatch controls should be monitored in both green and red channels. Controls dashboard table lists expected outcome for controls probes.
Figure 58 Specificity I Controls
Specificity IIThese controls are designed to monitor extension specificity for Infinium II probes and check for potential non-specific detection of methylation signal over unmethylated background. Specificity II probes should incorporate the "A" base across the non-polymorphic T and have intensity in the Red channel. In case of non-specific incorporation of the "G" base, the probe will have elevated signal in the Green channel.
Figure 59 Specificity II Controls
68 Part # 11319130 Rev. B
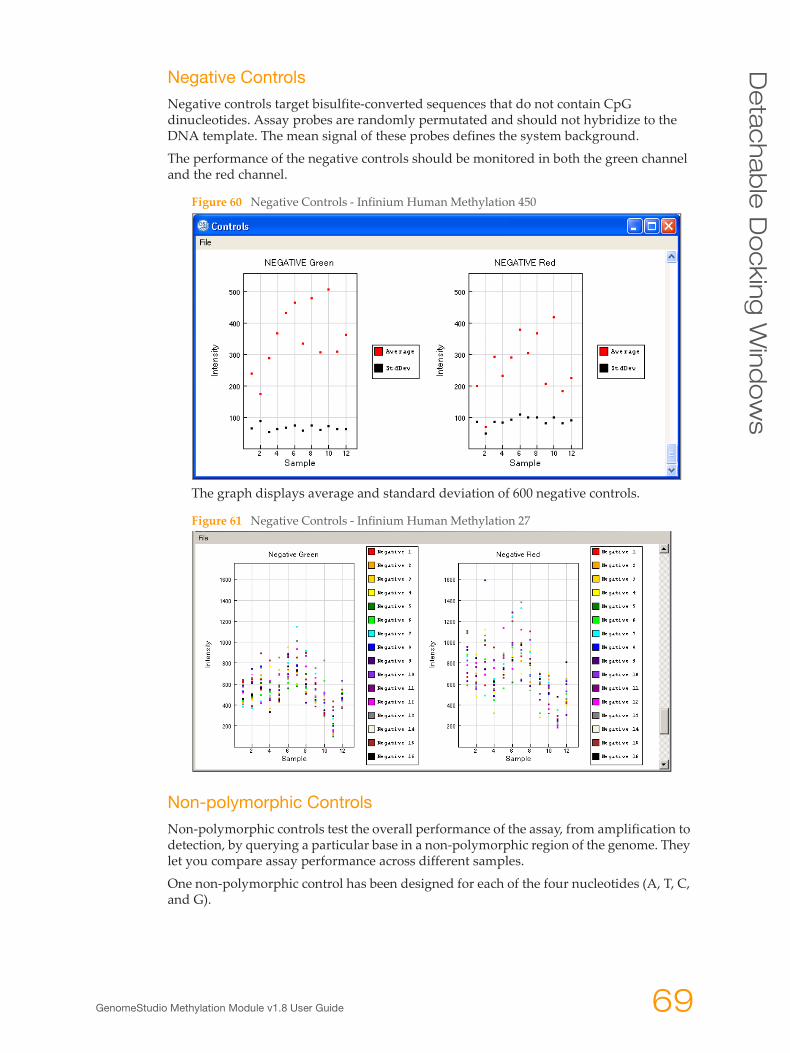
De
tac
hab
le D
oc
kin
g W
ind
ows
Negative Controls
Negative controls target bisulfite-converted sequences that do not contain CpG dinucleotides. Assay probes are randomly permutated and should not hybridize to the DNA template. The mean signal of these probes defines the system background.
The performance of the negative controls should be monitored in both the green channel and the red channel.
Figure 60 Negative Controls - Infinium Human Methylation 450
The graph displays average and standard deviation of 600 negative controls.
Figure 61 Negative Controls - Infinium Human Methylation 27
Non-polymorphic Controls
Non-polymorphic controls test the overall performance of the assay, from amplification to detection, by querying a particular base in a non-polymorphic region of the genome. They let you compare assay performance across different samples.
One non-polymorphic control has been designed for each of the four nucleotides (A, T, C, and G).
GenomeStudio Methylation Module v1.8 User Guide 69
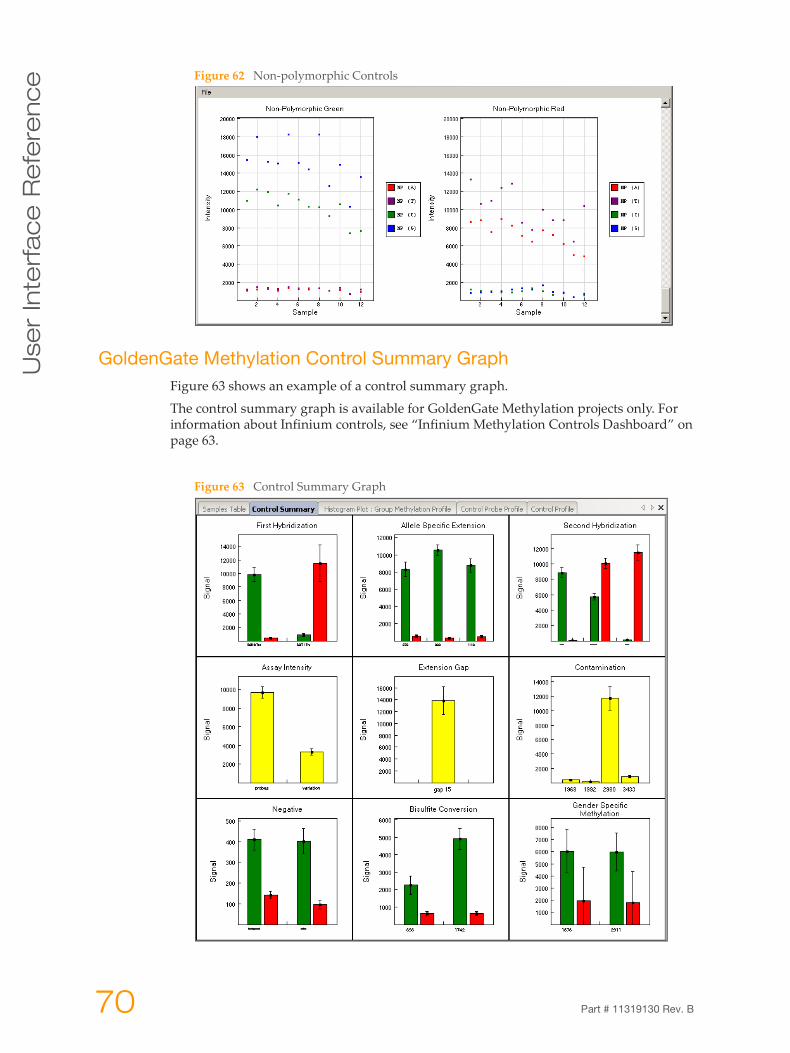
Use
r In
terf
ac
e R
efe
ren
ce
Figure 62 Non-polymorphic ControlsGoldenGate Methylation Control Summary GraphFigure 63 shows an example of a control summary graph.
The control summary graph is available for GoldenGate Methylation projects only. For information about Infinium controls, see “Infinium Methylation Controls Dashboard” on page 63.
Figure 63 Control Summary Graph
70 Part # 11319130 Rev. B
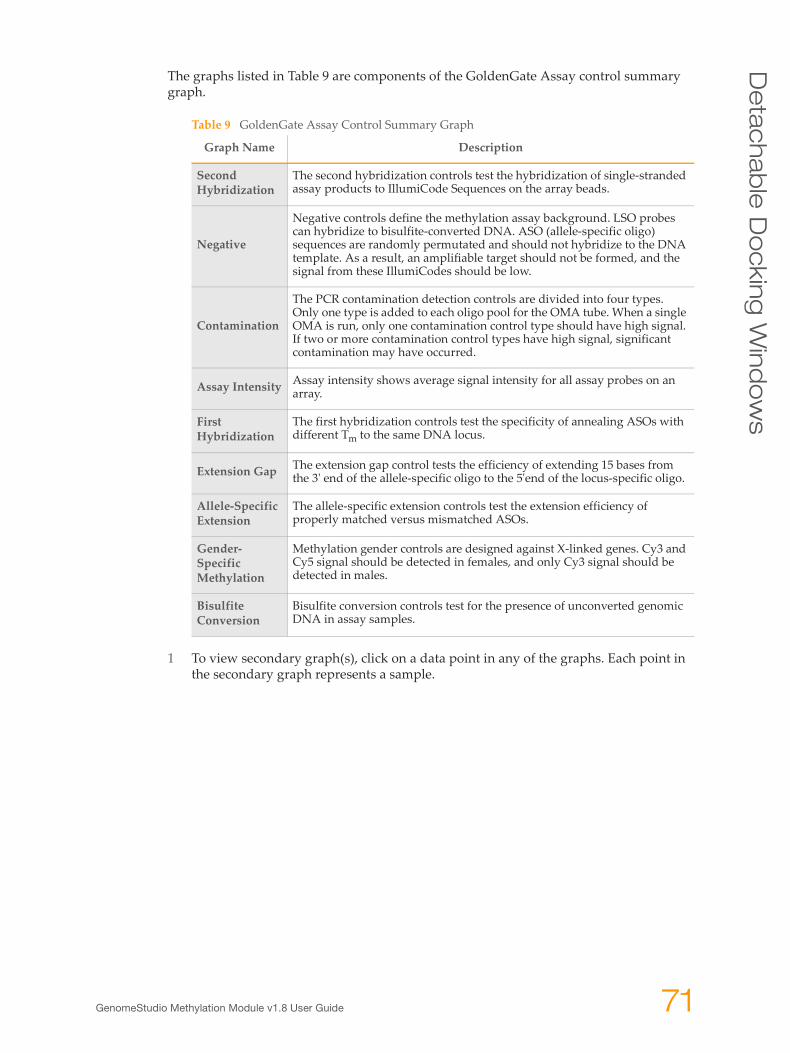
De
tac
hab
le D
oc
kin
g W
ind
ows
The graphs listed in Table 9 are components of the GoldenGate Assay control summary graph.
1 To view secondary graph(s), click on a data point in any of the graphs. Each point in the secondary graph represents a sample.
Table 9 GoldenGate Assay Control Summary Graph
Graph Name Description
Second Hybridization
The second hybridization controls test the hybridization of single-stranded assay products to IllumiCode Sequences on the array beads.
Negative
Negative controls define the methylation assay background. LSO probes can hybridize to bisulfite-converted DNA. ASO (allele-specific oligo) sequences are randomly permutated and should not hybridize to the DNA template. As a result, an amplifiable target should not be formed, and the signal from these IllumiCodes should be low.
Contamination
The PCR contamination detection controls are divided into four types. Only one type is added to each oligo pool for the OMA tube. When a single OMA is run, only one contamination control type should have high signal. If two or more contamination control types have high signal, significant contamination may have occurred.
Assay Intensity Assay intensity shows average signal intensity for all assay probes on an array.
First Hybridization
The first hybridization controls test the specificity of annealing ASOs with different Tm to the same DNA locus.
Extension Gap The extension gap control tests the efficiency of extending 15 bases from the 3' end of the allele-specific oligo to the 5'end of the locus-specific oligo.
Allele-Specific Extension
The allele-specific extension controls test the extension efficiency of properly matched versus mismatched ASOs.
Gender-Specific Methylation
Methylation gender controls are designed against X-linked genes. Cy3 and Cy5 signal should be detected in females, and only Cy3 signal should be detected in males.
Bisulfite Conversion
Bisulfite conversion controls test for the presence of unconverted genomic DNA in assay samples.
GenomeStudio Methylation Module v1.8 User Guide 71
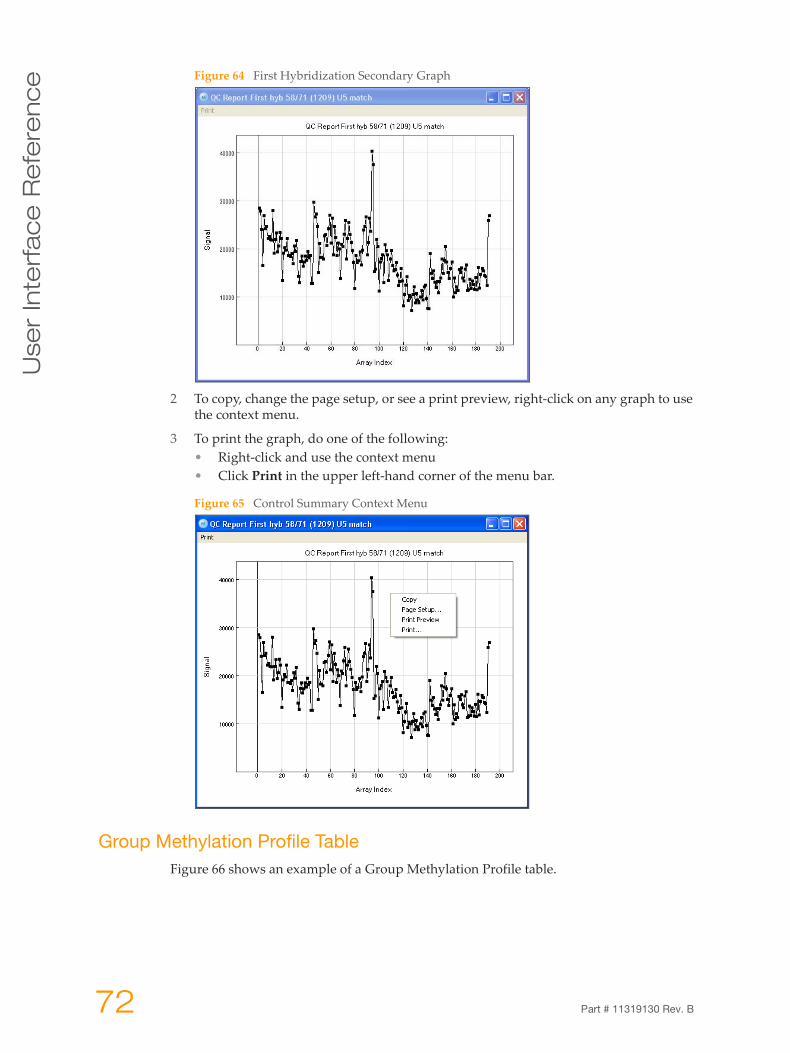
Use
r In
terf
ac
e R
efe
ren
ce
Figure 64 First Hybridization Secondary Graph2 To copy, change the page setup, or see a print preview, right-click on any graph to use the context menu.
3 To print the graph, do one of the following:• Right-click and use the context menu• Click Print in the upper left-hand corner of the menu bar.
Figure 65 Control Summary Context Menu
Group Methylation Profile TableFigure 66 shows an example of a Group Methylation Profile table.
72 Part # 11319130 Rev. B
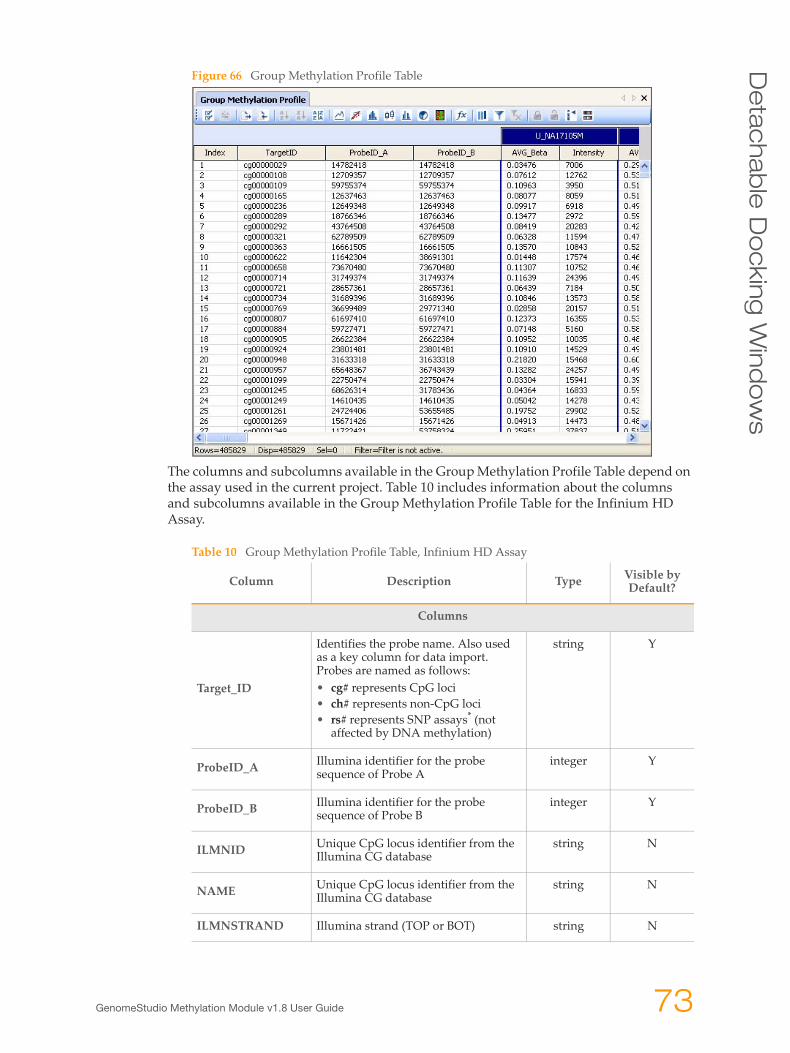
De
tac
hab
le D
oc
kin
g W
ind
ows
Figure 66 Group Methylation Profile Table
The columns and subcolumns available in the Group Methylation Profile Table depend on the assay used in the current project. Table 10 includes information about the columns and subcolumns available in the Group Methylation Profile Table for the Infinium HD Assay.
Table 10 Group Methylation Profile Table, Infinium HD Assay
Column Description Type Visible by Default?
Columns
Target_ID
Identifies the probe name. Also used as a key column for data import. Probes are named as follows:• cg# represents CpG loci• ch# represents non-CpG loci• rs# represents SNP assays* (not
affected by DNA methylation)
string Y
ProbeID_A Illumina identifier for the probe sequence of Probe A
integer Y
ProbeID_B Illumina identifier for the probe sequence of Probe B
integer Y
ILMNID Unique CpG locus identifier from the Illumina CG database
string N
NAME Unique CpG locus identifier from the Illumina CG database
string N
ILMNSTRAND Illumina strand (TOP or BOT) string N
GenomeStudio Methylation Module v1.8 User Guide 73
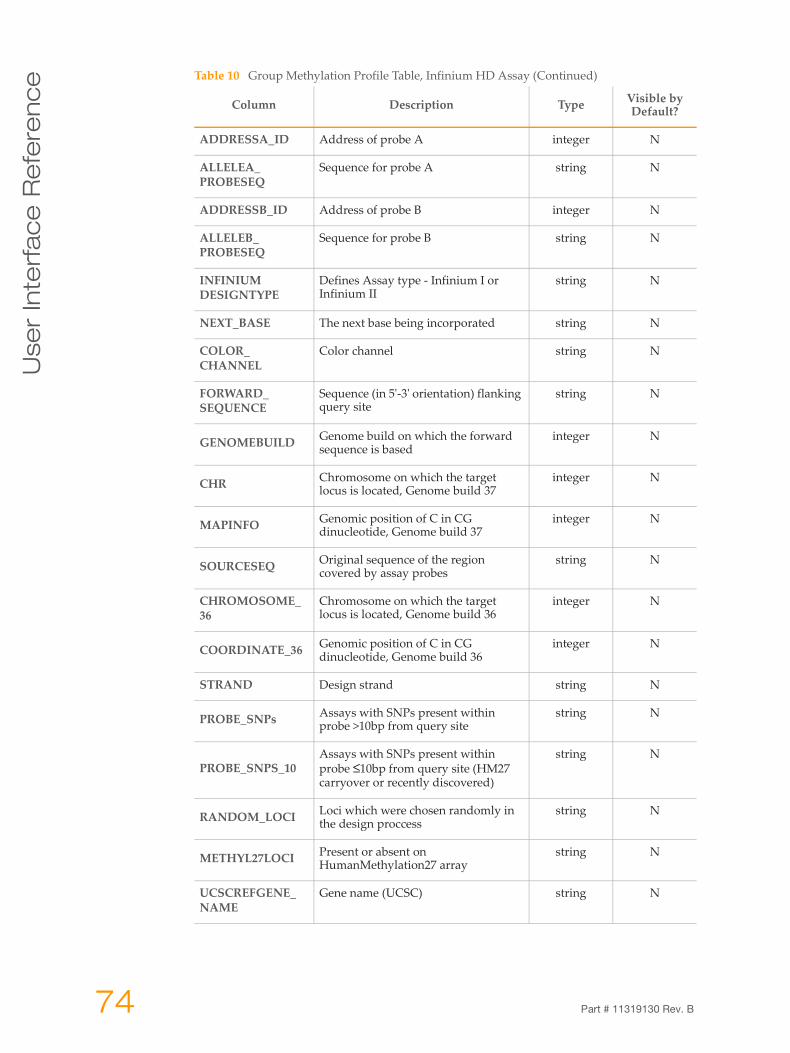
Use
r In
terf
ac
e R
efe
ren
ce
ADDRESSA_ID Address of probe A integer N
ALLELEA_PROBESEQ
Sequence for probe A string N
ADDRESSB_ID Address of probe B integer N
ALLELEB_PROBESEQ
Sequence for probe B string N
INFINIUMDESIGNTYPE
Defines Assay type - Infinium I or Infinium II
string N
NEXT_BASE The next base being incorporated string N
COLOR_CHANNEL
Color channel string N
FORWARD_SEQUENCE
Sequence (in 5'-3' orientation) flanking query site
string N
GENOMEBUILD Genome build on which the forward sequence is based
integer N
CHR Chromosome on which the target locus is located, Genome build 37
integer N
MAPINFO Genomic position of C in CG dinucleotide, Genome build 37
integer N
SOURCESEQ Original sequence of the region covered by assay probes
string N
CHROMOSOME_36
Chromosome on which the target locus is located, Genome build 36
integer N
COORDINATE_36 Genomic position of C in CG dinucleotide, Genome build 36
integer N
STRAND Design strand string N
PROBE_SNPs Assays with SNPs present within probe >10bp from query site
string N
PROBE_SNPS_10Assays with SNPs present within probe ≤10bp from query site (HM27 carryover or recently discovered)
string N
RANDOM_LOCI Loci which were chosen randomly in the design proccess
string N
METHYL27LOCI Present or absent on HumanMethylation27 array
string N
UCSCREFGENE_NAME
Gene name (UCSC) string N
Table 10 Group Methylation Profile Table, Infinium HD Assay (Continued)
Column Description Type Visible by Default?
74 Part # 11319130 Rev. B
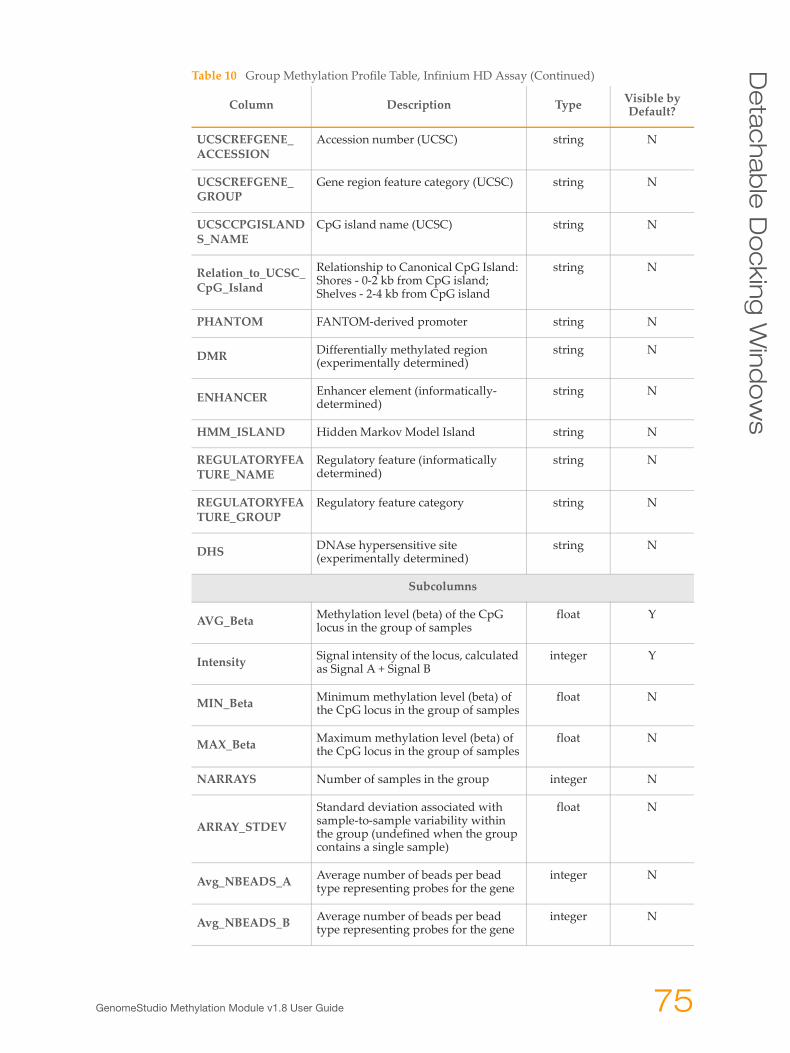
De
tac
hab
le D
oc
kin
g W
ind
ows
UCSCREFGENE_ACCESSION
Accession number (UCSC) string N
UCSCREFGENE_GROUP
Gene region feature category (UCSC) string N
UCSCCPGISLANDS_NAME
CpG island name (UCSC) string N
Relation_to_UCSC_CpG_Island
Relationship to Canonical CpG Island: Shores - 0-2 kb from CpG island; Shelves - 2-4 kb from CpG island
string N
PHANTOM FANTOM-derived promoter string N
DMR Differentially methylated region (experimentally determined)
string N
ENHANCER Enhancer element (informatically-determined)
string N
HMM_ISLAND Hidden Markov Model Island string N
REGULATORYFEATURE_NAME
Regulatory feature (informatically determined)
string N
REGULATORYFEATURE_GROUP
Regulatory feature category string N
DHS DNAse hypersensitive site (experimentally determined)
string N
Subcolumns
AVG_Beta Methylation level (beta) of the CpG locus in the group of samples
float Y
Intensity Signal intensity of the locus, calculated as Signal A + Signal B
integer Y
MIN_Beta Minimum methylation level (beta) of the CpG locus in the group of samples
float N
MAX_Beta Maximum methylation level (beta) of the CpG locus in the group of samples
float N
NARRAYS Number of samples in the group integer N
ARRAY_STDEVStandard deviation associated with sample-to-sample variability within the group (undefined when the group contains a single sample)
float N
Avg_NBEADS_A Average number of beads per bead type representing probes for the gene
integer N
Avg_NBEADS_B Average number of beads per bead type representing probes for the gene
integer N
Table 10 Group Methylation Profile Table, Infinium HD Assay (Continued)
Column Description Type Visible by Default?
GenomeStudio Methylation Module v1.8 User Guide 75
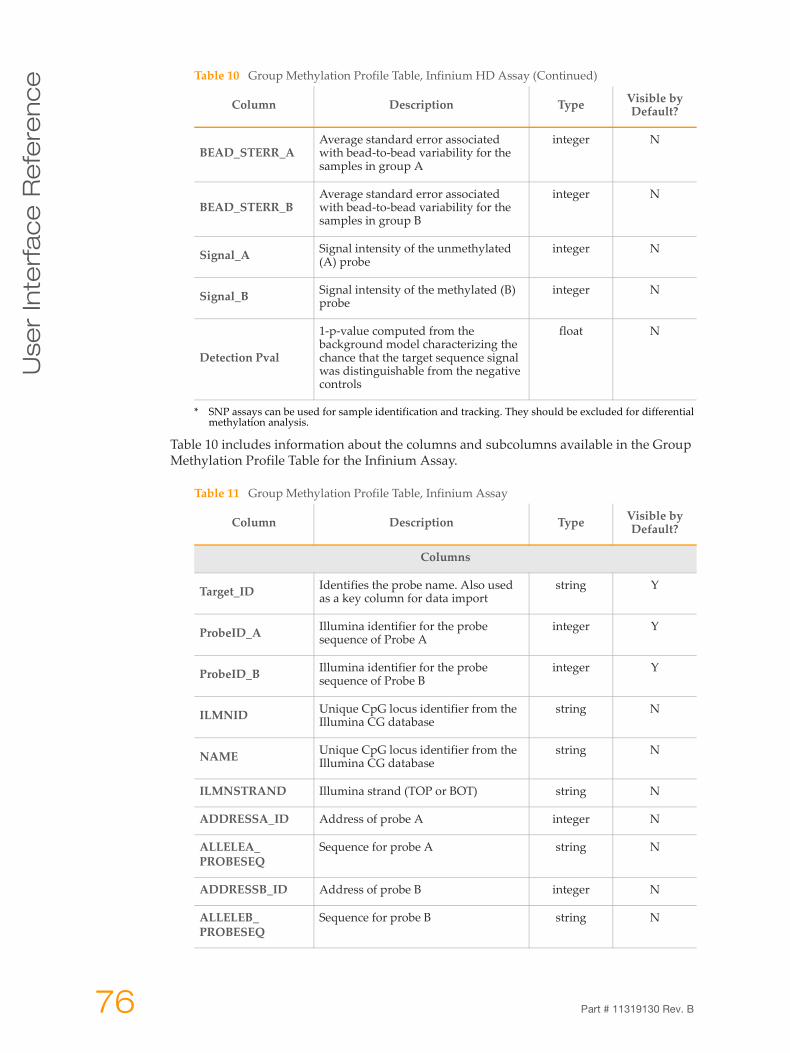
Use
r In
terf
ac
e R
efe
ren
ce
Table 10 includes information about the columns and subcolumns available in the Group Methylation Profile Table for the Infinium Assay.
BEAD_STERR_AAverage standard error associated with bead-to-bead variability for the samples in group A
integer N
BEAD_STERR_BAverage standard error associated with bead-to-bead variability for the samples in group B
integer N
Signal_A Signal intensity of the unmethylated (A) probe
integer N
Signal_B Signal intensity of the methylated (B) probe
integer N
Detection Pval
1-p-value computed from the background model characterizing the chance that the target sequence signal was distinguishable from the negative controls
float N
* SNP assays can be used for sample identification and tracking. They should be excluded for differential methylation analysis.
Table 11 Group Methylation Profile Table, Infinium Assay
Column Description Type Visible by Default?
Columns
Target_ID Identifies the probe name. Also used as a key column for data import
string Y
ProbeID_A Illumina identifier for the probe sequence of Probe A
integer Y
ProbeID_B Illumina identifier for the probe sequence of Probe B
integer Y
ILMNID Unique CpG locus identifier from the Illumina CG database
string N
NAME Unique CpG locus identifier from the Illumina CG database
string N
ILMNSTRAND Illumina strand (TOP or BOT) string N
ADDRESSA_ID Address of probe A integer N
ALLELEA_PROBESEQ
Sequence for probe A string N
ADDRESSB_ID Address of probe B integer N
ALLELEB_PROBESEQ
Sequence for probe B string N
Table 10 Group Methylation Profile Table, Infinium HD Assay (Continued)
Column Description Type Visible by Default?
76 Part # 11319130 Rev. B
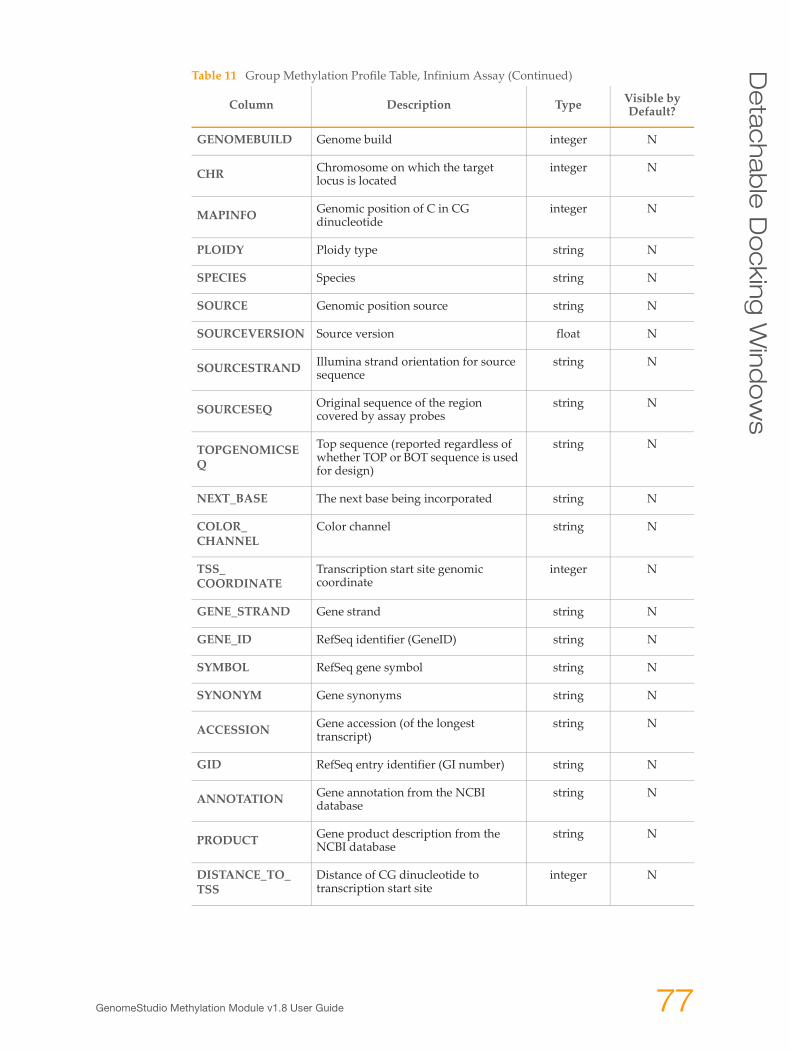
De
tac
hab
le D
oc
kin
g W
ind
ows
GENOMEBUILD Genome build integer N
CHR Chromosome on which the target locus is located
integer N
MAPINFO Genomic position of C in CG dinucleotide
integer N
PLOIDY Ploidy type string N
SPECIES Species string N
SOURCE Genomic position source string N
SOURCEVERSION Source version float N
SOURCESTRAND Illumina strand orientation for source sequence
string N
SOURCESEQ Original sequence of the region covered by assay probes
string N
TOPGENOMICSEQ
Top sequence (reported regardless of whether TOP or BOT sequence is used for design)
string N
NEXT_BASE The next base being incorporated string N
COLOR_CHANNEL
Color channel string N
TSS_COORDINATE
Transcription start site genomic coordinate
integer N
GENE_STRAND Gene strand string N
GENE_ID RefSeq identifier (GeneID) string N
SYMBOL RefSeq gene symbol string N
SYNONYM Gene synonyms string N
ACCESSION Gene accession (of the longest transcript)
string N
GID RefSeq entry identifier (GI number) string N
ANNOTATION Gene annotation from the NCBI database
string N
PRODUCT Gene product description from the NCBI database
string N
DISTANCE_TO_TSS
Distance of CG dinucleotide to transcription start site
integer N
Table 11 Group Methylation Profile Table, Infinium Assay (Continued)
Column Description Type Visible by Default?
GenomeStudio Methylation Module v1.8 User Guide 77
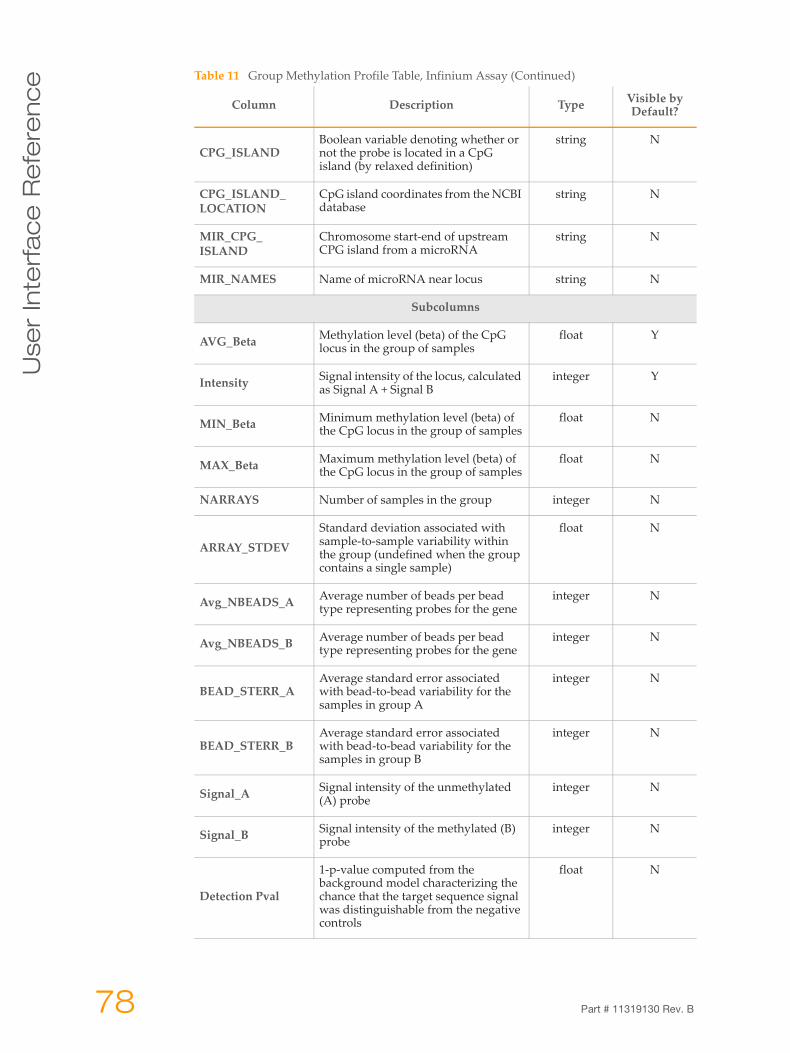
Use
r In
terf
ac
e R
efe
ren
ce
CPG_ISLANDBoolean variable denoting whether or not the probe is located in a CpG island (by relaxed definition)
string N
CPG_ISLAND_LOCATION
CpG island coordinates from the NCBI database
string N
MIR_CPG_ISLAND
Chromosome start-end of upstream CPG island from a microRNA
string N
MIR_NAMES Name of microRNA near locus string N
Subcolumns
AVG_Beta Methylation level (beta) of the CpG locus in the group of samples
float Y
Intensity Signal intensity of the locus, calculated as Signal A + Signal B
integer Y
MIN_Beta Minimum methylation level (beta) of the CpG locus in the group of samples
float N
MAX_Beta Maximum methylation level (beta) of the CpG locus in the group of samples
float N
NARRAYS Number of samples in the group integer N
ARRAY_STDEVStandard deviation associated with sample-to-sample variability within the group (undefined when the group contains a single sample)
float N
Avg_NBEADS_A Average number of beads per bead type representing probes for the gene
integer N
Avg_NBEADS_B Average number of beads per bead type representing probes for the gene
integer N
BEAD_STERR_AAverage standard error associated with bead-to-bead variability for the samples in group A
integer N
BEAD_STERR_BAverage standard error associated with bead-to-bead variability for the samples in group B
integer N
Signal_A Signal intensity of the unmethylated (A) probe
integer N
Signal_B Signal intensity of the methylated (B) probe
integer N
Detection Pval
1-p-value computed from the background model characterizing the chance that the target sequence signal was distinguishable from the negative controls
float N
Table 11 Group Methylation Profile Table, Infinium Assay (Continued)
Column Description Type Visible by Default?
78 Part # 11319130 Rev. B
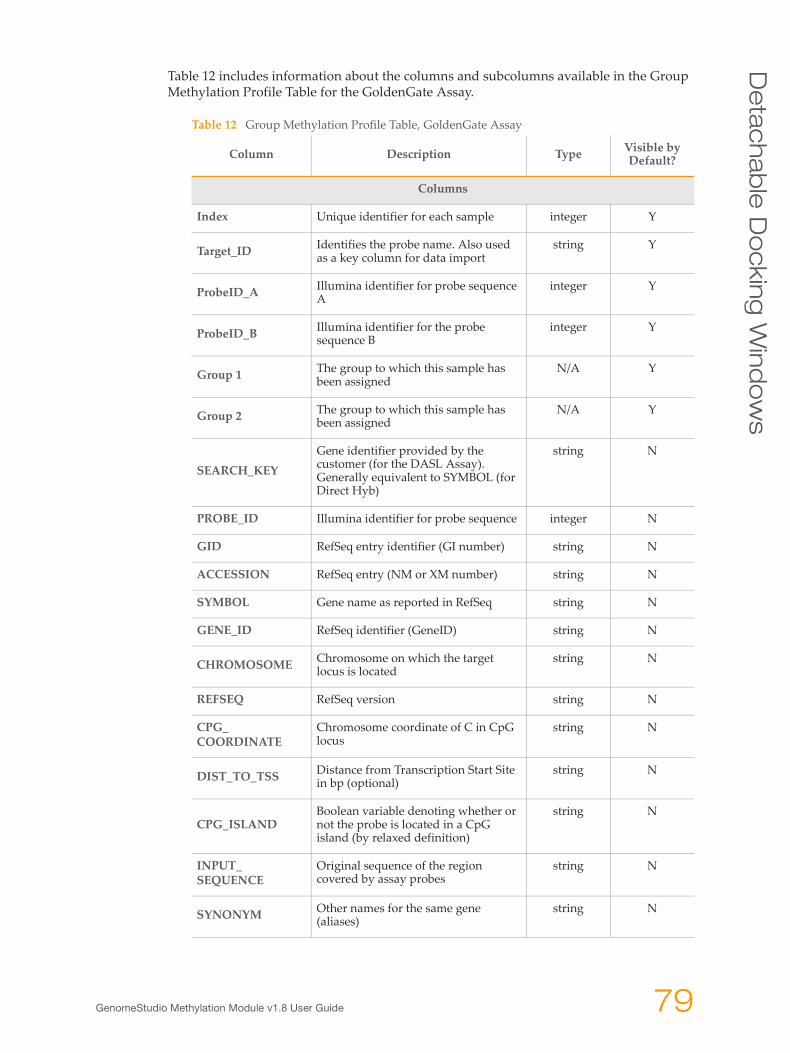
De
tac
hab
le D
oc
kin
g W
ind
ows
Table 12 includes information about the columns and subcolumns available in the Group Methylation Profile Table for the GoldenGate Assay.
Table 12 Group Methylation Profile Table, GoldenGate Assay
Column Description Type Visible by Default?
Columns
Index Unique identifier for each sample integer Y
Target_ID Identifies the probe name. Also used as a key column for data import
string Y
ProbeID_A Illumina identifier for probe sequence A
integer Y
ProbeID_B Illumina identifier for the probe sequence B
integer Y
Group 1 The group to which this sample has been assigned
N/A Y
Group 2 The group to which this sample has been assigned
N/A Y
SEARCH_KEYGene identifier provided by the customer (for the DASL Assay). Generally equivalent to SYMBOL (for Direct Hyb)
string N
PROBE_ID Illumina identifier for probe sequence integer N
GID RefSeq entry identifier (GI number) string N
ACCESSION RefSeq entry (NM or XM number) string N
SYMBOL Gene name as reported in RefSeq string N
GENE_ID RefSeq identifier (GeneID) string N
CHROMOSOME Chromosome on which the target locus is located
string N
REFSEQ RefSeq version string N
CPG_COORDINATE
Chromosome coordinate of C in CpG locus
string N
DIST_TO_TSS Distance from Transcription Start Site in bp (optional)
string N
CPG_ISLANDBoolean variable denoting whether or not the probe is located in a CpG island (by relaxed definition)
string N
INPUT_SEQUENCE
Original sequence of the region covered by assay probes
string N
SYNONYM Other names for the same gene (aliases)
string N
GenomeStudio Methylation Module v1.8 User Guide 79

Use
r In
terf
ac
e R
efe
ren
ce
Sample Methylation Profile TableFigure 67 shows an example of a Sample Methylation Profile table.
ANNOTATION Gene description from NCBI RefSeq string N
PRODUCT Protein name from NCBI string N
CG_NO Unique CpG locus identifier from the Illumina CG database
string N
Subcolumns
AVG_Beta Methylation level (beta) of the CpG locus in the group of samples
float Y
Signal CY3 Signal intensity in the green channel integer Y
Signal CY5 Signal intensity in the red channel integer Y
Detection Pval
1-p-value computed from the background model characterizing the chance that the target sequence signal was distinguishable from the negative controls
float Y
MIN_Beta Minimum methylation level (beta) of the CpG locus in the group of samples
float N
MAX_Beta Maximum methylation level (beta) of the CpG locus in the group of samples
float N
NARRAYS Number of samples in the group integer N
ARRAY_STDEVStandard deviation associated with sample-to-sample variability within the group (undefined when the group contains a single sample)
float N
Avg_NBEADS Average number of beads per bead type
float N
BEAD_STERR Average standard error associated with bead-to-bead variability
float N
Table 12 Group Methylation Profile Table, GoldenGate Assay (Continued)
Column Description Type Visible by Default?
80 Part # 11319130 Rev. B
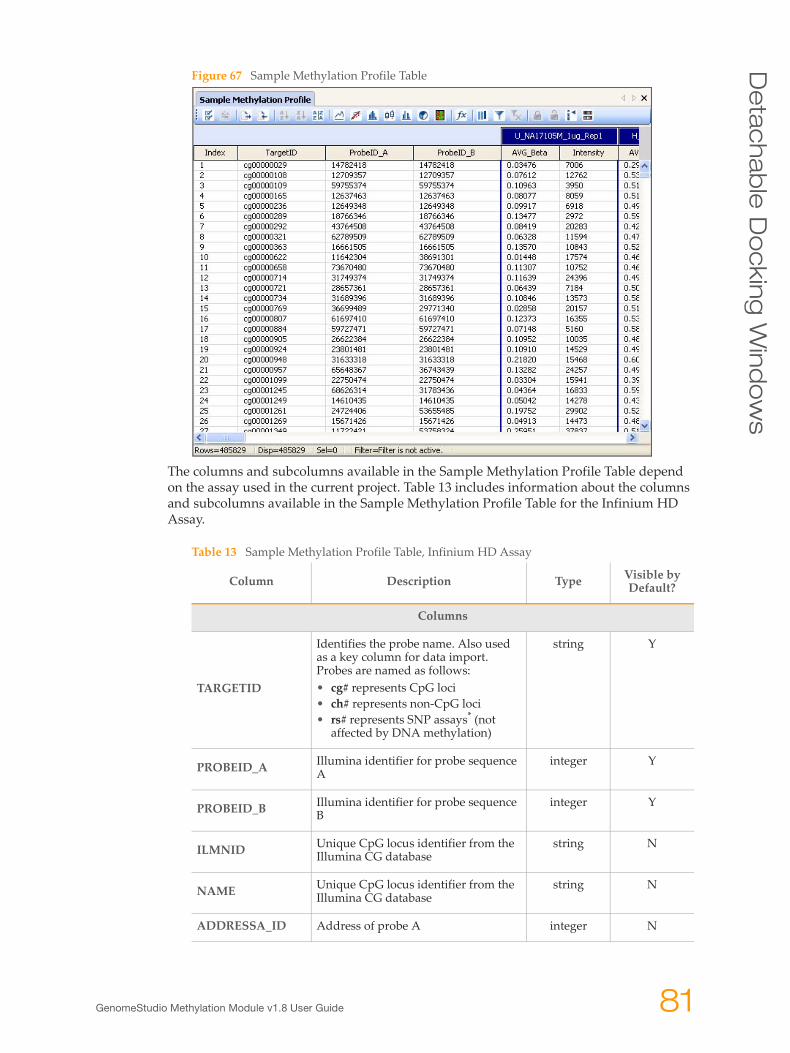
De
tac
hab
le D
oc
kin
g W
ind
ows
Figure 67 Sample Methylation Profile Table
The columns and subcolumns available in the Sample Methylation Profile Table depend on the assay used in the current project. Table 13 includes information about the columns and subcolumns available in the Sample Methylation Profile Table for the Infinium HD Assay.
Table 13 Sample Methylation Profile Table, Infinium HD Assay
Column Description Type Visible by Default?
Columns
TARGETID
Identifies the probe name. Also used as a key column for data import. Probes are named as follows:• cg# represents CpG loci• ch# represents non-CpG loci• rs# represents SNP assays* (not
affected by DNA methylation)
string Y
PROBEID_A Illumina identifier for probe sequence A
integer Y
PROBEID_B Illumina identifier for probe sequence B
integer Y
ILMNID Unique CpG locus identifier from the Illumina CG database
string N
NAME Unique CpG locus identifier from the Illumina CG database
string N
ADDRESSA_ID Address of probe A integer N
GenomeStudio Methylation Module v1.8 User Guide 81

Use
r In
terf
ac
e R
efe
ren
ce
ALLELEA_PROBESEQ
Sequence for probe A string N
ADDRESSB_ID Address of probe B integer N
ALLELEB_PROBESEQ
Sequence for probe B string N
INFINIUMDESIGNTYPE
Defines Assay type - Infinium I or Infinium II
string N
NEXT_BASE The next base being incorporated string N
COLOR_CHANNEL
Color channel string N
FORWARD_SEQUENCE
Sequence (in 5'-3' orientation) flanking query site
string N
GENOMEBUILD Genome build on which the forward sequence is based
integer N
CHR Chromosome on which the target locus is located, Genome build 37
integer N
MAPINFO Genomic position of C in CG dinucleotide, Genome build 37
integer N
SOURCESEQ Original sequence of the region covered by assay probes
string N
CHROMOSOME_36
Chromosome on which the target locus is located, Genome build 36
integer N
COORDINATE_36 Genomic position of C in CG dinucleotide, Genome build 36
integer N
STRAND Design strand string N
PROBE_SNPs Assays with SNPs present within probe >10bp from query site
string N
PROBE_SNPS_10Assays with SNPs present within probe ≤10bp from query site (HM27 carryover or recently discovered)
string N
RANDOM_LOCI Loci which were chosen randomly in the design proccess
string N
METHYL27LOCI Present or absent on HumanMethylation27 array
string N
UCSCREFGENE_NAME
Gene name (UCSC) string N
UCSCREFGENE_ACCESSION
Accession number (UCSC) string N
Table 13 Sample Methylation Profile Table, Infinium HD Assay (Continued)
Column Description Type Visible by Default?
82 Part # 11319130 Rev. B
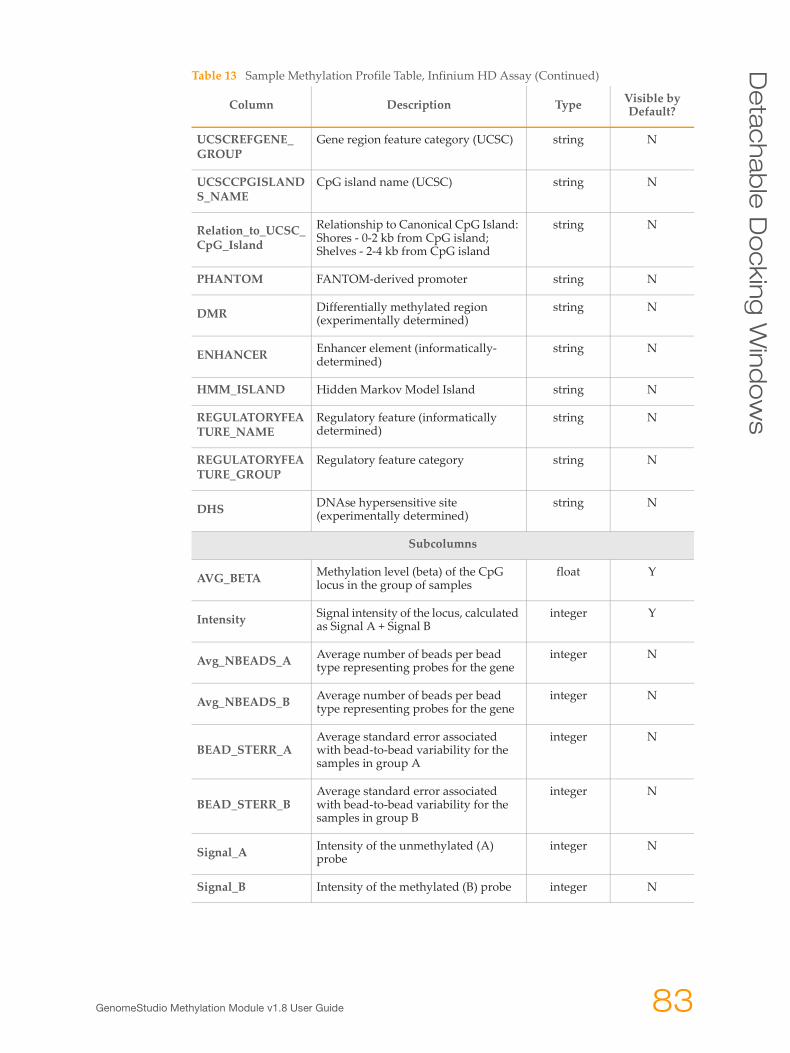
De
tac
hab
le D
oc
kin
g W
ind
ows
UCSCREFGENE_GROUP
Gene region feature category (UCSC) string N
UCSCCPGISLANDS_NAME
CpG island name (UCSC) string N
Relation_to_UCSC_CpG_Island
Relationship to Canonical CpG Island: Shores - 0-2 kb from CpG island; Shelves - 2-4 kb from CpG island
string N
PHANTOM FANTOM-derived promoter string N
DMR Differentially methylated region (experimentally determined)
string N
ENHANCER Enhancer element (informatically-determined)
string N
HMM_ISLAND Hidden Markov Model Island string N
REGULATORYFEATURE_NAME
Regulatory feature (informatically determined)
string N
REGULATORYFEATURE_GROUP
Regulatory feature category string N
DHS DNAse hypersensitive site (experimentally determined)
string N
Subcolumns
AVG_BETA Methylation level (beta) of the CpG locus in the group of samples
float Y
Intensity Signal intensity of the locus, calculated as Signal A + Signal B
integer Y
Avg_NBEADS_A Average number of beads per bead type representing probes for the gene
integer N
Avg_NBEADS_B Average number of beads per bead type representing probes for the gene
integer N
BEAD_STERR_AAverage standard error associated with bead-to-bead variability for the samples in group A
integer N
BEAD_STERR_BAverage standard error associated with bead-to-bead variability for the samples in group B
integer N
Signal_A Intensity of the unmethylated (A) probe
integer N
Signal_B Intensity of the methylated (B) probe integer N
Table 13 Sample Methylation Profile Table, Infinium HD Assay (Continued)
Column Description Type Visible by Default?
GenomeStudio Methylation Module v1.8 User Guide 83

Use
r In
terf
ac
e R
efe
ren
ce
Table 13 includes information about the columns and subcolumns available in the Sample Methylation Profile Table for the Infinium Assay.
Detection Pval
1-p-value computed from the background model characterizing the chance that the target sequence signal was distinguishable from the negative controls
float N
* SNP assays can be used for sample identification and tracking. They should be excluded for differential methylation analysis.
Table 14 Sample Methylation Profile Table, Infinium Assay
Column Description Type Visible by Default?
Columns
TARGETID Identifies the probe name. Also used as a key column for data import
string Y
PROBEID_A Illumina identifier for probe sequence A
integer Y
PROBEID_B Illumina identifier for probe sequence B
integer Y
SYMBOL Gene symbol string Y
ILMNID Unique CpG locus identifier from the Illumina CG database
string N
NAME Unique CpG locus identifier from the Illumina CG database
string N
ILMNSTRAND Illumina strand (TOP or BOT) string N
ADDRESSA_ID Address of probe A integer N
ALLELEA_PROBESEQ
Sequence for probe A string N
ADDRESSB_ID Address of probe B integer N
ALLELEB_PROBESEQ
Sequence for probe B string N
GENOME BUILD Genome build integer N
CHR Chromosome on which the target locus is located
integer N
MAPINFO Genomic position of C in CG dinucleotide
integer N
PLOIDY Ploidy type string N
SPECIES Species string N
Table 13 Sample Methylation Profile Table, Infinium HD Assay (Continued)
Column Description Type Visible by Default?
84 Part # 11319130 Rev. B
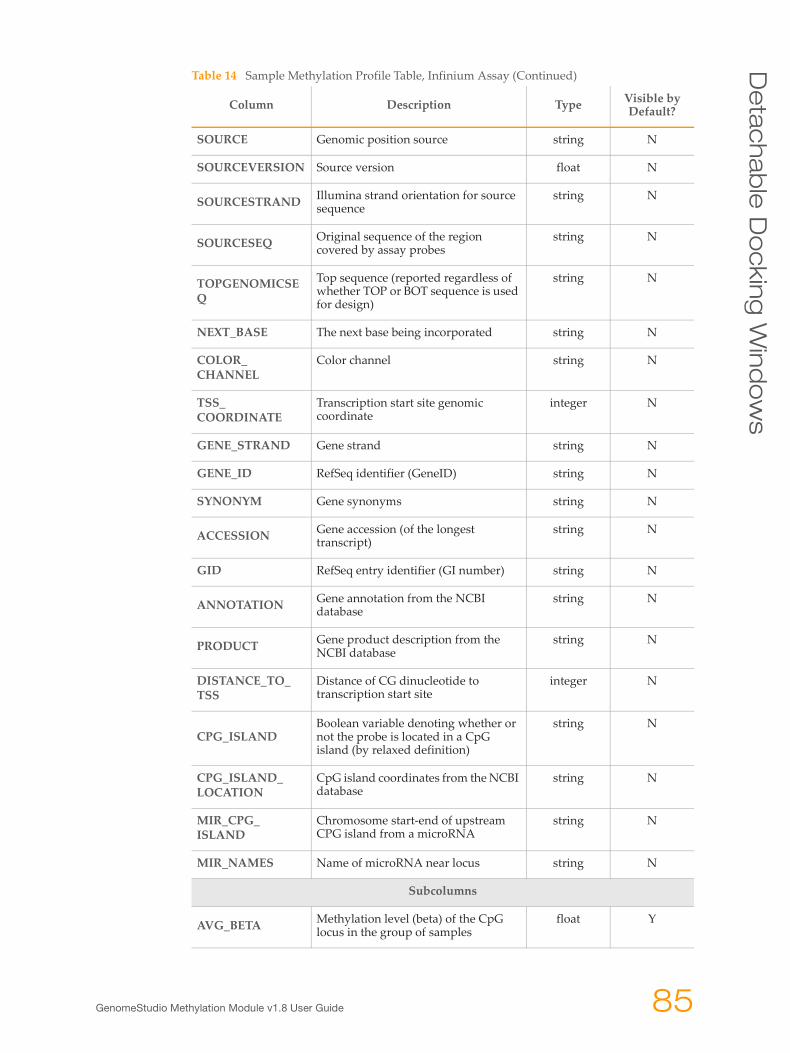
De
tac
hab
le D
oc
kin
g W
ind
ows
SOURCE Genomic position source string N
SOURCEVERSION Source version float N
SOURCESTRAND Illumina strand orientation for source sequence
string N
SOURCESEQ Original sequence of the region covered by assay probes
string N
TOPGENOMICSEQ
Top sequence (reported regardless of whether TOP or BOT sequence is used for design)
string N
NEXT_BASE The next base being incorporated string N
COLOR_CHANNEL
Color channel string N
TSS_COORDINATE
Transcription start site genomic coordinate
integer N
GENE_STRAND Gene strand string N
GENE_ID RefSeq identifier (GeneID) string N
SYNONYM Gene synonyms string N
ACCESSION Gene accession (of the longest transcript)
string N
GID RefSeq entry identifier (GI number) string N
ANNOTATION Gene annotation from the NCBI database
string N
PRODUCT Gene product description from the NCBI database
string N
DISTANCE_TO_TSS
Distance of CG dinucleotide to transcription start site
integer N
CPG_ISLANDBoolean variable denoting whether or not the probe is located in a CpG island (by relaxed definition)
string N
CPG_ISLAND_LOCATION
CpG island coordinates from the NCBI database
string N
MIR_CPG_ISLAND
Chromosome start-end of upstream CPG island from a microRNA
string N
MIR_NAMES Name of microRNA near locus string N
Subcolumns
AVG_BETA Methylation level (beta) of the CpG locus in the group of samples
float Y
Table 14 Sample Methylation Profile Table, Infinium Assay (Continued)
Column Description Type Visible by Default?
GenomeStudio Methylation Module v1.8 User Guide 85
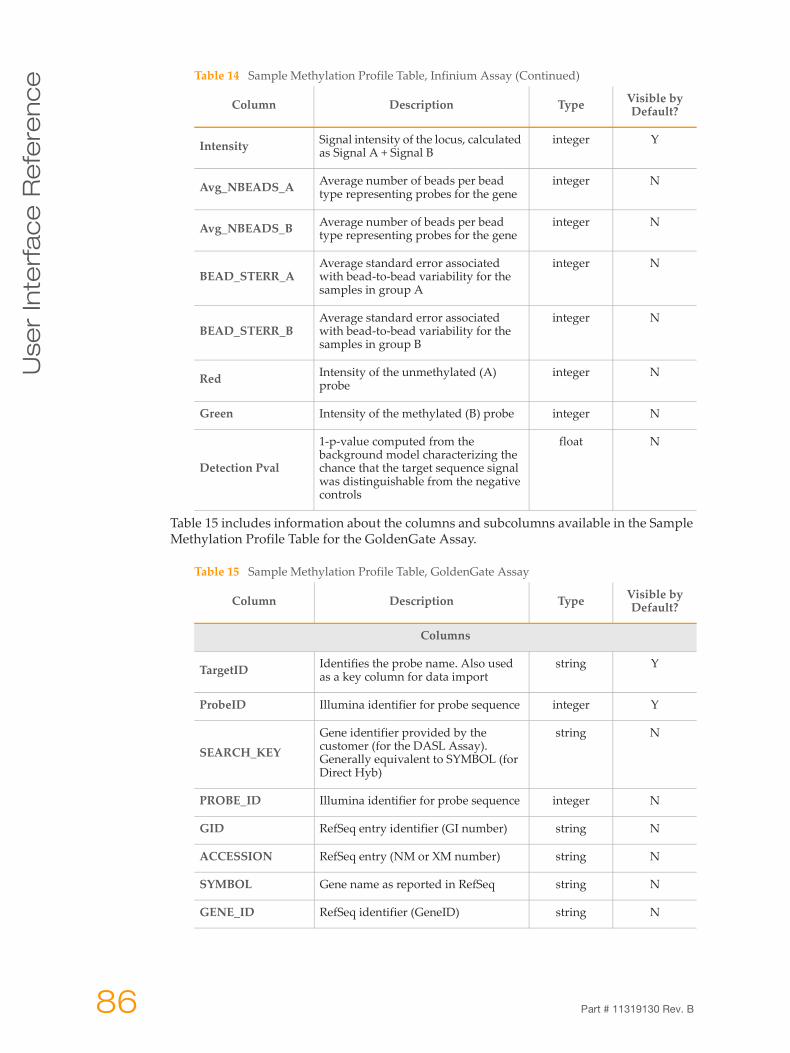
Use
r In
terf
ac
e R
efe
ren
ce
Table 15 includes information about the columns and subcolumns available in the Sample Methylation Profile Table for the GoldenGate Assay.
Intensity Signal intensity of the locus, calculated as Signal A + Signal B
integer Y
Avg_NBEADS_A Average number of beads per bead type representing probes for the gene
integer N
Avg_NBEADS_B Average number of beads per bead type representing probes for the gene
integer N
BEAD_STERR_AAverage standard error associated with bead-to-bead variability for the samples in group A
integer N
BEAD_STERR_BAverage standard error associated with bead-to-bead variability for the samples in group B
integer N
Red Intensity of the unmethylated (A) probe
integer N
Green Intensity of the methylated (B) probe integer N
Detection Pval
1-p-value computed from the background model characterizing the chance that the target sequence signal was distinguishable from the negative controls
float N
Table 15 Sample Methylation Profile Table, GoldenGate Assay
Column Description Type Visible by Default?
Columns
TargetID Identifies the probe name. Also used as a key column for data import
string Y
ProbeID Illumina identifier for probe sequence integer Y
SEARCH_KEYGene identifier provided by the customer (for the DASL Assay). Generally equivalent to SYMBOL (for Direct Hyb)
string N
PROBE_ID Illumina identifier for probe sequence integer N
GID RefSeq entry identifier (GI number) string N
ACCESSION RefSeq entry (NM or XM number) string N
SYMBOL Gene name as reported in RefSeq string N
GENE_ID RefSeq identifier (GeneID) string N
Table 14 Sample Methylation Profile Table, Infinium Assay (Continued)
Column Description Type Visible by Default?
86 Part # 11319130 Rev. B
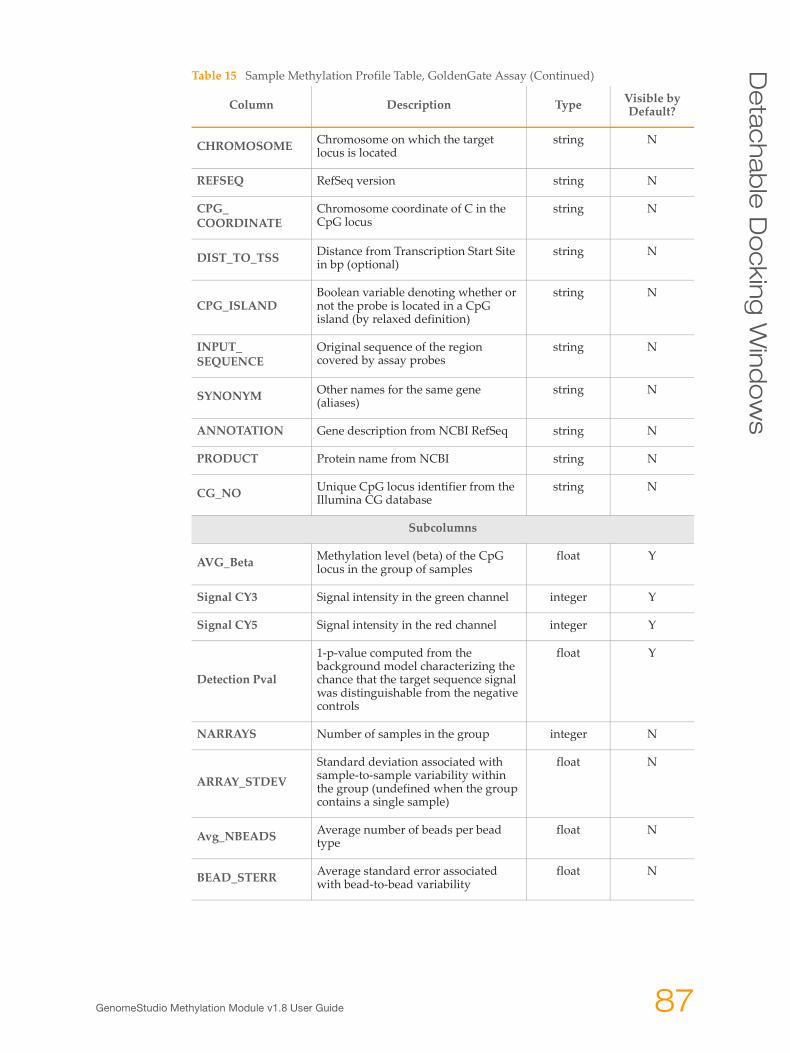
De
tac
hab
le D
oc
kin
g W
ind
ows
CHROMOSOME Chromosome on which the target locus is located
string N
REFSEQ RefSeq version string N
CPG_COORDINATE
Chromosome coordinate of C in the CpG locus
string N
DIST_TO_TSS Distance from Transcription Start Site in bp (optional)
string N
CPG_ISLANDBoolean variable denoting whether or not the probe is located in a CpG island (by relaxed definition)
string N
INPUT_SEQUENCE
Original sequence of the region covered by assay probes
string N
SYNONYM Other names for the same gene (aliases)
string N
ANNOTATION Gene description from NCBI RefSeq string N
PRODUCT Protein name from NCBI string N
CG_NO Unique CpG locus identifier from the Illumina CG database
string N
Subcolumns
AVG_Beta Methylation level (beta) of the CpG locus in the group of samples
float Y
Signal CY3 Signal intensity in the green channel integer Y
Signal CY5 Signal intensity in the red channel integer Y
Detection Pval
1-p-value computed from the background model characterizing the chance that the target sequence signal was distinguishable from the negative controls
float Y
NARRAYS Number of samples in the group integer N
ARRAY_STDEVStandard deviation associated with sample-to-sample variability within the group (undefined when the group contains a single sample)
float N
Avg_NBEADS Average number of beads per bead type
float N
BEAD_STERR Average standard error associated with bead-to-bead variability
float N
Table 15 Sample Methylation Profile Table, GoldenGate Assay (Continued)
Column Description Type Visible by Default?
GenomeStudio Methylation Module v1.8 User Guide 87
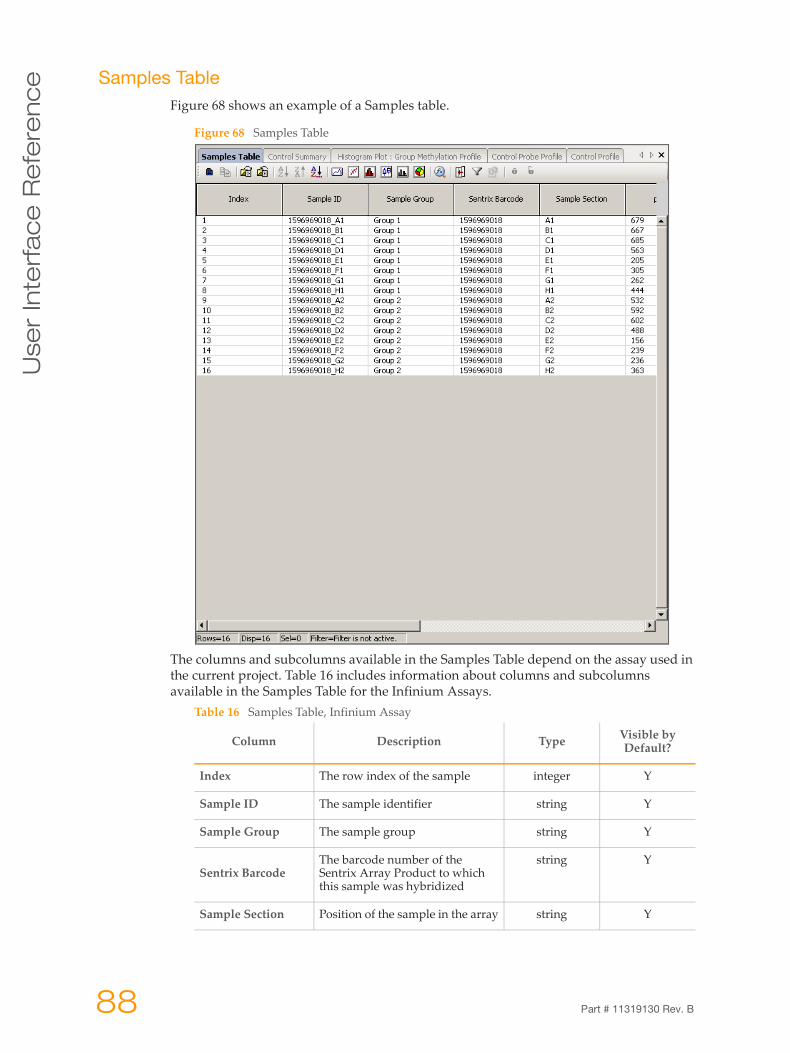
Use
r In
terf
ac
e R
efe
ren
ce
Samples TableFigure 68 shows an example of a Samples table.
Figure 68 Samples Table
The columns and subcolumns available in the Samples Table depend on the assay used in the current project. Table 16 includes information about columns and subcolumns available in the Samples Table for the Infinium Assays.
Table 16 Samples Table, Infinium Assay
Column Description Type Visible by Default?
Index The row index of the sample integer Y
Sample ID The sample identifier string Y
Sample Group The sample group string Y
Sentrix BarcodeThe barcode number of the Sentrix Array Product to which this sample was hybridized
string Y
Sample Section Position of the sample in the array string Y
88 Part # 11319130 Rev. B
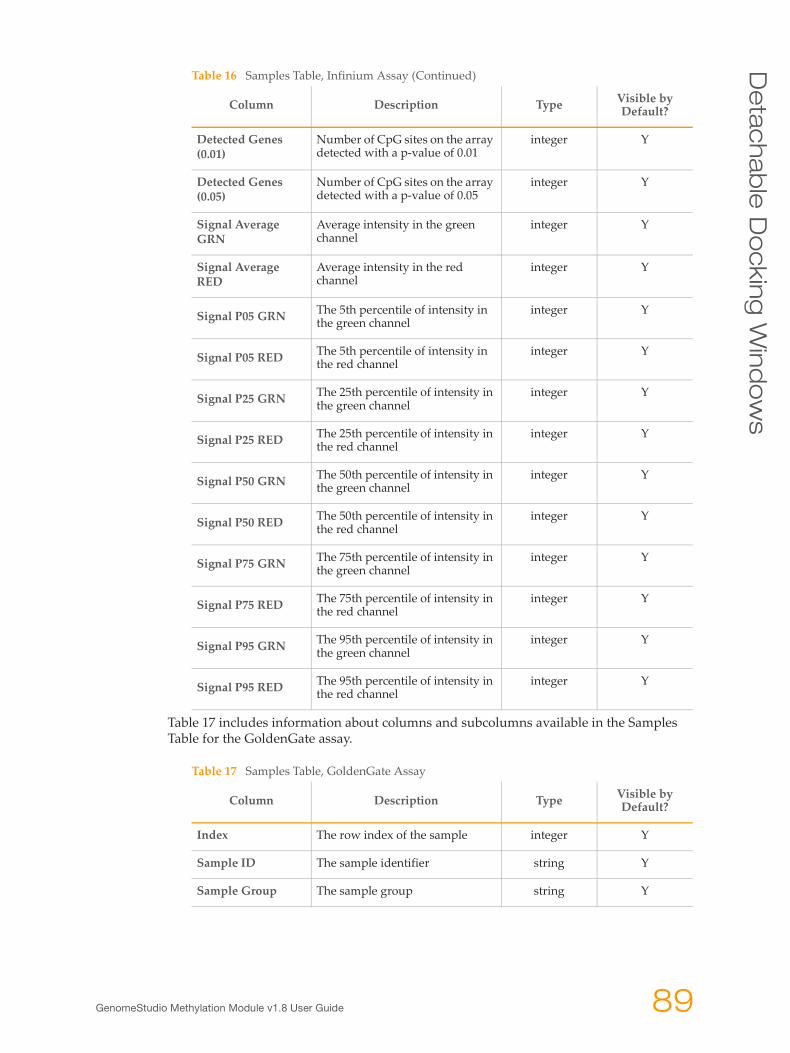
De
tac
hab
le D
oc
kin
g W
ind
ows
Table 17 includes information about columns and subcolumns available in the Samples Table for the GoldenGate assay.
Detected Genes (0.01)
Number of CpG sites on the array detected with a p-value of 0.01
integer Y
Detected Genes (0.05)
Number of CpG sites on the array detected with a p-value of 0.05
integer Y
Signal Average GRN
Average intensity in the green channel
integer Y
Signal Average RED
Average intensity in the red channel
integer Y
Signal P05 GRN The 5th percentile of intensity in the green channel
integer Y
Signal P05 RED The 5th percentile of intensity in the red channel
integer Y
Signal P25 GRN The 25th percentile of intensity in the green channel
integer Y
Signal P25 RED The 25th percentile of intensity in the red channel
integer Y
Signal P50 GRN The 50th percentile of intensity in the green channel
integer Y
Signal P50 RED The 50th percentile of intensity in the red channel
integer Y
Signal P75 GRN The 75th percentile of intensity in the green channel
integer Y
Signal P75 RED The 75th percentile of intensity in the red channel
integer Y
Signal P95 GRN The 95th percentile of intensity in the green channel
integer Y
Signal P95 RED The 95th percentile of intensity in the red channel
integer Y
Table 17 Samples Table, GoldenGate Assay
Column Description Type Visible by Default?
Index The row index of the sample integer Y
Sample ID The sample identifier string Y
Sample Group The sample group string Y
Table 16 Samples Table, Infinium Assay (Continued)
Column Description Type Visible by Default?
GenomeStudio Methylation Module v1.8 User Guide 89
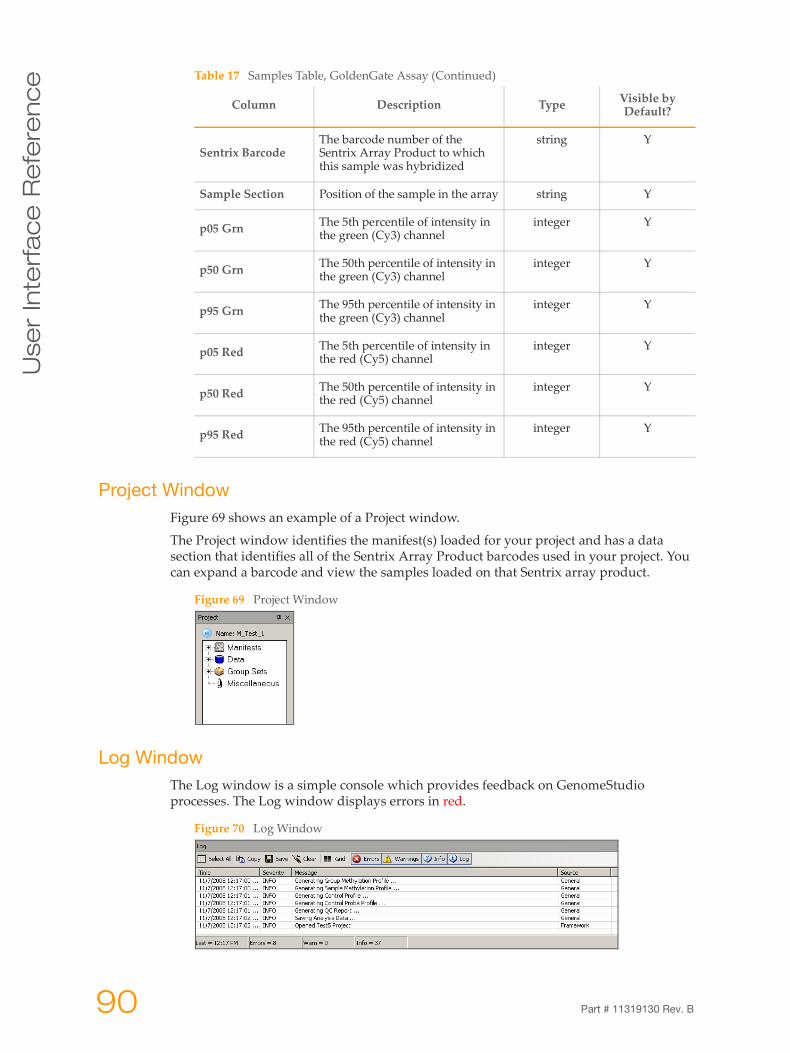
Use
r In
terf
ac
e R
efe
ren
ce
Project WindowFigure 69 shows an example of a Project window.
The Project window identifies the manifest(s) loaded for your project and has a data section that identifies all of the Sentrix Array Product barcodes used in your project. You can expand a barcode and view the samples loaded on that Sentrix array product.
Figure 69 Project Window
Log WindowThe Log window is a simple console which provides feedback on GenomeStudio processes. The Log window displays errors in red.
Figure 70 Log Window
Sentrix BarcodeThe barcode number of the Sentrix Array Product to which this sample was hybridized
string Y
Sample Section Position of the sample in the array string Y
p05 Grn The 5th percentile of intensity in the green (Cy3) channel
integer Y
p50 Grn The 50th percentile of intensity in the green (Cy3) channel
integer Y
p95 Grn The 95th percentile of intensity in the green (Cy3) channel
integer Y
p05 Red The 5th percentile of intensity in the red (Cy5) channel
integer Y
p50 Red The 50th percentile of intensity in the red (Cy5) channel
integer Y
p95 Red The 95th percentile of intensity in the red (Cy5) channel
integer Y
Table 17 Samples Table, GoldenGate Assay (Continued)
Column Description Type Visible by Default?
90 Part # 11319130 Rev. B
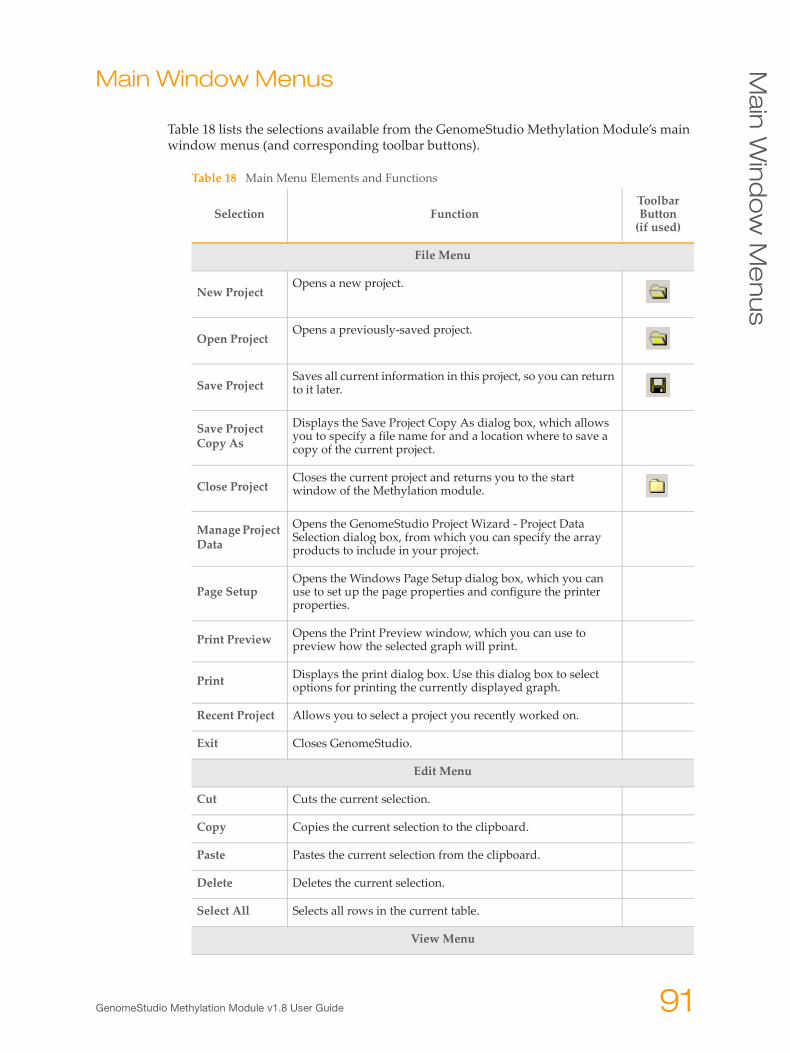
Ma
in W
ind
ow
Me
nus
Main Window Menus
Table 18 lists the selections available from the GenomeStudio Methylation Module’s main window menus (and corresponding toolbar buttons).
Table 18 Main Menu Elements and Functions
Selection FunctionToolbar Button
(if used)
File Menu
New ProjectOpens a new project.
Open ProjectOpens a previously-saved project.
Save ProjectSaves all current information in this project, so you can return to it later.
Save Project Copy As
Displays the Save Project Copy As dialog box, which allows you to specify a file name for and a location where to save a copy of the current project.
Close ProjectCloses the current project and returns you to the start window of the Methylation module.
Manage Project Data
Opens the GenomeStudio Project Wizard - Project Data Selection dialog box, from which you can specify the array products to include in your project.
Page SetupOpens the Windows Page Setup dialog box, which you can use to set up the page properties and configure the printer properties.
Print Preview Opens the Print Preview window, which you can use to preview how the selected graph will print.
Print Displays the print dialog box. Use this dialog box to select options for printing the currently displayed graph.
Recent Project Allows you to select a project you recently worked on.
Exit Closes GenomeStudio.
Edit Menu
Cut Cuts the current selection.
Copy Copies the current selection to the clipboard.
Paste Pastes the current selection from the clipboard.
Delete Deletes the current selection.
Select All Selects all rows in the current table.
View Menu
GenomeStudio Methylation Module v1.8 User Guide 91
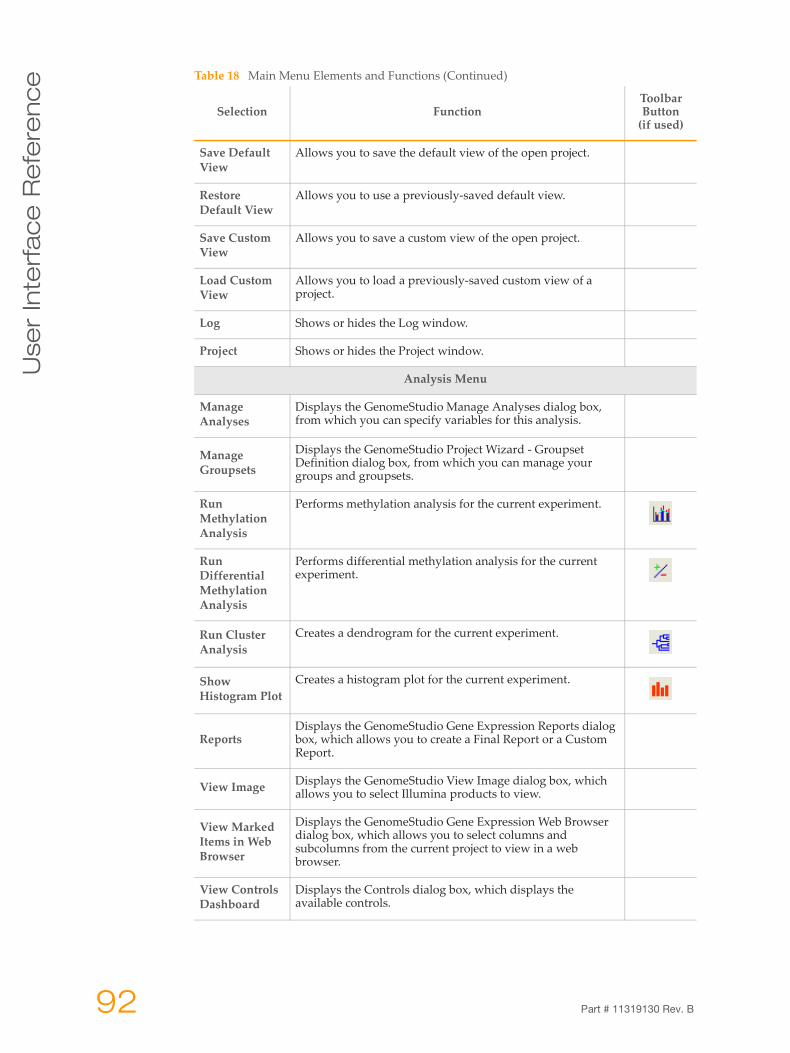
Use
r In
terf
ac
e R
efe
ren
ce
Save Default View
Allows you to save the default view of the open project.
Restore Default View
Allows you to use a previously-saved default view.
Save Custom View
Allows you to save a custom view of the open project.
Load Custom View
Allows you to load a previously-saved custom view of a project.
Log Shows or hides the Log window.
Project Shows or hides the Project window.
Analysis Menu
Manage Analyses
Displays the GenomeStudio Manage Analyses dialog box, from which you can specify variables for this analysis.
Manage Groupsets
Displays the GenomeStudio Project Wizard - Groupset Definition dialog box, from which you can manage your groups and groupsets.
Run Methylation Analysis
Performs methylation analysis for the current experiment.
Run Differential Methylation Analysis
Performs differential methylation analysis for the current experiment.
Run Cluster Analysis
Creates a dendrogram for the current experiment.
Show Histogram Plot
Creates a histogram plot for the current experiment.
ReportsDisplays the GenomeStudio Gene Expression Reports dialog box, which allows you to create a Final Report or a Custom Report.
View Image Displays the GenomeStudio View Image dialog box, which allows you to select Illumina products to view.
View Marked Items in Web Browser
Displays the GenomeStudio Gene Expression Web Browser dialog box, which allows you to select columns and subcolumns from the current project to view in a web browser.
View Controls Dashboard
Displays the Controls dialog box, which displays the available controls.
Table 18 Main Menu Elements and Functions (Continued)
Selection FunctionToolbar Button
(if used)
92 Part # 11319130 Rev. B
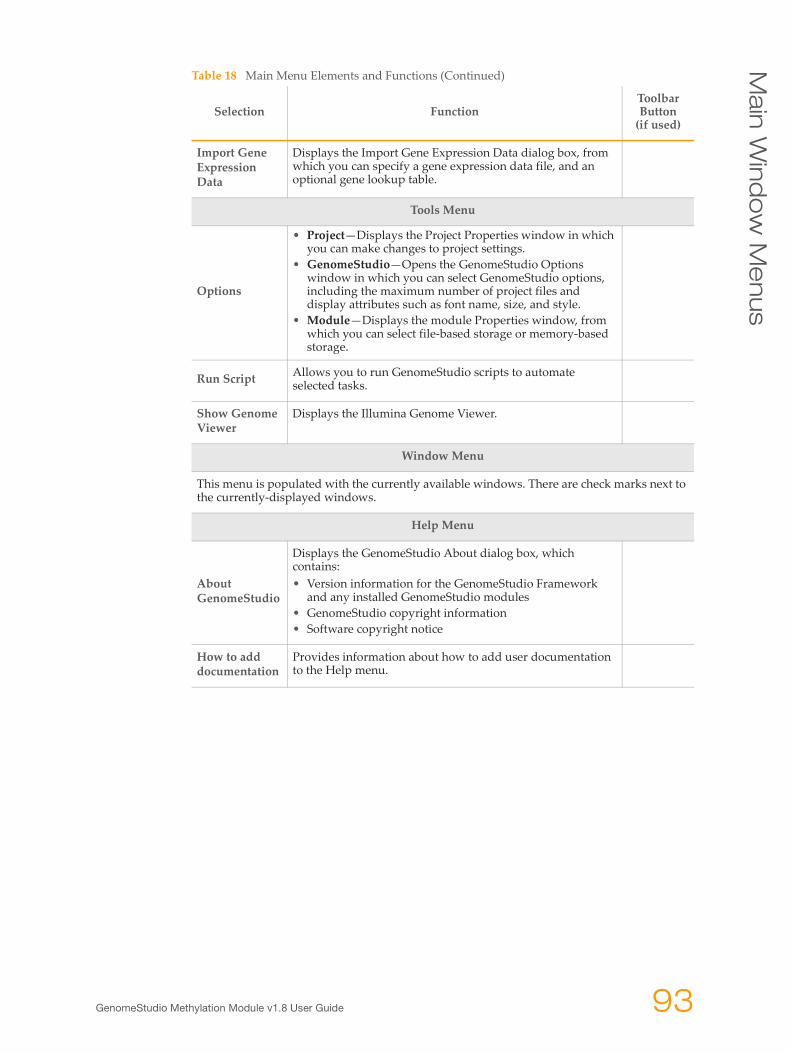
Ma
in W
ind
ow
Me
nus
Import Gene Expression Data
Displays the Import Gene Expression Data dialog box, from which you can specify a gene expression data file, and an optional gene lookup table.
Tools Menu
Options
• Project—Displays the Project Properties window in which you can make changes to project settings.
• GenomeStudio—Opens the GenomeStudio Options window in which you can select GenomeStudio options, including the maximum number of project files and display attributes such as font name, size, and style.
• Module—Displays the module Properties window, from which you can select file-based storage or memory-based storage.
Run Script Allows you to run GenomeStudio scripts to automate selected tasks.
Show Genome Viewer
Displays the Illumina Genome Viewer.
Window Menu
This menu is populated with the currently available windows. There are check marks next to the currently-displayed windows.
Help Menu
About GenomeStudio
Displays the GenomeStudio About dialog box, which contains: • Version information for the GenomeStudio Framework
and any installed GenomeStudio modules• GenomeStudio copyright information• Software copyright notice
How to add documentation
Provides information about how to add user documentation to the Help menu.
Table 18 Main Menu Elements and Functions (Continued)
Selection FunctionToolbar Button
(if used)
GenomeStudio Methylation Module v1.8 User Guide 93
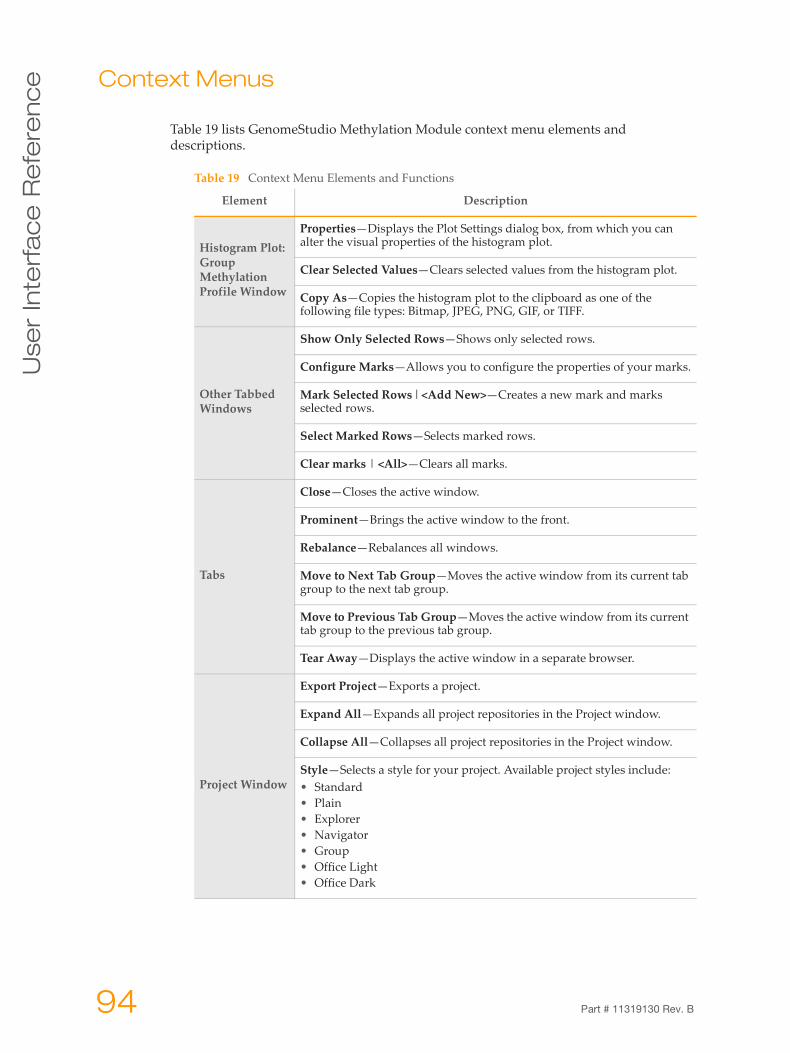
Use
r In
terf
ac
e R
efe
ren
ce
Context MenusTable 19 lists GenomeStudio Methylation Module context menu elements and descriptions.
Table 19 Context Menu Elements and Functions
Element Description
Histogram Plot: Group Methylation Profile Window
Properties—Displays the Plot Settings dialog box, from which you can alter the visual properties of the histogram plot.
Clear Selected Values—Clears selected values from the histogram plot.
Copy As—Copies the histogram plot to the clipboard as one of the following file types: Bitmap, JPEG, PNG, GIF, or TIFF.
Other Tabbed Windows
Show Only Selected Rows—Shows only selected rows.
Configure Marks—Allows you to configure the properties of your marks.
Mark Selected Rows | <Add New>—Creates a new mark and marks selected rows.
Select Marked Rows—Selects marked rows.
Clear marks | <All>—Clears all marks.
Tabs
Close—Closes the active window.
Prominent—Brings the active window to the front.
Rebalance—Rebalances all windows.
Move to Next Tab Group—Moves the active window from its current tab group to the next tab group.
Move to Previous Tab Group—Moves the active window from its current tab group to the previous tab group.
Tear Away—Displays the active window in a separate browser.
Project Window
Export Project—Exports a project.
Expand All—Expands all project repositories in the Project window.
Collapse All—Collapses all project repositories in the Project window.
Style—Selects a style for your project. Available project styles include:• Standard• Plain• Explorer• Navigator• Group• Office Light• Office Dark
94 Part # 11319130 Rev. B
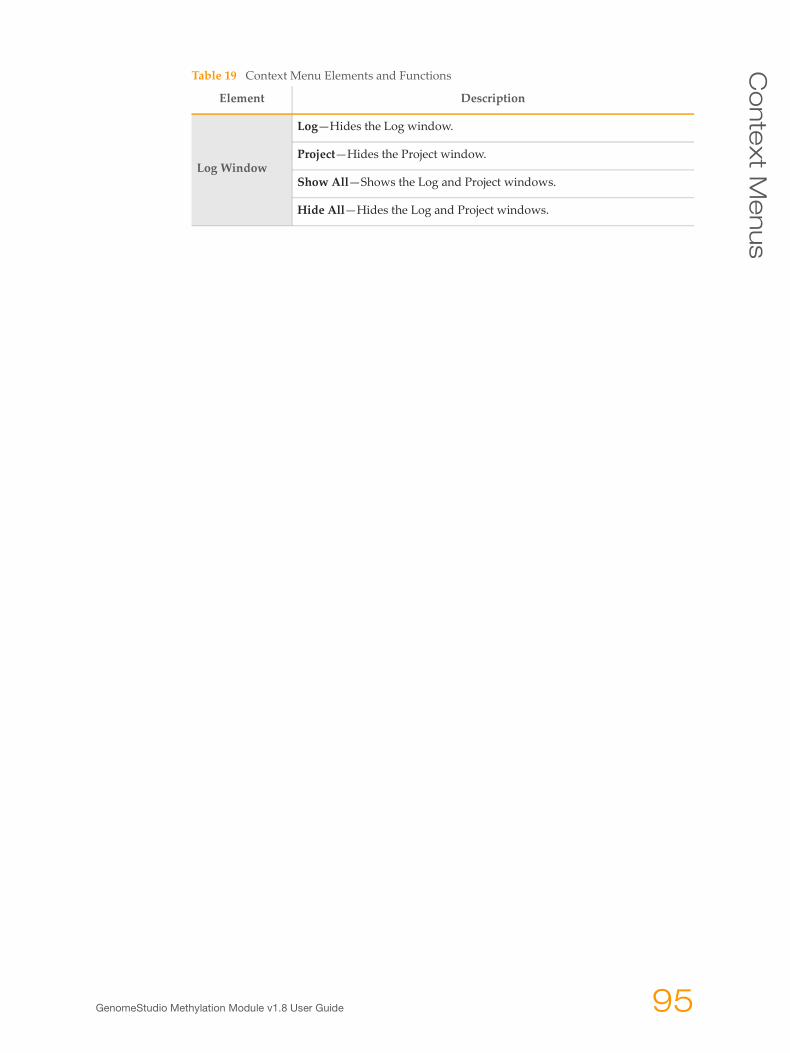
Co
nte
xt M
enus
Log Window
Log—Hides the Log window.
Project—Hides the Project window.
Show All—Shows the Log and Project windows.
Hide All—Hides the Log and Project windows.
Table 19 Context Menu Elements and Functions
Element Description
GenomeStudio Methylation Module v1.8 User Guide 95

Use
r In
terf
ac
e R
efe
ren
ce
96 Part # 11319130 Rev. B
Ap
pe
nd
ix A
Sample Sheet Format
Introduction . . . . . . . . . . . . . . . . . . . . . . . . . . . . . . . . . . . . . . . . . . . . . . . . . . . . 98
Data Section . . . . . . . . . . . . . . . . . . . . . . . . . . . . . . . . . . . . . . . . . . . . . . . . . . . 99
Sample Sheet Template . . . . . . . . . . . . . . . . . . . . . . . . . . . . . . . . . . . . . . . . . . 100
Sample Sheet Examples . . . . . . . . . . . . . . . . . . . . . . . . . . . . . . . . . . . . . . . . . 101
GenomeStudio Methylation Module v1.8 User Guide 97
Sa
mp
le S
he
et
Fo
rma
t
IntroductionThe sample sheet is a comma delimited text file (*.csv). It is divided into sections, indicated by lines with the section name enclosed by square brackets. The Data section is the only required section. You can also include a Header section, or other user-defined sections.
You must use a sample sheet if you plan to import gene expression data for correlation analysis. For more information about gene expression and methylation correlation analysis, see Chapter 5, Comparing Methylation and Gene Expression Data.
98 Part # 11319130 Rev. B
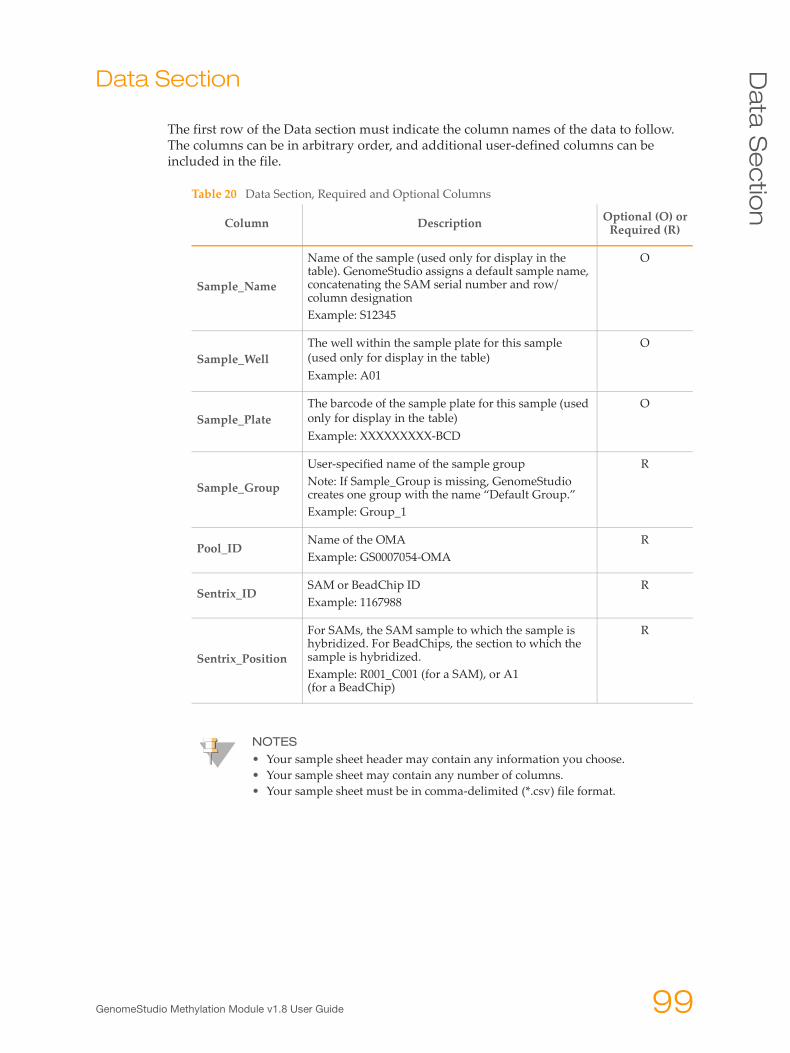
Da
ta S
ec
tion
Data Section
The first row of the Data section must indicate the column names of the data to follow. The columns can be in arbitrary order, and additional user-defined columns can be included in the file.
Table 20 Data Section, Required and Optional Columns
Column Description Optional (O) orRequired (R)
Sample_Name
Name of the sample (used only for display in the table). GenomeStudio assigns a default sample name, concatenating the SAM serial number and row/column designationExample: S12345
O
Sample_WellThe well within the sample plate for this sample (used only for display in the table)Example: A01
O
Sample_PlateThe barcode of the sample plate for this sample (used only for display in the table)Example: XXXXXXXXX-BCD
O
Sample_Group
User-specified name of the sample groupNote: If Sample_Group is missing, GenomeStudio creates one group with the name “Default Group.”Example: Group_1
R
Pool_IDName of the OMAExample: GS0007054-OMA
R
Sentrix_IDSAM or BeadChip IDExample: 1167988
R
Sentrix_Position
For SAMs, the SAM sample to which the sample is hybridized. For BeadChips, the section to which the sample is hybridized.Example: R001_C001 (for a SAM), or A1 (for a BeadChip)
R
NOTES• Your sample sheet header may contain any information you choose.• Your sample sheet may contain any number of columns.• Your sample sheet must be in comma-delimited (*.csv) file format.
GenomeStudio Methylation Module v1.8 User Guide 99
Sa
mp
le S
he
et
Fo
rma
t
Sample Sheet TemplateYou can download a template for a methylation sample sheet from iCom. Log into your iCom account from the Illumina home page, http://www.illumina.com.
100 Part # 11319130 Rev. B
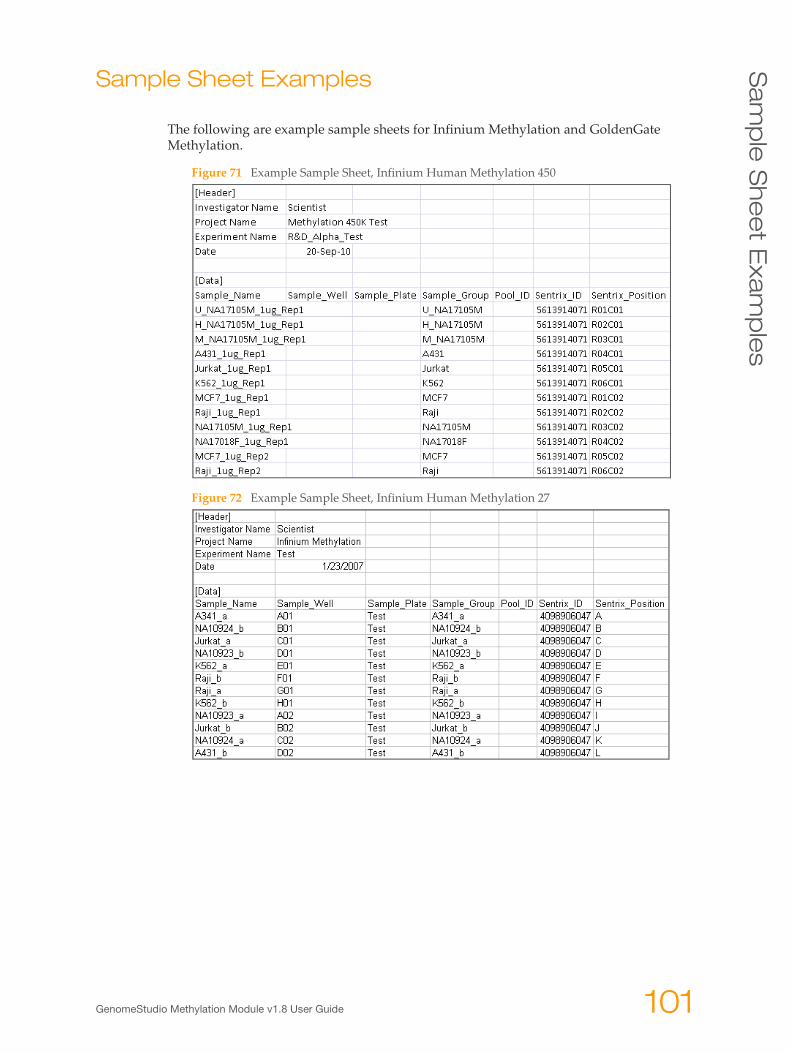
Sa
mp
le S
he
et E
xa
mp
les
Sample Sheet Examples
The following are example sample sheets for Infinium Methylation and GoldenGate Methylation.
Figure 71 Example Sample Sheet, Infinium Human Methylation 450
Figure 72 Example Sample Sheet, Infinium Human Methylation 27
GenomeStudio Methylation Module v1.8 User Guide 101
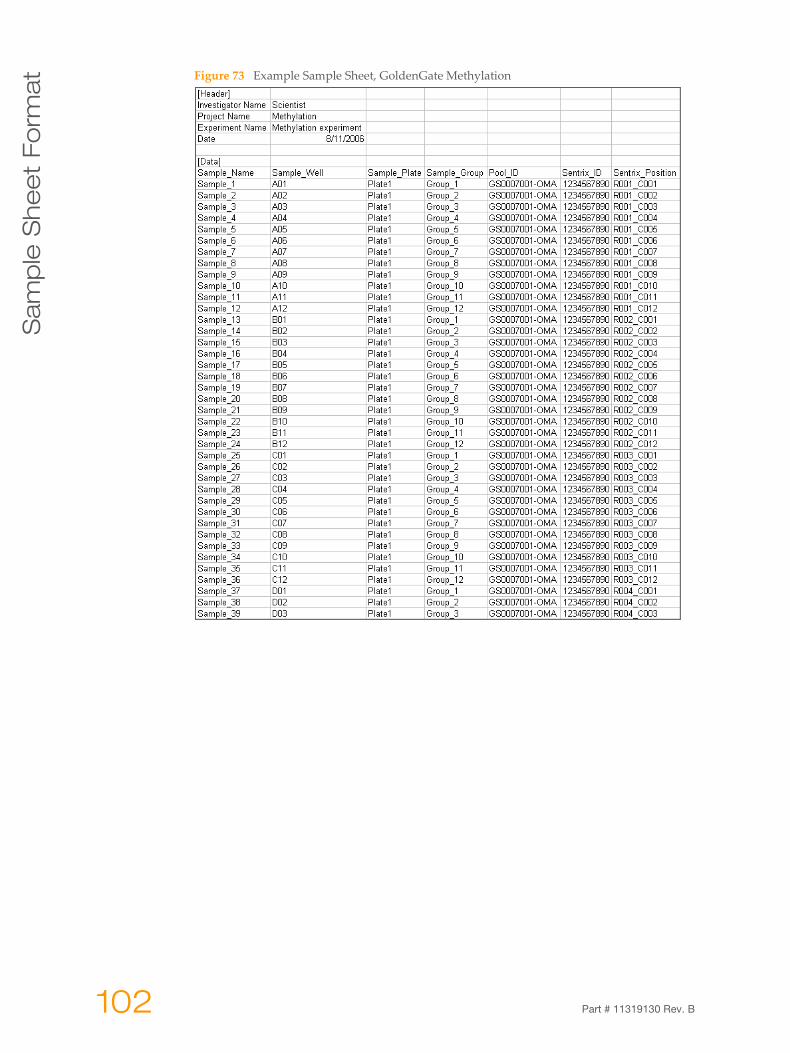
Sa
mp
le S
he
et
Fo
rma
t
Figure 73 Example Sample Sheet, GoldenGate Methylation102 Part # 11319130 Rev. B
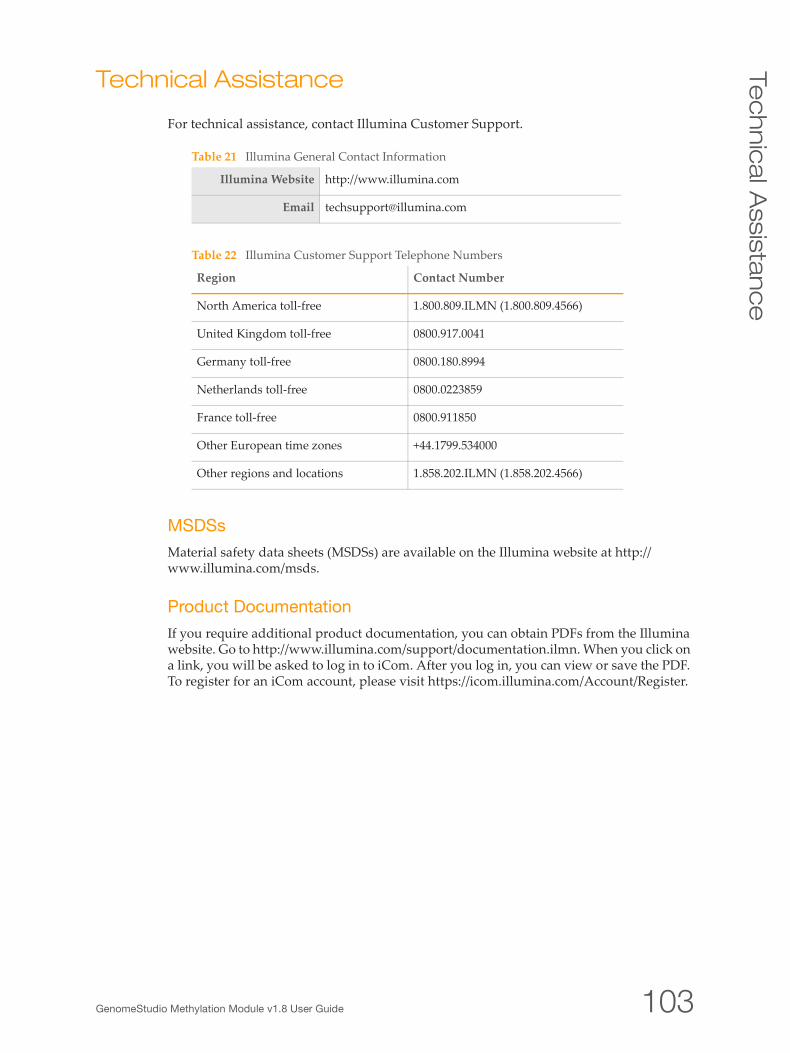
GenomeStudio Methylation Module v1.8 User Guide 103
Te
ch
nic
al A
ssis
tan
ce
Technical Assistance
For technical assistance, contact Illumina Customer Support.
MSDSs
Material safety data sheets (MSDSs) are available on the Illumina website at http://www.illumina.com/msds.
Product Documentation
If you require additional product documentation, you can obtain PDFs from the Illumina website. Go to http://www.illumina.com/support/documentation.ilmn. When you click on a link, you will be asked to log in to iCom. After you log in, you can view or save the PDF. To register for an iCom account, please visit https://icom.illumina.com/Account/Register.
Table 21 Illumina General Contact Information
Illumina Website http://www.illumina.com
Email [email protected]
Table 22 Illumina Customer Support Telephone Numbers
Region Contact Number
North America toll-free 1.800.809.ILMN (1.800.809.4566)
United Kingdom toll-free 0800.917.0041
Germany toll-free 0800.180.8994
Netherlands toll-free 0800.0223859
France toll-free 0800.911850
Other European time zones +44.1799.534000
Other regions and locations 1.858.202.ILMN (1.858.202.4566)

Illumina, Inc.
9885 Towne Centre Drive
San Diego, CA 92121-1975
+1.800.809.ILMN (4566)
+1.858.202.4566 (outside North America)
www.illumina.com