GenomeStudio Genotyping Module v2.0 User Guide … · SaveCustomView Savesacustomwindow...
76
For Research Use Only. Not for use in diagnostic procedures. September 2016 Document # 11319113 v01 ILLUMINA PROPRIETARY GenomeStudio ® Genotyping Module v2.0 Software Guide
Transcript of GenomeStudio Genotyping Module v2.0 User Guide … · SaveCustomView Savesacustomwindow...

For Research Use Only. Not for use in diagnostic procedures.
September 2016Document # 11319113 v01
ILLUMINA PROPRIETARY
GenomeStudio® GenotypingModule v2.0Software Guide

ii Document # 11319113 v01
This document and its contents are proprietary to Illumina, Inc. and its affiliates ("Illumina"), and are intended solely for thecontractual use of its customer in connection with the use of the product(s) described herein and for no other purpose. Thisdocument and its contents shall not be used or distributed for any other purpose and/or otherwise communicated, disclosed,or reproduced in any way whatsoever without the prior written consent of Illumina. Illumina does not convey any licenseunder its patent, trademark, copyright, or common-law rights nor similar rights of any third parties by this document.
The instructions in this document must be strictly and explicitly followed by qualified and properly trained personnel in orderto ensure the proper and safe use of the product(s) described herein. All of the contents of this document must be fully readand understood prior to using such product(s).
FAILURE TO COMPLETELY READ AND EXPLICITLY FOLLOW ALL OF THE INSTRUCTIONS CONTAINED HEREINMAY RESULT IN DAMAGE TO THE PRODUCT(S), INJURY TO PERSONS, INCLUDING TO USERS OR OTHERS, ANDDAMAGE TO OTHER PROPERTY.
ILLUMINA DOES NOT ASSUME ANY LIABILITY ARISING OUT OF THE IMPROPER USE OF THE PRODUCT(S)DESCRIBED HEREIN (INCLUDING PARTS THEREOF OR SOFTWARE).
© 2016 Illumina, Inc. All rights reserved.
Illumina, GenomeStudio, the pumpkin orange color, and the streaming bases design are trademarks of Illumina, Inc. and/or itsaffiliate(s) in the U.S. and/or other countries. All other names, logos, and other trademarks are the property of their respectiveowners.

RevisionHistory
Document Date Description of Change
Document #11371113 v01
September2016
Supported GenomeStudio Genotyping Module v2.0
Document #11371113 rev.A
November2008
• Changed the name of BeadStudio Genotyping Module toGenomeStudio Genotyping Module
• Supported GenomeStudio Genotyping Module v1.0
Document #11284301 rev.A
December2007
Supported BeadStudio Genotyping Module v3.2
Document #11207066 rev.C
February2007
Supported BeadStudio Genotyping Module
Document #11207066 rev.B
March2006
Supported BeadStudio Genotyping Module
Document #11207066 rev.A
December2005
Supported BeadStudio Genotyping Module
GenomeStudioGenotypingModule v2.0 iii

iv Document # 11319113 v01

Table ofContents
Revision History iiiTable of Contents v
Chapter 1 Overview 1Introduction 2Install the GenomeStudio Software 3Start the GenomeStudio Software 4
Chapter 2 Getting Started 5Introduction 6Create a Project From LIMS 7Create a Project From a Sample Sheet 8Create a Project FromDirectories 9Import Cluster Positions 10
Chapter 3 Viewing Data 11Introduction 12Full Data Table 13SNP Table 15Samples Table 18Paired Sample Table 21Errors Table 22
Chapter 4 Editing Data 23Introduction 24MainWindowMenus 25SNP Graph Toolbar 29Data Table Toolbar 30Context Menus 31
Chapter 5 Common Tasks 35Select Samples in the SNP Graph 36Display Marked Samples 37Customize the SNP Table 38View Samples in the Controls Dashboard 39Update SNP Statistics 40Change the No-Call Threshold 41
Chapter 6 Generating Clusters 43Introduction 44Cluster SNPs 45Edit Clusters 46Export a Cluster File 47
Chapter 7 Analyzing Data 49Import Phenotype Information 50Estimate the Gender of Selected Samples 51Edit the Sample Properties 52
GenomeStudioGenotypingModule v2.0 v

vi Document # 11319113 v01
Analyze Paired Sample Data 53View Concordance Calculations 54Export Allele Calls 55Import Allele Calls 56GenomeStudio Plug-ins 57
Chapter 8 Generating Reports 59Introduction 60Generate a Final Report 61DNA Report 62Locus Summary Report 63Locus x DNA Report 65Generate a Reproducibility and Heritability Report 66
Technical Assistance 69

Chapter1
GenomeStudioGenotypingModule v2.0 1
Chapter 1 Overview
Overview
Introduction 2Install the GenomeStudio Software 3Start the GenomeStudio Software 4

Overview
2 Document # 11319113 v01
Introduction
The Illumina® GenomeStudio Genotyping Module™ Genotyping Module Software v2.0analyzes Illumina genotyping data to optimize call rates.Before installing the Genotyping Module, you must have access to the Internet and aMyIllumina account. If you do not have access to the Internet, see Technical Assistance onpage 69.
FeaturesYou can perform the following tasks with the Genotyping Module:} Identify poorly performing samples.} Manually adjust cluster positions.} Set genotyping and clustering intensity thresholds.} Analyze genotyping data and create cluster files.} Import and export cluster positions.

InstalltheGeno
meS
tudioSoftw
are
GenomeStudioGenotypingModule v2.0 3
Install theGenomeStudioSoftware
1 Navigate to the GenomeStudio support page, and then select Downloads.
2 Select GenomeStudio Software 2.0, and then select GenomeStudio GenotypingModule 2.0 Installer.
3 Accept the software terms and license agreement, and then click Install.
Overview
4 Document # 11319113 v01
Start theGenomeStudioSoftware
1 From your desktop, double-click the GenomeStudio icon.
2 In the Platform Login Form dialog box, enter your email and password from yourMyIllumina account.
3 Click Log In.

Chapter2
GenomeStudioGenotypingModule v2.0 5
Chapter 2 Getting Started
GettingStarted
Introduction 6Create a Project From LIMS 7Create a Project From a Sample Sheet 8Create a Project FromDirectories 9Import Cluster Positions 10

Getting
Started
6 Document # 11319113 v01
Introduction
You can create a Genotyping Module project from one of the following sources of sampledata:
} An Illumina LIMS database} A sample sheet} Directories containing intensity data files

Create
aProject
FromLIM
S
GenomeStudioGenotypingModule v2.0 7
Create aProject FromLIMS
1 From your desktop, double-click the GenomeStudio icon.
2 In the new project pane, click Genotyping.
3 Click Next.
4 Click Select from LIMS, and then click Next.
5 Click Login, and then enter your LIMS user name and password.
6 Click OK.
7 At the Institute field, select your institution.
8 At the Investigator field, select your investigator.
9 At the Project field, select your project.
10 At the Product field, select your product.If your product is multi-species, expand the product to select an individual species.
11 Click Finish.
12 [Optional] Click Use Start Date and select a start date from the calendar.
13 [Optional] Click Use End Date and select an end date from the calendar.
14 Click OK.
15 [Optional] Click Yes to calculate the heritability and reproducibility errors.
16 Click OK.

Getting
Started
8 Document # 11319113 v01
Create aProject FromaSample Sheet
1 In the new project pane, click Genotyping, and then click Next.
2 In the Create field, enter the project name, and then click Next.
3 Click Use sample sheet to load sample intensities, and then click Next.
4 In the Sample Sheet field, browse to your sample sheet (*.csv) file.
5 In the Data Repository field, browse to the directory that contains your raw intensity(*.idat) files.
6 In the Manifest Repository field, browse to the directory that contains yourSNP manifest (*.bpm) file.The software uses this directory to locate the names of the SNP manifests.
7 Click Next.
8 [Optional] Click the Import cluster positions from a cluster file checkbox. See ImportCluster Positions on page 10.
a Select Browse, highlight the cluster file, and select Open.
9 Click Finish.Genotyping Module loads the files from the sample sheet and displays the data.

Create
aProject
FromDirecto
ries
GenomeStudioGenotypingModule v2.0 9
Create aProject FromDirectories
1 In the new project pane, click Genotyping, and then click Next.
2 In the Create field, enter the project name, and then click Next.
3 Click Load sample intensities by selecting directories with intensity files, and thenclick Next.
4 At the Manifest Repository field, browse to the file that contains your SNP manifest(*.bpm) file.
5 At the Data Repository field, browse to the directory that contains your raw intensity(*.idat) files.
6 Select one or more directories, and click Add, and then click Next.
7 [Optional] Click the Import cluster positions from a cluster file checkbox. See ImportCluster Positions on page 10.
a Select Browse, highlight the cluster file, and select Open.
8 [Optional] In the Project Settings area, select the following options:} Pre-Calculate} Cluster SNPs} Calculate Sample and SNP Statistics} Calculate Heritability} Gen Call Threshold
9 Click Finish.

Getting
Started
10 Document # 11319113 v01
ImportClusterPositions
You can import a cluster (*.egt) file when creating a project in the Genotyping Module.
1 In the GenomeStudio Project Wizard, click the Import cluster positions from a clusterfile checkbox.
2 At the Cluster File field, browse to the cluster file you want to use.
3 [Optional] Click Pre-Calculate to optimize your project speed based on your computermemory capabilities.
4 [Optional] In the Project Creation Actions settings, select from the following options:} Cluster SNPs} Calculate Sample and SNP Statistics} Calculate Heritability
5 At the GenCall Threshold field, specify the score cutoff for this project.We recommend the 0.15 GenCall score cutoff for Infinium products.
6 Click Finish.

Chapter3
GenomeStudioGenotypingModule v2.0 11
Chapter 3 Viewing Data
ViewingData
Introduction 12Full Data Table 13SNP Table 15Samples Table 18Paired Sample Table 21Errors Table 22

ViewingData
12 Document # 11319113 v01
Introduction
The Genotyping Module has many views, such as graphs, tables, and project information.The views are detachable docking windows. Click and drag the windows to where youwant to dock them on the main window. The views show the following data:
View Description
Sample Graph All SNPs for the selected sample.
SNP Graph All samples for the selected SNP in the SNP table and Full Datatable.
SNP Graph Alt All samples for the selected SNP in the SNP table and Full Datatable. (Use to compare 2 different views of the samples.)
Full Data Table Data for all samples.
SNP Table Statistics for each SNP.
Samples Table Data for each sample.
Paired Sample Table Statistics for paired samples.
Errors Table Discrepancies between replicate or related samples
Log Window A list of the activities that are created by the software.
Project Window Manifests and sample barcodes loaded in the project.
Table 1 Views in Genotyping Module
FullD
ataTab
le
GenomeStudioGenotypingModule v2.0 13
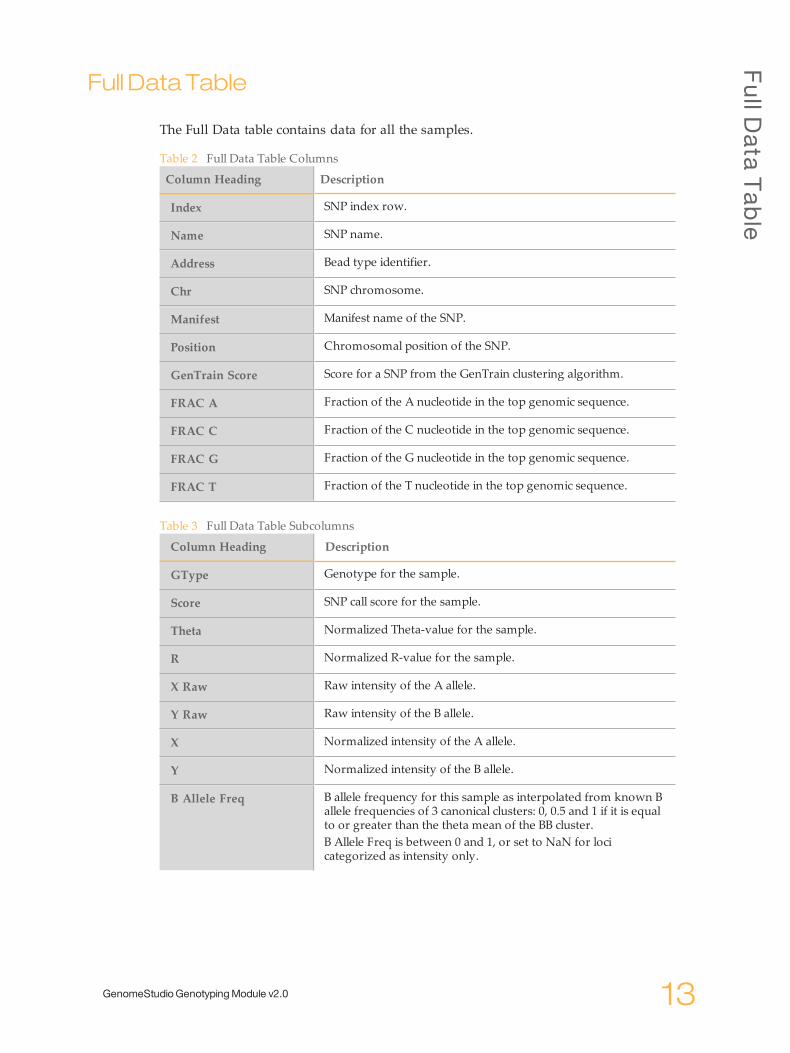
Full Data Table
The Full Data table contains data for all the samples.
Column Heading Description
Index SNP index row.
Name SNP name.
Address Bead type identifier.
Chr SNP chromosome.
Manifest Manifest name of the SNP.
Position Chromosomal position of the SNP.
GenTrain Score Score for a SNP from the GenTrain clustering algorithm.
FRAC A Fraction of the A nucleotide in the top genomic sequence.
FRAC C Fraction of the C nucleotide in the top genomic sequence.
FRAC G Fraction of the G nucleotide in the top genomic sequence.
FRAC T Fraction of the T nucleotide in the top genomic sequence.
Table 2 Full Data Table Columns
Column Heading Description
GType Genotype for the sample.
Score SNP call score for the sample.
Theta Normalized Theta-value for the sample.
R Normalized R-value for the sample.
X Raw Raw intensity of the A allele.
Y Raw Raw intensity of the B allele.
X Normalized intensity of the A allele.
Y Normalized intensity of the B allele.
B Allele Freq B allele frequency for this sample as interpolated from known Ballele frequencies of 3 canonical clusters: 0, 0.5 and 1 if it is equalto or greater than the theta mean of the BB cluster.B Allele Freq is between 0 and 1, or set to NaN for locicategorized as intensity only.
Table 3 Full Data Table Subcolumns

ViewingData
14 Document # 11319113 v01
Column Heading Description
Log R Ratio Base-2 log of the normalized R value over the expected R valuefor the theta value (interpolated from the R-values ofthe clusters).For loci categorized as intensity only; the value is adjusted sothat the expected R value is the mean of the cluster.
Top Alleles Illumina-designated top strand genotype.
Import Calls Genotype calls for an imported sample.
Concordance Numeric correlation between the top allele call for a SNP in theproject and the imported allele call of a SNP from anotherproject.
Orig Call Genotype call of SNP and sample at the time the project wasoriginally clustered.
CNV Value Copy number estimate at each locus.
CNV Confidence Level of confidence that the Copy Number Value (CNV) iscorrect based on the algorithm used.
Plus/Minus Alleles Genotype for the sample, as related to the nucleotide alleles onthe plus strand.

SNPTab
le
GenomeStudioGenotypingModule v2.0 15
SNPTable
The SNP Table shows the statistics for each SNP.
Column Heading Description
Index SNP index row.
Name SNP name.
Chr SNP chromosome.
Position SNP chromosomal position.
ChiTest 100 Normalized Hardy-Weinberg p value calculated using genotypefrequency. The value is calculated with 1 degree of freedom andnormalized to 100 individuals.
Het Excess Excess of heterozygotes measurement for the SNP based onHardy-Weinberg Equilibrium.0—No excess of heterozygotes(-) Negative values—Adeficiency of heterozygotes
AA Freq Frequency of AA calls.
AB Freq Frequency of AB calls.
BB Freq Frequency of BB calls.
Call Freq Call frequency.
Minor Freq Minor allele frequency.
Aux User-defined auxiliary value for the SNP.
Rep Errors The number of reproducibility errors for the SNP as allelecomparisons between replicates.
SNP Nucleotide substitution for the SNP on the Illumina ILMNstrand.
ILMN Strand Design strand designation.
Customer Strand Customer strand designation.
Top Genomic Sequence Sequence on the top strand around the SNP.
Comment User-defined comment. Right-click in the column to set thevalue.
Norm ID Normalization ID for the SNP.
HW Equil Hardy-Weinberg Equilibrium score for the SNP.
Concordance Measurement between 2 genotypes from the same SNP locus.
Table 4 SNP Table Columns

ViewingData
16 Document # 11319113 v01
Column Heading Description
CNV Region SNPs and nonpolymorphic probes falling in known CNVregions.This column populates information from the product manifestand may not be current because the number of known CNVregions is constantly changing.
Exp Clusters Number of expected clusters for a locus:1—Nonpolymorphic probes2—Mitochondrial DNA and Y loci3—Any other lociThis column populates information from the product manifest.
Intensity Only Indicates locus information.1—Locus with intensity information only that is not included inGenomeStudio statistics such as Call Rate.0—Locus with intensity and genotyping information that isincluded in GenomeStudio statistics such as call rate.The column populates information from the product manifestand can be edited.
Column Heading Description
Address The SNP index row.
GenTrain Score The SNP cluster quality.
Orig Score The original GenTrain score for the SNP before edits.
Edited The SNP was edited after identifying clustering positions.1—Edited0—Unedited
Cluster Sep The cluster separation measurement for the SNP that rangesbetween 0 and 1.
AA T Mean The theta value of the AA cluster center in normalized polarcoordinates.
AA T Dev The standard deviation in theta of the AA cluster in normalizedpolar coordinates.
AB T Mean The theta value of the AB cluster center in normalized polarcoordinates.
AB T Dev The standard deviation in theta of the AB cluster in normalizedpolar coordinates.
BB T Mean The theta value of the BB cluster center in normalized polarcoordinates.
BB T Dev The standard deviation in theta of the BB cluster in normalizedpolar coordinates.
Table 5 SNP Table Subcolumns

SNPTab
le
GenomeStudioGenotypingModule v2.0 17
Column Heading Description
AA R Mean R value of the center of the AA cluster, in normalizedpolar coordinates
AA R Dev Standard deviation in R of the AA cluster, in normalizedpolar coordinates
AB R Mean The R value of the AB cluster center in normalizedpolar coordinates.
AB R Dev The standard deviation in R of the AB cluster in normalizedpolar coordinates.
BB R Mean The R value of the BB cluster center in normalizedpolar coordinates
BB R Dev The standard deviation in R of the BB cluster in normalizedpolar coordinates.
Intensity Threshold The intensity threshold value.
ILMN Strand The design strand designation.
Address 2 The bead type unidentified for the second allele. It is only usedfor Infinium I.
Norm ID The normalization ID for the SNP.
Manifest The manifest name of the SNP.

ViewingData
18 Document # 11319113 v01
Samples Table
The Samples Table shows the statistics for each sample.
Column Heading Description
Index Sample index row.
Sample ID Sample identifier.
Call Rate Percentage of SNPs that have a GenCall score greater than thespecified threshold.
Gender User-specified gender for the sample.
p05 Grn 5th percentile of B allele intensity.
p50 Grn 50th percentile of B allele intensity.
p95 Grn 95th percentile of B allele intensity.
p05 Red 5th percentile of A allele intensity.
p50 Red 50th percentile of A allele intensity.
p95 Red 95th percentile of A allele intensity.
p10 GC 10th percentile GenCall score for all SNPs.
p50 GC 50th percentile GenCall score for all SNPs.
Rep Error Rate Reproducibility error rate is calculated as 1 - sqrt(1 -errors/max_possible_errors). Errors and max_possible_errorsdo not include genotype calls that fall below the no-callthreshold.
PC Error Rate Parent-child heritability error rate.
PPC Error Rate Parent-parent-child heritability error rate.
Call Rate Percentage of SNPs that have a GenCall score greater than thespecified threshold.
Aux Arbitrary number you can use to differentiate and sort samples.Right-click in the Samples Table to set this value.
Subset Grouping of samples into a subset.
Array Info Position on the slide for this sample in terms of the sentrix IDand sentrix position.
Genotype Genotype for this sample for the SNP currently selected in theSNP Table.
Score GenCall score for this sample for the SNP currently selected inthe SNP Table.
Table 6 Samples Table Columns

Sam
ples
Tab
le
GenomeStudioGenotypingModule v2.0 19
Column Heading Description
Sample Name Sample name.
Sample Group User-entered sample group.
Sample Plate Sample plate identifier.
Sample Well Well within the sample plate.
Gender Est Estimated gender.
Requeue Status Sample requeue status in LIMS. Blank status indicates that thesample does not need requeuing.
Concordance Concordance across all SNPs for this sample. The value ispopulated when alleles calls are imported for the same samplefrom another project.
Ethnicity Ethnicity of the individual from the acquired sample.
Age Age of the individual from the acquired sample.
Weight Weight in kg of the individual from the acquired sample.
Height Height in meters of the individual from the acquired sample.
Blood Pressure Systolic Systolic blood pressure of the individual from the acquiredsample.
Blood PressureDiastolic
Diastolic blood pressure of the individual from the acquiredsample.
Blood Type Blood type of the individual from from the acquired sample.
PhenotypePos 1
Positive phenotype 1 of the individual from the acquiredsample.
PhenotypePos 2
Positive phenotype 2 of the individual from the acquiredsample.
PhenotypePos 3
Positive phenotype 3 of the individual from the acquiredsample.
PhenotypeNeg 1
Negative phenotype 1 of the individual from the acquiredsample.
PhenotypeNeg 2
Negative phenotype 2 of the individual from the acquiredsample.
PhenotypeNeg 3
Negative phenotype 3 of the individual from the acquiredsample.
Comment User-entered comments.
Tissue Source Tissue source of the individual from which this sample wasacquired.

ViewingData
20 Document # 11319113 v01
Column Heading Description
Calls Number of loci called.
No Calls Number of loci not called.
Excluded Whether the sample is excluded.1—Excluded0—Included
Column Heading Description
Sentrix ID Barcode number of the Universal Array Product to which thissample was hybridized.
Sentrix Position Section on the product.
Imaging Date Imaging date.
Scanner ID Name of the scanner.
PMT Green Green PMT setting of the scanner.
PMT Red Red PMT setting of the scanner.
Software Version Version of the iScan software that scanned the sample.
User User name of the individual that scanned the sample.
p05 Grn 5th percentile of B allele intensity.
p50 Grn 50th percentile of B allele intensity.
p95 Grn 95th percentile of B allele intensity.
p05 Red 5th percentile of A allele intensity.
p50 Red 50th percentile of A allele intensity.
p95 Red 95th percentile of A allele intensity.
p10 GC 10th percentile GenCall score over all SNPs.
p50 GC 50th percentile GenCall score over all SNPs.
Call Rate Percentage of SNPs that have a GenCall score greater than thespecified threshold.
Table 7 Samples Table Per-Manifest Subcolumns

Paired
Sam
pleTab
le
GenomeStudioGenotypingModule v2.0 21
PairedSample Table
The Paired Sample table shows statistics for paired samples.
Column Description
Index SNP index row.
Name SNP name.
SNP SNP.
Address Bead type identifier.
Chr SNP chromosome.
Position SNP chromosomal position.
Table 8 Paired Sample Table Columns
Columns Heading Description
Theta Ref. Theta value for the reference sample.
Theta Sub. Theta value for the subject sample.
|dTheta sub-ref| Absolute value of the difference between subject and referencetheta values.
Allele Freq Ref. Allele frequency of the reference sample.
Allele Freq Sub. Allele frequency of the subject sample.
|dAlleleFreq sub-ref| Absolute value of the difference between subject and referenceallele frequency values.
R Ref. R value for the reference sample.
R Sub. R value for the subject sample.
Log2 (Rsub/Rref) Log base 2 of the ratio of subject and reference R values.
GType Ref. Genotype of the reference sample.
GType Sub. Genotype of the subject sample.
LOH Score Probability that there is loss of heterozygosity in a region ofinterest.
CN Estimate Estimate of the copy number at an individual locus.
CN Shift Statistical confidence level between 0 and 1 indicating whether acopy number change has occurred.1—No copy number change.0—Copy number change.
Table 9 Per-Pair Sample Subcolumns
ViewingData
22 Document # 11319113 v01
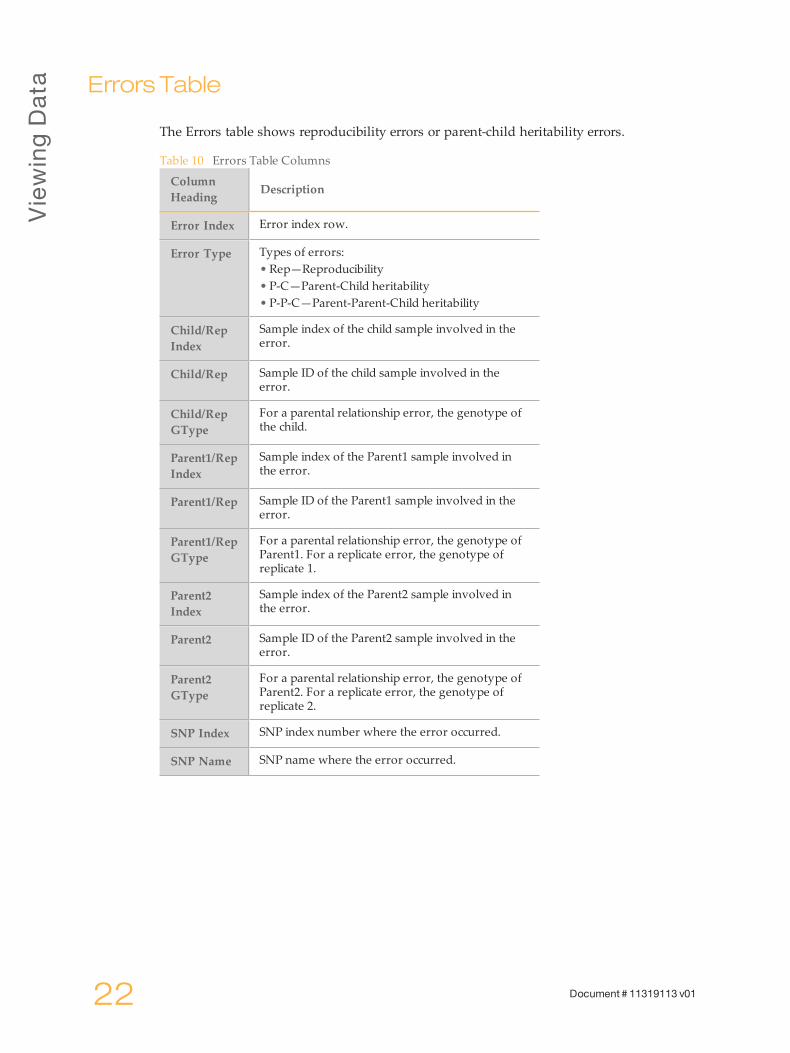
Errors Table
The Errors table shows reproducibility errors or parent-child heritability errors.
ColumnHeading Description
Error Index Error index row.
Error Type Types of errors:• Rep—Reproducibility• P-C—Parent-Child heritability• P-P-C—Parent-Parent-Child heritability
Child/RepIndex
Sample index of the child sample involved in theerror.
Child/Rep Sample ID of the child sample involved in theerror.
Child/RepGType
For a parental relationship error, the genotype ofthe child.
Parent1/RepIndex
Sample index of the Parent1 sample involved inthe error.
Parent1/Rep Sample ID of the Parent1 sample involved in theerror.
Parent1/RepGType
For a parental relationship error, the genotype ofParent1. For a replicate error, the genotype ofreplicate 1.
Parent2Index
Sample index of the Parent2 sample involved inthe error.
Parent2 Sample ID of the Parent2 sample involved in theerror.
Parent2GType
For a parental relationship error, the genotype ofParent2. For a replicate error, the genotype ofreplicate 2.
SNP Index SNP index number where the error occurred.
SNP Name SNP name where the error occurred.
Table 10 Errors Table Columns

Chapter4
GenomeStudioGenotypingModule v2.0 23
Chapter 4 Editing Data
EditingData
Introduction 24MainWindowMenus 25SNP Graph Toolbar 29Data Table Toolbar 30Context Menus 31

EditingData
24 Document # 11319113 v01
Introduction
You can edit the data in the tables and graphs with the following tools:
Tools Description
Main Window Menus The main window contains the following menus:• File• Edit• Analysis• Tools•Window•Help
SNP Graph Toolbar Edits SNPs in the SNP, SNP Alt, and Sample graphs.
Data Table Toolbar Selects, copies, filters, and sorts data in tables.
Context Menus Right-click in graphs and tables to select additional functions.

Main
Wind
owMenus
GenomeStudioGenotypingModule v2.0 25
MainWindowMenus
File Menu
Function Description
New Project Creates a new project.
Open Project Opens a previously saved project.
Save Project Saves all information in this project.
Save Project Copy As Saves a copy of the current project.
Close Project Closes the current project.
Load AdditionalSamples
Opens the GenomeStudio Project Wizard. You can specify asample sheet or directories to load intensity files.
Import ClusterPositions
Imports cluster positions from an *.egt file.
Export ClusterPositions
Exports selected SNPs or all SNPs to an *.egt file.
Export Manifest Exports a manifest (*.csv) file.
Update Project fromLIMS
Updates the project from LIMS.
Import PhenotypeInformation from File
Imports phenotype information for the samples from a file.
Page Setup Sets up page properties.
Print Preview Opens the Print Preview window.
Print Sets up printing options.
Recent Project Selects a recent project to open.
Exit Closes GenomeStudio Genotyping Module GenotypingModule.
Table 11 File Menu Functions
Edit Menu
Function Description
Cut Cuts the selected content.
Copy Copies the selected content.
Table 12 Edit Menu Functions

EditingData
26 Document # 11319113 v01
Function Description
Paste Pastes the selected content.
Select All Selects all data in the table.
ViewMenu
Function Description
Save Current View Saves the current window configuration.
Restore Default View Restores the default window configuration.
Save Custom View Saves a custom window configuration.
Load Custom View Loads a saved window configuration.
Log Shows or hides the Log window.
Project Shows or hides the Project window.
Table 13 View Menu Functions
Analysis Menu
Function Description
Exclude Samples by BestRun
Includes the sample with the highest GC10 or GC50 scorefor each sample ID. Excludes all the other samples.
Cluster All SNPs Clusters all SNPs based on the samples in a project anddetermine the genotype score for each locus. The clusteringfunction overrides cluster files that are clustered at projectcreation.
Update SNP statistics Updates SNP statistics.
Edit Replicates Edits, includes, or excludes replicates for a sample.
Edit Parental Relationships Edits, includes, or excludes P-C and P-P-C relationships fora sample.
UpdateHeritability/ReproducibilityErrors
Updates replicate P-C, and P-P-C heritability information incolumns and reports.
Reports Generates the following reports:• Reproducibility and Heritability Report• Final Report• DNA Report• Locus Summary Report• Locus x DNA Report
Table 14 Analysis Menu Functions

Main
Wind
owMenus
GenomeStudioGenotypingModule v2.0 27
Function Description
View Controls Dashboard Allows you to view intensity data associated with variouscontrol probes.
Paired Sample Editor Edits the list of paired samples.
Calculate Paired SampleLOH/CN
Calculates LOH and copy number-related scores for pairedsamples.
Show Genome Viewer Shows the Illumina Genome Viewer (IGV).
Import Allele Calls Imports allele calls.
Export Allele Calls Exports allele calls.
Remove Imported AlleleCalls
Removes imported allele calls from the project.
Create Plug-in Column Selects an algorithm-based column plug-in. Use the columnplug-in to create a subcolumn.
ToolsMenu
Function Description
Options • Project—Changes the project settings.• GenomeStudio—Modifies settings and attributes.•Module—Modifies module properties for either Genotypingor Polyploid Genotyping.
New Data Track Table Adds a user-defined name for the new data track table.
Show Genome Viewer Shows data in the Illumina Genome View (IGV).
Table 15 Tools Menu Functions
WindowMenuClick the checkbox to show or to hide the following windows:} SNP Graph} Heat Map} SNP Graph Alt} Samples Table} Full Data Table} SNP Table} Paired Sample Table} Errors Table} Sample Graph
EditingData
28 Document # 11319113 v01
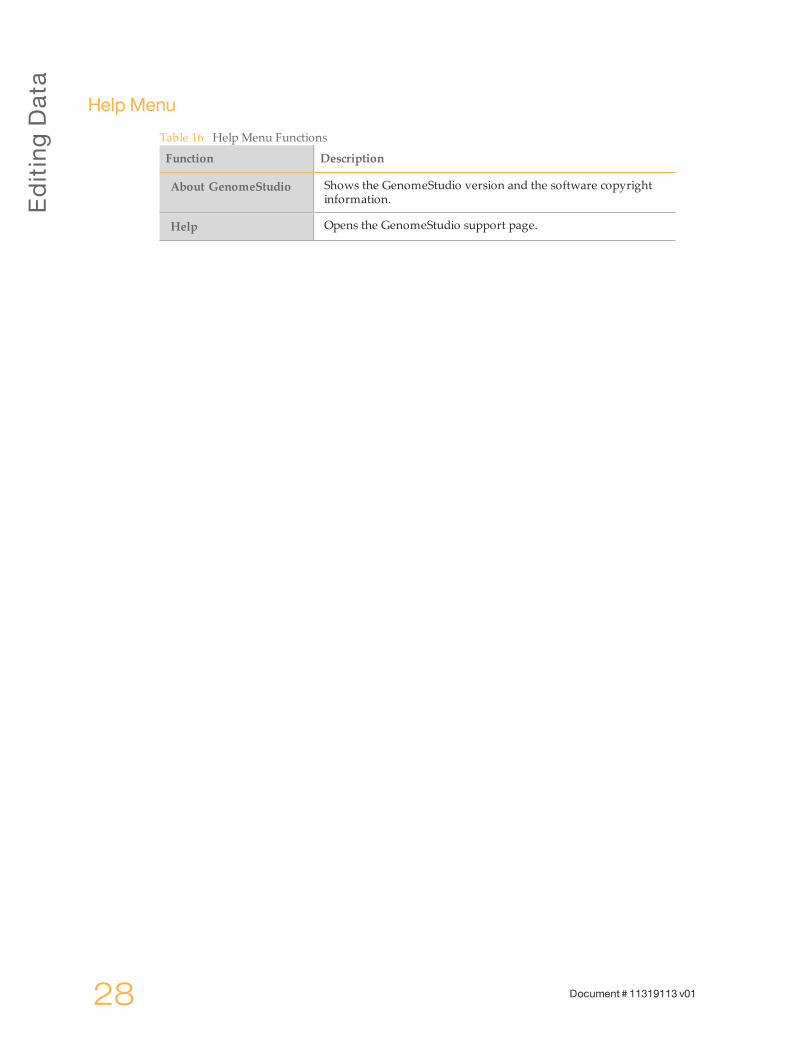
Help Menu
Function Description
About GenomeStudio Shows the GenomeStudio version and the software copyrightinformation.
Help Opens the GenomeStudio support page.
Table 16 Help Menu Functions

SNPGrap
hToolbar
GenomeStudioGenotypingModule v2.0 29
SNPGraphToolbar
Use the buttons in the graph toolbar to change the way your data appears in the graphs.These tools do not modify the data in your project.
Icon Tool Name DescriptionPolar Coordinates Displays the plot in polar coordinates.
X-axis represents normalized theta.Y-axis represents the distance of the point to the origin.
Cartesian Coordinates Displays the plot in Cartesian coordinates.X-axis represents the intensity of the A allele.Y-axis represents the intensity of the B allele.
Plot Normalization Values Views samples in raw format. This option togglesbetween raw and normalized values.
Make Dots Larger Enlarges the dot size.
Make Dots Smaller Reduces the dot size.
Copy Plot to Clipboard Copies the plot to the clipboard.
Shade Call Region Applies color to the gene plot calling regions.The size of the shaded area defines the cutoff gene callscore.
Default Mode Draws a rectangle area that includes the samples youwant to analyze.
Pan Mode Drags the graph in the direction you want to analyze.
Lasso Mode Draws a region that includes the samples you want toanalyze.
Zoom Mode Zooms in or out by scrolling your mouse wheel up anddown.
Auto Scale X-Axis Scales SNPs to the X-axis.
Auto Scale Y-Axis Scales SNPs to the Y-axis.

EditingData
30 Document # 11319113 v01
Data Table Toolbar
Use the buttons in the table toolbar to change the appearance of your data in the statisticstables. These tools do not modify the data in your project.
Icon Name DescriptionCalculate Updates all statistics in the table. The button is active
when statistics are out of sync.Select all Highlights all the rows in the data table.
Copy selected rows to theclipboard
Copies selected rows or columns to the clipboard.
Export displayed data to afile
Exports selected rows or columns to a file.
Import columns into thetable
Imports sample or loci data from a tab-delimited file.
Sort column (Ascending) Sorts the data table in ascending order by the selectedcolumn.
Sort column (Descending) Sorts the data table in descending order by the selectedcolumn.
Sort by multiple columns Sorts the data table by more than one column.
Line plot Displays a line plot of the sample or loci statistics.
Scatter plot Displays a scatter plot of the sample or loci statistics.
Histogram plot Displays a histogram of the sample or loci statistics.
Box plot Displays a box plot of the sample or loci statistics.
Frequency plot Displays a frequency plot of the sample or loci statistics.
Pie chart Displays a pie chart of the sample or loci statistics.
Calculate new column Calculates data for a new column.
Column chooser Adds, removes, or moves columns in the data tables.
Filter rows Hides or shows rows of data based on the criteria youspecify.This feature does not remove samples or loci from yourdata set. It is for viewing information in the data tableonly.
Clear filter Removes filter settings.
Lock selected columns Locks the selected column so it cannot scroll with othercolumns.
Unlock selected columns Unlocks the selected column so that it scrolls with othercolumns.

Context
Menus
GenomeStudioGenotypingModule v2.0 31
ContextMenus
Right-click in the graph or table to view the context menus.
Function Description
Define AA clusterusing selected sample
Determines the size and position of the AA genotype cluster.
Define AB clusterusing selected sample
Determines the size and position of the AB genotype cluster.
Define BB cluster usingselected sample
Determines the size and position of the BB genotype cluster.
Cluster this SNP Determines cluster locations and score for each locus.
Cluster this SNPExcluding SelectedSamples
Determines the cluster locations for each locus except theexcluded locations.
Configure Mark Marks selected samples in a color you choose.
Mark Selected Points -<Add New>
Creates a new mark.
Clear Marks - <All> Clears all marks.
Exclude SelectedSamples
Excludes selected samples from the genoplot.
Include SelectedSamples
Includes selected samples in the genoplot.
Show Legend Displays the genoplot marks legend.
Show ExcludedSamples
Shows excluded samples.
Auto Scale Axes Scales the axes.
Show Only Selected Shows the selected samples.
Copy Image to File as Copies an image to 1 of the following files:• bitmap•GPEG• PNG•GIFF• TIFF
Table 17 Graph Window Context Menu

EditingData
32 Document # 11319113 v01
Function Description
Show Only SelectedRows
Shows your SNPs of interest.
Configure Marks Configures marks.
Mark Selected Rows |<Add New>
Creates a mark and marks selected rows.
Select Marked Rows Selects marked rows.
Clear Marks | <All> Clears all marks.
Table 18 Full Data Table Context Menu
Function Description
Cluster Selected SNP Clusters a selected SNP.
Zero Selected SNP Zeroes a selected SNP.
Set GenotypingIntensity Threshold forSelected SNPs
Opens the Set Genotyping Intensity Threshold dialog box. Youcan enter the threshold value.
Set Aux Value Sets the aux value of a SNP.
Update Selected SNPStatistics
Updates selected SNP statistics.
SNP Properties Opens the SNP Properties dialog box. You can manually edit theproperties.
Show Only SelectedRows
Shows only selected rows in the SNP Table.
Configure Marks Configures marks.
Mark Selected Rows |<Add New>
Creates a mark and mark selected rows.
Select Marked Rows Selects marked rows.
Clear Marks | <All> Clears all marks.
Table 19 SNP Table Context Menu
Function Description
Exclude SelectedSample
Excludes the selected sample.
Include SelectedSample
Includes the selected sample.
Table 20 Samples Table Context Menu

Context
Menus
GenomeStudioGenotypingModule v2.0 33
Function Description
Recalculate Statisticsfor Selected Sample
Recalculates statistics for selected samples.
Recalculate Statisticsfor All Samples
Recalculates statistics for all samples.
Estimate Gender forSelected Samples
Estimates gender for the selected samples.
Display Image Displays image when you have the *.idat file, the *.locs file, the*.xml file, and the *.jpg or *.tif image file for the sample orsample section.
Set Aux Value Sets the aux value of a sample.
Sample Properties Changes values for sample data.
Upload SelectedSamples to IlluminaControls Database
Uploads selected samples to the Illumina Controls Database.
Show Only SelectedRows
Shows only selected rows.
Configure Marks Configures marks.
Mark Selected Rows |<Add New>
Creates a mark and mark selected rows.
Select Marked Rows Selects marked rows.
Clear Marks | <All> Clears all marks.
Function Description
Show Only SelectedRows
Configures the Samples table to show only selected rows.
Edit Replicates Edits replicates.
Edit ParentalRelationships
Edits parental relationships.
Configure Marks Allows you to configure marks.
Mark Selected Rows |<Add New>
Configures marks.
Select Marked Rows Selects marked rows.
Clear Marks | <All> Clears all marks.
Table 21 Error Table Context Menu

34 Document # 11319113 v01
Chapter5
GenomeStudioGenotypingModule v2.0 35
Chapter 5 Common Tasks
CommonTasks
Select Samples in the SNP Graph 36Display Marked Samples 37Customize the SNP Table 38View Samples in the Controls Dashboard 39Update SNP Statistics 40Change the No-Call Threshold 41

CommonTasks
36 Document # 11319113 v01
Select Samples in the SNP Graph
For the SNP Graph, selected rows in the Samples Table correspond with the samples in theSNP Graph.
1 In the main window, select the SNP Graph tab.
2 In the Default Mode, click-and-drag on the graph to draw a rectangle.When you release the button, all points in the rectangle are selected.
3 To add additional samples without losing your original selection, press and hold theCtrl key and select additional samples.
4 [Optional] To change to (Pan Mode), position the cursor over an empty region of theplot (not on a cluster), then press and hold the Shift key.
5 [Optional] To change to (Lasso Mode), press and hold the Z key.Selected samples are highlighted in yellow by default.
Figure 1 SNP Graph
Exclude SamplesYou can exclude poor quality samples from clustering.
1 In the main window, right-click in the SNP Graph.
2 Select Exclude Selected Samples.
3 Click Yes.
Plot Excluded SamplesAfter excluding one or more samples from your sample group, you can plot the excludedsamples in the genoplot.
1 In the main window, select Tools | Options | Project.
2 In Options, click the Plot excluded samples checkbox.
3 Click OK.

Disp
layMarked
Sam
ples
GenomeStudioGenotypingModule v2.0 37
DisplayMarkedSamples
You can customize the color of the selected samples. Marked samples overwrite the defaultgenotyping colors.
1 In the main window, right-click in the SNP Graph.
2 Select Configure Marks.
3 Click Add to create a mark.
4 Enter a name for your mark.
5 Select a color from the drop-down menu.
6 Click OK.
View Legend in Graph1 In the main window, right-click in the graph.
2 Select Show Legend.
3 Click Yes.

CommonTasks
38 Document # 11319113 v01
Customize theSNPTable
Use the Column Chooser to select the columns you want to display in the SNP table andarrange the columns in any order.
1 In the SNP table, click the Column Chooser tool.
2 Click the columns you want to display, and then click Show.
3 Click the columns you want to hide, and then click Hide.
4 [Optional] Select and drag a column back and forth between the Displayed and HiddenColumns sections to customize your table.
5 [Optional] Select a column and drag the column header up or down in the order thatyou want the columns to appear.
6 Click OK.
View
Sam
ples
inthe
Contro
lsDashb
oard
GenomeStudioGenotypingModule v2.0 39
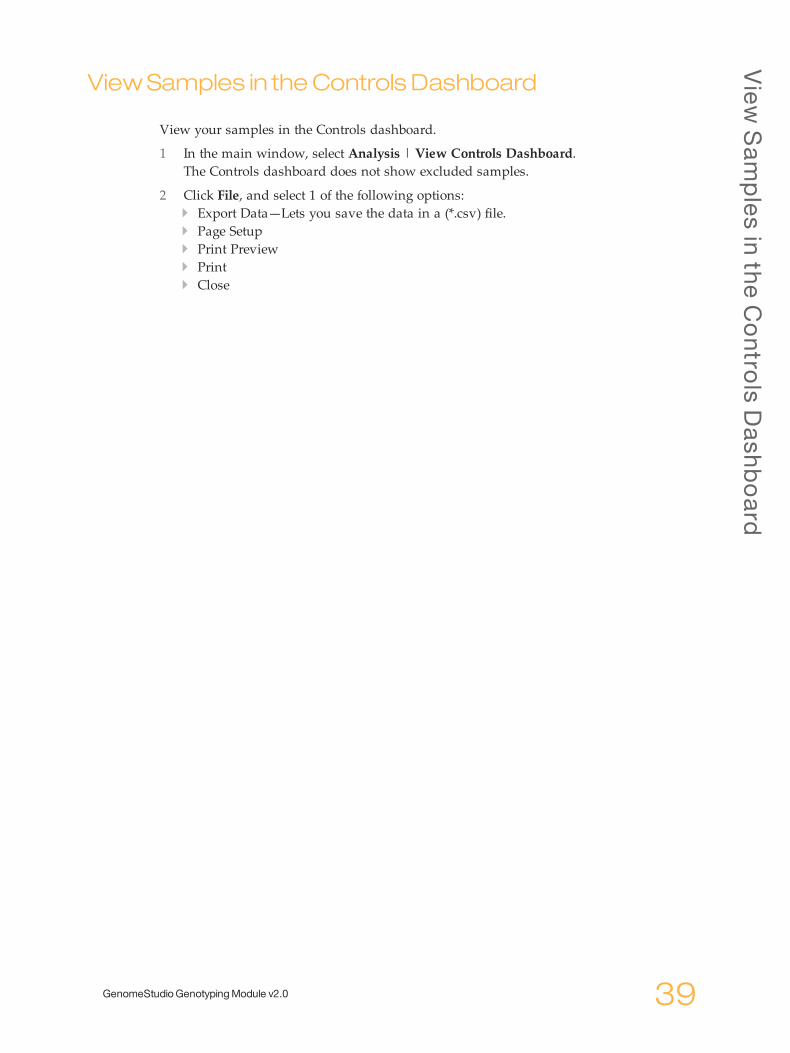
ViewSamples in theControls Dashboard
View your samples in the Controls dashboard.
1 In the main window, select Analysis | View Controls Dashboard.The Controls dashboard does not show excluded samples.
2 Click File, and select 1 of the following options:} Export Data—Lets you save the data in a (*.csv) file.} Page Setup} Print Preview} Print} Close

CommonTasks
40 Document # 11319113 v01
Update SNPStatistics
When you adjust the loci or metrics, the SNP statistics require an update as indicated bythe red highlighted rows in the SNP table.
The time to update increases with the size of the project. For best practices, make severaledits before updating the SNPs statistics.
1 In the main window, select Analysis | Update SNP Statistics.

Chang
ethe
No-CallT
hreshold
GenomeStudioGenotypingModule v2.0 41
Change theNo-Call Threshold
In the SNP graph, samples are colored by their genotype call. Samples that are in black andare located in the lighter shaded regions indicate that they fall below the user-definedthreshold value. As a result, these samples are assigned as no-call.
1 In the main window, select Tools | Options | Project.
2 In the No-call Threshold field, enter your value.We recommend the 0.15 GenCall cutoff score for Infinium products.
3 Click OK.

42 Document # 11319113 v01

Chapter6
GenomeStudioGenotypingModule v2.0 43
Chapter 6 Generating Clusters
GeneratingClusters
Introduction 44Cluster SNPs 45Edit Clusters 46Export a Cluster File 47

GeneratingClusters
44 Document # 11319113 v01
Introduction
Genotype calls for genotyping assays are based on information from a standard or customcluster file that provides statistical data from a sample set. The clustering process cangenerate the most accurate genotype for the data set loaded in the project because thelocations of the heterozygotes and homozygotes for each SNP can vary from SNP to SNP.In the Genotyping Module, we use the Gentrain3 clustering algorithm to minimizeerroneously clustered loci and deliver accurate genotyping data.The software can automatically determine the cluster positions of the genotypes andestimate the missing cluster positions for SNPs that have 1 or 2 clusters that lackrepresentation.We recommend that you have a minimum of 100 or more diverse samples to achieve arepresentation of all clusters. The most desirable number of samples to use for cluster filegeneration varies depending on the minor allele frequency of your SNPs and the studiedpopulation.

Cluster
SNPs
GenomeStudioGenotypingModule v2.0 45
ClusterSNPs
1 In the main window, select Analysis | Cluster All SNPs.
2 Click Yes to update SNP statistics for all SNPs.
Change the Clustering Intensity Threshold
You can change the clustering intensity threshold before reclustering all SNPs.
1 In the main window, select Tools | Options | Project.
2 At the Clustering Intensity Threshold field, enter the value you want to use.
3 Click OK.
Change the Color of Cluster CallsIn the SNP graph, the software assigns a color to samples based on their genotype call. Youcan customize the colors.
1 In the main window, select Tools | Options | Project.
2 In the Colors section, click the drop-down arrow to select the colors you want for thespecific genotype calls.
3 Click OK.

GeneratingClusters
46 Document # 11319113 v01
EditClusters
Redefine the Cluster1 Select the samples in the graph.
2 Right-click to display the context menu.
3 Select Define AB (or AA, or BB) cluster using selected samples.
Exclude Samples From Clustering1 Select samples in the graph.
2 Right-click to display the context menu.
3 Select Cluster this SNP excluding selected samples.
Move the Cluster Location1 In the graph, press and hold the Shift key.
2 Click at the center of the cluster. The move cursor appears.
3 Drag the cluster to a new location.
Change the Cluster Height andWidth1 In the graph, press and hold the Shift key.
2 Click at the edge of an oval. The resizing cursor appears.
3 Drag the edge of the oval to reshape the cluster.

ExportaCluster
File
GenomeStudioGenotypingModule v2.0 47
Export aClusterFile
1 In the main window, select File | Export Cluster Positions.
2 Select 1 of the following options:} For Selected SNPs} For All SNPs
3 Browse to the location where you want to save your cluster file.
4 [Optional] Rename your cluster file.
5 Click Save.

48 Document # 11319113 v01

Chapter7
GenomeStudioGenotypingModule v2.0 49
Chapter 7 Analyzing Data
AnalyzingData
Import Phenotype Information 50Estimate the Gender of Selected Samples 51Edit the Sample Properties 52Analyze Paired Sample Data 53View Concordance Calculations 54Export Allele Calls 55Import Allele Calls 56GenomeStudio Plug-ins 57

Analyzing
Data
50 Document # 11319113 v01
Import Phenotype Information
You can import a phenotype information file (*.csv) into a project. The file must contain anIndex column that corresponds to the Index column in the Samples table.You can import the following phenotypes in a Genotyping Module project:} Gender} Ethnicity} Age} Weight} Blood Pressure Systolic} Blood Pressure Diastolic} Blood Type} Phenotype Pos 1} Phenotype Pos 2} Phenotype Pos 3} Phenotype Neg 1} Phenotype Neg 2} Phenotype Neg 3
1 In the main window, select File | Import Phenotype Information From File.
2 In the File name field, browse to the phenotype information file you want to use.
3 Click Open to import the file.

Estim
atethe
Gend
erofS
electedSam
ples
GenomeStudioGenotypingModule v2.0 51
Estimate theGenderof SelectedSamples
1 In the Samples table, select the samples you want to analyze.
2 Right-click on the selected samples.
3 Select Estimate Gender for Selected Samples.
4 Select 1 of the following options:} Yes—The Gender and Gender Est columns are populated with the estimated genderfor the selected samples.
} No—The Gender Est column is populated with the estimated gender for the selectedsamples.

Analyzing
Data
52 Document # 11319113 v01
Edit the Sample Properties
1 In the Samples table, select the samples you want to analyze.
2 Right-click anywhere on the selected samples.
3 Select Sample Properties.
4 Enter the information in the appropriate column.
5 Click OK.

Analyze
Paired
Sam
pleData
GenomeStudioGenotypingModule v2.0 53
AnalyzePairedSampleData
Paired sample data is useful for analyzing chromosomal aberrations. The Paired Sampletable shows the differences in statistical measurements for a pair of samples, such as asubject sample and a reference sample.Create paired samples by designating 1 of the following:} Subject-and-reference pairs in the sample sheet used to create a project.} Subject-and-reference samples using the paired samples editor.
1 In the main window, select Analysis | Paired Sample Editor.
2 After you designate paired samples, the Paired Sample table shows the paired sampledata.
3 In the Paired Sample table, select the samples you want to analyze.
4 Analyze the paired sample with the following options:
a [Optional] Select Analysis | Calculate Paired Sample LOH/CN Scores.b [Optional] View paired samples in the SNP graph.c [Optional] View paired samples in the Integrative Genomics Viewer (IGV).
Analyzing
Data
54 Document # 11319113 v01
ViewConcordanceCalculations
The Genotyping Module can show the concordance calculations when you import allelecalls for the same sample from another project.
1 In the Samples table or in the Full Data table, click the Column Chooser tool.
2 Select Concordance, and then click Show.
3 Click OK.

ExportAllele
Calls
GenomeStudioGenotypingModule v2.0 55
Export AlleleCalls
You can compare the allele calls in your project to the allele calls in another project. Whenyou export allele calls and import them into another project, the sample names in theproject must be the same. If the sample names do not match, the allele calls cannot becompared.
1 In the main window, select Analysis | Export Allele Calls.
2 Browse to the location where you want to save the allele calls.
3 Click OK.

Analyzing
Data
56 Document # 11319113 v01
Import AlleleCalls
You can import allele calls from another project to analyze in your project.
1 In the main window, select Analysis | Import Allele Calls.
2 Click Browse and navigate to the location of the allele calls you want to import.
3 Select the file you want from the Files Found in the Import Directory area.
4 Click OK.
Geno
meS
tudioPlug
-ins
GenomeStudioGenotypingModule v2.0 57
GenomeStudioPlug-ins
The GenomeStudio Genotyping Module provides plug-ins for copy number (CN) analysis,loss of heterozygosity (LOH) visualization, and other types of analysis. To download theplug-ins, see GenomeStudio Plug-ins. You can install the plug-ins after installing theGenotyping Module.} Column plug-in—Creates subcolumns based on data in tables.} CNV analysis plug-in—Creates a CNV analysis workflow in GenomeStudio,. See CNV
Analysis on page 57.} Report plug-in—Creates custom reports.
Create a Custom SubcolumnWith the Column Plug-in option, you can create custom subcolumns in the Full Data table.Install the column plug-in program to your desktop first, then copy the Dynamic LinkLibraries (DLL) file for the column plug-in to the directory: C:\ProgramFiles\Illumina\GenomeStudio 2.0
1 In the main window, select Analysis | Create Plug-In Column.
2 In the column plugins table, select a row from the list of available column plugins.
3 [Optional] At the New Subcolumn Name field, enter a name for the subcolumn.
4 [Optional] In the Column Plug-In Properties table, right-click in the column to enternew values.
5 Click OK.
CNVAnalysisA CNV Analysis computes the estimated copy number (CNV Value) and the accuracyscore of the estimated copy number (CNV Confidence) for chromosomal regions in eachsample.
Create a CNV AnalysisInstall one or more CNV analysis plug-ins before you can perform the task.
1 In the main window, select Analysis | CNV Analysis.
2 Click the Create New CNV Analysis drop-down menu, and then, select a CNValgorithm.
3 [Optional] Click the Calculate Only Selected Samples checkbox.
4 [Optional] At the CNV Analysis Name field, enter a name.
5 [Optional] Modify parameters.
6 Click Calculate New CNV Analysis.When analysis is complete, the CNV Region Display window opens.
7 Click OK to close the CNV Analysis dialog box.
Edit a CNV AnalysisYou can activate or delete a CNV analysis. Also, you can use the CNV Analysis RegionDisplay and Full Data table to view the analysis.

Analyzing
Data
58 Document # 11319113 v01
1 In the main window, select Analysis | CNV Analysis.
2 Edit the analysis in Current CNV Analyses list:} Activate—Select the CNV analysis, and then, click OK.} Delete—Right-click on the CNV analysis, and then, click Remove Analysis.
View CNV Analysis Region DisplayThe CNV Analysis Region Display is a heat map that shows the copy number values forall samples. The heat map shows samples on the X-axis and chromosomal position on theY-axis.
1 In the main window, select Analysis | Show CNV Region Display.
2 [Optional] Point the mouse over a region to view more information.
3 [Optional] Click the Zoom button to zoom in and out.
View CNV Analysis Data in the Full Data TableYou can view the CNV analysis that contains the estimated copy number and theconfidence score of the estimated copy number in the Full Data table.
1 In the Full Data table, click the Column Chooser button.
2 In the Hidden Subcolumns area, select CNV Value and CNV Confidence, and then,click the Show button.
3 Click OK.

Chapter8
GenomeStudioGenotypingModule v2.0 59
Chapter 8 Generating Reports
GeneratingReports
Introduction 60Generate a Final Report 61DNA Report 62Locus Summary Report 63Locus x DNA Report 65Generate a Reproducibility and Heritability Report 66

GeneratingRep
orts
60 Document # 11319113 v01
Introduction
You can generate the following reports using the Report Wizard:} Final Report} DNA Report} Locus Summary Report} Locus x DNA ReportAlso, you can generate a Reproducibility and Heritability Report.

Generate
aFinalR
eport
GenomeStudioGenotypingModule v2.0 61
Generate a Final Report
The Genotyping Module produces a final report in a text (*.txt) or a comma-separatedvalues (*.csv) file format.
1 In the main window, select Analysis | Reports | Report Wizard.By default, the final report option is selected.
2 Click Next.
3 Select 1 of the following options:} All samples} Selected samples
4 Click Next.
5 Select 1 of the following report formats:} Standard—All data are presented in rows in the final report. You can choose thestatistics to include in the output.
} Matrix—Rows represent SNPs and columns represent samples. You can choose toinclude the GenCall score or the genotypes in the output.
} 3rd Party—You can specify the output style of the final report based on thetarget application for downstream analyses.
6 [Optional] Select Standard.
a In the Available Fields area, select the fields you want to include in the report.Press Ctrl to select multiple fields.
b Click the Show button.c At the Group by field, select whether you want to group by sample or by SNP.
7 [Optional] In the General Options area, select from the following:} Tab—Generate the final report in a text (*.txt) file format.} Comma—Generate the final report in a comma-separated values (*.csv) file format.
8 [Optional] Select Create map files.
9 [Optional] Specify the number of samples per file to include in the report.
10 Click Next.
11 At the Output Path field, browse to the directory you want to save the report or acceptthe default directory.
12 At the Report Name field, enter a report name or accept the default name.
13 Click Finish.The software generates the report and saves it in the specified directory.

GeneratingRep
orts
62 Document # 11319113 v01
DNAReport
The Genotyping Module produces a DNA report in a comma-separated values (*.csv) fileformat.
Statistic Description
Row Row number.
DNA_Name DNA name.
#No_Calls Number of loci with GenCall scores below the call regionthreshold.
#Calls Number of loci with GenCall scores above the call regionthreshold.
Call_Freq Call frequency or call rate, calculated as#Calls/(#No_Calls + #Calls).
A/A_Freq Frequency of homozygous allele A calls.
A/B_Freq Frequency of heterozygote calls.
B/B_Freq Frequency of homozygous allele B calls.
Minor_Freq Frequency of the minor allele.
50%_GC_Score 50th percentile GenCall score for all loci.
10%_GC_Score 10th percentile GenCall score for all loci.
0/1 An algorithm to determine whether to include or excludesamples.0—Exclude sample1—Include sample
Table 22 DNA Report

Locus
Sum
mary
Rep
ort
GenomeStudioGenotypingModule v2.0 63
Locus SummaryReport
The Genotyping Module produces a locus summary report in a comma-separated values(*.csv file) format.
Statistic Description
Row Row number.
Locus_Name Locus name from the manifest file.
IllumiCode_Name Locus ID from the manifest file.
#No_Calls Number of loci with GenCall scores below the call regionthreshold.
#Calls Number of loci with GenCall scores above the call regionthreshold.
Call_Freq Call frequency or call rate calculated as follows:#Calls/(#No_Calls + #Calls)
A/A_Freq Frequency of homozygote allele A calls.
A/B_Freq Frequency of heterozygote calls.
B/B_Freq Frequency of homozygote allele B calls.
Minor_Freq Frequency of the minor allele.
GenTrain_Score Quality score for samples clustered for this locus.
50%_GC_Score 50th percentile GenCall score for all samples.
10%_GC_Score 10th percentile GenCall score for all samples.
Het_Excess_Freq Heterozygote excess frequency, calculated as (Observed -Expected)/Expected for the heterozygote class. If fAB is theheterozygote frequency observed at a locus, and p and q are themajor and minor allele frequencies, then het excess calculation isthe following:
ChiTest_P100 Hardy-Weinberg p-value estimate calculated using genotypefrequency. The value is calculated with 1 degree of freedom andis normalized to 100 individuals.
Cluster_Sep Cluster separation score.
AA_T_Mean Normalized theta angles mean for the AA genotype.
AA_T_Std Normalized theta angles standard deviation for theAA genotype.
AB_T_Mean Normalized theta angles mean for the AB genotype.
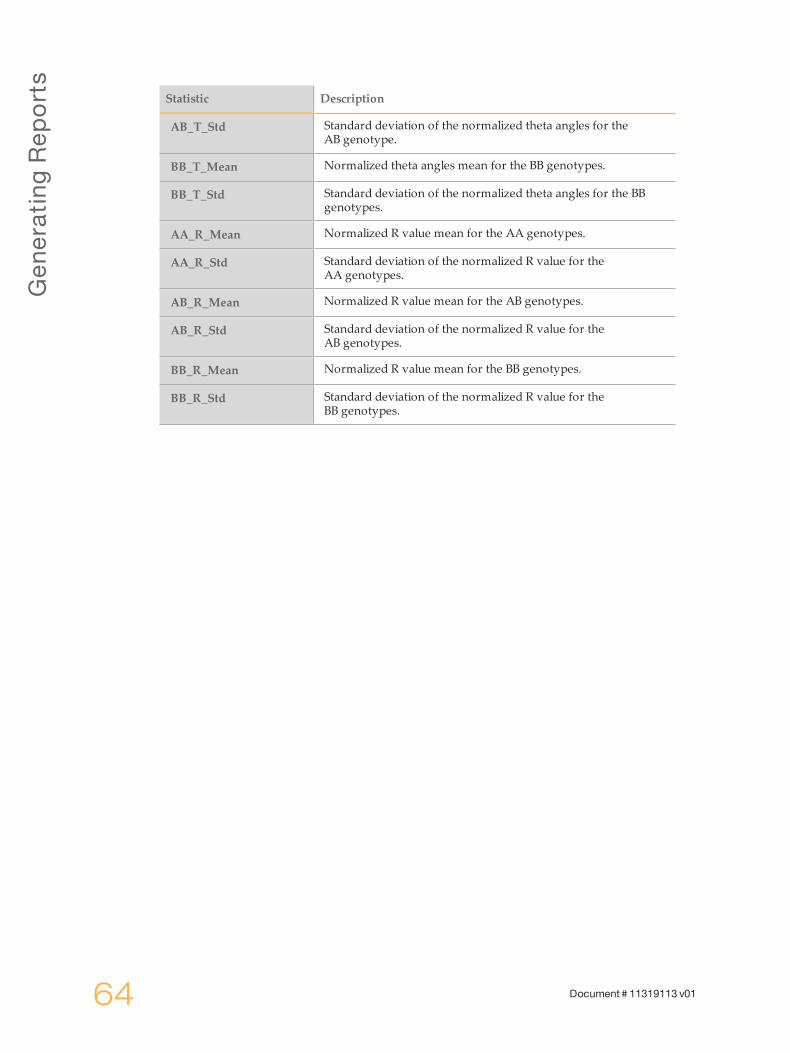
Table 23 Locus Summary Report
GeneratingRep
orts
64 Document # 11319113 v01
Statistic Description
AB_T_Std Standard deviation of the normalized theta angles for theAB genotype.
BB_T_Mean Normalized theta angles mean for the BB genotypes.
BB_T_Std Standard deviation of the normalized theta angles for the BBgenotypes.
AA_R_Mean Normalized R value mean for the AA genotypes.
AA_R_Std Standard deviation of the normalized R value for theAA genotypes.
AB_R_Mean Normalized R value mean for the AB genotypes.
AB_R_Std Standard deviation of the normalized R value for theAB genotypes.
BB_R_Mean Normalized R value mean for the BB genotypes.
BB_R_Std Standard deviation of the normalized R value for theBB genotypes.

Locus
xDNARep
ort
GenomeStudioGenotypingModule v2.0 65
Locus xDNAReport
The Genotyping Module produces a locus x DNA report in a comma-separated values(*.csv) file format.
Statistic Description
instituteLabel User-defined sample name for the DNA sample.
plateWell Concatenation of the sample plate and sample well.
imageDate Imaging date for the sample.
oligoPoolId Manifest name.
bundleId Bundle identifier.
status Field is unused.
recordType Record type shows 2 rows of data for each DNA sample.• calls—A, B, or H• Score_Call—GenCall score for the call.
data Calls or scores for the DNA sample and locus.
Table 24 Locus x DNA Report

GeneratingRep
orts
66 Document # 11319113 v01
Generate aReproducibility andHeritability Report
The Genotyping Module produces an error output report of the samples in a comma-separated values (*.csv file) format.
1 In the main window, select Analysis | Reports | Create Reproducibility andHeritability Report.} Without calculating errors} With calculating errors
2 In the File Name field, enter a file name or accept the default name.
3 Click Save.The software generates the report and saves it in the specified location.
Reproducibility and Heritability Statistics
The Genotyping Module produces a reproducibility and heritability report in a comma-separated values (*.csv file) format. The report contains the following sections:
} Duplicate Reproducibility} Parent-Child Heritability} Parent-Parent-Child Heritability
Statistic Description
Rep1_DNA_Name Sample name designated as replicate #1.
Rep2_DNA_Name Sample name designated as replicate #2.
# Correct Number of loci with consistent replicategenotype comparisons.
# Errors Number of loci with inconsistent replicategenotype comparisons.
Total Number of total genotype comparisons (1 genotypecomparison per locus per replicate pair). The report does notinclude genotypes with intensities that fall below the no-callthreshold.
Repro_Freq Reproducibility frequency. The error rate does not includegenotype calls that fall below the no-call threshold.
Table 25 Duplicate Reproducibility
Statistic Description
Parent_DNA_Name Sample name designated as parent in aP-C relationship.
Child_DNA_Name Sample name designated as child in aP-C relationship.
Table 26 Parent-Child Heritability

Generate
aRep
roducib
ilityand
Heritab
ility
GenomeStudioGenotypingModule v2.0 67
Statistic Description
# Correct Number of loci with consistent parent-child genotypecomparisons.
# Errors Number of loci with inconsistent parent-childgenotype comparisons.
Total Number of total genotype comparisons (1 genotypecomparison per locus per parent-child pair). The report does notinclude genotypes with intensities that fall below the no-callthreshold.
PC_Heritability_Freq Heritability frequency calculated as (# Correct/Total).
Statistic Description
Parent1_DNA_Name Sample name designated as parent #1 in aP-P-C relationship.
Parent2_DNA_Name Sample name designated as parent #2 in aP-P-C relationship.
Child_DNA_Name Sample name designated as child in aP-P-C relationship.
# Correct Number of loci with consistent Parent1-Child and Parent2-Childgenotype comparisons.
# Errors Number of loci with inconsistent Parent1-Child or Parent2-Child genotype comparisons.
Total Total number of loci that contribute to the trio heritabilityanalysis. The report does not include loci for Parent1, Parent2,or Child have genotypes with intensities that fall below the no-call threshold.
P-P-C Heritability Freq Heritability frequency calculated as (# Correct / Total).
Table 27 Parent-Parent-Child Heritability

68 Document # 11319113 v01
TechnicalA
ssistance
GenomeStudioGenotypingModule v2.0 69
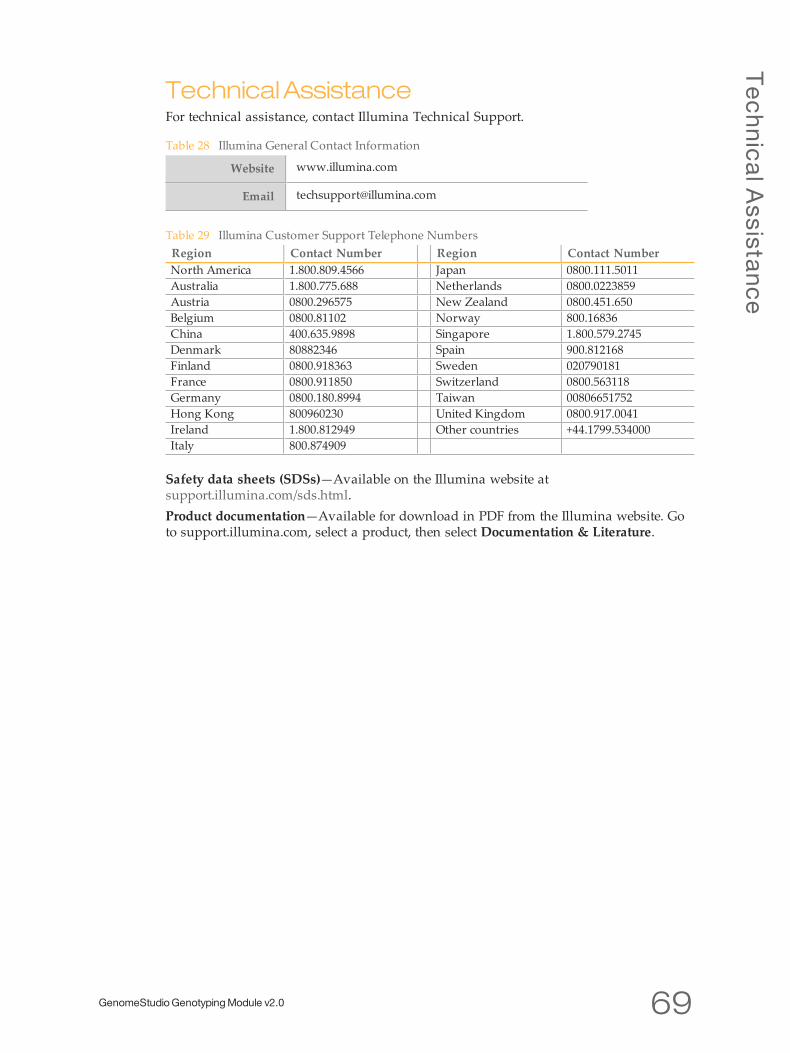
TechnicalAssistanceFor technical assistance, contact Illumina Technical Support.
Website www.illumina.com
Email [email protected]
Table 28 Illumina General Contact Information
Region Contact Number Region Contact NumberNorth America 1.800.809.4566 Japan 0800.111.5011Australia 1.800.775.688 Netherlands 0800.0223859Austria 0800.296575 New Zealand 0800.451.650Belgium 0800.81102 Norway 800.16836China 400.635.9898 Singapore 1.800.579.2745Denmark 80882346 Spain 900.812168Finland 0800.918363 Sweden 020790181France 0800.911850 Switzerland 0800.563118Germany 0800.180.8994 Taiwan 00806651752Hong Kong 800960230 United Kingdom 0800.917.0041Ireland 1.800.812949 Other countries +44.1799.534000Italy 800.874909
Table 29 Illumina Customer Support Telephone Numbers
Safety data sheets (SDSs)—Available on the Illumina website atsupport.illumina.com/sds.html.Product documentation—Available for download in PDF from the Illumina website. Goto support.illumina.com, select a product, then select Documentation & Literature.

IlluminaSan Diego, California 92122 U.S.A.+1.800.809.ILMN (4566)+1.858.202.4566 (outside North America)[email protected]