
Genetic Biomarkers of Barrett’s Esophagus Susceptibility ...
14
REVIEW Genetic Biomarkers of Barrett’s Esophagus Susceptibility and Progression to Dysplasia and Cancer: A Systematic Review and Meta-Analysis John M. Findlay 1,2,3 • Mark R. Middleton 3,4 • Ian Tomlinson 1,3 Received: 13 July 2015 / Accepted: 11 September 2015 / Published online: 7 October 2015 Ó The Author(s) 2015. This article is published with open access at Springerlink.com Abstract Barrett’s esophagus (BE) is a common and important precursor lesion of esophageal adenocarcinoma (EAC). A third of patients with BE are asymptomatic, and our ability to predict the risk of progression of metaplasia to dysplasia and EAC (and therefore guide management) is limited. There is an urgent need for clinically useful biomarkers of susceptibility to both BE and risk of subse- quent progression. This study aims to systematically iden- tify, review, and meta-analyze genetic biomarkers reported to predict both. A systematic review of the PubMed and EMBASE databases was performed in May 2014. Study and evidence quality were appraised using the revised American Society of Clinical Oncology guidelines, and modified Recommendations for Tumor Marker Scores. Meta-analysis was performed for all markers assessed by more than one study. A total of 251 full-text articles were reviewed; 52 were included. A total of 33 germline markers of suscepti- bility were identified (level of evidence II–III); 17 were included. Five somatic markers of progression were iden- tified; meta-analysis demonstrated significant associations for chromosomal instability (level of evidence II). One somatic marker of progression/relapse following photody- namic therapy was identified. However, a number of failings of methodology and reporting were identified. This is the first systematic review and meta-analysis to evaluate genetic biomarkers of BE susceptibility and risk of progression. While a number of limitations of study quality temper the utility of those markers identified, some—in particular, those identified by genome-wide association studies, and chromosomal instability for progression—appear plausible, although robust validation is required. Keywords Barrett’s esophagus Á Esophageal cancer Á Esophageal dysplasia Á Genetic Á Biomarkers Introduction The importance of Barrett’s esophagus (BE) lies in its increasing prevalence and strong predisposition to esopha- geal adenocarcinoma (EAC) [1]. Western prevalence is estimated at 0.5–2.0 % [2] (a third of whom are asymp- tomatic [3]), conferring a 30- to 125-fold increased risk of developing EAC [4]. As EAC becomes more common [5], the benefits of predicting susceptibility to BE and detecting established metaplasia as soon as possible are numerous. Population screening overall is not presently feasible, but identifying both at-risk individuals and established meta- plasia sooner provides windows for risk factor modification, chemoprevention, ablation, resection, and surveillance. However, the natural history of BE is incompletely understood. Overall, the incidence of progression from meta- plasia to high-grade dysplasia (HGD) or EAC is approximately Electronic supplementary material The online version of this article (doi:10.1007/s10620-015-3884-5) contains supplementary material, which is available to authorized users. & John M. Findlay john.fi[email protected] 1 Wellcome Trust Centre for Human Genetics, University of Oxford, Roosevelt Drive, Oxford OX3 7BN, UK 2 Oxford OesophagoGastric Centre, Churchill Hospital, Oxford University Hospitals NHS Foundation trust, Oxford OX3 7LJ, UK 3 NIHR Oxford Biomedical Research Centre, The Joint Research Office, Churchill Hospital, Oxford OX3 7LE, UK 4 Department of Oncology, Old Road Campus Research Building, University of Oxford, Roosevelt Drive, Oxford OX3 7DQ, UK 123 Dig Dis Sci (2016) 61:25–38 DOI 10.1007/s10620-015-3884-5
Transcript of Genetic Biomarkers of Barrett’s Esophagus Susceptibility ...
REVIEW
Genetic Biomarkers of Barrett’s Esophagus Susceptibilityand Progression to Dysplasia and Cancer: A Systematic Reviewand Meta-Analysis
John M. Findlay1,2,3• Mark R. Middleton3,4
• Ian Tomlinson1,3
Received: 13 July 2015 / Accepted: 11 September 2015 / Published online: 7 October 2015
� The Author(s) 2015. This article is published with open access at Springerlink.com
Abstract Barrett’s esophagus (BE) is a common and
important precursor lesion of esophageal adenocarcinoma
(EAC). A third of patients with BE are asymptomatic, and
our ability to predict the risk of progression of metaplasia to
dysplasia and EAC (and therefore guide management) is
limited. There is an urgent need for clinically useful
biomarkers of susceptibility to both BE and risk of subse-
quent progression. This study aims to systematically iden-
tify, review, and meta-analyze genetic biomarkers reported
to predict both. A systematic review of the PubMed and
EMBASE databases was performed in May 2014. Study and
evidence quality were appraised using the revised American
Society of Clinical Oncology guidelines, and modified
Recommendations for Tumor Marker Scores. Meta-analysis
was performed for all markers assessed by more than one
study. A total of 251 full-text articles were reviewed; 52
were included. A total of 33 germline markers of suscepti-
bility were identified (level of evidence II–III); 17 were
included. Five somatic markers of progression were iden-
tified; meta-analysis demonstrated significant associations
for chromosomal instability (level of evidence II). One
somatic marker of progression/relapse following photody-
namic therapy was identified. However, a number of failings
of methodology and reporting were identified. This is the
first systematic review and meta-analysis to evaluate genetic
biomarkers of BE susceptibility and risk of progression.
While a number of limitations of study quality temper the
utility of those markers identified, some—in particular,
those identified by genome-wide association studies, and
chromosomal instability for progression—appear plausible,
although robust validation is required.
Keywords Barrett’s esophagus � Esophageal cancer �Esophageal dysplasia � Genetic � Biomarkers
Introduction
The importance of Barrett’s esophagus (BE) lies in its
increasing prevalence and strong predisposition to esopha-
geal adenocarcinoma (EAC) [1]. Western prevalence is
estimated at 0.5–2.0 % [2] (a third of whom are asymp-
tomatic [3]), conferring a 30- to 125-fold increased risk of
developing EAC [4]. As EAC becomes more common [5],
the benefits of predicting susceptibility to BE and detecting
established metaplasia as soon as possible are numerous.
Population screening overall is not presently feasible, but
identifying both at-risk individuals and established meta-
plasia sooner provides windows for risk factor modification,
chemoprevention, ablation, resection, and surveillance.
However, the natural history of BE is incompletely
understood. Overall, the incidence of progression from meta-
plasia to high-grade dysplasia (HGD) or EAC is approximately
Electronic supplementary material The online version of thisarticle (doi:10.1007/s10620-015-3884-5) contains supplementarymaterial, which is available to authorized users.
& John M. Findlay
1 Wellcome Trust Centre for Human Genetics, University of
Oxford, Roosevelt Drive, Oxford OX3 7BN, UK
2 Oxford OesophagoGastric Centre, Churchill Hospital, Oxford
University Hospitals NHS Foundation trust,
Oxford OX3 7LJ, UK
3 NIHR Oxford Biomedical Research Centre, The Joint
Research Office, Churchill Hospital, Oxford OX3 7LE, UK
4 Department of Oncology, Old Road Campus Research
Building, University of Oxford,
Roosevelt Drive, Oxford OX3 7DQ, UK
123
Dig Dis Sci (2016) 61:25–38
DOI 10.1007/s10620-015-3884-5

0.26–0.63 % per year [6], and that to EAC alone 0.12 % [7].
However, only a minority of patients progress to low-grade
dysplasia (LGD), and of those that do similarly only a minority
ultimately progress to HGD or EAC [8]. These progressive
grades of dysplasia can help identify patients at particular risk
(in particular, those with HGD in whom the risk is consider-
able) [9], but are insufficient in isolation.
There is therefore an immediate clinical need for
biomarkers to predict both susceptibility to BE and progres-
sion. A major subtype is genetic variants, both germline and
somatic. The potential of the latter, in particular, has been
highlighted by a number of recent next-generation sequenc-
ing (NGS) studies of both EAC and BE, which have identified
a number of candidate genes for further study [10]. However,
no systematic reviews have been performed. The aims of this
study were firstly to identify and evaluate all genetic markers
tested in association with BE susceptibility and progression.
Secondly, we aimed to identify markers with statistically
significant associations and perform meta-analysis for those
assessed by more than one study.
Methods
Inclusion Criteria
Studies testing associations between DNA markers
[germline single nucleotide polymorphisms [SNP], somatic
single nucleotide variants, insertions/deletions, copy num-
ber variants (CNV), loss of heterozygosity (LOH),
microsatellite instability (MSI) or chromosomal instability
(CIN)] and diagnosis/progression of BE were eligible;
diagnosis was defined as endoscopic and histopathological
evidence with or without intestinal metaplasia (IM) [13]
and progression as histopathological progression from
metaplasia to LGD/HGD/EAC or LGD to HGD/EAC, or
HGD to EAC during surveillance endoscopies.
Exclusion Criteria
Studies comparing grades of metaplasia/dysplasia/malig-
nancy within samples at one time point were excluded, as
were studies comparing grades between patients. Studies
using cell line, epigenetic, or expression data were exclu-
ded unless patient or DNA-specific data were available.
Literature Search
A search was performed in May 2014 of the PubMed and
EMBASE databases, using the MOOSE and PRISMA
guidelines [14] and the following term: [((((esophageal OR
esophagus OR gastro esophageal)) AND (Barrett’s OR
metaplasia OR columnar)) AND (genomic OR genetic OR
genome OR pharmacogenetic OR pharmacogenomic OR
amplification OR copy OR mutation OR polymorphism OR
polymorphic OR variant OR deletion OR insertion OR locus
OR loci OR allele OR ploidy OR instability OR biomarker))].
The bibliographies of retrieved articles were also searched.
Study Data
The following data were extracted: study methodology;
variants and genes assessed; endpoints; population; and
effect size [odds ratio (OR) or hazard ratio (HR)] and
variance [standard error or confidence interval (CI)]. For
studies not presenting OR, these were calculated using
provided allele/variant frequencies. If reference SNP
identification numbers were not provided (http://www.ncbi.
nlm.nih.gov/dbSNP), these were mapped by searching
cited methodology and performing in vitro polymerase
chain reaction (http://genome.ucsc.edu), with nucleotide
flank BLAST� (http://blast.ncbi.nlm.nih.gov).
Evidence Quality
Overall study and evidence quality were evaluated using the
revised American Society of Clinical Oncology (ASCO)
level of evidence (LOE) scale for biomarker research [15].
This stratifies study quality on the basis of trial design,
patients and data, specimen collection, processing and
archival, and statistical design and analysis from A to D
(supplementary table 1), and uses this in conjunction with
subsequent validation to stratify overall LOE for a marker
from I to V (supplementary table 2). Methodological quality
was appraised using the recommendations for tumor marker
score (REMARK) guidelines modified by the authors, which
scored study methodology in detail to generate a score from 0
to 17 (GWAS) and 0 to 18 (candidate studies; supplementary
table 3). Reported associations were appraised for appropri-
ate correction for multiple comparisons (Bonferroni method,
false discovery rate, or multivariate analysis of all markers).
If not undertaken, this was performed via post hoc Bonferroni
correction. Significance was taken at p\ 5910-8 for gen-
ome-wide association studies (GWAS). Genomic quality
criteria included reporting of genotyping call rate or provid-
ing data to allow its calculation, and assessment of Hardy–
Weinberg equilibrium for germline variants.
Meta-Analysis
Meta-analysis was undertaken for markers assessed by
more than one study, irrespective of correction for multiple
comparisons (other than variants assessed by GWAS and
non-GWAS due to major methodological differences)
using RevMan v5.2 (Copenhagen: The Nordic Cochrane
Centre, The Cochrane Collaboration). Sensitivity analyses
26 Dig Dis Sci (2016) 61:25–38
123

were performed on the basis of IM-only versus non-IM
studies. In the case of studies reporting updated results
using cohorts previously reported (i.e., population overlap),
the most recent study was used.
Heterogeneity and Bias
Heterogeneity was estimated using I2 and Chi-square
statistics. For moderate heterogeneity (I2 C 50 %), a ran-
dom-effects model was used. Funnel plots were reviewed
for analyses of C5 studies [16]. Statistical assessment of
these was not performed due to the low number of studies
per variant. Publication bias was corrected using the ‘‘trim
and fill’’ method [17].
Results
Literature Search
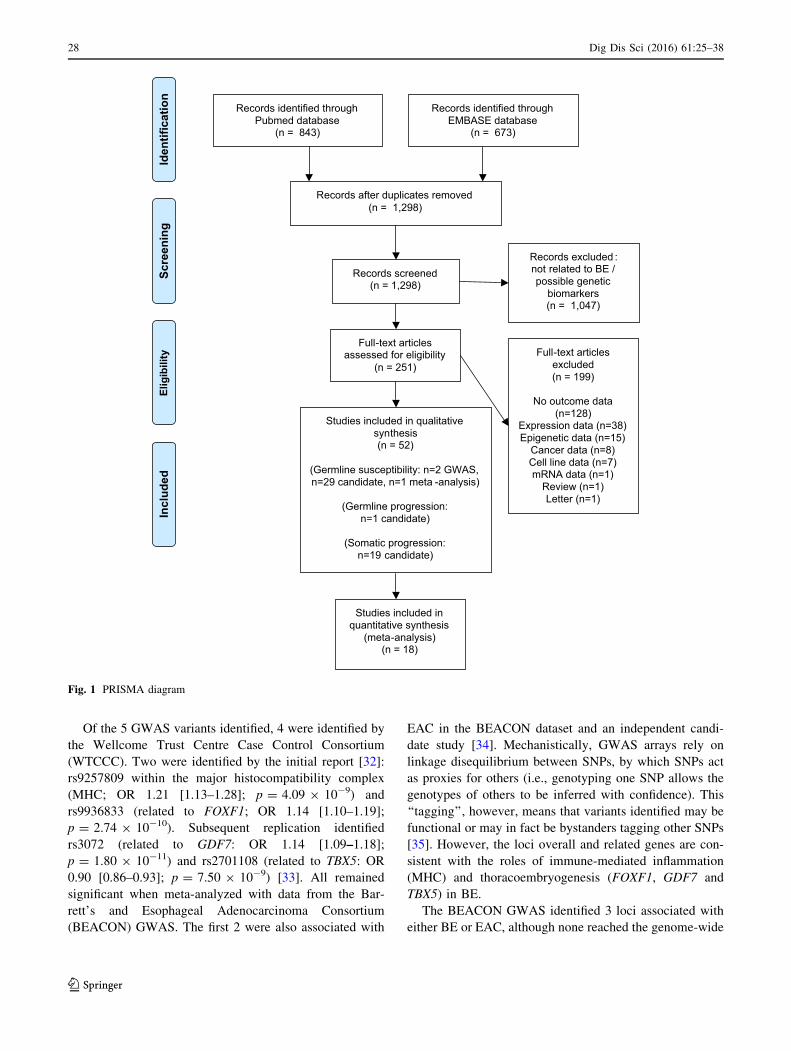
A total of 1516 articles were identified, of which 218 were
duplicates. Therefore, 1298 articles were appraised on the
basis of their title and abstract. Then, 251 full-text articles
were retrieved, of which 52 met the inclusion criteria
(Fig. 1).
Studies Assessing Germline Markers
of Susceptibility
A total of 32 studies were included: 2 GWAS, 29 candi-
date studies, and 1 meta-analysis of 4 candidate studies
(supplementary tables 4 and 5). All original studies were
LOE C (indicating prospective observational registries,
without standardized treatment and follow-up), published
between 1999 and 2014. Median modified REMARK
scores were 15/17 (GWAS) and 13/18 (candidate studies;
range 7–16; supplementary table 6). A number of frequent
methodological issues were identified. The most common
of these included failure to blind investigators (n= 18;
58.1 %), perform/report quality control procedures (19;
61.3 %), and match cases and controls (23; 74.2 %).
Similarly, a number of recurrent reporting issues were
identified. The most common of these were comparing
markers with established risk factors (30; 96.8 %),
adjusting for multiple comparisons (22; 71.0 %) and
confounding factors (20; 64.5 %), reporting power calcu-
lations (15; 48.4 %) and reporting multivariate effect sizes
(30; 96.8 %). Of the 27 studies assessing multiple variants,
24 did not perform multivariate analysis (88.9 %). For
GWAS, there were a mean 5507 cases and 14,159 con-
trols. For candidate studies, 134 cases and 196 controls.
There were a number of cases of study population overlap,
with 13 studies reported on subjects drawn from one of
three populations.
Variants Associated with BE Susceptibility
A total of 187 candidate variants/haplotypes were tested.
Twenty-eight significant associations were reported, of
which 16 were excluded (Table 2). Twelve were therefore
associated with BE (Table 1). However, for 2 of these
(rs6785049 and rs9344) precise p values were not provided
to allow for Bonferroni correction.
The rs1695 (GSTP1) was assessed by 4 studies, which
underwent meta-analysis by Bull et al. [18]. This calculated
an OR of 1.50 (95 % CI 1.16–1.95 p = not presented; LOE
II). While derived from a large total cohort (434 cases and
738 controls), none of the four studies adjusted for risk
factors; indeed the sole study finding a significant associ-
ation had only 22 cases [19]. The GSTM1 null genotype
was also assessed by 4 studies and underwent updated
meta-analysis in this study. Overall, no association was
demonstrated. On sensitivity analysis, a significant nega-
tive association was apparent for the 2 studies not requiring
IM [17, 20], although the relevance of this is unclear.
Meta-analysis was performed for 5 other variants, none of
which demonstrated associations (Table 3).
Of the 12 significant candidate associations reported,
only rs1695 (GSTP1) and rs25487 (XRCC1) were assessed
by more than one study. This notwithstanding, 5 appear
relatively robust on the basis of adjustment for clinical
covariates. These include 3 growth factor variants:
rs444903 (EGFR [20]; notably associated with reflux
esophagitis and EAC), rs6214 (IGF1 [21]), and rs2229765
(IGF1R) [22]. Two interleukin variants also appear plau-
sible: rs3212227 (IL12B) and rs917997 (IL18RAP) [23–
25], with the former demonstrated to be independent of all
other tested genotypes [26]. A number of other associations
were reported in the IL1 [27, 28], IL10 [28], IL18 [29], and
IL23 [30] clusters. Of these, however, only wild-type
rs917997 (IL18RAP) persisted following correction for
multiple comparisons [29].
The remaining 5 candidate variants included associa-
tions with 3 caudal homeobox 1 (CDX1) variants:
rs3776082, rs2237091, and rs717767. The authors
demonstrated these variants to be significantly associated
with established risk factors for BE: age, gender, and the
presence of hiatus hernia. However, multivariate analysis
was not performed to demonstrate whether the association
of these variants with BE was independent of these. Of the
remaining 2, an association was demonstrated for the
rs6785049 (NR1I2) variant; however, similarly this was not
adjusted for risk factors. This was performed for the rs9344
(CCND1 [31]) variant, although the p value was not
published.
Dig Dis Sci (2016) 61:25–38 27
123
Of the 5 GWAS variants identified, 4 were identified by
the Wellcome Trust Centre Case Control Consortium
(WTCCC). Two were identified by the initial report [32]:
rs9257809 within the major histocompatibility complex
(MHC; OR 1.21 [1.13–1.28]; p = 4.09 9 10-9) and
rs9936833 (related to FOXF1; OR 1.14 [1.10–1.19];
p = 2.74 9 10-10). Subsequent replication identified
rs3072 (related to GDF7: OR 1.14 [1.09–1.18];
p = 1.80 9 10-11) and rs2701108 (related to TBX5: OR
0.90 [0.86–0.93]; p = 7.50 9 10-9) [33]. All remained
significant when meta-analyzed with data from the Bar-
rett’s and Esophageal Adenocarcinoma Consortium
(BEACON) GWAS. The first 2 were also associated with
EAC in the BEACON dataset and an independent candi-
date study [34]. Mechanistically, GWAS arrays rely on
linkage disequilibrium between SNPs, by which SNPs act
as proxies for others (i.e., genotyping one SNP allows the
genotypes of others to be inferred with confidence). This
‘‘tagging’’, however, means that variants identified may be
functional or may in fact be bystanders tagging other SNPs
[35]. However, the loci overall and related genes are con-
sistent with the roles of immune-mediated inflammation
(MHC) and thoracoembryogenesis (FOXF1, GDF7 and
TBX5) in BE.
The BEACON GWAS identified 3 loci associated with
either BE or EAC, although none reached the genome-wide
Records identified through Pubmed database
(n = 843)
Screen
ing
Includ
edEligibility
Iden
tification
Records identified through EMBASE database
(n = 673)
Records after duplicates removed(n = 1,298)
Records screened(n = 1,298)
Records excluded : not related to BE / possible genetic
biomarkers(n = 1,047)
Full-text articles assessed for eligibility
(n = 251)Full-text articles
excluded(n = 199)
No outcome data (n=128)
Expression data (n=38)Epigenetic data (n=15)
Cancer data (n=8)Cell line data (n=7)mRNA data (n=1)
Review (n=1)Letter (n=1)
Studies included in qualitative synthesis(n = 52)
(Germline susceptibility: n=2 GWAS, n=29 candidate, n=1 meta -analysis)
(Germline progression: n=1 candidate)
(Somatic progression: n=19 candidate)
Studies included in quantitative synthesis
(meta-analysis)(n = 18)
Fig. 1 PRISMA diagram
28 Dig Dis Sci (2016) 61:25–38
123

Ta
ble
1R
epo
rted
ger
mli
ne
mar
ker
so
fB
arre
tt’s
eso
ph
agu
ssu
scep
tib
ilit
y
Mar
ker
Ind
ivid
ual
stu
die
sA
sso
ciat
ion
(met
a-an
aly
sis/
ind
ivid
ual
stu
dy
)
LO
EV
aria
nt
Gen
eA
sso
ciat
ion
EV
LO
EE
thn
icit
yM
eth
od
olo
gy
Var
ian
tW
ild
-ty
pe
No
ne
Ph
eno
typ
ean
dO
R
(95
%C
I)
I2C
hi
pn
III
rs9257809
MH
C
regio
n
Su
etal
.[3
2],
Pal
les
etal
.
[33
]
AC
Cau
casi
anM
ult
ista
ge
GW
AS
Pro
/ret
ro
arch
ived
BE
A1.2
1(1
.13–1.2
8)
NA
NA
4.0
99
10-
91
rs9936833
FOXF1
CB
EA
1.1
4(1
.10–1.1
9)
2.7
49
10-
10
rs3072
GDF7
AB
EA
1.1
4(1
.09–1.1
8)
1.7
59
10-
11
rs2701108
TBX5
AB
EA
0.9
0(0
.86–0.9
3)
7.4
89
10-
9
rs2687201
FOXP1
TB
EA
1.1
6(1
.10–1.2
3)
4.6
19
10-
8
III
rs3776082
CDX1
Ren
etal
.[4
3]
AA
CC
auca
sian
Can
did
ate
Pro
spec
tive
BE
-v-R
E4.0
2(1
.80–9.0
0)
NA
NA
\0.0
05
1
III
rs2237091
CDX1
Ren
etal
.[4
3]
AA
CC
auca
sian
Can
did
ate
Pro
spec
tive
BE
-v-R
E0.2
8(0
.13–0.5
9)
NA
NA
\0.0
05
1
III
rs717746
CDX1
Ren
etal
.[4
3]
GG
CC
auca
sian
Can
did
ate
Pro
spec
tive
BE
-v-R
E3.6
5(1
.73–7.6
9N
AN
A\
0.0
05
1
III
rs4444903
EGFR
Men
ke
etal
.[2
0]
GG
CC
auca
sian
*C
andid
ate
Ret
roar
chiv
ed
BE
A3.0
0(1
.50–6.2
0)
NA
NA
0.0
02
1
III
rs917997
IL18RAP
Bab
aret
al.
[29
]
CC
CC
auca
sian
**
Can
did
ate
Ret
roar
chiv
ed
BE
A0.5
9(0
.43–0.8
0)
NA
NA
6.0
09
10-
41
III
rs6785049
PXR
van
de
Win
kel
etal
.[4
4]
GC
Cau
casi
an*
Can
did
ate
Ret
roar
chiv
ed
BE
1.3
6(1
.03–1.7
9)
NA
NA
\0.0
5(N
S)
1
III
rs6214
IGF1
McE
lholm
[21
]
AA
CC
auca
sian
**
Can
did
ate
Ret
roar
chiv
ed
BE
A0.4
3(0
.24–0.7
5)
NA
NA
3.0
09
10-
31
III
rs2229765?
BM
I[
30
IGF1R
Mac
Donal
det
al.
[22
]A
CC
auca
sian
Can
did
ate
Ret
roar
chiv
ed
BE
A3.1
1(1
.12–8.6
3)
NA
NA
\0.0
5(N
S)
1
III
rs3212227
IL12B
Moons
etal
.[2
6]
CC
Cau
casi
an*
Can
did
ate
Ret
roar
chiv
ed
BE
A1.8
2(1
.17–2.6
9)
NA
NA
7.0
09
10-
31
Dig Dis Sci (2016) 61:25–38 29
123

threshold for BE alone. However, on subsequent meta-
analysis of both GWAS, rs2687201 (FOXP1, similarly
involved in developmental regulation) was significantly
associated with BE alone, in addition to a further variant
associated with either BE/EAC [33].
Studies Assessing Germline Variants Associated
with Progression
One study was identified (supplementary table 7). LOE
was C; modified REMARK score was 13.5/19. This
assessed 4 variants in the IGF axis; none were associated
with progression.
Studies Assessing Somatic Variants Associated
with Progression
Sixteen studies were identified, published between 1989 and
2012 (supplementary table 8). LOE was C for 12 and D for 4.
Mean modified REMARK score was 13.2 (range 10.5–18.5/
19; supplementary table 9). Five classified progression as
HGD/EAC, 10 as EAC, and 1 as EAC/CIN. Again, a number
of recurrent methodological issues were identified. These
included failure to: blind investigators (12; 75.0 %), perform
appropriate quality control/reproducibility (9; 56.3 %),
match controls (14; 87.5 %), and appropriate power calcu-
lations (14; 87.5 %). Recurrent reporting issues included
failure to: report univariate association effects (9; 60.0 %),
adjust for risk factors (particularly the presence of dysplasia
at baseline; 14; 87.5 %), and fully report coefficients of
multivariate models (13; 81.3 %).
Variants Associated with Progression
Of 7 variants assessed, 5 associations were identified: CIN,
CNV ([70 Mbp), TP53 LOH, p16 LOH, and mutant TP53
(Table 4). Meta-analysis was possible for CIN, which was
assessed by 11 studies. These defined CIN variably as
aneuploidy (4), tetraploidy (1), and aneuploidy/tetraploidy
(6). Six of these studies were derived from independent
sample archives. However, this was not clear for 4. All
studies reported associations of CIN with progression.
However, only two adjusted for confounding variables,
including the presence of dysplasia [36, 37]. Another two,
while not adjusting for dysplasia, did adjust for length of
Barrett’s segment [38, 39], with CIN remaining significant.
Meta-analysis was performed for both OR and HR of
progression to HGD/EAC. Significant associations were
demonstrated for both (Table 4; Fig. 2). All studies inclu-
ded patients with IM only. Meta-analyzed OR was 5.98
(2.10–17.1; p = 8.00 9 10-4; n = 5 studies; following
exclusion of overlapping studies and correction for publi-
cation bias). However, only one of these studies adjustedTa
ble
1co
nti
nu
ed
Mar
ker
Ind
ivid
ual
stu
die
sA
sso
ciat
ion
(met
a-an
aly
sis/
ind
ivid
ual
stu
dy
)
LO
EV
aria
nt
Gen
eA
sso
ciat
ion
EV
LO
EE
thn
icit
yM
eth
od
olo
gy
Var
ian
tW
ild
-ty
pe
No
ne
Ph
eno
typ
ean
dO
R(9
5%
CI)
I2C
hi
pn
IIrs
1695
GSTP
Bull
etal
.[1
8]
GC
Cau
casi
anM
eta-
anal
ysi
sB
E1.5
0(1
.16–1.9
5)
NA
NA
\0.0
14
Kal
aet
al.
[19
]G
Cau
casi
anC
andid
ate
(pro
)
Murp
hy
etal
.[4
5]
GC
auca
sian
Can
did
ate
(ret
ro)
Cas
son
etal
.[4
6]
GN
PC
andid
ate
(pro
)
van
Lie
shout
etal
.[4
7]
GC
auca
sian
Can
did
ate
(pro
)
III
rs9344
CCND1
Cas
son
etal
.[3
1]
AA
CN
PC
andid
ate
(pro
)B
EA
3.6
9(1
.46–9.2
9)
NA
NA
\0.0
5(N
S)
1
III
rs25487
XRCC1
Cas
son
etal
.[4
8]
Fer
guso
net
al.
[49
]A
AC
NP
Can
did
ate
(pro
)B
EA
0.6
5(0
.25–1.6
8)
71
%3.4
20.3
70
2
AA
CC
auca
sian
Can
did
ate
(ret
ro)
LOE
lev
elo
fev
iden
ce,EV
effe
ctv
aria
nt,NS
no
nsi
gn
ifica
nt,NP
no
tp
rese
nte
d,BE
Bar
rett
’ses
op
hag
us,
Aad
just
edO
R,OR
od
ds
rati
o,CI
con
fid
ence
inte
rval
,pro
pro
spec
tiv
e,retro
retr
osp
ecti
ve,
RE
refl
ux
eso
ph
agit
is,NA
no
tap
pli
cab
le
*,*
*d
eno
teo
ver
lap
pin
gp
op
ula
tio
ns
30 Dig Dis Sci (2016) 61:25–38
123

Ta
ble
2R
epo
rted
ger
mli
ne
mar
ker
so
fB
arre
tt’s
eso
ph
agu
sex
clu
ded
on
the
bas
iso
fm
ult
iple
com
par
iso
ns
Mar
ker
Ind
ivid
ual
stu
die
sA
sso
ciat
ion
(met
a-an
aly
sis/
ind
ivid
ual
stu
dy
)
LO
EV
aria
nt
Gen
eA
sso
ciat
ion
EV
LO
EE
thn
icit
yM
eth
od
olo
gy
Var
ian
tW
ild
-ty
pe
Ph
eno
typ
ean
dO
R
(95
%C
I)
I2C
hi
pn
III
rs3
77
60
83
CDX1
Ren
etal
.[4
3]
AG
CC
auca
sian
Can
did
ate
pro
BE
-v-R
E1.9
1
(1.0
9–3
.33)
NA
NA
0.0
21
III
rs4
76
95
85
CDX2
Ren
etal
.[4
3]
CT
CC
auca
sian
Can
did
ate
pro
BE
-v-R
E2.6
8
(1.2
0–5
.98)
NA
NA
0.0
21
III
rs3
81
28
63
CDX2
Ren
etal
.[4
3]
AG
CC
auca
sian
Can
did
ate
pro
BE
-v-R
E2.5
3
(1.2
4–5
.14)
NA
NA
0.0
11
III
rs1
14
36
34
IL1B
Izak
ov
ico
ka-
Ho
lla
etal
.[2
7]
TC
auca
sian
(Cze
ck)
Can
did
ate
pro
BE
-v-R
E0.5
6
(0.3
3–0
.93)
NA
NA
0.0
16
1
III
VN
TR
po
lym
orp
his
m
IL1RN
Izak
ov
ico
ka-
Ho
lla
etal
.[2
7]
1/2
Cau
casi
an(C
zeck
)C
andid
ate
pro
BE
0.6
2(0
.42–0.9
4)
NA
NA
0.0
15
1
III
rs1
80
05
87
/
rs1
69
44
/
rs1
14
36
34
/
IL1
RN
IL1B/
ILRN
Izak
ov
ico
ka-
Ho
lla
etal
.[2
7]
C/T
/
C/l
on
g
Cau
casi
an(C
zeck
)C
andid
ate
pro
BE
1.9
5(1
.09–1.3
0)
NA
NA
0.0
31
III
rs1
80
05
87
/
rs1
69
44
/r
s11
43
63
4/I
L1
RN
IL1B/
ILRN
Izak
ov
ico
ka-
Ho
lla
etal
.[2
7]
T/C
/
C/l
on
g
Cau
casi
an(C
zeck
)C
andid
ate
pro
BE
2.6
7(1
.15–6.2
4)
NA
NA
0.0
21
III
rs9
09
25
3TNFB
Men
ke
etal
.[5
0]
AA
CC
auca
sian
(Net
her
lan
ds)
Can
did
ate
retr
o
arch
ived
BE
A1
.98
(1.0
3–3
.81)
NA
NA
0.0
41
III
rs2
30
57
64
Myo9b
Men
ke
etal
.[5
1]
GG
CC
auca
sian
(Net
her
lan
ds)
Can
did
ate
retr
o
arch
ived
BE
A2
.96
(1.1
0–7
.99)
NA
NA
0.0
32
1
III
rs1
94
65
18
IL18
Bab
aret
al.
[29]
CC
Cau
casi
an(I
rish
)C
andid
ate
retr
o
arch
ived
BE
A1
.45
(1.0
7–1
.98)
NA
NA
0.0
21
III
rs1
79
97
50
MMP1
Bra
db
ury
etal
.
[52]
GG
Cau
casi
an(U
SA
)C
andid
ate
retr
o
arch
ived
BE
A2
.21
(1.0
8–4
.53)
NA
NA
0.0
31
III
rs1
12
09
02
6IL23R
Gaj
etal
.[3
0]
AC
auca
sian
s(P
oli
sh)
Can
did
ate
pro
BE
3.4
9(1
.37–8.9
0)
NA
NA
0.0
11
1
III
rs1
80
05
66
NQO1
di
Mar
tin
oet
al.
[53]
TN
P(U
K)
Can
did
ate
pro
BE
A-v
-RE
0.2
2
(0.0
7–0
.76)
NA
NA
0.0
16
1
III
B7
HL
AR
ajen
dra
[54]
B7
Asi
an(I
nd
ia)
Can
did
ate
pro
BE
Ex
21
.4(1
.22
–3
72
NA
NA
0.0
36
1
III
rs4
15
95
8/
rs1
69
44
IL1RA/
IL1B
Go
ug
het
al.
[28
]C
C/A
NS
(UK
)C
andid
ate
pro
BE
-v-R
E9
.5(1
.19
–7
5.9
)N
AN
A0
.01
01
III
rs1
80
08
96
IL10
Go
ug
het
al.
[28
]C
CN
S(U
K)
Can
did
ate
pro
BE
-v-R
E1
.84
(1.0
4–3
.28)
NA
NA
0.0
35
1
LOE
lev
elo
fev
iden
ce,EV
effe
ctv
aria
nt,NP
no
tp
rese
nte
d;
BE=
Bar
rett
’ses
op
hag
us;
Aad
just
edO
R,OR
od
ds
rati
o,CI
con
fid
ence
inte
rval
,pro
pro
spec
tiv
e,retro
retr
osp
ecti
ve,
NA
no
t
app
lica
ble
,RE
refl
ux
eso
ph
agit
is,Ex
extr
apo
late
d
Dig Dis Sci (2016) 61:25–38 31
123

for the presence of dysplasia. Meta-analyzed HR was 1.36
(1.26–1.47; n = 2 studies; p\ 1.00 9 10-5; following
exclusion of one overlapping study).Overall LOE for CIN
was II. While more than one study assessed mutant TP53
(n = 3) and LOH TP53 (n = 2), meta-analysis was not
possible for either. Two studies for each were derived from
the same populations, and the third TP53 study used a
different measure of effect size.
Variants Associated with Risk of Progression
Following Photodynamic Therapy
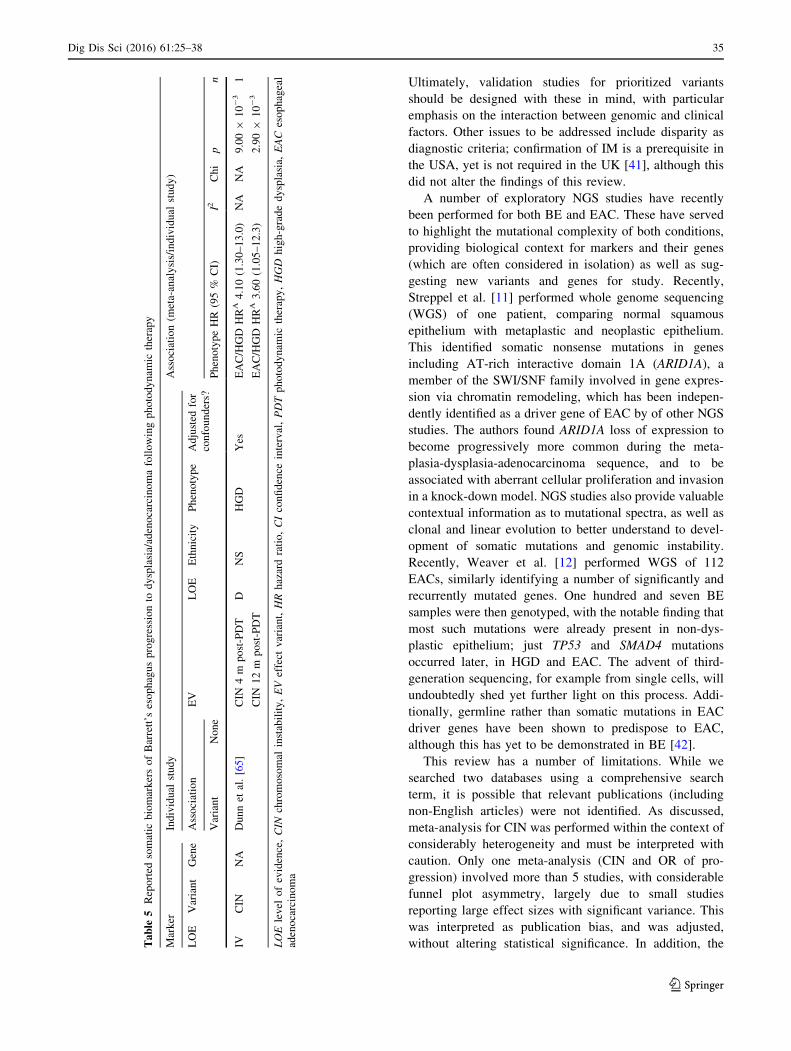
Three studies were identified (supplementary table 10). LOE
was C for 2 and D for 1. Mean modified REMARK score
was 16.2/20 (range 14.5–19; supplementary table 7). For 2
studies, while endoscopic mucosal resection was variably
performed, this was only controlled for in 1 study. A total of
6 variants were assessed; while 5 were assessed by 2 studies,
meta-analysis could not be performed due to population
overlap. CIN at both 4 and 12 months was reported to be
associated with risk of progression (Table 5).
Discussion
We believe this review to be the first to identify, synthe-
size, and evaluate the evidence for genetic markers of BE
susceptibility and risk of progression. Thirty-three sus-
ceptibility markers were identified; however, just 17
remained significant after correcting for multiple compar-
isons. Five (rs9257809, rs9936833, and subsequently
rs3072, rs2701108, and rs2687201) were derived from
GWAS and are therefore most likely to be reproducible. Of
the 6 candidate markers assessed by more than one study,
meta-analysis was supportive for one (rs1695, GSTP1).
Five non-meta-analyzed variants affecting either growth
factors or inflammatory cytokines appear plausible and
therefore represent priorities for validation: rs444903
(EGFR), rs6214 (IGF1), rs2229765 (IGF1R), rs3212227
(IL12B), and rs917997 (IL18RAP).
No germline markers of progression risk were identified.
However, 5 somatic markers were reported, plus another of
progression following photodynamic therapy. Meta-analy-
sis was possible for CIN, demonstrating significant effects
for both HR and OR after correction for publication bias.
However, there was considerable heterogeneity regarding
definition of CIN, duration, and frequency of follow-up,
confounding risk factors (e.g., prevalence of HGD) in
addition to minimum follow-up periods. Notably, however,
both studies adjusting for HGD [36, 37] did demonstrated
convincing effects.
The robustness of the associations between CIN and pro-
gression suggests it to be of immediate clinical utility. CIN is a
constituent of genomic instability, a state of erroneous pro-
gression through the cell cycle. Inaccurate DNA replication,
repair, and chromosomal segregation, results in accumulation
of genomic errors and is a major factor driving tumorigenesis.
CIN is associated with worse stage and prognosis in a range of
Table 3 Meta-analyzed markers assessed in association with BE susceptibility
Marker Individual study Meta-analysis
Association
Variant Gene EV Variant Wild-type No association OR (95 % CI) I2 Chi p n
Null GSTM1 Null Null Kadioglu et al. [55] BE 0.83 (0.61–1.12) 27 % 4.12 0.220 4
Kala et al. [19] BEno IM 0.66 (0.44–0.99) 0 % 0.64 0.420 2
Casson et al. [46] BEIM 1.12 (0.70–1.80) 0 % 0.64 0.630 2
van Lieshout et al. [56]
rs4880 SOD2 T T Kadioglu et al. [55],
di Martino et al. [49]
BEIM 0.90 (0.65–1.24) 0.00 0.07 0.520 3
Murphy et al. [45]
rs16944 IL1B AA AA Izakovicova-Holla et al.
[27],
Gough et al. [28]
BE 1.13 (0.63–2.03) 0.00 0.00 0.680 2
rs1052133 OGG1 G G Kadioglu et al. [55],
Ferguson et al. [49]
BEA IM 1.34 (0.59–3.09) 67 % 3.01 0.480 2
rs25487 XRCC1 TT TT Casson et al.
[48]
Ferguson et al. [49] BEA IM 0.65 (0.25–1.68) 71 % 3.42 0.370 2
rs13181 ERCC2 CC CC Casson et al. [48],
Fergusons et al. [49]
BEA IM 0.92 (0.57–1.48) 31 % 1.44 0.730 2
EV effect variant, OR odds ratio, CI confidence interval, IM intestinal metaplasia, BE Barrett’s esophagus
32 Dig Dis Sci (2016) 61:25–38
123

Ta
ble
4R
epo
rted
som
atic
mar
ker
so
fB
arre
tt’s
eso
ph
agu
sp
rog
ress
ion
tod
ysp
lasi
a/ad
eno
carc
ino
ma
Mar
ker
Ind
ivid
ual
stu
dy
Ass
oci
atio
n(m
eta-
anal
ysi
s/in
div
idu
alst
ud
y)
LO
EV
aria
nt
Gen
eA
sso
ciat
ion
EV
LO
EE
thn
icit
yP
hen
oty
pe
Ad
just
edfo
r
con
fou
nd
ers?
Var
ian
tN
on
eP
hen
oty
pe
and
OR
/HR
(95
%C
I)
I2C
hi
pn
IIC
INN
AB
ird
-Lie
ber
man
etal
.[3
6]
CIN
CN
PH
GD
/
EA
C
Yes
(plu
sle
ng
th,
dy
spla
sia)
HG
D/E
AC
OR
(A)
IMP
B5
.98
(2.1
0–
17
.1)
57
%1
6.2
8.0
09
10-
45
Sik
kem
aet
al.
[37
]
CIN
CC
auc
HG
D/
EA
C
Yes
(plu
s
dy
spla
sia)
HG
D/E
AC
HR
(A)
IM1
.36
(1.2
6–
1.4
7)
0%
0.9
8\
1.0
09
10-
52
Ch
aoet
al.
[57
]*C
INC
NP
EA
CN
o
Gal
ipea
uet
al.
[38
]*
CIN
CN
PE
AC
Yes
(len
gth
,n
ot
dy
spla
sia)
PB
-ad
just
edfo
rp
ub
lica
tio
n
bia
sF
ang
20
04
,R
abin
ov
itch
20
01
,F
ang
etal
.[5
8]
CIN
CN
PE
AC
No
Mal
eyet
al.
[39
]*
CIN
CN
PE
AC
Yes
(len
gth
,n
ot
dy
spla
sia)
Teo
do
ri1
99
9
Rab
ino
vit
ch
etal
.[5
9]*
CIN
CN
PE
AC
Yes
(len
gth
,n
ot
dy
spla
sia)
Rei
det
al.
[9]*
*C
IND
NP
EA
CN
oO
ver
lap
pin
gp
op
ula
tio
ns*
**
Teo
do
riet
al.
[60
]
CIN
CN
PH
GD
/
EA
C
No
Rei
det
al.
[8]*
*C
INC
NP
EA
CN
o
Jam
eset
al.
[61]
CIN
DN
PE
AC
No
III
CN
VN
AP
auls
on
etal
.
[62
]
[7
0M
bp
CN
PE
AC
/CIN
No
EA
C/C
INH
R4
.90
(1.6
0–
14
.8)
NA
NA
4.7
09
10-
3
(NS
)
1
III
LO
HTP53
Gal
ipea
uet
al.
[38
]*
LO
HC
NP
EA
CY
es(l
eng
th,
no
t
dy
spla
sia)
EA
CH
RA
5.4
(2.5
–1
2.0
)N
AN
A\
19
10-
31
Mal
eyet
al.
[39
]*
LO
HC
Rei
det
al.
[63]*
LO
HC
III
LO
HP16
Gal
ipea
uet
al.
[38
]*
Mal
eyet
al.
[39]*
LO
HC
NP
EA
CY
es(l
eng
th,
no
t
dy
spla
sia)
EA
CA
HR
2.4
(1.0
–5
.5)
NA
NA
0.0
45
1
LO
HC
NP
EA
CY
es(l
eng
th,
no
t
dy
spla
sia)
III
Mu
tan
tTP53
Gal
ipea
u
etal
.[3
8]*
Mu
tan
tC
NP
EA
CN
oE
AC
HR
A1
.27
(1.0
7–
1.5
0)
NA
NA
\0
.01
(NS
)1
Mal
eyet
al.
[39
]*
Mu
tan
tC
NP
EA
CY
es(l
eng
th,
no
t
dy
spla
sia)
Dig Dis Sci (2016) 61:25–38 33
123

tumors including esophageal [40] and has been demonstrated
in a quarter of patients with BE [36]. Importantly, this subset
appears to be at significantly higher risk of malignant pro-
gression, which can be readily demonstrated by flow cytom-
etry. This does, however, remain somewhat imprecise and is
unable to distinguish between stable and unstable, simple and
complex abnormalities. Despite this, the incorporation of CIN
into a biomarker panel such as that reported by Bird-Lieber-
man et al. [36] (comprising age, CIN, dysplasia, TP53 and
Cyclin A expression, sialyl Lewis antigens, Aspergillus ory-
zae lectin, and binding of wheat germ agglutinin) may provide
invaluable information with which to personalize manage-
ment of BE.
By contrast, the immediate benefits of germline sus-
ceptibility biomarkers are less tangible. As predicted by the
‘‘common disease-common variant’’ hypothesis of com-
plex traits, both GWAS suggested many common variants
of small effect to contribute to development of BE. Con-
sequently, germline associations may be weaker and more
complex. Whilst this gives the potential to identify novel
biology, variants may have little utility in isolation.
A number of recurrent methodological issues were
identified, limiting the generalizability of reported variants.Ta
ble
4co
nti
nu
ed
Mar
ker
Ind
ivid
ual
stu
dy
Ass
oci
atio
n(m
eta-
anal
ysi
s/in
div
idu
alst
ud
y)
LO
EV
aria
nt
Gen
eA
sso
ciat
ion
EV
LO
EE
thn
icit
yP
hen
oty
pe
Ad
just
edfo
r
con
fou
nd
ers?
Var
ian
tN
on
eP
hen
oty
pe
and
OR
/HR
(95
%C
I)
I2C
hi
pn
Do
lan
etal
.[6
4]
Mu
tan
tC
NP
EA
CN
oN
om
eta
po
ssib
leas
stu
dy
po
pu
lati
on
ov
erla
pan
d
dif
feri
ng
effe
ctm
easu
res
LOE
lev
elo
fev
iden
ce,EV
effe
ctv
aria
nt,OR
od
ds
rati
o,HR
haz
ard
rati
o,CI
con
fid
ence
inte
rval
,CIN
chro
mo
som
alin
stab
ilit
y,NA
no
tap
pli
cab
le,NP
no
tp
rese
nte
d,NS
no
nsi
gn
ifica
nt,HGD
hig
h-g
rad
ed
ysp
lasi
a,EAC
eso
ph
agea
lad
eno
carc
ino
ma,
Aad
just
ed
*,*
*,*
**
den
ote
ov
erla
pp
ing
po
pu
lati
on
s
Fig. 2 Uncorrected and corrected funnel plots for odds ratio of
progression and chromosomal instability
34 Dig Dis Sci (2016) 61:25–38
123
Ultimately, validation studies for prioritized variants
should be designed with these in mind, with particular
emphasis on the interaction between genomic and clinical
factors. Other issues to be addressed include disparity as
diagnostic criteria; confirmation of IM is a prerequisite in
the USA, yet is not required in the UK [41], although this
did not alter the findings of this review.
A number of exploratory NGS studies have recently
been performed for both BE and EAC. These have served
to highlight the mutational complexity of both conditions,
providing biological context for markers and their genes
(which are often considered in isolation) as well as sug-
gesting new variants and genes for study. Recently,
Streppel et al. [11] performed whole genome sequencing
(WGS) of one patient, comparing normal squamous
epithelium with metaplastic and neoplastic epithelium.
This identified somatic nonsense mutations in genes
including AT-rich interactive domain 1A (ARID1A), a
member of the SWI/SNF family involved in gene expres-
sion via chromatin remodeling, which has been indepen-
dently identified as a driver gene of EAC by of other NGS
studies. The authors found ARID1A loss of expression to
become progressively more common during the meta-
plasia-dysplasia-adenocarcinoma sequence, and to be
associated with aberrant cellular proliferation and invasion
in a knock-down model. NGS studies also provide valuable
contextual information as to mutational spectra, as well as
clonal and linear evolution to better understand to devel-
opment of somatic mutations and genomic instability.
Recently, Weaver et al. [12] performed WGS of 112
EACs, similarly identifying a number of significantly and
recurrently mutated genes. One hundred and seven BE
samples were then genotyped, with the notable finding that
most such mutations were already present in non-dys-
plastic epithelium; just TP53 and SMAD4 mutations
occurred later, in HGD and EAC. The advent of third-
generation sequencing, for example from single cells, will
undoubtedly shed yet further light on this process. Addi-
tionally, germline rather than somatic mutations in EAC
driver genes have been shown to predispose to EAC,
although this has yet to be demonstrated in BE [42].
This review has a number of limitations. While we
searched two databases using a comprehensive search
term, it is possible that relevant publications (including
non-English articles) were not identified. As discussed,
meta-analysis for CIN was performed within the context of
considerably heterogeneity and must be interpreted with
caution. Only one meta-analysis (CIN and OR of pro-
gression) involved more than 5 studies, with considerable
funnel plot asymmetry, largely due to small studies
reporting large effect sizes with significant variance. This
was interpreted as publication bias, and was adjusted,
without altering statistical significance. In addition, theTa
ble
5R
epo
rted
som
atic
bio
mar
ker
so
fB
arre
tt’s
eso
ph
agu
sp
rog
ress
ion
tod
ysp
lasi
a/ad
eno
carc
ino
ma
foll
ow
ing
ph
oto
dy
nam
icth
erap
y
Mar
ker
Ind
ivid
ual
stu
dy
Ass
oci
atio
n(m
eta-
anal
ysi
s/in
div
idu
alst
ud
y)
LO
EV
aria
nt
Gen
eA
sso
ciat
ion
EV
LO
EE
thn
icit
yP
hen
oty
pe
Ad
just
edfo
r
con
fou
nd
ers?
Var
ian
tN
on
eP
hen
oty
pe
HR
(95
%C
I)I2
Ch
ip
n
IVC
INN
AD
un
net
al.
[65
]C
IN4
mp
ost
-PD
TD
NS
HG
DY
esE
AC
/HG
DH
RA
4.1
0(1
.30
–1
3.0
)N
AN
A9
.009
10-
31
CIN
12
mp
ost
-PD
TE
AC
/HG
DH
RA
3.6
0(1
.05
–1
2.3
)2
.909
10-
3
LOE
lev
elo
fev
iden
ce,CIN
chro
mo
som
alin
stab
ilit
y,EV
effe
ctv
aria
nt,HR
haz
ard
rati
o,CI
con
fid
ence
inte
rval
,PDT
ph
oto
dy
nam
icth
erap
y,HGD
hig
h-g
rad
ed
ysp
lasi
a,EAC
eso
ph
agea
l
aden
oca
rcin
om
a
Dig Dis Sci (2016) 61:25–38 35
123
‘‘trim and fill’’ method used to correct for possible bias
while widely used does make assumptions regarding the
necessity for plot symmetry, while not incorporating study
methodology. Unfortunately, the limited number of studies
prevented useful meta-regression to assess this further.
There are also limitations in using the revised ASCO
guidelines, as these do not fully represent the complexity of
methodological quality and also disagreement between
studies. We therefore used modified REMARK guidelines
to provide a further level of criticism. In particular, the
ASCO guidelines do not allow for differences in method-
ology (for example, GWAS versus candidate studies). And
more generically, while genomic biomarkers are typically
considered in isolation, in reality their utility depends on
innumerable variables (including transcriptional, transla-
tional and proteomic regulation, and clinical and environ-
mental factors). Consequently, establishing their true utility
will require parallel processing and consideration of these
contexts.
In conclusion, this review has identified, evaluated,
and synthesized the evidence for genomic biomarkers of
BE susceptibility and dysplastic/malignant progression.
Seventeen germline markers of susceptibility, 5 somatic
markers of progression, and 1 marker of relapse fol-
lowing photodynamic therapy were identified. Meta-
analysis demonstrated CIN to be a particularly plausible
and clinically useful marker of progression and one
which can be demonstrated readily. However, the overall
evidence base is characterized by widespread method-
ological issues, which limit the immediate clinical utility
of these markers. Consequently, larger studies with more
robust design are required to validate these markers,
identify novel variants, and incorporate them into clini-
cal practice.
Acknowledgments Core funding is provided to the Wellcome
Trust Centre for Human Genetics from the Wellcome Trust (090532/
Z/09/Z).
Compliance with ethical standards
Conflict of interest Mark R. Middleton has received payment
for advisory/consulting roles within the last 2 years from Amgen,
Bristol-Myers Squibb, GlaxoSmithKline, Merck, Millennium, and
Roche, and institutional funding from Amgen, AstraZeneca, Bristol-
Myers Squibb, Clovis, Eisai, GlaxoSmithKline, Immunocore, John-
son & Johnson, Merck, Millennium, Novartis, Pfizer, Roche and
Vertex. The authors declare no conflicts of interest.
Open Access This article is distributed under the terms of the
Creative Commons Attribution-NonCommercial 4.0 International
License (http://creativecommons.org/licenses/by-nc/4.0/), which per-
mits any noncommercial use, distribution, and reproduction in any
medium, provided you give appropriate credit to the original
author(s) and the source, provide a link to the Creative Commons
license, and indicate if changes were made.
References
1. Barrett NR. Chronic peptic ulcer of the oesophagus and
‘oesophagitis’. Br J Surg. 1950;38:175–182.
2. Cameron AJ, Lomboy CT. Barrett’s esophagus: age, prevalence,
and extent of columnar epithelium. Gastroenterology. 1992;
103:1241–1245.
3. Gerson LB, Edson R, Lavori PW, Triadafilopoulos G. Use of a
simple symptom questionnaire to predict Barrett’s esophagus in
patients with symptoms of gastroesophageal reflux. Am J Gas-
troenterol. 2001;96:2005–2012.
4. Wild CP, Hardie LJ. Reflux, Barrett’s oesophagus and adeno-
carcinoma: burning questions. Nat Rev Cancer. 2003;3:676–684.
5. Lepage C, Rachet B, Jooste V, Faivre J, Coleman MP. Contin-
uing rapid increase in esophageal adenocarcinoma in England
and Wales. Am J Gastroenterol. 2008;103:2694–2699.
6. Falk GW. Barrett’s oesophagus: frequency and prediction of
dysplasia and cancer. Best Pract Res Clin Gastroenterol.
2015;29:125–138.
7. Hvid-Jensen F, Pedersen L, Drewes AM, Sorensen HT, Funch-
Jensen P. Incidence of adenocarcinoma among patients with
Barrett’s esophagus. N Engl J Med. 2011;365:1375–1383.
8. Reid BJ, Blount PL, Rubin CE, Levine DS, Haggitt RC, Rabi-
novitch PS. Flow-cytometric and histological progression to
malignancy in Barrett’s esophagus: prospective endoscopic
surveillance of a cohort. Gastroenterology. 1992;102:1212–1219.
9. Reid BJ, Levine DS, Longton G, Blount PL, Rabinovitch PS.
Predictors of progression to cancer in Barrett’s esophagus:
baseline histology and flow cytometry identify low- and high-risk
patient subsets. Am J Gastroenterol. 2000;95:1669–1676.
10. Streppel MM, Lata S, DelaBastide M, et al. Next-generation
sequencing of endoscopic biopsies identifies ARID1A as a tumor-
suppressor gene in Barrett’s esophagus.Oncogene. 2014;33:347–357.
11. Dulak AM, Stojanov P, Peng S, et al. Exome and whole-genome
sequencing of esophageal adenocarcinoma identifies recurrent
driver events and mutational complexity. Nat Genet. 2013;
45:478–486.
12. Weaver JM, Ross-Innes CS, Shannon N, et al. Ordering of
mutations in preinvasive disease stages of esophageal carcino-
genesis. Nat Genet. 2014;46:837–843.
13. Hellier MD, Shepherd NA. BSG Guidelines in Gastroenterology:
Diagnosis of Columnar-Lined Oesophagus. British Society of
Gastroenterology; 2005:13–17.
14. Stroup DF, Berlin JA, Morton SC, et al. Meta-analysis of obser-
vational studies in epidemiology: a proposal for reporting. Meta-
analysis of Observational Studies in Epidemiology (MOOSE)
group. JAMA. 2000;283:2008–2012.
15. Simon RM, Paik S, Hayes DF. Use of archived specimens in
evaluation of prognostic and predictive biomarkers. J Natl Can-
cer Inst. 2009;101:1446–1452.
16. Sterne JA, Sutton AJ, Ioannidis JP, et al. Recommendations for
examining and interpreting funnel plot asymmetry in meta-anal-
yses of randomised controlled trials. BMJ. 2011;343:d4002.
17. Sutton AJ, Duval SJ, Tweedie RL, Abrams KR, Jones DR.
Empirical assessment of effect of publication bias on meta-
analyses. BMJ. 2000;320:1574–1577.
18. Bull LM, White DL, Bray M, Nurgalieva Z, El-Serag HB. Phase I
and II enzyme polymorphisms as risk factors for Barrett’s
esophagus and esophageal adenocarcinoma: a systematic review
and meta-analysis. Dis Esophagus. 2009;22:571–587.
19. Kala Z, Dolina J, Marek F, Izakovicova Holla L. Polymorphisms
of glutathione S-transferase M1, T1 and P1 in patients with reflux
esophagitis and Barrett’s esophagus. J Hum Genet. 2007;
52:527–534.
36 Dig Dis Sci (2016) 61:25–38
123

20. Menke V, Pot RG, Moons LM, et al. Functional single-nucleotide
polymorphism of epidermal growth factor is associated with the
development of Barrett’s esophagus and esophageal adenocarci-
noma. J Hum Genet. 2012;57:26–32.
21. McElholm AR, McKnight AJ, Patterson CC, et al. A population-
based study of IGF axis polymorphisms and the esophageal
inflammation, metaplasia, adenocarcinoma sequence. Gastroen-
terology. 2010;139:204-e3–212-e3.
22. MacDonald K, Porter GA, Guernsey DL, Zhao R, Casson AG. A
polymorphic variant of the insulin-like growth factor type I
receptor gene modifies risk of obesity for esophageal adenocar-
cinoma. Cancer Epidemiology. 2009;33:37–40.
23. O’Riordan JM, Abdel-latif MM, Ravi N, et al. Proinflammatory
cytokine and nuclear factor kappa-B expression along the
inflammation–metaplasia–dysplasia–adenocarcinoma sequence
in the esophagus. Am J Gastroenterol. 2005;100:1257–1264.
24. Jenkins GJ, Harries K, Doak SH, et al. The bile acid deoxycholic acid
(DCA) at neutral pH activates NF-kappaB and induces IL-8 expres-
sion in oesophageal cells in vitro.Carcinogenesis. 2004;25:317–323.
25. Fitzgerald RC, Abdalla S, Onwuegbusi BA, et al. Inflammatory
gradient in Barrett’s oesophagus: implications for disease com-
plications. Gut. 2002;51:316–322.
26. Moons LM, Kusters JG, van Delft JH, et al. A pro-inflammatory
genotype predisposes to Barrett’s esophagus. Carcinogenesis.
2008;29:926–931.
27. Izakovicova Holla L, Borilova Linhartova P, Hrdlickova B, et al.
Haplotypes of the IL-1 gene cluster are associated with gastroe-
sophageal reflux disease and Barrett’s esophagus. Human
Immunol. 2013;74:1161–1169.
28. Gough MD, Ackroyd R, Majeed AW, Bird NC. Prediction of
malignant potential in reflux disease: are cytokine polymorphisms
important? Am J Gastroenterology. 2005;100:1012–1018.
29. Babar M, Ryan AW, Anderson LA, et al. Genes of the inter-
leukin-18 pathway are associated with susceptibility to Barrett’s
esophagus and esophageal adenocarcinoma. Am J Gastroenterol.
2012;107:1331–1341.
30. Gaj P, Mikula M, Wyrwicz LS, Regula J, Ostrowski J. Barrett’s
esophagus associates with a variant of IL23R gene. Acta Biochim
Pol. 2008;55:365–369.
31. Casson AG, Zheng Z, Evans SC, et al. Cyclin D1 polymorphism
(G870A) and risk for esophageal adenocarcinoma. Cancer.
2005;104:730–739.
32. Su Z, Gay LJ, Strange A, et al. Common variants at the MHC
locus and at chromosome 16q24.1 predispose to Barrett’s
esophagus. Nat Genet. 2012;44:1131–1136.
33. Palles C, Chegwidden L, Li X, et al. Polymorphisms near TBX5
and GDF7 are associated with increased risk for Barrett’s
esophagus. Gastroenterology. 2015;148:367–378.
34. Dura P, van Veen EM, Salomon J, et al. Barrett associated MHC
and FOXF1 variants also increase esophageal carcinoma risk. Int
J Cancer. 2013;133:1751–1755.
35. Visscher PM, Brown MA, McCarthy MI, Yang J. Five years of
GWAS discovery. Am J Hum Genet. 2012;90:7–24.
36. Bird-Lieberman EL, Dunn JM, Coleman HG, et al. Population-
based study reveals new risk-stratification biomarker panel for
Barrett’s esophagus. Gastroenterology. 2012;143:927-e3–935-e3.
37. Sikkema M, Kerkhof M, Steyerberg EW, et al. Aneuploidy and
overexpression of Ki67 and p53 as markers for neoplastic pro-
gression in Barrett’s esophagus: a case–control study. Am J
Gastroenterol. 2009;104:2673–2680.
38. Galipeau PC, Li X, Blount PL, et al. NSAIDs modulate
CDKN2A, TP53, and DNA content risk for progression to eso-
phageal adenocarcinoma. PLoS Med. 2007;4:e67.
39. Maley CC, Galipeau PC, Li X, et al. The combination of genetic
instability and clonal expansion predicts progression to esopha-
geal adenocarcinoma. Cancer Res. 2004;64:7629–7633.
40. Yu JM, Yang LH, Guo Q, et al. Flow cytometric analysis DNA
content in esophageal carcinoma. Correlation with histologic and
clinical features. Cancer. 1989;64:80–82.
41. Watson A, Shepherd NA. The Definition of ‘‘Barrett’s’’ Colum-
nar-Lined Oesophagus. British Society of Gastroenterology:
Guidelines for the Diagnosis and Management of Barrett’s
Columnar-Lined Oesophagus. 2005.
42. Buas MF, Levine DM, Makar KW, et al. Integrative post-genome-
wide association analysis of CDKN2A and TP53 SNPs and risk of
esophageal adenocarcinoma. Carcinogenesis. 2014;35:2740–2747.
43. Ren D, Zheng G, Bream S, Tevebaugh W, Shaheen NJ, Chen X.
Single Nucleotide Polymorphisms of Caudal Type Homeobox 1
and 2 Are Associated with Barrett’s Esophagus. Dig Dis Sci.
2014;59:57–63.
44. van de Winkel A, Menke V, Capello A, et al. Expression,
localization and polymorphisms of the nuclear receptor PXR in
Barrett’s esophagus and esophageal adenocarcinoma. BMC
Gastroenterol. 2011;11:108.
45. Murphy SJ, Hughes AE, Patterson CC, et al. A population-based
association study of SNPs of GSTP1, MnSOD, GPX2 and Bar-
rett’s esophagus and esophageal adenocarcinoma. Carcinogene-
sis. 2007;28:1323–1328.
46. Casson AG, Zheng Z, Porter GA, Guernsey DL. Genetic poly-
morphisms of microsomal epoxide hydroxylase and glutathione
S-transferases M1, T1 and P1, interactions with smoking, and risk
for esophageal (Barrett) adenocarcinoma. Cancer Detect Prev.
2006;30:423–431.
47. van Lieshout EM, Tiemessen DM, Witteman BJ, Jansen JB,
Peters WH. Low glutathione and glutathione S-transferase levels
in Barrett’s esophagus as compared to normal esophageal
epithelium. Jpn J Cancer Res Gann. 1999;90:81–85.
48. Casson AG, Zheng Z, Evans SC, Veugelers PJ, Porter GA,
Guernsey DL. Polymorphisms in DNA repair genes in the
molecular pathogenesis of esophageal (Barrett) adenocarcinoma.
Carcinogenesis. 2005;26:1536–1541.
49. Ferguson HR, Wild CP, Anderson LA, et al. No association
between hOGG1, XRCC1, and XPD polymorphisms and risk of
reflux esophagitis, Barrett’s esophagus, or esophageal adenocar-
cinoma: results from the factors influencing the Barrett’s ade-
nocarcinoma relationship case-control study. Cancer Epidemiol
Biomark Prev. 2008;17:736–739.
50. Menke V, van Zoest KP, Moons LM, et al. NcoI TNF-beta gene
polymorphism and TNF expression are associated with an
increased risk of developing Barrett’s esophagus and esophageal
adenocarcinoma. Scand J Gastroenterol. 2012;47:378–386.
51. Menke V, Van Zoest KP, Moons LM, et al. Myo9B is associated
with an increased risk of Barrett’s esophagus and esophageal
adenocarcinoma. Scand J Gastroenterol. 2012;47:1422–1428.
52. Bradbury PA, Zhai R, Hopkins J, et al. Matrix metalloproteinase
1, 3 and 12 polymorphisms and esophageal adenocarcinoma risk
and prognosis. Carcinogenesis. 2009;30:793–798.
53. di Martino E, Hardie LJ, Wild CP, et al. The NAD(P)H:quinone
oxidoreductase I C609T polymorphism modifies the risk of
Barrett esophagus and esophageal adenocarcinoma. Genetics
Med. 2007;9:341–347.
54. Rajendra S, Ackroyd R, Murad S, et al. Human leucocyte antigen
determinants of susceptibility to Barrett’s oesophagus in Asians–a
preliminary study. Aliment Pharmacol Ther. 2005;21:1377–1383.
55. Kadioglu E, Sardas S, Ergun M, Unal S, Karakaya AE. The role
of oxidative DNA damage, DNA repair, GSTM1, SOD2 and
OGG1 polymorphisms in individual susceptibility to Barrett’s
esophagus. Toxicol Ind Health. 2010;26:67–79.
56. van Lieshout EM, Roelofs HM, Dekker S, et al. Polymorphic
expression of the glutathione S-transferase P1 gene and its sus-
ceptibility to Barrett’s esophagus and esophageal carcinoma.
Cancer Res. 1999;59:586–589.
Dig Dis Sci (2016) 61:25–38 37
123
57. Chao DL, Sanchez CA, Galipeau PC, et al. Cell proliferation, cell
cycle abnormalities, and cancer outcome in patients with Bar-
rett’s esophagus: a long-term prospective study. Clin Cancer Res.
2008;14:6988–6995.
58. Fang M, Lew E, Klein M, Sebo T, Su Y, Goyal R. DNA
abnormalities as marker of risk for progression of Barrett’s
esophagus to adenocarcinoma: image cytometric DNA analysis in
formalin-fixed tissues. Am J Gastroenterol. 2004;99:1887–1894.
59. Rabinovitch PS, Longton G, Blount PL, Levine DS, Reid BJ.
Predictors of progression in Barrett’s esophagus III: baseline flow
cytometric variables. Am J Gastroenterol. 2001;96:3071–3083.
60. Teodori L, Gohde W, Persiani M, et al. DNA/protein flow
cytometry as a predictive marker of malignancy in dysplasia-free
Barrett’s esophagus: thirteen-year follow-up study on a cohort of
patients. Cytometry. 1998;34:257–263.
61. James PD, Atkinson M. Value of DNA image cytometry in the
prediction of malignant change in Barrett’s oesophagus. Gut.
1989;30:899–905.
62. Paulson TG, Maley CC, Li X, et al. Chromosomal instability
and copy number alterations in Barrett’s esophagus and eso-
phageal adenocarcinoma. Clin Cancer Res. 2009;15:
3305–3314.
63. Reid BJ, Prevo LJ, Galipeau PC, et al. Predictors of progression
in Barrett’s esophagus II: baseline 17p (p53) loss of heterozy-
gosity identifies a patient subset at increased risk for neoplastic
progression. Am J Gastroenterol. 2001;96:2839–2848.
64. Dolan K, Walker SJ, Gosney J, Field JK, Sutton R. TP53 muta-
tions in malignant and premalignant Barrett’s esophagus. Dis
Esophagus. 2003;16:83–89.
65. Dunn JM, Mackenzie GD, Oukrif D, et al. Image cytometry
accurately detects DNA ploidy abnormalities and predicts late
relapse to high-grade dysplasia and adenocarcinoma in Barrett’s
oesophagus following photodynamic therapy. Br J Cancer.
2010;102:1608–1617.
38 Dig Dis Sci (2016) 61:25–38
123


![Barrett’s esophagus and new therapeutic modalitiesThe prevalence of Barrett’s esophagus in the adult population is 0.4–1.6% [1,3,12,13]. Assum-ing a US adult population in 2007](https://static.fdocuments.us/doc/165x107/5f4d5b4d6dfbad3c763bb443/barrettas-esophagus-and-new-therapeutic-modalities-the-prevalence-of-barrettas.jpg)


