Genetic assignment to stock of stranded common bottlenose ...
14
ENDANGERED SPECIES RESEARCH Endang Species Res Vol. 33: 221–234, 2017 doi: 10.3354/esr00780 Published January 31 INTRODUCTION The world’s oceans are experiencing significant increases in anthropogenic impacts. Historically, overfishing due to whaling (Ivashchenko & Clapham 2014) and commercial fishing (Murawski 2010) has depleted a wide variety of taxa. More recently, im- pacts on the oceans are even broader, as human activities intensify and extend further offshore into deeper waters for fishing, shipping, and energy exploration and extraction (Ramirez-Llodra et al. 2011, Mengerink et al. 2014). For example, bottom trawling has now extended off the continental shelf into deep, oceanic waters, where it focuses on sea- mounts. Trawling impacts not only the target species but also negatively impacts the benthic habitats upon which many species rely (Hiddink et al. 2011). New technologies have allowed energy exploration to expand into deeper waters and more remote areas (Copping et al. 2015). The global nature of today’s © Outside the USA the US Government 2017. Open Access under Creative Commons by Attribution Licence. Use, distribu- tion and reproduction are unrestricted. Authors and original publication must be credited. Publisher: Inter-Research · www.int-res.com *Corresponding author: [email protected] ABSTRACT: Degradation of marine ecosystems is an increasing problem and extends beyond nearshore coastal waters with significant human development. However, measuring ecosystem damage and decreased ecosystem function can be difficult. Marine mammals have often been re- commended as indicators for evaluating ecosystem health. Between March 2010 and July 2014, a significant cetacean unusual mortality event occurred across the northern Gulf of Mexico, where multiple demographically independent populations of common bottlenose dolphins Tursiops trun- catus occur adjacent to one another. Some populations are fairly small and restricted to small habi- tat areas, while other populations have higher abundances and cover broader geographic ranges. An integral component to determining the impact of this event on these populations is identifying what percentage of each population the stranded animals comprise. We applied genetic assign- ment test methods to stranded dolphins from southeastern Louisiana to determine the proportion of dead dolphins that came from the local estuarine population versus the population found in adjacent coastal waters. Forty-one microsatellite loci were genotyped in 156 live dolphins sam- pled to represent the 2 potential stocks of origin and in 131 dead stranded dolphins of unknown origin. Both classical assignment tests and genetic stock identification methods indicated that approximately 6 to 7% of the sampled stranded dolphins originated from the Western Coastal Stock and the remainder from the smaller, estuarine stock in Barataria Bay, Louisiana. KEY WORDS: Assignment test · Mixed stock analysis · Genetic stock identification · Microsatellite OPEN PEN ACCESS CCESS Contribution to the Theme Section ‘Effects of the Deepwater Horizon oil spill on protected marine species’ Genetic assignment to stock of stranded common bottlenose dolphins in southeastern Louisiana after the Deepwater Horizon oil spill P. E. Rosel 1, *, L. A. Wilcox 1 , C. Sinclair 2 , T. R. Speakman 3 , M. C. Tumlin 4 , J. A. Litz 5 , E. S. Zolman 3 1 National Marine Fisheries Service, Southeast Fisheries Science Center, Lafayette, LA 70506, USA 2 National Marine Fisheries Service, Southeast Fisheries Science Center, Pascagoula, MS 39568, USA 3 National Centers for Coastal Ocean Science, NOAA, Hollings Marine Laboratory, Charleston, SC 29412, USA 4 Louisiana Department of Wildlife and Fisheries, Baton Rouge, LA 70808, USA 5 National Marine Fisheries Service, Southeast Fisheries Science Center, Miami, FL 33149, USA
Transcript of Genetic assignment to stock of stranded common bottlenose ...
ENDANGERED SPECIES RESEARCHEndang Species Res
Vol. 33: 221–234, 2017doi: 10.3354/esr00780
Published January 31
INTRODUCTION
The world’s oceans are experiencing significantincreases in anthropogenic impacts. Historically,overfishing due to whaling (Ivashchenko & Clapham2014) and commercial fishing (Murawski 2010) hasdepleted a wide variety of taxa. More recently, im -pacts on the oceans are even broader, as humanactivities intensify and extend further offshore intodeeper waters for fishing, shipping, and energy
exploration and extraction (Ramirez-Llodra et al.2011, Mengerink et al. 2014). For example, bottomtrawling has now extended off the continental shelfinto deep, oceanic waters, where it focuses on sea -mounts. Trawling impacts not only the target speciesbut also negatively impacts the benthic habitats uponwhich many species rely (Hiddink et al. 2011). Newtechnologies have allowed energy exploration toexpand into deeper waters and more remote areas(Copping et al. 2015). The global nature of today’s
© Outside the USA the US Government 2017. Open Accessunder Creative Commons by Attribution Licence. Use, distribu-tion and reproduction are un restricted. Authors and originalpublication must be credited.
Publisher: Inter-Research · www.int-res.com
*Corresponding author: [email protected]
ABSTRACT: Degradation of marine ecosystems is an increasing problem and extends beyondnearshore coastal waters with significant human development. However, measuring ecosystemdamage and decreased ecosystem function can be difficult. Marine mammals have often been re -commended as indicators for evaluating ecosystem health. Between March 2010 and July 2014, asignificant cetacean unusual mortality event occurred across the northern Gulf of Mexico, wheremultiple demographically independent populations of common bottlenose dolphins Tursiops trun-catus occur adjacent to one another. Some populations are fairly small and restricted to small habi-tat areas, while other populations have higher abundances and cover broader geographic ranges.An integral component to determining the impact of this event on these populations is identifyingwhat percentage of each population the stranded animals comprise. We applied genetic assign-ment test methods to stranded dolphins from southeastern Louisiana to determine the proportionof dead dolphins that came from the local estuarine population versus the population found inadjacent coastal waters. Forty-one microsatellite loci were genotyped in 156 live dolphins sam-pled to represent the 2 potential stocks of origin and in 131 dead stranded dolphins of unknownorigin. Both classical assignment tests and genetic stock identification methods indicated thatapproximately 6 to 7% of the sampled stranded dolphins originated from the Western CoastalStock and the remainder from the smaller, estuarine stock in Barataria Bay, Louisiana.
KEY WORDS: Assignment test · Mixed stock analysis · Genetic stock identification · Microsatellite
OPENPEN ACCESSCCESS
Contribution to the Theme Section ‘Effects of the Deepwater Horizon oil spill on protected marine species’
Genetic assignment to stock of stranded common bottlenose dolphins in south eastern Louisiana after
the Deepwater Horizon oil spill
P. E. Rosel1,*, L. A. Wilcox1, C. Sinclair2, T. R. Speakman3, M. C. Tumlin4, J. A. Litz5, E. S. Zolman3
1National Marine Fisheries Service, Southeast Fisheries Science Center, Lafayette, LA 70506, USA2National Marine Fisheries Service, Southeast Fisheries Science Center, Pascagoula, MS 39568, USA
3National Centers for Coastal Ocean Science, NOAA, Hollings Marine Laboratory, Charleston, SC 29412, USA4Louisiana Department of Wildlife and Fisheries, Baton Rouge, LA 70808, USA
5National Marine Fisheries Service, Southeast Fisheries Science Center, Miami, FL 33149, USA
Endang Species Res 33: 221–234, 2017
economy has led to more shipping and to increases inthe introduction of non-native species that often negatively impact the ecosystems to which they havebeen introduced (Briski et al. 2012). In the UnitedStates and elsewhere, coastal development and population growth have steadily increased since the1980s (NOAA 2013), leading to increased pollutantloads, and habitat degradation and loss in coastalenvironments (United States Environmental Protec-tion Agency 2012).
Measuring ecosystem damage and decreased eco-system function can be difficult, however, and mar-ine mammals have often been recommended as indi-cators for evaluating ecosystem health (Wells et al.2004, Bossart 2011, Reif 2011). There is growing evi-dence of negative impacts of chemical contaminantson ceta cean reproductive success (Schwacke et al.2002), health, and immunity (Hall et al. 1992, Aguilar& Borrell 1994, Hammond et al. 2005, Schwacke et al.2012). Gulland & Hall (2007) report a steady increasein the number of marine mammal mass mortalityevents due to exposure to harmful algal blooms overthe past 40 yr. Recognition of the pathogens thatcause individual marine mammal deaths is an impor-tant first step towards understanding the health sta-tus of individuals and of their ecosystem, but animportant additional step is understanding the popu-lation-level impacts of such mortalities. To assess thestatus of a population (i.e. growing, declining, sta-ble), one must be able to determine the number ofindividuals from a population impacted by a givenmortality event.
In the northern Gulf of Mexico (GoM), the commonbottlenose dolphin Tursiops truncatus is a wide-spread species, inhabiting estuarine, coastal, conti-nental shelf and slope, and oceanic waters (Vollmer& Rosel 2013). Currently, 36 common bottlenose dol-phin stocks have been delimited in the northernGoM for management purposes under the MarineMammal Protection Act of 1972 (Waring et al. 2015).Thirty-one of these stocks inhabit enclosed or semi-enclosed bays, sounds, and estuaries that line the USGulf coast from Texas to Florida, and most arethought to have relatively low population sizes (i.e. inthe low hundreds; Waring et al. 2015); however, thenewest abundance estimate for the Barataria BayEstuarine System Stock in Louisiana is near 3000(McDonald et al. 2017, this Theme Section). In addi-tion, there are 3 Coastal stocks inhabiting watersfrom the beaches or barrier islands out to the 20 misobath, one Continental Shelf Stock in watersbetween 20 and 200 m deep, and one Oceanic Stockinhabiting waters >200 m deep throughout US
waters of the Gulf. These latter 5 stocks coverbroader geographic regions and are larger than theestuarine stocks (Waring et al. 2015). The WesternCoastal Stock, for example, is currently delimited incoastal waters from the Mississippi River delta to theTexas−Mexico border in the northern GoM and hasan estimated abundance of 20 161 (CV = 0.17) (Waring et al. 2015). Despite the more open oceanenvironment these coastal and shelf stocks inhabit,like common bottlenose dolphin populations in othernearshore environments, significant habitat parti-tioning is seen even on relatively small spatial scales(Sellas et al. 2005, Baird et al. 2009, Rosel et al. 2009,Martien et al. 2012). In the northern GoM, photo-identification studies in a variety of estuarine areashave identified long-term, year-round site fidelity(Shane 1977, Wells et al. 1987, 2017, this Theme Section, Hubard et al. 2004, Balmer et al. 2008, Bas-sos-Hull et al. 2013) as well as partitioning of habitatbe tween estuarine and adjacent coastal waters (Fazioli et al. 2006). Genetic analysis of 3 estuarinepopulations and the adjacent coastal population offthe west coast of Florida revealed significant geneticdifferentiation among all 4 populations (Sellas et al.2005). In addition, genetic differentiation betweenthese 4 populations in Florida and a population fromMata gorda Bay, Texas was even higher (Sellas et al.2005). Genetic analysis of continental shelf andoceanic waters has also revealed significant habitatpartitioning even in this open water environment(Vollmer 2011). The photo-identification and geneticdata in combination provide strong support for thepresence of multiple, demographically distinct popu-lations of common bottlenose dolphins that should bemanaged as independent stocks.
An unusual mortality event (UME) was declaredfor the northern GoM from the Texas−Louisiana border through the Florida Panhandle from March2010 through July 2014 (see www.nmfs.noaa.gov/pr/health/ mmume/cetacean_gulfofmexico.htm), and>1100 cetaceans, primarily common bottlenosedolphins, stranded within this region, most ofwhich (95%) stranded dead (Litz et al. 2014). TheDeep water Horizon oil spill began in April 2010 inthe northern GoM, raising questions at the time asto the role the oil spill may have played in thesemortalities. Subsequent studies have indicated thatthe oil spill did negatively impact common bottle-nose dolphin health (Schwacke et al. 2014, Venn-Watson et al. 2015, DWH NRDA Trustees 2016),contributing to this largest and longest-lastingUME in the northern GoM on record (Litz et al.2014).
222
Rosel et al.: Dolphin genetic stock assignment
An integral component of determining the impactof this mortality event on common bottlenose dolphinstocks will be identifying what percentage of eachstock the stranded animals comprise. Genetic assign-ment methods are one way that population of originmay be identified (Manel et al. 2005), although todate, application of these methods to dolphin strand-ings has not been fully explored. Assignment meth-ods can be split into 2 main types. Classical assign-ment tests provide a means to ascertain the sourcepopulation of origin for individuals. Alternatively,one can estimate the mixture proportions for a groupof individuals, identifying what proportion of thegroup originated from each potential source popula-tion. This latter method is commonly used for mixedstock analyses (MSA) (or genetic stock identification;GSI) for commercial fishery management, particu-larly for salmon management in the eastern NorthPacific (e.g. Hess et al. 2014). Both methods requiresampling of each potential source population of ori-gin and sampling of the individuals that are to be as -signed to their population of origin.
Here, we apply both assignment tests and GSI me -thods to a subset of common bottlenose dolphinstrandings from the northern GoM UME to identifyfrom which stock(s) the stranded animals originated.As described above, stock structure for T. truncatusin the northern GoM is complicated. We focus on animals recovered in the vicinity of Barataria Bay,Louisiana, where stranded dolphins have been re -covered from within the bay as well as along theocean-facing beaches of the barrier islands, in -cluding Grand Isle. Strandings in the area are mostlikely to have originated from either the BaratariaBay Estuarine System Stock or the Western CoastalStock that inhabits the adjacent coastal waters out to20 m depth. Modeling of carcass drift suggestsstranded dolphins found on the ocean-facingbeaches are unlikely to have come from the stocksinhabiting deep, offshore waters (Williams et al.2011, L. P. Garrison pers. comm.). Furthermore, thestrong site fidelity ex hibited by estuarine dolphins(Shane 1977, Wells et al. 1987, Hubard et al. 2004,Balmer et al. 2008, Bassos-Hull et al. 2013) limitstheir movements and it is therefore also unlikely thatstranded dolphins in Barataria Bay have come fromadjacent estuarine stocks. The ultimate goal of thisproject is to provide a probability of assignment forthe recovered stranded animals to either the WesternCoastal Stock or the Barataria Bay Estuarine SystemStock to better quantify the numbers of mortalitiesper stock for purposes of injury and stock assess-ment. These mortalities will re present an underesti-
mate of the true number of mortalities, as not everydead dolphin makes it to shore or is found andreported (see Peltier et al. 2012).
MATERIALS AND METHODS
Sampling, DNA extraction, microsatellite genotyping
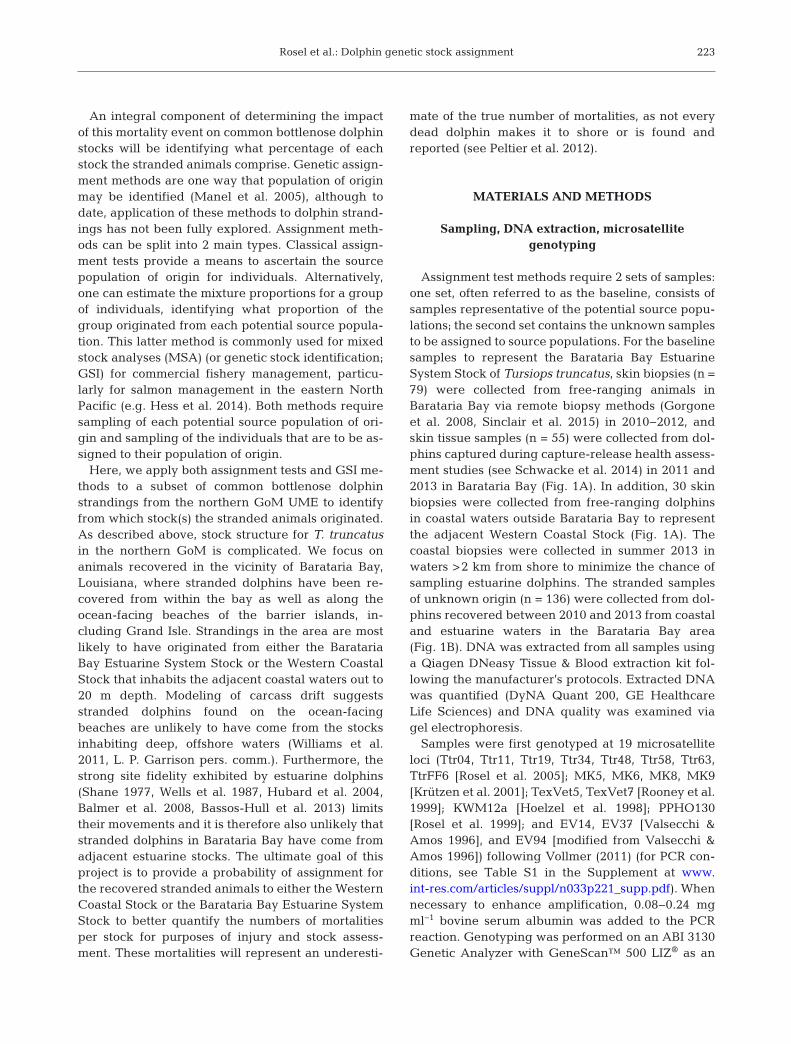
Assignment test methods require 2 sets of samples:one set, often referred to as the baseline, consists ofsamples representative of the potential source popu-lations; the second set contains the unknown samplesto be assigned to source populations. For the baselinesamples to represent the Barataria Bay EstuarineSystem Stock of Tursiops truncatus, skin biopsies (n =79) were collected from free-ranging animals inBarataria Bay via re mote biopsy methods (Gorgoneet al. 2008, Sinclair et al. 2015) in 2010−2012, andskin tissue samples (n = 55) were collected from dol-phins captured during capture-release health assess-ment studies (see Schwacke et al. 2014) in 2011 and2013 in Barataria Bay (Fig. 1A). In addition, 30 skinbiopsies were collected from free-ranging dolphinsin coastal waters outside Barataria Bay to representthe adjacent Western Coastal Stock (Fig. 1A). Thecoastal biopsies were collected in summer 2013 inwaters >2 km from shore to minimize the chance ofsampling estuarine dolphins. The stranded samplesof unknown origin (n = 136) were collected from dol-phins recovered between 2010 and 2013 from coastaland estuarine waters in the Barataria Bay area(Fig. 1B). DNA was extracted from all samples usinga Qiagen DNeasy Tissue & Blood extraction kit fol-lowing the manufacturer’s protocols. Extracted DNAwas quantified (DyNA Quant 200, GE HealthcareLife Sciences) and DNA quality was examined viagel electrophoresis.
Samples were first genotyped at 19 microsatelliteloci (Ttr04, Ttr11, Ttr19, Ttr34, Ttr48, Ttr58, Ttr63,TtrFF6 [Rosel et al. 2005]; MK5, MK6, MK8, MK9[Krützen et al. 2001]; TexVet5, TexVet7 [Rooney et al.1999]; KWM12a [Hoelzel et al. 1998]; PPHO130[Rosel et al. 1999]; and EV14, EV37 [Valsecchi &Amos 1996], and EV94 [modified from Valsecchi &Amos 1996]) following Vollmer (2011) (for PCR con-ditions, see Table S1 in the Supplement at www.int-res.com/articles/suppl/n033p221_supp.pdf). Whennecessary to enhance amplification, 0.08−0.24 mgml−1 bovine serum albumin was added to the PCRreaction. Genotyping was performed on an ABI 3130Genetic Analyzer with GeneScan™ 500 LIZ® as an
223

Endang Species Res 33: 221–234, 2017
internal size standard. Allele sizes were determinedusing GeneMapper v.4.1 (ABI). The probabilities ofidentity, PID and PID(sib) (Waits et al. 2001), were esti-mated using GenAlEx v.6 (Peakall & Smouse 2006),and were used to identify the probability of findingthe same multilocus genotype at random within thepopulation. PID(sib) provides a more conservative esti-mator and is useful for circumstances when theremay be population substructure or in small popula-tions where related individuals may remain in prox-
imity and be sampled (Waits et al.2001). Data for these 19 loci wereused in MSTools (Park 2001) to deter-mine whether any live dolphins hadbeen inadvertently sampled morethan once. One member of eachduplicate (see ‘Results’) was re movedfrom all subsequent data collectionand analyses. The 136 stranded ani-mals were also genotyped at thesefirst 19 loci and MSTools was simi-larly used to search for duplicatesbetween stranded animals and biopsysamples.
The power to detect differentiationand the accuracy of assignment testsare both directly related to the num-ber of informative loci. To improveassignment tests results, we screenedan additional 66 microsatellite lociand ultimately identified and opti-mized an additional 22 loci, 14 identi-fied from screening the common bot-tlenose dolphin genome throughIllumina 454 sequencing (see Lanceet al. 2013) and 8 optimized from locipreviously identified in other ceta -cean species. See Text S1 in the Sup-plement for description of methods toidentify and optimize these additionalloci. All samples (baseline and strand-ings) were then genotyped at the 22new microsatellite loci using a Qia-gen Type-it Microsatellite PCR kit(see Table S2 in the Supplement forPCR conditions). Quality control pro-cedures were applied for all micro-satellite genotyping: all PCR reac-tions contained a no-DNA control aswell as a positive DNA control thatwas used to ensure consistency acrossPCR amplification and genotypingruns. In addition, 8.7% of the biopsy/
capture-release samples were re-geno typed at 19loci to examine geno typing error rate.
Microchecker v.2.2.3 (Van Oosterhout et al. 2004)was used to test each locus in the coastal biopsy sam-ple set and the Barataria Bay biopsy/capture-releasesample set for the presence of genotyping errors dueto null alleles, allelic dropout, and incorrect scoringof stutter. We also tested for significant departurefrom Hardy- Weinberg equilibrium (HWE) propor-tions following Guo & Thompson (1992), and linkage
224
Fig. 1. Common bottlenose dolphin (Tursiops truncatus) sampling locations.(A) Barataria Bay and Coastal biopsy and capture-release samples used inbaseline (inset: Gulf of Mexico). (B) Samples from stranded animals. The 20 m
isobath is shown
Rosel et al.: Dolphin genetic stock assignment
disequilibrium was measured using Fisher’s exacttests. Both tests were performed on the full data setsfrom Barataria Bay (n = 127) and coastal waters (n =29) and also for the baseline populations identified bySTRUCTURE (see next subsection: Barataria Bay estuar-ine [BBe]: n = 49, Barataria Bay island [BBi]: n = 67,Coastal: n = 24) using GENEPOP v.4.0.10 (Rousset2008) and 10 000 dememorizations, 1000 batches,and 10 000 iterations per batch. The level of signifi-cance was corrected for multiple tests using thesequential Bonferroni technique (Holm 1979). Simi-larly, we estimated observed and expected hetero -zygosities, the number of alleles per locus, and thelevels of genetic differentiation among populationsfor both the full data sets and the populations identi-fied by STRUCTURE using the Weir & Cockerham(1984) measure, FST, using Arlequin v.3.5 (Excoffier &Lischer 2010).
Identifying baseline populations
Assignment methods require that potential sourcepopulations be sampled such that microsatelliteallele frequencies for each source population are wellcharacterized. Thus, the sample set used to representeach source population should be representative ofeach population and should not contain samples fromindividuals that are not members of the population,i.e. each baseline sample should be a ‘pure’ sampleof each potential source population to be tested(Manel et al. 2005). For the baseline sample of theWestern Coastal Stock, we used the skin biopsy sam-ples collected in coastal waters >2 km from shore.The baseline sample for the Barataria Bay EstuarineSystem Stock is more difficult to identify because,while Barataria Bay is delimited for managementpurposes as containing a single common bottlenosedolphin stock, other large bays and estuarine systemsare thought to contain multiple dolphin communities(e.g. Urian et al. 2009), and Barataria Bay has beenlittle examined. Therefore, our first step was to testfor evidence of population structure within BaratariaBay so that the appropriate baseline sample set forthe assignment methods could be identified.
The Bayesian clustering program STRUCTURE (Prit -chard et al. 2000) was therefore used to test for evi-dence of multiple genetic clusters among the biopsyand capture-release samples collected in BaratariaBay. STRUCTURE groups individuals into clusters (K)without use of a priori information on where individ-uals come from. Correlated allele frequency andadmixture models were applied to 10 independent
runs of K = 1−5 using 500 000 iterations and a burn-inof 100 000. The mean ln probability of the data (X)given the number of cluster (K) [ln Pr(X|K)], acrossthe 10 runs was examined to identify the best num-ber of populations given the data and were comparedto the ΔK method of Evanno et al. (2005). Correlatingcluster membership with geographic sampling loca-tion allows exploration of whether the STRUCTURE
results are biologically meaningful (Pritchard et al.2009). Therefore, we plotted (ArcGIS 10.3) geo-graphic sampling location for each sample based oncluster membership (q-values). We explored 2 q-value thresholds to assign membership: a more strin-gent value of q ≥0.8, and a more lenient value of q ≥0.6. To further look for biological support for the clus-ters identified by STRUCTURE, we compared generalhabitat preference patterns for 29 animals in the dataset that had been fitted with satellite telemetry tagsduring the 2011 and 2013 Barataria Bay healthassessments (Schwacke et al. 2014). Finally, we re-ran STRUCTURE as above, incorporating the coastalbiopsy samples, to determine whether any estuarinedolphins had been biopsied in waters >2 km fromshore in order to ensure our coastal baseline sampleset did not contain any estuarine dolphins.
The STRUCTURE analysis provided strongest supportfor the existence of 2 genetic clusters within Bara -taria Bay (see ‘Results’). Therefore, 2 versions of a 3-baseline population model (BBe, BBi, and Coastal)were analyzed by assignment tests. The first data setwas created using the q-value cut-off of 0.6 to createthe 2 Barataria Bay baselines, and the second dataset created using the q-value cut-off of 0.8 to createthe 2 Barataria Bay baselines. The Coastal baselinepopulation was created using a q-value cut-off of 0.8in both cases.
Assignment methods
Once the baseline sample set for the Barataria BayEstuarine System and Coastal stocks was identified,we used ONCOR (Kalinowski et al. 2007) andGeneClass2 (Piry 2004) to perform assignment teststo identify population of origin for stranded samplesfrom the Barataria Bay area. First, we assessed theability of the baseline data set to correctly assignindividual dolphins to their population of origin. Weused the leave-one-out and individual assignmentoptions in ONCOR and applied ONCOR to the fullbaseline data set. ONCOR uses a jackknife proce-dure that removes an individual from the data setand then uses a maximum likelihood algorithm to
225
Endang Species Res 33: 221–234, 2017
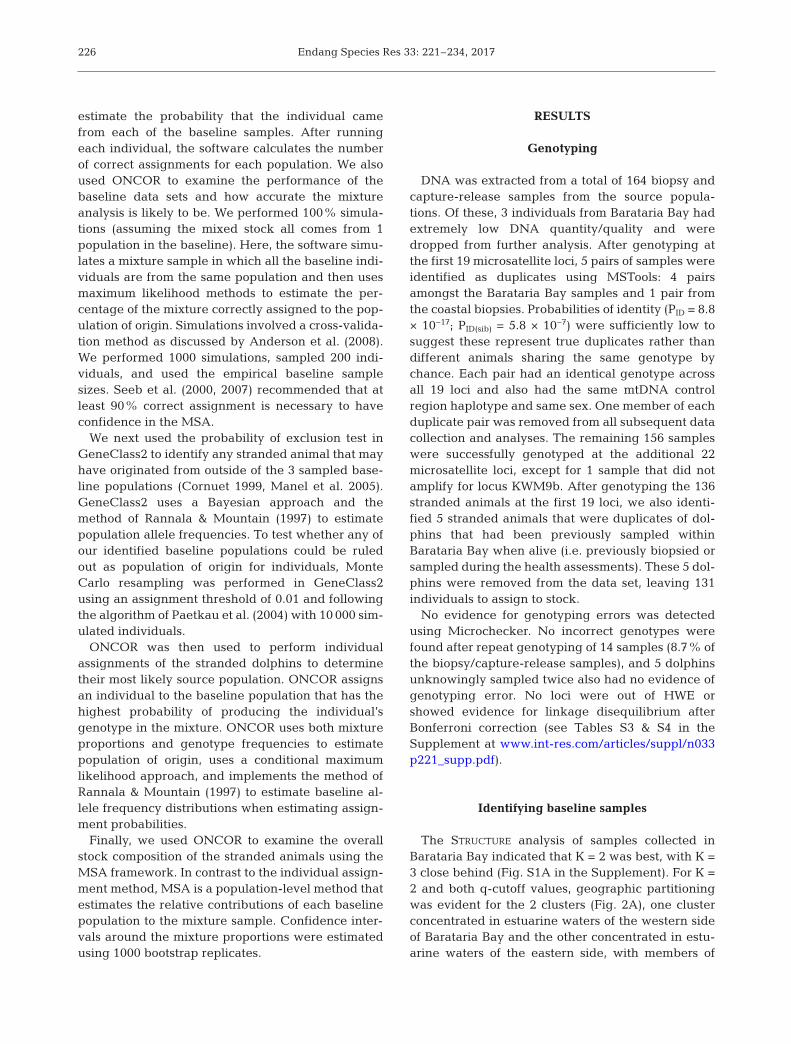
estimate the probability that the individual camefrom each of the baseline samples. After runningeach individual, the software calculates the numberof correct assignments for each population. We alsoused ONCOR to examine the performance of thebaseline data sets and how accurate the mixtureanalysis is likely to be. We performed 100% simula-tions (assuming the mixed stock all comes from 1population in the baseline). Here, the software simu-lates a mixture sample in which all the baseline indi-viduals are from the same population and then usesmaximum likelihood methods to estimate the per-centage of the mixture correctly assigned to the pop-ulation of origin. Simulations involved a cross-valida-tion method as discussed by Anderson et al. (2008).We performed 1000 simulations, sampled 200 indi-viduals, and used the empirical baseline samplesizes. Seeb et al. (2000, 2007) recommended that atleast 90% correct assignment is necessary to haveconfidence in the MSA.
We next used the probability of exclusion test inGeneClass2 to identify any stranded animal that mayhave originated from outside of the 3 sampled base-line populations (Cornuet 1999, Manel et al. 2005).GeneClass2 uses a Bayesian approach and themethod of Rannala & Mountain (1997) to estimatepopulation allele frequencies. To test whether any ofour identified baseline populations could be ruledout as population of origin for individuals, MonteCarlo resampling was performed in GeneClass2using an assignment threshold of 0.01 and followingthe algorithm of Paetkau et al. (2004) with 10 000 sim-ulated individuals.
ONCOR was then used to perform individualassignments of the stranded dolphins to determinetheir most likely source population. ONCOR assignsan individual to the baseline population that has thehighest probability of producing the individual’sgenotype in the mixture. ONCOR uses both mixtureproportions and genotype frequencies to estimatepopulation of origin, uses a conditional maximumlikelihood approach, and implements the method ofRannala & Mountain (1997) to estimate baseline al -lele frequency distributions when estimating assign-ment probabilities.
Finally, we used ONCOR to examine the overallstock composition of the stranded animals using theMSA framework. In contrast to the individual assign-ment method, MSA is a population-level method thatestimates the relative contributions of each baselinepopulation to the mixture sample. Confidence inter-vals around the mixture proportions were estimatedusing 1000 bootstrap replicates.
RESULTS
Genotyping
DNA was extracted from a total of 164 biopsy andcapture-release samples from the source popula-tions. Of these, 3 individuals from Barataria Bay hadextremely low DNA quantity/quality and weredropped from further analysis. After genotyping atthe first 19 microsatellite loci, 5 pairs of samples wereidentified as duplicates using MSTools: 4 pairsamongst the Barataria Bay samples and 1 pair fromthe coastal biopsies. Probabilities of identity (PID = 8.8× 10⁻¹⁷; PID(sib) = 5.8 × 10⁻⁷) were sufficiently low tosuggest these represent true duplicates rather thandifferent animals sharing the same genotype bychance. Each pair had an identical genotype acrossall 19 loci and also had the same mtDNA controlregion haplotype and same sex. One member of eachduplicate pair was removed from all subsequent datacollection and analyses. The remaining 156 sampleswere successfully genotyped at the additional 22microsatellite loci, except for 1 sample that did notamplify for locus KWM9b. After genotyping the 136stranded animals at the first 19 loci, we also identi-fied 5 stranded animals that were duplicates of dol-phins that had been previously sampled withinBarataria Bay when alive (i.e. previously biopsied orsampled during the health assessments). These 5 dol-phins were removed from the data set, leaving 131individuals to assign to stock.
No evidence for genotyping errors was detectedusing Microchecker. No incorrect genotypes werefound after repeat genotyping of 14 samples (8.7% ofthe biopsy/capture-release samples), and 5 dolphinsunknowingly sampled twice also had no evidence ofgenotyping error. No loci were out of HWE orshowed evidence for linkage disequilibrium afterBonferroni correction (see Tables S3 & S4 in the Supplement at www.int-res.com/ articles/ suppl/ n033p221_ supp.pdf).
Identifying baseline samples
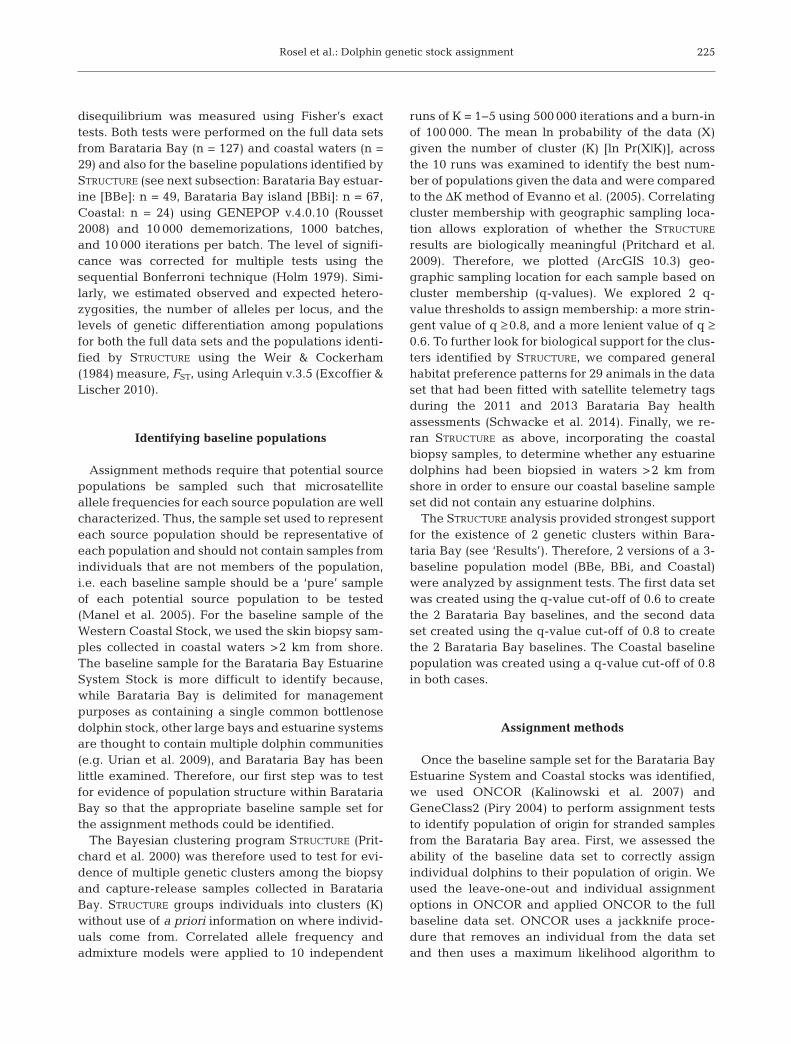
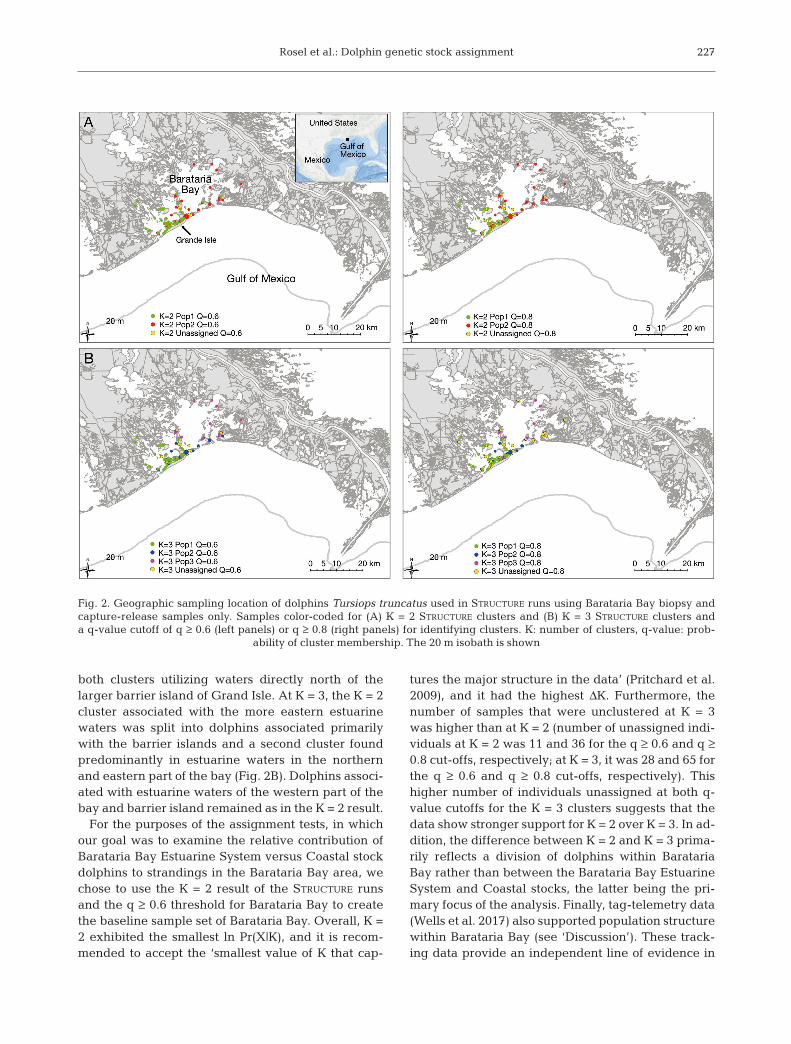
The STRUCTURE analysis of samples collected inBarataria Bay indicated that K = 2 was best, with K =3 close behind (Fig. S1A in the Supplement). For K =2 and both q-cutoff values, geographic partitioningwas evident for the 2 clusters (Fig. 2A), one clusterconcentrated in estuarine waters of the western sideof Barataria Bay and the other concentrated in estu-arine waters of the eastern side, with members of
226
Rosel et al.: Dolphin genetic stock assignment
both clusters utilizing waters directly north of thelarger barrier island of Grand Isle. At K = 3, the K = 2cluster associated with the more eastern estuarinewaters was split into dolphins associated primarilywith the barrier islands and a second cluster foundpredominantly in estuarine waters in the northernand eastern part of the bay (Fig. 2B). Dolphins associ-ated with estuarine waters of the western part of thebay and barrier island remained as in the K = 2 result.
For the purposes of the assignment tests, in whichour goal was to examine the relative contribution ofBarataria Bay Estuarine System versus Coastal stockdolphins to strandings in the Barataria Bay area, wechose to use the K = 2 result of the STRUCTURE runsand the q ≥ 0.6 threshold for Barataria Bay to createthe baseline sample set of Barataria Bay. Overall, K =2 exhibited the smallest ln Pr(X|K), and it is recom-mended to accept the ‘smallest value of K that cap-
tures the major structure in the data’ (Pritchard et al.2009), and it had the highest ΔK. Furthermore, thenumber of samples that were unclustered at K = 3was higher than at K = 2 (number of unassigned indi-viduals at K = 2 was 11 and 36 for the q ≥ 0.6 and q ≥0.8 cut-offs, respectively; at K = 3, it was 28 and 65 forthe q ≥ 0.6 and q ≥ 0.8 cut-offs, respectively). Thishigher number of individuals unassigned at both q-value cutoffs for the K = 3 clusters suggests that thedata show stronger support for K = 2 over K = 3. In ad-dition, the difference between K = 2 and K = 3 prima-rily reflects a division of dolphins within BaratariaBay rather than between the Barataria Bay EstuarineSystem and Coastal stocks, the latter being the pri-mary focus of the analysis. Finally, tag-telemetry data(Wells et al. 2017) also supported population structurewithin Barataria Bay (see ‘Discussion’). These track-ing data provide an independent line of evidence in
227
Fig. 2. Geographic sampling location of dolphins Tursiops truncatus used in STRUCTURE runs using Barataria Bay biopsy andcapture-release samples only. Samples color-coded for (A) K = 2 STRUCTURE clusters and (B) K = 3 STRUCTURE clusters and a q-value cutoff of q ≥ 0.6 (left panels) or q ≥ 0.8 (right panels) for identifying clusters. K: number of clusters, q-value: prob-
ability of cluster membership. The 20 m isobath is shown

Endang Species Res 33: 221–234, 2017
support of the genetic clusters identified by STRUC-TURE. The final sample sizes were n = 49 for the BBebaseline comprising samples primarily from the west-ern estuarine waters, and n = 67 for the BBi baselinecomprising samples mainly associated with the bar-rier islands but also some within the eastern estuarinewaters of the bay. In total, the number of baselinesamples used to represent Barataria Bay was 116. TheFST estimate be tween samples representing the West-ern Coastal Stock (n = 29) and the full Barataria Baydata set (n = 127) was 0.021 (p ≤ 0.0001). FST betweenthe BBe and BBi baseline samples was significant (FST
= 0.028 and 0.038, p ≤ 0.0001, for the q ≥ 0.6 and q ≥0.8 cut-offs, respectively; Table 1). Pooling the BBeand BBi samples and comparing them to the Coastalpopulation returned FST = 0.027 and 0.026 (p ≤ 0.0001)for the q ≥ 0.6 and q ≥ 0.8 cut-offs, respectively. Thehighest FST value was seen between BBe and theCoastal population (FST = 0.05, p ≤ 0.0001).
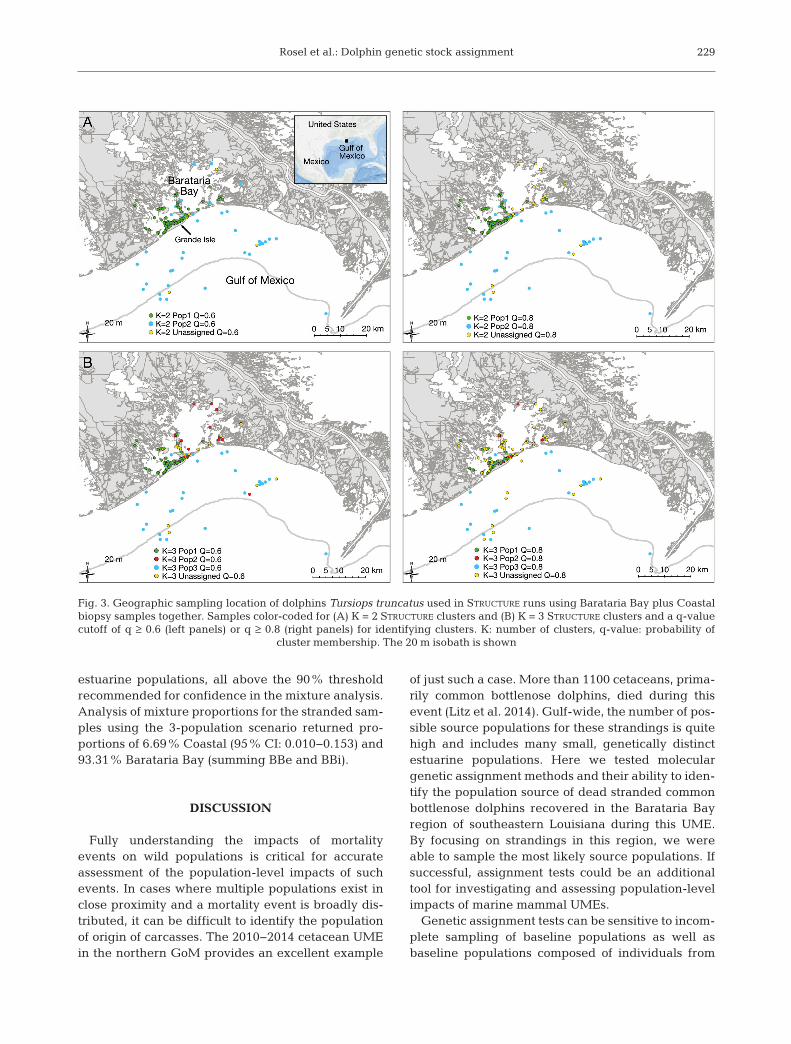
We also used STRUCTURE, as above, with all non-stranding samples (e.g. all Barataria Bay samplesplus the Coastal biopsies) to examine whether anyBarataria Bay dolphins were sampled during thecoastal biopsy effort. Mean Pr(X|K) values were veryclose for K = 2 and K = 3 (Fig. S1B in the Supplement).At K = 2, the samples were generally split into thosecollected in coastal waters >2 km from shore andthose collected in Barataria Bay (Fig. 3A). At K = 3,the Coastal cluster remained the same while theBarataria Bay samples were split into 2 clusters simi-lar to the pattern seen when Barataria Bay sampleswere used alone in STRUCTURE (Fig. 3B). At K = 2, 24of the 29 coastal biopsy samples were in 1 cluster
using a q-value cut-off ≥ 0.8. The average q-value forthose 24 samples was 0.913. The remaining 5 coastalbiopsies were unassigned, i.e. they did not group inthe Barataria Bay cluster either. Lowering the strin-gency to q-values ≥ 0.6 allowed 3 of the unassignedcoastal biopsies to be placed in the Coastal cluster.The average q-value for the Coastal cluster using aq ≥ 0.6 cutoff was 0.852. There were a few BaratariaBay samples that clustered with the coastal biopsiesat K = 2, though most of these became unclustered atK = 3. These samples, when run in the Barataria-Bay-only STRUCTURE runs described above, all fell into theisland-associated clusters. Several of these animalshad satellite tags and none went offshore more than2 to 4 km (Wells et al. 2017), illustrating that theyremain around the barrier islands and do not ventureinto waters occupied by the Western Coastal Stock.Thus, they were retained in the BBi data set, and thefinal Coastal baseline sample contained 24 samplesassigned using the STRUCTURE q-value cutoff of ≥ 0.8.
Assignment of strandings
Self-assignment tests using ONCOR and the base-line sample set proved effective at assigning baselinesamples to their population of origin. The BBe andBBi individuals returned the best result, with 98%and 97% correctly assigned, respectively. The self-assignment for the Coastal population was biaseddownwards, with 83% correctly assigned. These re -sults indicate that the baseline data set has sufficientpower to perform assignment tests, though assign-ments to the Coastal population may be somewhatunderestimated.
Using the 3-baseline population scenario derivedfrom the less stringent q-value in Barataria Bay and athreshold of 0.05, GeneClass2 excluded 2 strandedanimals from all 3 potential source populations.Therefore, the final sample size for use in estimatingassignment probabilities in ONCOR dropped to 129.ONCOR assigned 9 stranded animals to BBe (assign-ment probability range: 0.66−1.0, mean: 0.92), 8 tothe Coastal population (0.63−0.99, mean: 0.82), and111 to the BBi population (0.66−1.0, mean: 0.98). Oneindividual was assigned nearly equally to the BBiand the Coastal populations.
MSA
The 100% simulation test for the MSA ranged from92.7% for the Coastal population to 99.6% for the
228
BBe BBi Coastal
q ≥ 0.6BBe (n = 49) 0.00 0.00BBi (n = 67) 0.0276 0.00Coastal (n = 24) 0.0474 0.0229Overall FST = 0.0302, p < 0.001
q ≥ 0.8BBe (n = 34) 0.00 ± 0.00 0.00BBi (n = 57) 0.0384 0.00Coastal (n = 24) 0.0534 0.0239Overall FST = 0.0366, p < 0.001
Table 1. Microsatellite FST values (and sample sizes of Tur-siops truncatus) for pairwise comparisons of the baselinepopulations used within Barataria Bay (using q ≥ 0.6 and q ≥0.8 cut-off values) and the Coastal population. The Coastalbaseline samples were identified using a q ≥ 0.8 cut-offvalue. FST values below diagonal, associated p-values abovediagonal. BBe: Barataria Bay estuarine, BBi: Barataria Bay
island, q-value: probability of cluster membership
Rosel et al.: Dolphin genetic stock assignment
estuarine populations, all above the 90% thresholdrecommended for confidence in the mixture analysis.Analysis of mixture proportions for the stranded sam-ples using the 3-population scenario returned pro-portions of 6.69% Coastal (95% CI: 0.010−0.153) and93.31% Barataria Bay (summing BBe and BBi).
DISCUSSION
Fully understanding the impacts of mortalityevents on wild populations is critical for accurateassessment of the population-level impacts of suchevents. In cases where multiple populations exist inclose proximity and a mortality event is broadly dis-tributed, it can be difficult to identify the populationof origin of carcasses. The 2010−2014 cetacean UMEin the northern GoM provides an excellent example
of just such a case. More than 1100 cetaceans, prima-rily common bottlenose dolphins, died during thisevent (Litz et al. 2014). Gulf-wide, the number of pos-sible source populations for these strandings is quitehigh and includes many small, genetically distinctestuarine populations. Here we tested moleculargenetic assignment methods and their ability to iden-tify the population source of dead stranded commonbottlenose dolphins recovered in the Barataria Bayregion of southeastern Louisiana during this UME.By focusing on strandings in this region, we wereable to sample the most likely source populations. Ifsuccessful, assignment tests could be an ad ditionaltool for investigating and assessing population-levelimpacts of marine mammal UMEs.
Genetic assignment tests can be sensitive to incom-plete sampling of baseline populations as well asbaseline populations composed of individuals from
229
Fig. 3. Geographic sampling location of dolphins Tursiops truncatus used in STRUCTURE runs using Barataria Bay plus Coastalbiopsy samples together. Samples color-coded for (A) K = 2 STRUCTURE clusters and (B) K = 3 STRUCTURE clusters and a q-valuecutoff of q ≥ 0.6 (left panels) or q ≥ 0.8 (right panels) for identifying clusters. K: number of clusters, q-value: probability of
cluster membership. The 20 m isobath is shown
Endang Species Res 33: 221–234, 2017
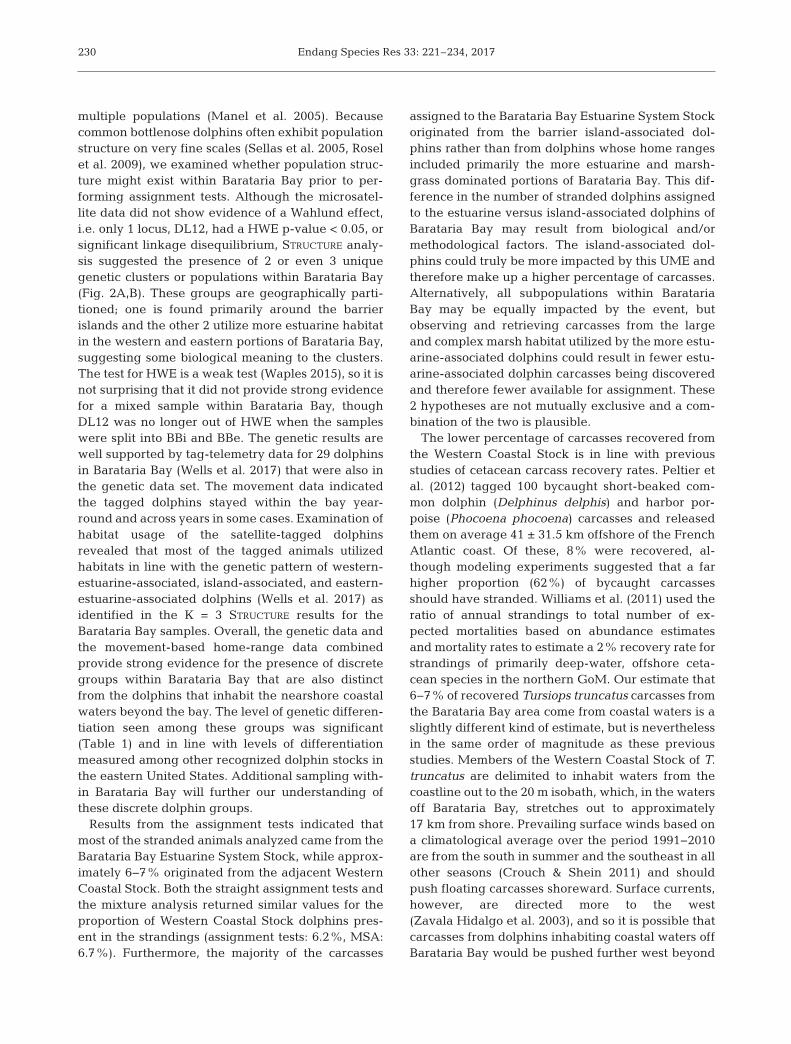
multiple populations (Manel et al. 2005). Becausecommon bottlenose dolphins often exhibit populationstructure on very fine scales (Sellas et al. 2005, Roselet al. 2009), we examined whether population struc-ture might exist within Barataria Bay prior to per-forming assignment tests. Although the microsatel-lite data did not show evidence of a Wahlund effect,i.e. only 1 locus, DL12, had a HWE p-value < 0.05, orsignificant linkage disequilibrium, STRUCTURE analy-sis suggested the presence of 2 or even 3 uniquegenetic clusters or populations within Barataria Bay(Fig. 2A,B). These groups are geographically parti-tioned; one is found primarily around the barrierislands and the other 2 utilize more estuarine habitatin the western and eastern portions of Barataria Bay,suggesting some biological meaning to the clusters.The test for HWE is a weak test (Waples 2015), so it isnot surprising that it did not provide strong evidencefor a mixed sample within Barataria Bay, thoughDL12 was no longer out of HWE when the sampleswere split into BBi and BBe. The genetic results arewell supported by tag-telemetry data for 29 dolphinsin Barataria Bay (Wells et al. 2017) that were also inthe genetic data set. The movement data indicatedthe tagged dolphins stayed within the bay year-round and across years in some cases. Examination ofhabitat usage of the satellite-tagged dolphinsrevealed that most of the tagged animals utilizedhabitats in line with the genetic pattern of western-estuarine-associated, island-associated, and eastern-estuarine-associated dolphins (Wells et al. 2017) asidentified in the K = 3 STRUCTURE results for theBarataria Bay samples. Overall, the genetic data andthe movement-based home-range data combinedprovide strong evidence for the presence of discretegroups within Barataria Bay that are also distinctfrom the dolphins that inhabit the nearshore coastalwaters beyond the bay. The level of genetic differen-tiation seen among these groups was significant(Table 1) and in line with levels of differentiationmeasured among other recognized dolphin stocks inthe eastern United States. Additional sampling with -in Barataria Bay will further our understanding ofthese discrete dolphin groups.
Results from the assignment tests indicated thatmost of the stranded animals analyzed came from theBarataria Bay Estuarine System Stock, while approx-imately 6−7% originated from the adjacent WesternCoastal Stock. Both the straight assignment tests andthe mixture ana lysis returned similar values for theproportion of Western Coastal Stock dolphins pres-ent in the strandings (as signment tests: 6.2%, MSA:6.7%). Furthermore, the majority of the carcasses
assigned to the Barataria Bay Estuarine System Stockoriginated from the barrier island-associated dol-phins rather than from dolphins whose home rangesincluded primarily the more estuarine and marsh-grass dominated portions of Barataria Bay. This dif-ference in the number of stranded dolphins assignedto the estuarine versus island-associated dolphins ofBarataria Bay may result from biological and/ormethodological factors. The island-associated dol-phins could truly be more impacted by this UME andtherefore make up a higher percentage of carcasses.Alternatively, all subpopulations within Bara tariaBay may be equally impacted by the event, butobserving and retrieving carcasses from the largeand complex marsh habitat utilized by the more estu-arine-associated dolphins could result in fewer estu-arine-associated dolphin carcasses being discoveredand therefore fewer available for assignment. These2 hypotheses are not mutually exclusive and a com-bination of the two is plausible.
The lower percentage of carcasses recovered fromthe Western Coastal Stock is in line with previousstudies of cetacean carcass recovery rates. Peltier etal. (2012) tagged 100 bycaught short-beaked com-mon dolphin (Delphinus delphis) and harbor por-poise (Phocoena phocoena) carcasses and releasedthem on average 41 ± 31.5 km offshore of the FrenchAtlantic coast. Of these, 8% were recovered, al -though modeling experiments suggested that a farhigher proportion (62%) of bycaught carcassesshould have stranded. Williams et al. (2011) used theratio of annual strandings to total number of ex -pected mortalities based on abundance estimatesand mortality rates to estimate a 2% recovery rate forstrandings of primarily deep-water, offshore ceta -cean species in the northern GoM. Our estimate that6−7% of recovered Tursiops truncatus carcasses fromthe Barataria Bay area come from coastal waters is aslightly different kind of estimate, but is neverthelessin the same order of magnitude as these previousstudies. Members of the Western Coastal Stock of T.truncatus are delimited to inhabit waters from thecoastline out to the 20 m isobath, which, in the watersoff Barataria Bay, stretches out to approximately17 km from shore. Prevailing surface winds based ona climatological average over the period 1991−2010are from the south in summer and the southeast in allother seasons (Crouch & Shein 2011) and shouldpush floating carcasses shoreward. Surface currents,however, are directed more to the west(Zavala Hidalgo et al. 2003), and so it is possible thatcarcasses from dolphins inhabiting coastal waters offBarataria Bay would be pushed further west beyond
230
Rosel et al.: Dolphin genetic stock assignment
our study area. Furthermore, with the long peninsulaof the Mississippi Delta jutting south just east of thearea we sampled, the source for Coastal Stock car-casses drifting in from the east seems limited.
In addition to the uncertainty in the percentage ofWestern Coastal Stock carcasses that would make itto the beaches, the genetic analysis performed heremay also im part a downward-biased estimate ofcoastal assignments. The sample size for the West-ern Coastal Stock baseline sample was relativelysmall. Population allele frequency estimates maytherefore not be as robust as is desirable for assign-ment tests. This possibility is borne out in the self-assignment tests performed in ONCOR. While 97and 98% of the estuarine and island-associated dol-phins, respectively, in the baseline samples werecorrectly assigned to their population of origin, thisvalue was 83% for the Western Coastal Stock base-line sample. Seeb et al. (2000, 2007) suggested thatmean correct assignments of ≥90% indicate highlyidentifiable groups, so confidence in the Baratariabaseline samples is high. The lower value for theWestern Coastal Stock baseline sample suggeststhat assignment confidence is still adequate but thebaseline sample may not have been thoroughlysampled. The smaller sample size for the WesternCoastal Stock baseline would bear that out. In addi-tion, the degree of genetic divergence detectedbetween the coastal and island-associated popula-tions is relatively low (FST = 0.023). Individualassignment test methods are more accurate withincreasing divergence levels (Araujo et al. 2014),though good assignment accuracy has been regu-larly reported for FST values as low as 0.01 (Araujoet al. 2014). The relatively low divergence, coupledwith the small baseline sample for the WesternCoastal Stock, may result in some coastal animalshaving been assigned to the island-associated Bara -taria Bay population. Use of the MSA option inONCOR should help minimize some of this bias,however. Use of mixture models integrates all theinformation available in the baseline as well as inthe mixture sample, and, since they do not requireestimating assignments for each individual in themixture, they do not carry with them the uncertaintyand error inherent in each of those assignments,resulting in improved performance over classicalassignment tests (Koljonen et al. 2005, Manel et al.2005, Moran et al. 2014). Moreover, they are lessprone to over estimating assignment power (Ander-son et al. 2008, Anderson 2010). Interestingly, forour system, both methods produced similar val-ues — the Western Coastal Stock contributed ~6−7%
of the stranded animals we analyzed. Finally, asmentioned in ‘Re sults’, GeneClass2 excluded 2strandings in the first step of the assignment analy-sis. These animals may have come from an unsam-pled baseline population, for example the Continen-tal Shelf Stock of common bottlenose dolphinsfound further offshore. Alternatively, they may haveoriginated from the Western Coastal Stock, but theiralleles may not have been well represented in theWestern Coastal Stock baseline, given its smallersize, and were therefore excluded.
It is important to recognize that the number of car-casses we have assigned to the 2 stocks is not an esti-mate of the total number of animals that have diedfrom each stock during the time of the UME, only thenumber that we analyzed. The number of strandeddolphins available for analysis is a function of multi-ple biological and physical factors, including abun-dance and mortality rates of each stock, carcassbuoyancy or sinking rate, size, and decompositionrate, scavenging rate, distance from shore at time ofdeath, drift rates, wind and current direction andstrength (see Peltier et al. 2012 for a full discussion,Wells et al. 2015). Additionally, carcass detectionrates, which are influenced by the level of searcheffort and the complexity of the habitat and ease withwhich carcasses can be detected, can influence thenumber of stranded samples available for analysis.Finally, for this study, only carcasses that yieldedDNA of sufficient quality for genotyping wereincluded in the analysis. Nevertheless, knowledge ofthe relative ratio of strandings of estuarine to coastaldolphins can be used in a larger modeling frameworkto estimate total dolphin mortality during this UME(Thomas et al. 2017, this Theme Section). Overall, thegenetic as signment test method showed significantpromise for assessing impacts of mortality events ondolphin populations. Keys to success for futureevents include a good understanding of populationstructure for, and adequate and appropriate sam-pling of, the potential source populations that may berepresented in the recovered mortalities, and arobust and timely stranding response effort.
Acknowledgements. We thank the biopsy and capture-release field crews and volunteers who were involved in col-lecting samples and Louisiana marine mammal strandingnetwork members involved in carcass recovery and sam-pling, particularly the Louisiana Department of Wildlife andFisheries, including the Fisheries Research Lab Staff, andstaff from the Audubon Nature Institute, including SuzanneSmith, who obtained samples from carcasses duringnecropsy. Additionally, we thank NMFS Southeast FisheriesScience Center stranding program staff, including Blair
231
Endang Species Res 33: 221–234, 2017
Mase-Guthrie, Elizabeth Stratton, and Lauren Noble, andErin Fougeres of the Southeast Regional Office, all of whomcoordinated the stranding response and sample collectionduring the unusual mortality event. The analysis was signif-icantly improved through discussion and suggestions fromRobin Waples, NMFS Northwest Fisheries Science Center,and comments from 2 anonymous reviewers. Samples werecollected under NMFS MMPA permit nos. 779-1633 and932-1905/MA-009526. Response to cetacean strandingevents is conducted by Marine Mammal Stranding Net-works (MMSN) authorized under Section 112c (StrandingAgreements from the NMFS regional offices) or Section109h (Federal, State, or local government officials) of theMarine Mammal Protection Act. This work was part of theDWH NRDA being conducted cooperatively among NOAA,other federal and state Trustees, and BP PLC. The findingsand conclusions in this paper are those of the authors and donot necessarily represent the view of NOAA or of any othernatural resource Trustee for the BP/Deepwater HorizonNRDA.
LITERATURE CITED
Aguilar A, Borrell A (1994) Abnormally high polychlorinatedbiphenyl levels in striped dolphins (Stenella coeru -leoalba) affected by the 1990−1992 Mediterranean epi-zootic. Sci Total Environ 154: 237−247
Anderson EC (2010) Assessing the power of informativesubsets of loci for population assignment: standard meth-ods are upwardly biased. Mol Ecol Resour 10: 701−710
Anderson EC, Waples RS, Kalinowski ST (2008) An im -proved method for predicting the accuracy of geneticstock identification. Can J Fish Aquat Sci 65: 1475−1486
Araujo HA, Candy JR, Beacham TD, White B, Wallace C(2014) Advantages and challenges of genetic stock iden-tification in fish stocks with low genetic resolution. TransAm Fish Soc 143: 479−488
Baird RW, Gorgone AM, McSweeney DJ, Ligon AD and oth-ers (2009) Population structure of island-associated dol-phins: evidence from photo-identification of commonbottlenose dolphins (Tursiops truncatus) in the mainHawaiian Islands. Mar Mamm Sci 25: 251−274
Balmer BC, Wells RS, Nowacek SM, Nowacek DP and oth-ers (2008) Seasonal abundance and distribution patternsof common bottlenose dolphins (Tursiops truncatus) nearSt. Joseph Bay, Florida, USA. J Cetacean Res Manag 10: 157−167
Bassos-Hull K, Perrtree R, Shepard C, Schilling S and others(2013) Long-term site fidelity and seasonal abundanceestimates of common bottlenose dolphins (Tursiops trun-catus) along the southwest coast of Florida and responsesto natural perturbations. J Cetacean Res Manag 13: 19−30
Bossart GD (2011) Marine mammals as sentinel species foroceans and human health. Vet Pathol 48: 676−690
Briski E, Ghabooli S, Bailey SA, MacIsaac HJ (2012) Inva-sion risk posed by macroinvertebrates transported inships’ ballast tanks. Biol Invasions 14: 1843−1850
Copping A, Hanna L, Van Cleve B, Blake K, Anderson R(2015) Environmental Risk Evaluation System — anapproach to ranking risk of ocean energy developmenton coastal and estuarine environments. Estuar Coasts38(Suppl 1): 287−302
Cornuet JM (1999) New methods employing multilocusgenotypes to select or exclude populations as origins of
individuals. Genetics 153: 1989−2000Crouch J, Shein K (2011) Prevailing winds — seasonal aver-
ages. In: Gulf of Mexico data atlas. National Coastal DataDevelopment Center, Stennis Space Center, MS. www.ncddc.noaa.gov/website/DataAtlas/ atlas.htm (accessedon 29 January 2016)
DWH NRDA (Deepwater Horizon Natural Resource Dam-age Assessment) Trustees (2016) Deepwater Horizon oilspill: final programmatic damage assessment and re -storation plan and final programmatic environmentalimpact statement. www.gulfspillrestoration.noaa. gov/restoration-planning/gulf-plan
Evanno G, Regnaut S, Goudet J (2005) Detecting the num-ber of clusters of individuals using the software STRUC-TURE: a simulation study. Mol Ecol 14: 2611−2620
Excoffier L, Lischer HEL (2010) Arlequin suite ver 3.5: a newseries of programs to perform population genetics analy-ses under Linux and Windows. Mol Ecol Resour 10: 564−567
Fazioli KL, Hofmann S, Wells RS (2006) Use of Gulf of Mexi -co coastal waters by distinct assemblages of bottlenosedolphins (Tursiops truncatus). Aquat Mamm 32: 212−222
Gorgone A, Haase P, Griffith E, Hohn A (2008) Modelingresponse of target and nontarget dolphins to biopsy dart-ing. J Wildl Manag 72: 926−932
Gulland FMD, Hall AJ (2007) Is marine mammal healthdeteriorating? Trends in the global reporting of marinemammal disease. EcoHealth 4: 135−150
Guo SW, Thompson EA (1992) Performing the exact testof Hardy-Weinberg proportion for multiple alleles. Biometrics 48: 361−372
Hall A, Law R, Wells D, Harwood J and others (1992)Organochlorine levels in common seals (Phoca vitulina)which were victims and survivors of the 1988 phocinedistemper epizootic. Sci Total Environ 115: 145−162
Hammond JA, Hall AJ, Dyrynda EA (2005) Comparison ofpolychlorinated biphenyl (PCB) induced effects oninnate immune functions in harbour and grey seals.Aquat Toxicol 74: 126−138
Hess JE, Whiteaker JM, Fryer JK, Narum SR (2014) Monitor-ing stock-specific abundance, run timing, and straying ofchinook salmon in the Columbia River using geneticstock identification (GSI). N Am J Fish Manage 34: 184−201
Hiddink JG, Johnson AF, Kingham R, Hinz H (2011) Couldour fisheries be more productive? Indirect negativeeffects of bottom trawl fisheries on fish condition. J ApplEcol 48: 1441−1449
Hoelzel AR, Dahlheim M, Stern SJ (1998) Low genetic vari-ation among killer whales Orcinus orca in the EasternNorth Pacific and genetic differentiation between for -aging specialists. J Hered 89: 121−128
Holm S (1979) A simple sequentially rejective multiple testprocedure. Scand J Stat 6: 65−70
Hubard CW, Maze-Foley K, Mullin KD, Schroeder WW(2004) Seasonal abundance and site fidelity of bottlenosedolphins (Tursiops truncatus) in Mississippi Sound.Aquat Mamm 30: 299−310
Ivashchenko YV, Clapham PJ (2014) Too much is neverenough: the cautionary tale of Soviet illegal whaling.Mar Fish Rev 76: 1−21
Kalinowski ST, Manlove KR, Taper ML (2007) ONCOR: acomputer program for genetic stock identification. Mon-tana State University, Bozeman, MT
Koljonen ML, Pella JJ, Masuda M (2005) Classical individ-
232
Rosel et al.: Dolphin genetic stock assignment
ual assignments versus mixture modeling to estimatestock proportions in Atlantic salmon (Salmo salar)catches from DNA microsatellite data. Can J Fish AquatSci 62: 2143−2158
Krützen M, Valsecchi E, Connor RC, Sherwin WB (2001)Characterization of microsatellite loci in Tursiops adun-cus. Mol Ecol Notes 1: 170−172
Lance SL, Love CN, Nunziata SO, O’Bryhim JR, Scott DE,Flynn RW, Jones KL (2013) 32 species validation of a newIllumina paired-end approach for the development ofmicrosatellites. PLOS ONE 8: e81853
Litz JA, Baran MA, Bowen-Stevens SR, Carmichael RH andothers (2014) Review of historical unusual mortalityevents (UMEs) in the Gulf of Mexico (1990–2009): pro-viding context for the multi-year northern Gulf of Mexicocetacean UME declared in 2010. Dis Aquat Org 112: 161−175
Manel S, Gaggiotti OE, Waples RS (2005) Assignment meth-ods: matching biological questions with appropriatetechniques. Trends Ecol Evol 20: 136−142
Martien KK, Baird RW, Hedrick NM, Gorgone AM and oth-ers (2012) Population structure of island-associated dol-phins: evidence from mitochondrial and microsatellitemarkers for common bottlenose dolphins (Tursiops trun-catus) around the main Hawaiian Islands. Mar MammSci 28: E208−E232
McDonald TL, Hornsby FE, Speakman TR, Zolman ES andothers (2017) Survival, density, and abundance of com-mon bottlenose dolphins in Barataria Bay (USA) follow-ing the Deepwater Horizon oil spill. Endang Species Res33:193–209
Mengerink KJ, Van Dover CL, Ardron J, Baker M and others(2014) A call for deep-ocean stewardship. Science 344: 696−698
Moran P, Bromaghin JF, Masuda M (2014) Use of geneticdata to infer population-specific ecological and pheno-typic traits from mixed aggregations. PLOS ONE 9: e98470
Murawski SA (2010) Rebuilding depleted fish stocks: thegood, the bad, and, mostly, the ugly. ICES J Mar Sci 67: 1830−1840
NOAA (National Oceanic and Atmospheric Administration)(2013) The national coastal population report: popula-tions trends from 1970 to 2020. NOAA State of the CoastReport Series. NOAA, Department of Commerce, andUS Census Bureau. http://oceanservice.noaa. gov/ facts/coastal- population-report.pdf
Paetkau D, Slade R, Burden M, Estoup A (2004) Geneticassignment methods for the direct, real-time estimationof migration rate: a simulation-based exploration of accu-racy and power. Mol Ecol 13: 55−65
Park SDE (2001) Trypanotolerance in West African cattleand the population genetic effects of selection. PhD dis-sertation, University of Dublin
Peakall R, Smouse PE (2006) GENALEX 6: genetic analysisin Excel. Population genetic software for teaching andresearch. Mol Ecol Notes 6: 288−295
Peltier H, Dabin W, Daniel P, Van Canneyt O, Dorémus G,Huon M, Ridoux V (2012) The significance of strandingdata as indicators of cetacean populations at sea: model -ling the drift of cetacean carcasses. Ecol Indic 18: 278−290
Piry S (2004) GeneClass2: a software for genetic assignmentand first-generation migrant detection. J Hered 95: 536−539
Pritchard JK, Stephens M, Donnelly P (2000) Inference of
population structure using multilocus genotype data.Genetics 155: 945−959
Pritchard JK, Wen X, Falush D (2009) Documentation forstructure software: version 2.3. http://pritchardlab.stanford.edu/structure_software/release_versions/v2.3.4/structure_doc.pdf
Ramirez-Llodra E, Tyler PA, Baker MC, Bergstad OA andothers (2011) Man and the last great wilderness: humanimpact on the deep sea. PLOS ONE 6: e22588
Rannala B, Mountain JL (1997) Detecting immigration byusing multilocus genotypes. Proc Natl Acad Sci USA 94: 9197−9201
Reif JS (2011) Animal sentinels for environmental and publichealth. Public Health Rep 126: 50−57
Rooney AP, Merritt DB, Derr JN (1999) Microsatellite diver-sity in captive bottlenose dolphins (Tursiops truncatus).J Hered 90: 228−231
Rosel PE, France SC, Wang JY, Kocher TD (1999) Geneticstructure of harbour porpoise, Phocoena phocoena, pop-ulations in the Northwest Atlantic based on mitochondr-ial and nuclear markers. Mol Ecol 8: S41−S54
Rosel PE, Forgetta V, Dewar K (2005) Isolation and charac-terization of twelve polymorphic microsatellite markersin bottlenose dolphins (Tursiops truncatus). Mol EcolNotes 5: 830−833
Rosel PE, Hansen L, Hohn AA (2009) Restricted dispersal ina continuously distributed marine species: common bot-tlenose dolphins Tursiops truncatus in coastal waters ofthe western North Atlantic. Mol Ecol 18: 5030−5045
Rousset F (2008) GENEPOP’007: a complete re-implementa-tion of the GENEPOP software for Windows and Linux.Mol Ecol Resour 8: 103−106
Schwacke LH, Voit EO, Hansen LJ, Wells RS, Mitchum GB,Hohn AA, Fair PA (2002) Probabilistic risk assessment ofthe reproductive effects of polychlorinated biphenyls onbottlenose dolphins (Tursiops truncatus) from the south-east United States coast. Environ Toxicol Chem 21: 2752−2764
Schwacke LH, Zolman ES, Balmer BC, De Guise S and others (2012) Anaemia, hypothyroidism and immunesuppression associated with polychlorinated biphenylexposure in bottlenose dolphins (Tursiops truncatus).Proc R Soc B 279: 48−57
Schwacke LH, Smith CR, Townsend FI, Wells RS and others(2014) Health of common bottlenose dolphins (Tursiopstruncatus) in Barataria Bay, Louisiana, following theDeepwater Horizon oil spill. Environ Sci Technol 48: 93−103
Seeb LW, Habicht C, Templin WD, Tarbox KE, Davis RZ,Brannian LK, Seeb JE (2000) Genetic diversity of sockeyesalmon of Cook Inlet, Alaska, and its application to man-agement of populations affected by the Exxon Valdez oilspill. Trans Am Fish Soc 129: 1223−1249
Seeb L, Antonovich A, Banks MA, Beacham T and others(2007) Development of a standardized DNA database forChinook salmon. Fisheries (Bethesda, MD) 32: 540−552
Sellas AB, Wells RS, Rosel PE (2005) Mitochondrial andnuclear DNA analyses reveal fine scale geographicstructure in bottlenose dolphins (Tursiops truncatus) inthe Gulf of Mexico. Conserv Genet 6: 715−728
Shane SH (1977) The population biology of the Atlantic bot-tlenose dolphin, Tursiops truncatus, in the Aransas Passarea of Texas. Master’s thesis, Texas A&M University,College Station, TX
Sinclair C, Sinclair J, Zolman E, Martinez A, Balmer B, Barry
233
Endang Species Res 33: 221–234, 2017
K (2015) Remote biopsy sampling field procedures forcetaceans used during the Natural Resource DamageAsessment of the MSC252 Deepwater Horizon oil spill.NOAA Tech Memo NMFS-SEFSC-670
Thomas L, Booth CG, Rosel PE, Hohn A, Litz J, SchwackeLH (2017) Where were they from? Modelling the sourcestock of dolphins stranded after the Deepwater Horizonoil spill using genetic and stable isotope data. EndangSpecies Res 33:253–264
United States Environmental Protection Agency (2012)National coastal condition report IV. EPA 842-R-10-003.Office of Research and Development and Office ofWater, Washington, DC
Urian KW, Hofmann S, Wells RS, Read AJ (2009) Fine-scalepopulation structure of bottlenose dolphins (Tursiopstruncatus) in Tampa Bay, Florida. Mar Mamm Sci 25: 619−638
Valsecchi E, Amos W (1996) Microsatellite markers for thestudy of cetacean populations. Mol Ecol 5: 151−156
Van Oosterhout C, Hutchinson WF, Wills DPM, Shipley P(2004) Micro-checker: software for identifying and cor-recting genotyping errors in microsatellite data. Mol EcolNotes 4: 535−538
Venn-Watson S, Colegrove KM, Litz J, Kinsel M and others(2015) Adrenal gland and lung lesions in Gulf of Mexicocommon bottlenose dolphins (Tursiops truncatus) founddead following the Deepwater Horizon oil spill. PLOSONE 10: e0126538
Vollmer NL (2011) Population structure of common bottle-nose dolphins in coastal and offshore waters of the Gulfof Mexico revealed by genetic and environmental analy-sis. PhD dissertation, University of Louisiana at Lafayette
Vollmer NL, Rosel PE (2013) A review of common bottlenosedolphins (Tursiops truncatus truncatus) in the northernGulf of Mexico: population biology, potential threats, andmanagement. Southeast Nat 12: 1−43
Waits LP, Luikart G, Taberlet P (2001) Estimating the prob -ability of identity among genotypes in natural popula-tions: cautions and guidelines. Mol Ecol 10: 249−256
Waples RS (2015) Testing for Hardy-Weinberg proportions: Have we lost the plot? J Hered 106: 1−19
Waring GT, Josephson E, Maze-Foley K, Rosel PE (2015)U.S. Atlantic and Gulf of Mexico marine mammal stockassessments — 2014. NOAA Tech Memo NMFS-NE-231
Weir BS, Cockerham CC (1984) Estimating F-statisticsfor the analysis of population structure. Evolution 38: 1358−1370
Wells RS, Scott MD, Irvine AB (1987) The social structure offree-ranging bottlenose dolphins. In: Genoways H (ed)Current mammalogy, Vol 1. Plenum Press, New York,NY, p 247−305
Wells RS, Rhinehart HL, Hansen LJ, Sweeney JC and others(2004) Bottlenose dolphins as marine ecosystem senti -nels: developing a health monitoring system. EcoHealth1: 246−254
Wells RS, Allen JB, Lovewell G, Gorzelany J, Delynn RE,Fauquier DA, Barros NB (2015) Carcass recovery ratesfor resident bottlenose dolphins in Sarasota Bay, Florida.Mar Mamm Sci 31: 355−368
Wells RS, Schwacke LH, Rowles TK, Balmer BC and others(2017) Ranging patterns of common bottlenose dolphinsTursiops truncatus in Barataria Bay, Louisiana, followingthe Deepwater Horizon oil spill. Endang Species Res33:159–180
Williams R, Gero S, Bejder L, Calambokidis J and others(2011) Underestimating the damage: interpreting ceta -cean carcass recoveries in the context of the DeepwaterHorizon/BP incident. Conserv Lett 4: 228−233
Zavala Hidalgo J, Morey SL, O’Brien JJ (2003) Seasonal circulation on the western shelf of the Gulf of Mexicousing a high resolution numerical model. J Geophys ResOceans 108: 3389
234
Editorial responsibility: Michael Moore (Guest Editor), Woods Hole, Massachusetts, USA
Submitted: March 17, 2016; Accepted: October 20, 2016Proofs received from author(s): January 11, 2017