Generalizability and Dependability Coefficients - Conservancy

International Journal of Aviation, International Journal of Aviation,
Aeronautics, and Aerospace Aeronautics, and Aerospace
Volume 6 Issue 5 Article 2
2019
Generalizability of Effect Sizes Within Aviation Research: More Generalizability of Effect Sizes Within Aviation Research: More
Samples Are Needed Samples Are Needed
Rian Mehta Florida Institute of Technology - Melbourne, [email protected] Stephen Rice ERAU, [email protected] Scott Winter Embry-Riddle Aeronautical University, [email protected] Tyler Spence San Jose State University, [email protected] Maarten Edwards Florida Institute of Technology, [email protected] Karla Candelaria-Oquendo ERAU, [email protected]
Follow this and additional works at: https://commons.erau.edu/ijaaa
Part of the Applied Statistics Commons
Scholarly Commons Citation Scholarly Commons Citation Mehta, R., Rice, S., Winter, S., Spence, T., Edwards, M., & Candelaria-Oquendo, K. (2019). Generalizability of Effect Sizes Within Aviation Research: More Samples Are Needed. International Journal of Aviation, Aeronautics, and Aerospace, 6(5). https://doi.org/10.15394/ijaaa.2019.1404
This Article is brought to you for free and open access by the Journals at Scholarly Commons. It has been accepted for inclusion in International Journal of Aviation, Aeronautics, and Aerospace by an authorized administrator of Scholarly Commons. For more information, please contact [email protected].

The goal of inferential statistics is to generalize findings from a sample to the overall
population; however, this becomes difficult under circumstances where one cannot gather a truly
random sample of participants from the population. In the field of aviation, it is often impossible
to get a proper random sample from populations such as pilots or consumers; therefore,
convenience samples have become the go-to sampling method. Nonetheless, a convenience sample
does not have as much generalizability as a random sample (Marshall, 1996); thus, researchers
must be mindful when inferring population parameters from this type of sample statistics. One
such statistic is the effect size. Effect size is an important factor in aviation research, because, in
addition to directionality, a researcher wants to know the degree to which an independent variable
affects the dependent variable. In some cases, a significant p-value may be meaningless if the
effect size is very small. Effect size, which unlike p-value is independent of sample size, is a tool
that helps researchers and readers understand the practicality of findings (Ellis & Steyn, 2003;
Sawyer, 1981; Schimmack, 2012). Researchers should report effect sizes so that their audience has
a more complete picture, enabling them to make a more informed choice about the value and
applications of the conclusions.
It is naturally tempting to assume an effect size from a sample can be directly applied to
the population at large. For example, if one conducts a study at a Midwestern flight school, one
may want to infer that these findings would generalize to the overall population of all US pilots,
or even pilots worldwide, when in fact this can be unreliable, especially when using a convenience
sample. The sample used might not match demographics in other samples or the population at
large, and these confounding variables may be instead what caused the effect observed. Brodaty,
et al. (2014) compared results of cognitive performance from a convenience sample to those of a
population-based sample, and found significant differences between cognitive performances
depending on the sample, in addition to demographic differences, concluding that sampling bias
should be considered when reporting findings. They also found differences in the effect sizes
between samples on a number of variables. Alternatively, there may not be confounding variables
at play, but rather, the effect size may be overly large or small depending on the sample (Peterson
& Merunka, 2014). In such cases, further or wider research should be conducted using a variety of
samples in order to provide a more accurate estimate of the population effect size. New and emerging technologies are facilitating researchers’ access to more participants,
enabling them to reach larger sample sizes and more diversity. This technology is spreading fast
due to its ease of use for both researchers and participants. Thus, it is important to ensure that these
methods are appropriate and yield valid data upon which reliable conclusions can be inferred. The
purpose of this study is to show that gathering convenience samples from a variety of locations
can result in very different effect sizes due to demographic differences, even as the direction of the
relationship between the variables remains constant across samples. Data was collected from four
different locations, including one online sample, and the data obtained show that differences
between samples can lead to very different inferences of effect sizes.
Literature Review
External Validity
Ary, Jacobs, Sorensen and Razavieh (2010) defined the concept of external validity as “the
extent to which the findings of a study can be generalized to other subjects, settings, and
treatments,” (p. 292). Careful consideration of this concept is crucial to the scientific method as,
1
Mehta et al.: Samples Study
Published by Scholarly Commons, 2019

despite the inherent uniqueness of a given investigation and its sample, the goal of such an
investigation is typically the application of its findings to a larger target population (Ary, Jacobs,
Sorensen, & Razavieh, 2010). Levitt and List (2007) discussed the concept in the context of
experimental economics and psychology. They emphasized the importance of evaluating the
applicability of laboratory findings to real-world phenomena based on detailed considerations of
confounding factors that may influence the data collected from investigations in either setting.
Despite hypothesized concerns, empirical investigations which correlate laboratory and field data
suggested that the findings of the two data collection methods are consistent, particularly in the
context of industrial-organizational psychology (Anderson, Lindsay, & Bushman, 1999; Mitchell,
2012). In spite of differing in their effect sizes, the data collection methods demonstrated
convergence with respect to directionality and, therefore, suggest that similar conclusions can be
made despite the fundamental differences in study design (Anderson, Lindsay, & Bushman, 1999;
Mitchell, 2012).
Although these studies examined the relationship between laboratory and traditional field
data, the concept of using consistent directionality in effect size is certainly transferable to the
evaluation of emerging data collection methods against traditional laboratory and field data. Given
the importance of the concept of external validity to both the creators and curators of academic
research, empirical evaluation of data sources must take place in order to ensure the
generalizability of findings based on the use of those sources (Glasgow et al., 2006; Steckler &
McLeroy, 2008). This includes the objective evaluation of crowdsourced convenience samples
such as Amazon’s Mechanical Turk.
Convenience Sampling
The assurance of the external validity of a given research effort is logically preceded by
the assurance of the representativeness of its sample (Ary, Jacobs, Sorensen, & Razavieh, 2010;
Bornstein, Jager, & Putnick, 2013; Ferguson, 2004). The concern over sample representativeness
stems from the potential influence of factors that are present in the sample that may, or may not,
carry over to the target population. Consequently, the lack of representativeness of a given sample
is liable to produce conclusions that are, at best, reportable only in reference to the sample, and, at
worst, erroneously reported as existing in the population when no such effect is truly present (Ary,
Jacobs, Sorensen, & Razavieh, 2010; Ferguson, 2004). The traditional remedy to the issue of
sample representativeness is that of probability sampling (Ary, Jacobs, Sorensen, & Razavieh,
2010; Bornstein, Jager, & Putnick, 2013; Ferguson, 2004; Grafström & Schelin, 2014). However,
the process of probability sampling has been purported to be resource intensive to the point of
impracticality for many researchers (Bornstein, Jager, & Putnick, 2013; Landers & Behrend, 2015;
Leiner, 2014). Convenience sampling, therefore, becomes the practical alternative (Landers &
Behrend, 2015), with effect size reporting in addition to p-value as a measure to illustrate the
practicality of findings (Ellis & Steyn, 2003; Fritz, Morris, & Richler, 2017).
Jager, Putnick and Bornstein (2017) proposed the use of homogeneous convenience
sampling as a means of considerably mitigating the limitations of conventional convenience
sampling techniques. This strategy functions on the purposeful limitation of the sample to an
equally limited definition of the target population (Jager, Putnick, & Bornstein, 2017). Conversely,
Staines (2008) suggested the use of multiple independent convenience samples as a means of
supporting external validity. This approach, however, is dependent on “the number,
representativeness, and heterogeneity” of available convenience samples (Hunter, 2001; Staines,
2
International Journal of Aviation, Aeronautics, and Aerospace, Vol. 6 [2019], Iss. 5, Art. 2
https://commons.erau.edu/ijaaa/vol6/iss5/2DOI: https://doi.org/10.15394/ijaaa.2019.1404

2008). Brandt and colleagues (2014) argue that replication is necessary to determine an accurate
effect size that can be applied to the population, in addition to firmly establishing an effect.
Although cognizant and cautionary of its theoretical shortcomings, Landers and Behrend
(2015) illustrated the potential for the production of valid data from these samples, so long as
researchers consider the possible confounding effects of unique sample characteristics. Nelson,
Wooditch, and Dario (2015) point out that “non-randomized studies not only yield different results
from randomized control trials, but also larger effect sizes.” Hunter (2001) argues that differences
in studies such as quality, random error, and moderator variables can lead to differences in effect
sizes.
Schimmack (2012) also found that effect sizes can vary significantly across samples due
to many reasons including sample size, bias, and others, and that this should be considered when
estimating population effect sizes. Furthermore, he argues that samples yielding non-significant
results should also be included in estimates of population effect size, since these can be impactful.
In an analysis of data from 48 convenience samples, Peterson and Merunka (2014) found that there
were “substantively significant differences in both direction and magnitude” among them,
concluding that replication of any given study across multiple samples of different demographics
is necessary in order to make a better claim of generalizability of both relationship and effect size
results. In fact, they suggested journals demand at least one replication (two samples) within any
study for publication. Hunter (2001) suggests at least 10 replication studies for good measure, but
insists that estimating an accurate effect size would require hundreds to thousands of replications
depending on sample domain.
Amazon Mechanical Turk
Amazon Mechanical Turk (MTurk) is a distributed online labor platform that has been
applied by researchers as a means of collecting empirical data from a global convenience sample
of online workers (Chandler & Shapiro, 2016; Sheehan, 2018). The attractiveness of the platform
has been argued to lie in its accessibility, cost effectiveness and temporal efficiency (Buhrmester,
Kwang, & Gosling, 2011; Sheehan, 2018; Stritch, Pedersen, & Taggart, 2017). Furthermore, some
reviews of the platform highlighted the increased diversity of accessible participants over
traditional data collection methods (Buhrmester, Kwang, & Gosling, 2011; Landers & Behrend,
2015; Smith, Sabat, Martinez, Weaver, & Xu, 2015).
These advantages however, have been paired with disadvantages that are centered on the
quality and generalizability of the data (Chandler & Shapiro, 2016). Specific manifestations of
these limitations include inattentive responding and character misrepresentation. Fleischer, Mead
and Huang (2015) suggested that MTurk is equipped with a means of dissuading inattentive
participation by way of the withholding of financial compensation to offending participants.
However, such strategies also bring up the subject of ethical debate (Fleischer, Mead, & Huang,
2015). With respect to the mitigations of character misrepresentation, Wessling, Huber and Netzer
(2017) purported a relationship between occurrences of character misrepresentation and study
presentation. Central to their recommendations was the utilization of a data collection process that
would determine subject eligibility prior to introducing participant criteria in an attempt to mitigate
motives for deception.
3
Mehta et al.: Samples Study
Published by Scholarly Commons, 2019

Current Study
There have been many theoretical arguments cautioning the research world against making
broad claims about single convenience samples; however, to our knowledge, this issue has not
been widely acknowledged in aviation. Furthermore, we have found very little literature showing
how vastly different samples can be when coming from different aviation-related schools and
online sources. The purpose of the current study was to highlight differences in effect sizes in an
aviation study as a function of different convenience samples that have very different demographic
makeups. Three hypotheses are presented. The first two hypotheses show a replication of previous
findings in aviation; in contrast, the third hypothesis, which is the primary focus of this study,
explores an unaddressed question that does not widely appear in the aviation literature. The
hypotheses are as follows:
H1: Willingness to fly will be lower in the autonomous conditions.
H2: There will be significant demographic differences between sample locations
H3: Effects sizes will differ as a function of the different samples.
Methodology
Participants
This study was conducted using four different convenience samples from the United States.
The total sample size for the study was 781 participants. Of the total participants, 509 were male,
267 were female, two reported as gender fluid, and three refrained from responding the gender
question. The overall mean age of all participants was 27.68 (SD = 11.33) years. Convenience
samples of participants were recruited from four different sources, namely: Amazon’s ®
Mechanical Turk ® (MTurk), Florida Institute of Technology (FIT), Embry-Riddle Aeronautical
University (ERAU), and San Jose State University (SJSU). Participants from the three universities
were chosen using a convenience sampling methodology of visiting class sessions of course with
varied student majors. We note that these three universities were chosen for their respected aviation
programs and their reported differences in demographic makeup. The participant sample sizes of
each were 290 MTurk, 183 FIT, 200 ERAU, and 108 SJSU.
Procedure, Materials, and Stimuli
The study was conducted using an online instrument developed with Google Forms ® for
the MTurk participants, and a paper copy of the same instrument was used for each of the other
three collegiate samples. All participants were asked to complete a consent form and then given
instructions. Participation was voluntary and no subject was required to complete the study if they
chose not to after initiating. In the collegiate samples, no incentives were given to participate, nor
were there any losses in not participating. No identifying data was collected beyond basic
demographics in order to maintain the anonymity of the participants.
Participants were presented with one of two different scenarios relating to the configuration
of the cockpit, thereby creating a between-subjects design. In the MTurk samples, two separate
samples of participants were used at two different times to ensure that participants were not in both
scenarios. MTurk allows for participant exclusion if they have completed another task, which
ensured the standards of the design were preserved. In the collegiate settings, the questionnaires
4
International Journal of Aviation, Aeronautics, and Aerospace, Vol. 6 [2019], Iss. 5, Art. 2
https://commons.erau.edu/ijaaa/vol6/iss5/2DOI: https://doi.org/10.15394/ijaaa.2019.1404

were administered alternated, giving each scenario to every other student, thereby creating random
assignment for the between-subjects design.
The two scenarios were: a) a traditional configuration of two human pilots in the cockpit,
and b) a configuration where the aircraft was piloted using a completely autonomous autopilot
system with no human pilots in the cockpit. Once presented with one scenario, participants were
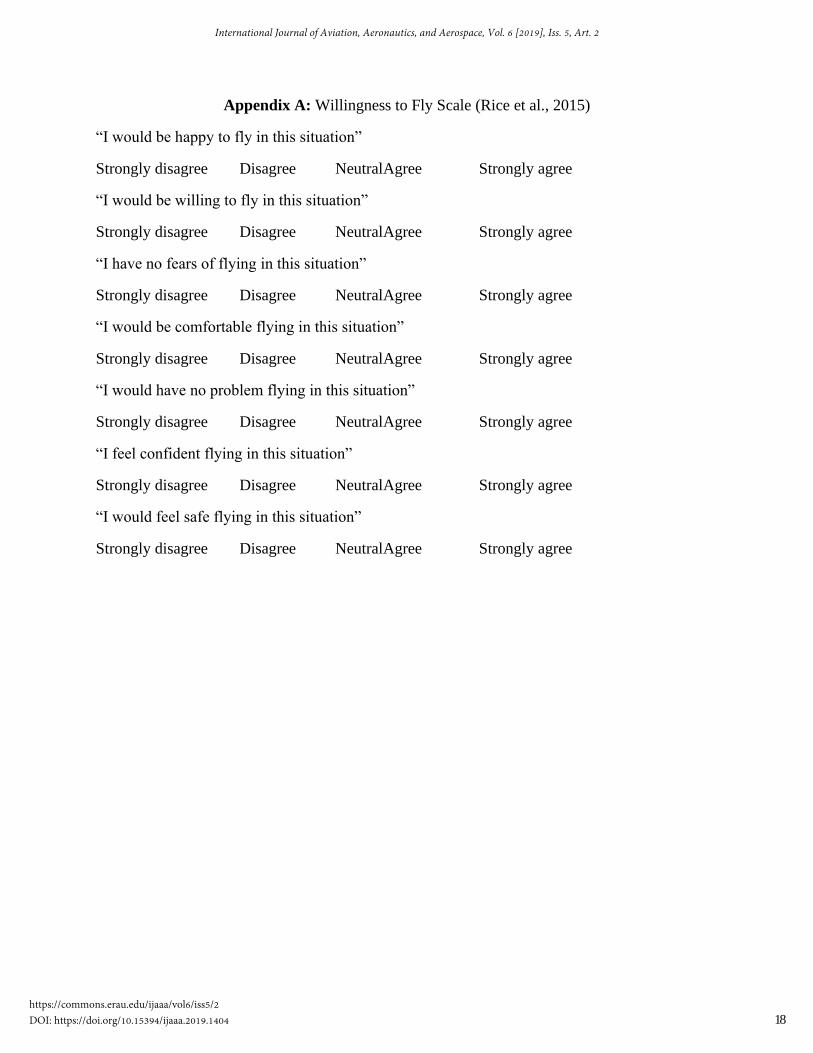
asked to rate their willingness to fly in the provided scenario using the Rice et al. (2015)
Willingness to Fly scale, the questions for which are attached in Appendix A. The Willingness to
Fly scale uses a Likert-type rating from strongly disagree (-2) to strongly agree (+2). Participants
were then presented with demographic questions that would be used for reporting descriptive
statistics of the samples. In order to test for internal consistency and reliability, Cronbach’s Alpha
and Guttmann Split Half tests were conducted on the willingness to fly scores for each of the four
sample locations. Cronbach’s alpha values for these data sets ranged from .96 to .98. The Guttmann
Split Half scores ranged from .93 to .98. High coefficients indicate strong internal consistency and
reliability, lending support to the validity of the instrument. Lastly, participants were debriefed
and then dismissed.
Design
This study employs a two-way between-subjects factorial design for the inferential
statistics. The independent variables (IVs) were the condition/scenario that was presented, and the
location of the sample. The dependent variable (DV) was the participants’ willingness to fly.
Results
Demographics
Table 1 contains all descriptive statistics and demographics of the four different samples.
It contains data relating to sample size, gender, age, ethnicity, education level, flight frequency
(number of flights per year), income, and number of children. Ethnicity was categorized as African
descent, Asian descent, Caucasian descent, Latino/Hispanic descent, or other. Education level was
categorized as High School diploma, Associate's degree, 4-Year Bachelor's degree, Master's
degree, or Doctorate (terminal degree).
Chi Square tests of independence were performed between sample location and gender,
ethnicity, and education level. This test identifies statistically significant associations between the
variables, and in turn shows whether the variables are independent. Statistically significant
findings indicate meaningful differences between the samples. Additionally, Cohen (1988)
discusses Cramer’s V, a measure of effect size, to further present the strength of the association.
Cramer’s V strength of association ranges from .1 to .5 where, .1 represents a small or weak
association, .3 a moderately strong association, and .5 a large/strong association.
One-Way ANOVAs were performed on age, income, flight frequency, and number of
children, with sample location as the grouping variable. Statistically significant results indicate
that the samples indeed vary in relation to that variable. A graphical breakdown of demographic
data is also included in Figures 1 – 7 followed by the findings of their particular statistical analyses.
5
Mehta et al.: Samples Study
Published by Scholarly Commons, 2019

Descriptive Statistics of Sample Demographics
MTURK FIT ERAU SJSU
N 290 183 200 108
Gender (Female N) 121 51 42 53
Age 35.03 20.85 20.66 19.75
Ethnicity
African Descent 13 21 11 9
Asian Descent 20 30 21 39
Caucasian 235 79 133 22
Latino/Hispanic Descent 16 26 22 24
Other 6 27 13 14
Education Level
High School Diploma 79 126 170 93
Associate's Degree 48 29 21 4
4-Year Bachelor's Degree 128 26 9 8
Master's Degree 28 0 0 1
Doctorate (Terminal Degree) 7 0 0 1
Flight Frequency 6.03 4.72 7.37 4.82
Income 48206.95 11393.18 11766.07 7398.75
No. of Children 0.93 0.07 0.04 0.14
Table 1. Descriptive Statistics of Demographics
Figure 1. Gender by Percentage
A chi-square test of independence was conducted to examine the relation between location
and gender. There was a statistically significant association between these, χ2(3) = 37.560, p <
.001. The association was moderately strong, Cramer's V = .220. These results suggest that gender
varies significantly based on sample location.
6
International Journal of Aviation, Aeronautics, and Aerospace, Vol. 6 [2019], Iss. 5, Art. 2
https://commons.erau.edu/ijaaa/vol6/iss5/2DOI: https://doi.org/10.15394/ijaaa.2019.1404

Figure 2. Average Ages in Years
A one-way ANOVA was conducted to determine whether there were statistically
significant differences in participant ages based on sample locations. The differences in age
between locations were indeed statistically significant, F(3, 775) = 281.574, p <.001.
Figure 3. Participant Ethnicity by Percentage
A chi-square test of independence was conducted to examine the relation between location
and ethnicity. There was a statistically significant association between location and ethnicity,
χ2(12) = 168.409, p <.001. The association was moderately strong, Cramer's V = .268. These
results suggest that ethnicity varies significantly based on sample location.
7
Mehta et al.: Samples Study
Published by Scholarly Commons, 2019
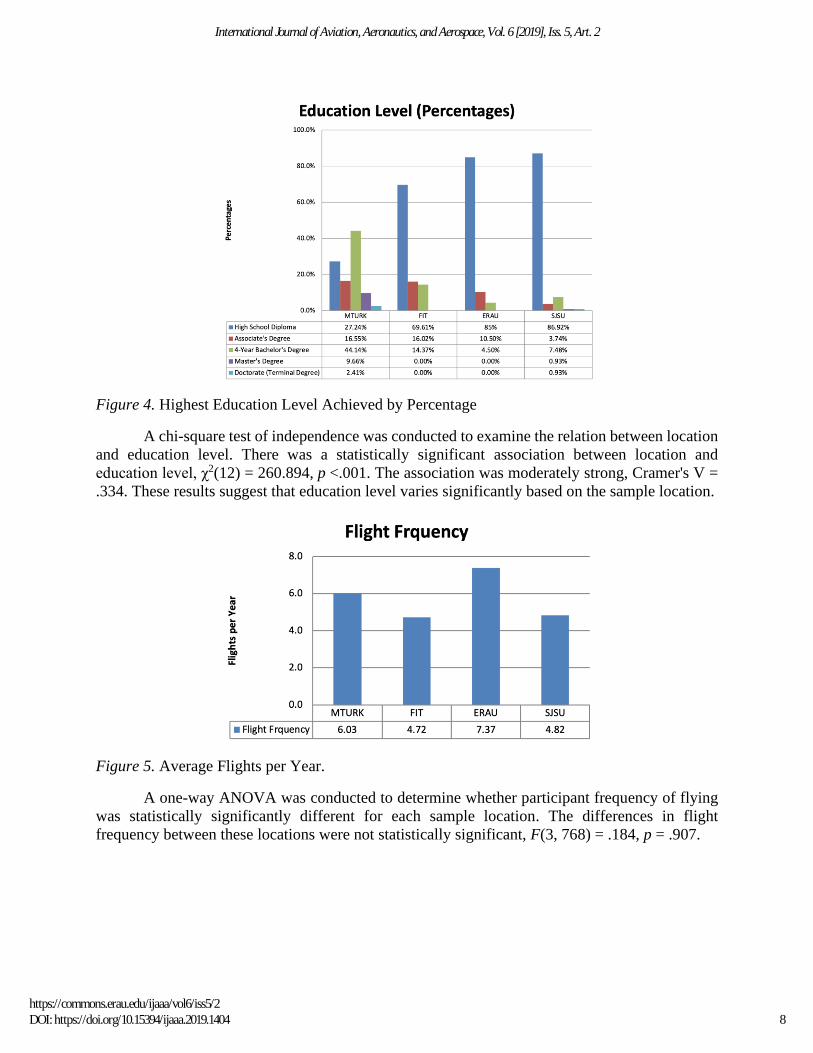
Figure 4. Highest Education Level Achieved by Percentage
A chi-square test of independence was conducted to examine the relation between location
and education level. There was a statistically significant association between location and
education level, χ2(12) = 260.894, p <.001. The association was moderately strong, Cramer's V =
.334. These results suggest that education level varies significantly based on the sample location.
Figure 5. Average Flights per Year.
A one-way ANOVA was conducted to determine whether participant frequency of flying
was statistically significantly different for each sample location. The differences in flight
frequency between these locations were not statistically significant, F(3, 768) = .184, p = .907.
8
International Journal of Aviation, Aeronautics, and Aerospace, Vol. 6 [2019], Iss. 5, Art. 2
https://commons.erau.edu/ijaaa/vol6/iss5/2DOI: https://doi.org/10.15394/ijaaa.2019.1404

Figure 6. Average Income per Year in USD.
A one-way ANOVA was conducted to determine whether there were statistically
significant differences in participant for each sample location. The differences in income between
these locations were statistically significant, F(3, 730) = 66.759, p <.001.
Figure 7. Average Number of Children
A one-way ANOVA was conducted to determine whether there were statistically
significantly differences in the participants' number of children for the different sample locations.
The differences in number of children between these locations were statistically significant, F(3,
756) = 52.523, p <.001.
Willingness to Fly Scores
A two-way between subjects ANOVA was conducted on the willingness to fly scores.
Within the 2x4 design, the factors were condition and location. There was a main effect of
Condition, F(1, 769) = 496.108, p < .001, partial-eta squared = .392. There was a main effect of
Location, F(3, 769) = 6.262, p < .001, partial-eta squared = .024.These effects were qualified by
an interaction between Condition and Location, F(3, 769) = 4.523, p = .004, partial-eta squared =
9
Mehta et al.: Samples Study
Published by Scholarly Commons, 2019
.017. Figure 8 graphically depicts Willingness to Fly data for the four sample locations in the two
conditions.
Figure 8. Willingness to Fly data for 4 locations in the two conditions.
Unsurprisingly, the results of these analyses suggest that, on average, most participants are
unwilling to fly in the autonomous cockpit configuration. Additionally, though willingness to fly
trended in the same direction across samples, it varied between the four sample locations to varying
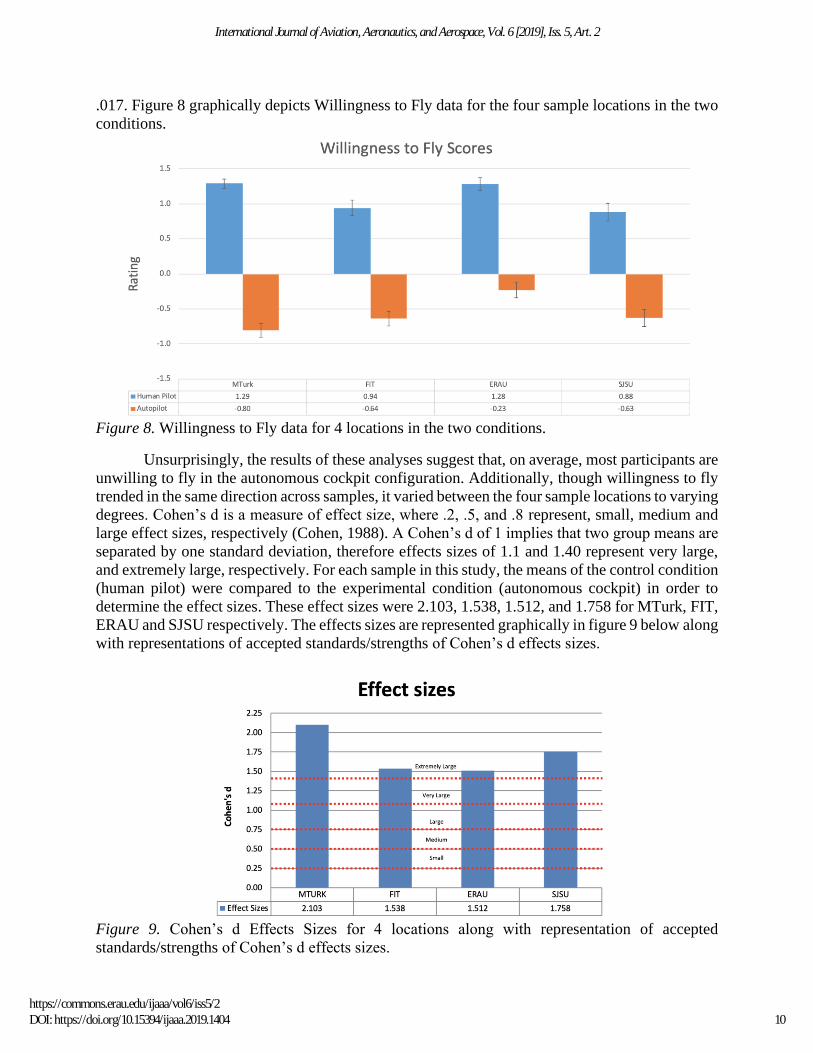
degrees. Cohen’s d is a measure of effect size, where .2, .5, and .8 represent, small, medium and
large effect sizes, respectively (Cohen, 1988). A Cohen’s d of 1 implies that two group means are
separated by one standard deviation, therefore effects sizes of 1.1 and 1.40 represent very large,
and extremely large, respectively. For each sample in this study, the means of the control condition
(human pilot) were compared to the experimental condition (autonomous cockpit) in order to
determine the effect sizes. These effect sizes were 2.103, 1.538, 1.512, and 1.758 for MTurk, FIT,
ERAU and SJSU respectively. The effects sizes are represented graphically in figure 9 below along
with representations of accepted standards/strengths of Cohen’s d effects sizes.
Figure 9. Cohen’s d Effects Sizes for 4 locations along with representation of accepted
standards/strengths of Cohen’s d effects sizes.
10
International Journal of Aviation, Aeronautics, and Aerospace, Vol. 6 [2019], Iss. 5, Art. 2
https://commons.erau.edu/ijaaa/vol6/iss5/2DOI: https://doi.org/10.15394/ijaaa.2019.1404

Obtaining large (or extremely large) effect sizes is interesting, but more striking is the
finding that there are such large differences between the effect sizes of each of the four sample
locations. The differences in effect sizes speak to the arguable generalizability of convenience
samples, implying that, though conclusions regarding the direction of sample results may well be
generalizable, replication is needed to obtain a clear understanding of the population effect size.
Discussion
The purpose of this paper was not to provide an estimate of the US population effect size
for willingness to fly in autonomous vehicles, but rather to use this data to highlight issues that
may arise when using a convenience sample and suggesting its data and results reflect the effect
size of the overall population (Ary, Jacobs, Sorensen, & Razavieh, 2010; Ferguson, 2004). While
the goal of most studies is to generalize sample findings to a wider population (Ary, Jacobs,
Soresen, & Razavieh, 2010) and real-world findings (Levitt & List, 2007), convenience samples
are commonly used in place of random samples due to their ease of participant recruitment
(Landers & Behrend, 2015). When conducting research in aviation, it is often impossible to collect
a random sample. For instance, if a researcher wants to measure pilot performance during some
task, they must settle for findings pilots who are both able and willing to participate in their study.
If the researcher wants to tap into consumer perceptions in aviation, they are limited to participants
who agree to answer paper or online surveys.
These convenience samples are just that, convenient – which is great in terms of being able
to collect sufficient data for analysis. Nonetheless, these samples are flawed in the respect that
there is no true random sampling of the population of interest. Because of this flaw, one should be
very cautious about generalizing these findings to the overall population. If a study finds that pilots
in a Midwestern aviation school behave a certain way, neither the researchers nor the audience
should assume that this applies to all pilots in the United States, and certainly not all pilots
worldwide.
In addition to making inferences about sample means, one needs to be cautious about
making inferences regarding effect sizes. Effect size has become an important variable in the
reporting of statistical results of scientific research. Due to limitations of p-value alone (such as
being affected by large samples to demonstrate significance), effect size has come to be regarded
as a more stable measure; more practical for illustrating findings from research studies. It helps
the researcher paint a more complete picture by indicating how much of an effect the independent
variable has on the dependent variable. Obtaining results indicating p < .05 alone does not mean
that the findings are of practical significance. If a variable is found to have some significant effect
on another, but the effect size is tiny, should we care? Thus, when researchers use a convenience
sample and find significant differences, the effect size should be one of the main metrics they
would likely want to infer to the wider population. While the overall direction of the trend may be
applicable to the larger population, findings from the current study & those in the literature review
suggest that effect size can vary based on the sample and population. This highlights both the
limitations of convenience sampling and the need for replication before making any wider
inferences.
The data from the current study show some extreme differences in the demographics
between the four different samples. For example, the average number of children for the online
sample was nine times as large as for the three samples from the aviation schools. Studies have
found that number of children and/or presence of children in a given scenario can affect a person’s
11
Mehta et al.: Samples Study
Published by Scholarly Commons, 2019

perception and likelihood of autonomous technology use (Bonnefon, Shariff, & Rahwan, 2016;
Haboucha, Ishaq, & Shiftan, 2017; Lavieri et al., 2017; Schoettle & Sivak, 2014). There are also
significant differences in age, income, education and ethnicity found between the samples of this
study. Any of these factors could arguably affect Willingness to Fly scores, and their respective
effect sizes.
To be clear, the argument is not that convenience samples are useless and should be
avoided; quite to the contrary, convenience sampling can be quite insightful! One can collect a
good amount of data in a short time and learn the answers to important questions. Instead, the main
takeaway should be that it is important to treat this data as a single-sample finding, and to avoid
making spurious inferences about the population from limited convenience samples, so that it can
be considered more objective, accurate research. However, if one would like to make strong
inferences about population effect sizes, replication is required. We would argue that the average
of the four effect sizes sampled in this study would be a better measure of the population effect
size than any single sample effect size. Replications should be done at different locations with a
goal of eventually matching the population diversity as close as possible. Further, an average
calculated from 20-30 replications would be even more appropriate. Brandt and colleagues (2014)
point out that averaging the effect sizes of multiple replications of a sample study can aid in
establishing the robustness of an effect. Some phenomena such as the Stroop Effect (Haaf &
Rouder, 2017) have been replicated many thousands of times across different samples, cultures,
and countries, providing conclusions that are very hard to dispute.
Every researcher working in the aviation field will know the difficulty in collecting good
data; in most cases, it is impossible to get truly random samples yielding enough participants for
a robust data set. Everyone does the best they can with what they have. As long as the flaws
inherent in the system are well understood and accounted for, and caution is observed when making
broad inferences about the data, the field of aviation will be able to count on good, honest research
that can have a meaningful impact on the future of aviation.
Limitations
This study has limitations of which the reader should be aware. The in-person data was
collected from a small subset of all possible universities and online sources. Unfortunately, this
was unavoidable, as the researchers only had access to these universities. Furthermore, the funding
and lack of tested online pools limited online collection to one source. However, it is important to
note that these universities and their populations differ from each other in many ways, which
strengthens the study by providing an opportunity to compare results from diverse samples.
Conclusions
Too often there are instances where inexperienced or overly excited researchers want to
generalize their findings from a single convenience-sample dataset to an entire population. They
are tempted to assume that the effect sizes they discover from one sample are also representative
of the population. The current study provides data that helps dispel this mistaken assumption. Data
from three universities, all known for their respective aviation programs, along with data from
online respondents, reveal that effect sizes vary dramatically among different convenience
samples. This occurred despite the fact that all four datasets provided evidence to confirm the
hypothesis that people are less willing to fly in autonomous aircraft compared to human piloted
12
International Journal of Aviation, Aeronautics, and Aerospace, Vol. 6 [2019], Iss. 5, Art. 2
https://commons.erau.edu/ijaaa/vol6/iss5/2DOI: https://doi.org/10.15394/ijaaa.2019.1404

aircraft. When conducting aviation research, it is important not only to confirm or discount
hypotheses, but also to produce accurate effect sizes of group differences. We recommend that,
when possible, researchers obtain data from as many samples as possible, and that these samples
are taken from a variety of locations or sources, so that through replication, correct inferences can
be made about the general population.
13
Mehta et al.: Samples Study
Published by Scholarly Commons, 2019

References
Anderson, C. A., Lindsay, J. J., & Bushman, B. J. (1999). Research in the psychological laboratory:
truth or triviality? Current Directions in Psychological Science, 8(1), 3-9.
Ary, D., Jacobs, L. C., Sorensen, C., & Razavieh, A. (2010). Introduction to research in education
(8th ed.). Belmont, CA: Wadsworth Cengage Learning.
Bonnefon, J. F., Shariff, A., & Rahwan, I. (2016). The social dilemma of autonomous vehicles.
Science, 352(6293), 1573-1576.
Bornstein, M. H., Jager, J., & Putnick, D. L. (2013). Dampling in developmental sciences:
Situations, shortcomings, solutions, and standards. Developmental Review, 33, 357-270.
Brandt, M. J., IJzerman, H., Dijksterhuis, A., Farach, F. J., Geller, J., Giner-Sorolla, R., Grange,
J.A., Perugini, M., Spies, J.R., & Van't Veer, A. (2014). The replication recipe: What makes
for a convincing replication? Journal of Experimental Social Psychology, 50, 217-224.
Brodaty, H., Mothakunnel, A., de Vel-Palumbo, M., Ames, D., Ellis, K. A., Reppermund, S.,
Kochan, N. A., Savage, G., Trollor, J. N., Crawford, J., & Sachdev, P. S. (2014). Influence
of population versus convenience sampling on sample characteristics in studies of
cognitive aging. Annals of epidemiology, 24(1), 63-71.
Buhrmester, M., Kwang, T., & Gosling, S. D. (2011). Amazon's Mechanical Turk: A new source
of inexpensive, yet high-quality, data? Perspectives on Psychological Science, 6(1), 3-5.
Chandler, J., & Shapiro, D. (2016). Conducting clinical research using crowdsources convenience
samples. Annual Review of Clinical Psychology, 12, 53-81.
Cohen, J. (1988). Statistical power analysis for the behavioral sciences (2nd ed.). New York, NY:
Psychology Press.
Ellis, S. M., & Steyn, H. S. (2003). Practical significance (effect sizes) versus or in combination
with statistical significance (p-values): research note. Management dynamics: Journal of
the Southern African Institute for Management Scientists, 12(4), 51-53.
Ferguson, L. (2004). External validity, generalizability and knowledge utilization. Journal of
Nursing Scholarship, 36(1), 16-22.
Fleischer, A., Mead, A. D., & Huang, J. (2015). Inattentive responding in MTurk and other online
samples. Industrial and Organizational Psychology, 8(2), 196-202.
Germine, L., Nakayama, K., Duchaine, B. C., Chabris, C. F., Chatterjee, G., & Wilmer, J. B.
(2012). Is the web as good as the lab? Comparable performance from web and lab in
cognitive/perceptual experiments. Psychometric Bulletin and Review, 19(5), 847-857.
Glasgow, R. E., Green, L. W., Klesges, L. M., Abrams, D. B., Fisher, E. B., Goldstein, M. G., . . .
Orleans, C. T. (2006). External validity: We need to do more. Annals of Behavioral
Medicine, 31(2), 105-108.
14
International Journal of Aviation, Aeronautics, and Aerospace, Vol. 6 [2019], Iss. 5, Art. 2
https://commons.erau.edu/ijaaa/vol6/iss5/2DOI: https://doi.org/10.15394/ijaaa.2019.1404
Grafström, A., & Schelin, L. (2014). How to select representative samples. Scandinavian Journal
of Statistics, 41(2), 277-290.
Haaf & Rouder (2017). Developing constraint in Bayesian mixed models. Psychological Methods,
22, 779-798.
Haboucha, C. J., Ishaq, R., & Shiftan, Y. (2017). User preferences regarding autonomous vehicles.
Transportation Research Part C: Emerging Technologies, 78, 37-49.
Hunter, J. E. (2001). The desperate need for replications. Journal of Consumer Research, 28(1),
149-158.
Jager, J., Putnick, D. L., & Bornstein, M. H. (2017). More than just convenient: The scientific
merits of homogeneous convenience samples. Monographs of the Society for Research in
Child Development, 82(2), 13-30.
Landers, R. N., & Behrend, T. S. (2015). An inconvenient truth: Arbitrary distinctions between
organizational, mechanical turk, and other convenience samples. Industrial and
Organizational Psychology, 8(2), 142-164.
Lavieri, P. S., Garikapati, V. M., Bhat, C. R., Pendyala, R. M., Astroza, S., & Dias, F. F. (2017).
Modeling individual preferences for ownership and sharing of autonomous vehicle
technologies. Transportation research record, 2665(1), 1-10.
Leiner, D. J. (2014). Convenience samples from online respondent pools: A case study of the SoSci
Panel. International Journal of Internet Science, 20(5), 1-18.
Levitt, S. D., & List, J. A. (2007). Viewpoint: On the generalizability of lab behavior to the field.
Canadian Journal of Economics, 40(2), 347-370.
Marshall, M. N. (1996). Sampling for qualitative research. Family practice, 13(6), 522-526.
Mehta, R., Chauhan, B., Edwards, M., Rosser, T., Dunbar, V., & Rice, S. (2019). Does a SWT
Reverse Contagion Effect Exist from Humans to Automation. Collegiate Aviation Review
International, 37(1), 90-106.
Mehta, R., Rice, S., Winter, S.R., & Buza, P. (2017). Cabin Depressurization as a Hijacking
Mitigation Tactic: A Consumer Perceptions Study. Collegiate Aviation Review
International, 35(1), 13.
Mehta, R., Rice, S., Winter, S.R., & Eudy, M. (2017). Perceptions of Cockpit Configurations: A
Culture and Gender Analysis. International Journal of Aerospace Psychology, 27(1-2), 57-
63.
Mehta, R., Rice, S., Winter, S.R. & Oyman, K. (2014). Consumers' perceptions about autopilots
and remote-controlled commercial aircraft. Proceedings of the 57th Annual Meeting of the
Human Factors and Ergonomics Society, Chicago, IL.
Mitchell, G. (2012). Revisiting truth or triviality: The external validity of research in the
psychological laboratory. Perspectives on Psychological Science, 7(2), 109-117.
15
Mehta et al.: Samples Study
Published by Scholarly Commons, 2019

Nelson, M. S., Wooditch, A., & Dario, L. M. (2015). Sample size, effect size, and statistical power:
A replication study of Weisburd’s paradox. Journal of Experimental Criminology, 11(1),
141-163.
Peterson, R. A., & Merunka, D. R. (2014). Convenience samples of college students and research
reproducibility. Journal of Business Research, 67(5), 1035-1041.
Rice, S., Kraemer, K., Winter, S. R., Mehta, R., Dunbar, V., Rosser, T. G., & Moore, J. C. (2014).
Passengers from India and the United States Have Differential Opinions about
Autonomous Auto-Pilots for Commercial Flights. International Journal of Aviation,
Aeronautics, and Aerospace, 1(1), 3.
Rice, S., Mehta, R., Dunbar, V., Oyman, K., Ghosal, S., Oni, M.D. & Oni, M.A. (2015). A valid
and reliable scale for consumer willingness to fly. Proceedings of the 2015 Aviation,
Aeronautics, and Aerospace International Research Conference.
Rice, S., Winter, S. R., Mehta, R., & Ragbir, N. K. (2019). What factors predict the type of person
who is willing to fly in an autonomous commercial airplane? Journal of Air Transport
Management, 75, 131-138.
Sawyer, A. G., & Ball, A. D. (1981). Statistical power and effect size in marketing research.
Journal of Marketing Research, 18(3), 275-290.
Schimmack, U. (2012). The ironic effect of significant results on the credibility of multiple-study
articles. Psychological methods, 17(4), 551.
Schoettle, B., & Sivak, M. (2014). A survey of public opinion about autonomous and self-driving
vehicles in the US, the UK, and Australia.
Sheehan, K. B. (2018). Crowdsourcing research: Data collection with Amazon's Mechanical Turk.
Communication Monographs, 8(1), 140-156.
Smith, N. A., Sabat, I. E., Martinez, L. R., Weaver, K., & Xu, S. (2015). A convenient solution:
Using MTurk to sample from hard-to-reach populations. Industrial and Organizational
Psychology, 8(2), 220-228.
Staines, G. L. (2008). The casual generalization paradox: The case of treatment outcome research.
Review of General Psychology, 12(3), 236-252.
Steckler, A., & McLeroy, K. (2008). The importance of external validity. American Journal of
Public Health, 98(1), 9-10.
Stritch, J. M., Pedersen, M. J., & Taggart, G. (2017). The opportunities and limitations of using
Mechanical Turk (MTURK) in public administration and management scholarship.
International Public Management Journal, 20(3), 489-511.
Walter, S. L., Seibert, S. E., Goering, D., & O'Boyle Jr, E. H. (2018). A tale of two sample sources:
Do results from online panel data and conventional data converge? Journal of Business
and Psychology, 1-28.
16
International Journal of Aviation, Aeronautics, and Aerospace, Vol. 6 [2019], Iss. 5, Art. 2
https://commons.erau.edu/ijaaa/vol6/iss5/2DOI: https://doi.org/10.15394/ijaaa.2019.1404
Wessling, K. S., Huber, J., & Netzer, O. (2017). MTurk character misrepresentation: Assessment
and Solutions. Journal of Consumer Research, 44(1), 211-230.
Winter, S. R., Rice, S., Friedenreich, K., Mehta, R., & Kaiser, B. (2017a). Passenger Perceptions
Toward the Federal Flight Deck Officer Program and their Willingness to Fly. Aviation
Psychology and Applied Human Factors, 7(1), 7-17.
Winter, S. R., Rice, S., Mehta, R., Cremer, I., Reid, K. M., Rosser, T. R., & Moore, J. C. (2015).
Indian and American consumer perceptions of cockpit configuration. Journal of Air
Transport Management, 42, 226-231.
Winter, S. R., Rice, S., Rains, T., Milner, M., & Mehta, R. (2017b). A longitudinal study on the
alteration of consumer perceptions and the use of pilot medication. Journal of Air
Transport Management, 59, 100-106.
17
Mehta et al.: Samples Study
Published by Scholarly Commons, 2019
Appendix A: Willingness to Fly Scale (Rice et al., 2015)
“I would be happy to fly in this situation”
Strongly disagree Disagree NeutralAgree Strongly agree
“I would be willing to fly in this situation”
Strongly disagree Disagree NeutralAgree Strongly agree
“I have no fears of flying in this situation”
Strongly disagree Disagree NeutralAgree Strongly agree
“I would be comfortable flying in this situation”
Strongly disagree Disagree NeutralAgree Strongly agree
“I would have no problem flying in this situation”
Strongly disagree Disagree NeutralAgree Strongly agree
“I feel confident flying in this situation”
Strongly disagree Disagree NeutralAgree Strongly agree
“I would feel safe flying in this situation”
Strongly disagree Disagree NeutralAgree Strongly agree
18
International Journal of Aviation, Aeronautics, and Aerospace, Vol. 6 [2019], Iss. 5, Art. 2
https://commons.erau.edu/ijaaa/vol6/iss5/2DOI: https://doi.org/10.15394/ijaaa.2019.1404