Generalizability Theory Chronic Diseases based on ...
17
Page 1/17 Development and Validation of the Peptic Ulcer Scale under the System of Quality of Life Instruments for Chronic Diseases based on Classical Test Theory and Generalizability Theory chonghua wan ( [email protected] ) Guangdong Medical University https://orcid.org/0000-0002-7323-6837 Ying Chen Kunming Medical University Li Gao Taian City Central Hospital Qingqing Zhang Shandong Provincial Hospital Peng Quan Guangdong Medical University Xiaoyuan Sun Guangdong Medical University Research article Keywords: Quality of life, Peptic ulcer, Standardized response mean, Psychometric properties, Generalizability Theory Posted Date: November 11th, 2020 DOI: https://doi.org/10.21203/rs.3.rs-61801/v3 License: This work is licensed under a Creative Commons Attribution 4.0 International License. Read Full License Version of Record: A version of this preprint was published on December 14th, 2020. See the published version at https://doi.org/10.1186/s12876-020-01562-y.
Transcript of Generalizability Theory Chronic Diseases based on ...

Page 1/17
Development and Validation of the Peptic Ulcer Scaleunder the System of Quality of Life Instruments forChronic Diseases based on Classical Test Theory andGeneralizability Theorychonghua wan ( [email protected] )
Guangdong Medical University https://orcid.org/0000-0002-7323-6837Ying Chen
Kunming Medical UniversityLi Gao
Taian City Central HospitalQingqing Zhang
Shandong Provincial HospitalPeng Quan
Guangdong Medical UniversityXiaoyuan Sun
Guangdong Medical University
Research article
Keywords: Quality of life, Peptic ulcer, Standardized response mean, Psychometric properties, GeneralizabilityTheory
Posted Date: November 11th, 2020
DOI: https://doi.org/10.21203/rs.3.rs-61801/v3
License: This work is licensed under a Creative Commons Attribution 4.0 International License. ReadFull License
Version of Record: A version of this preprint was published on December 14th, 2020. See the published versionat https://doi.org/10.1186/s12876-020-01562-y.

Page 2/17
AbstractBackground: Quality of life (QOL) for patients with Peptic ulcer disease (PUD) is of interest worldwide anddisease-speci�c instruments are needed for clinical research and practice. This paper focus on thedevelopment and validation of the PUD scale under the system of Quality of Life Instruments for ChronicDiseases (QLICD-PU) by the modular approach and both classical test theory and Generalizability Theory.
Methods: The QLICD-PU is developed based on programmatic decision-making procedures, including multiplenominal and focus group discussions, in-depth interviews, and quantitative statistical procedures. Based onthe data of 153 PUD inpatients, correlation analysis, factor analysis, t-test, and Generalizability Theoryanalysis (including generalizability study and decision study, ie. G-study and D-study) were used to assess thevalidity, reliability, and responsiveness of the scale.
Results: When the popular scale health survey short form (SF-36) was used as the standard, correlation andfactor analysis con�rmed good construct validity and criterion-related validity of QLICD-PU. Except for thesocial domain (0.62), the internal consistency α of all domains is higher than 0.70. The overall score and thetest-retest reliability coe�cients (Pearson r and intra-class correlation ICC) in all domains are higher than 0.80(0.77 in the social domain). After treatments, the overall score and scores of all domains have statisticallysigni�cant changes (P <0.01), except for social impact and sexual function scores. The SRM (Standardizedresponse mean) of domain-level scores ranges from 0.34 to 1.03. The G coe�cient and reliability index (Фcoe�cient) further con�rm the reliability of the scale through more accurate variance components anddecision-making information about changes in the number of items.
Conclusions: The QLICD-PU can be used as a useful measurement to assess the quality of life of PUD patientswith good psychometric characteristics and multiple advantages.
BackgroundsPeptic ulcer disease (PUD) is a frequently occurring and common disease in the world and is usually recurrent[1-5], with its annual incidence rate being 1.1-3.3% and the prevalence being 1.7-4.7%. About 10% of the peopleare suffered from this disease during their lifetime in the United States [1-2], and also same proportion inEurope [4-5]. Patients with PUD may have various gastrointestinal symptoms including abdominal pain,vomiting, and upper gastrointestinal bleeding which is related to high mortality and high morbidity [6-7].Considering the disease can result in many gastrointestinal symptoms such as pain, nausea, anorexia andsome limitations to social and metal health, it is particularly important to evaluate their overall impact from thepatient’s health-related quality of life (HRQOL) [8,9]. Several studies showed that patients with PUD hadsigni�cantly lower HRQOL than the general population and the improvement in HRQOL plays an important rolein the treatment of the disease [9,10]. It is hoped that the use of appropriate tools can improve theunderstanding of the treatment and service needs of PUD patients.
There are many HRQOL instruments which can be divided into general measures and speci�c measuresagainst diseases. Contrast to the general measures focusing on comparisons of the results of differentpopulations and interventions, the speci�c measures are more sensitive to detect and quantify subtle changesthat are important to clinicians or patients [11]. For the last few decades, although the measurement of general

Page 3/17
QOL has been improved using the popular scale health survey short form (SF-36), PGWB (PsychologicalGeneral Well-Being) index, etc., clinicians and researchers still need to determine the clinical signi�cance ofany measure of patients’ response to treatment. Therefore, several HRQOL measures against PU have beendeveloped such as QPD (quality of life in peptic disease)[12], QLDUP (Quality of Life in Duodenal UlcerPatients) [13]. Besides, the QOLRAD (Quality Of Life in Re�ux and Dyspepsia) [14,15], the FDDQL (FunctionalDigestive Disorder Quality of Life Questionnaire) [16] and the GSRS (Gastrointestinal Symptom Rating Scale)[17] can also be used for patients with PUD. Among them, the QLDUP (a 54 items questionnaire with 15dimensions) was developed by combining the SF-36, PGWB index, and 13 disease speci�c items derived frompatient and clinician interviews. The QOLRAD is a 25 items questionnaire with �ve subscores (each itemscored on a seven point Likert scale).
However, these instruments are not developed based on the modular approach-a general/core module plus thespeci�c modules [18,19]. Considering that diseases within the same disease class (for example digestivediseases) have many characteristics (symptoms and side effects) in common, a popular approach to developQOL instruments for diseases is to combine a general module for the entire class of diseases with the speci�cmodule for each individual disease. This method can greatly reduce the time and effort of developing newQOL scales. For instance, the quality of life questionnaires (QLQs) from EORTC (European Organization forResearch and Treatment of Cancer) and the Functional Assessment of Cancer Therapy (FACTs) have beendeveloped based on this modular principle [18,19].
To the best of our knowledge, no instrument for PUD has been developed based on the modular approach, letalone a combination of classic test theory (CTT) and generalizability theory (GT). Therefore, we developed aset of Quality of Life Instruments for Chronic Diseases (QLICD) through a modular approach [20-23]. Thesystem includes a general module (QLICD-GM) which can be used for all types of chronic diseases, as well asspeci�c modules only for related diseases [20-23]. For example, the instrument QLICD-CHD for coronary heartdisease is constructed by combining QLICD-GM with the speci�c module for coronary heart disease [21]. Atpresent, the QLICD (V1.0) includes a 30-items general module QLICD-GM (3 domains and 10 facets) and 9speci�c modules which form 9 speci�c scales of the QLICD-CHD[21], the QLICD-HY (hypertension)[22], theQLICD-IBS(irritable bowel syndrome) [23] and the QLICD-PU(peptic ulcer disease) etc.
In the current research, we aimed to develop and validate the QLICD-PU instrument.
MethodsDevelopment of the QLICD-PU
The QLICD-PU consists of a general module QLICD-GM and a module dedicated to PUD. The developmentprocess of QLICD-GM has been described in another paper [20]. Here, we brie�y summarize the developmentsteps and results. The programmed procedures which include focus group discussions, in-depth interviews,pre-testing and four quantitative statistical analyses were used to select items. Finally, the QLICD-GM has 30items which included 3 domains and 10 facets. The QLICD-GM has showed good psychometrics (reliability,validity, responsiveness) by the analysis from the data of 620 patients with seven kinds of chronic diseasessuch as coronary heart disease and hypertension [20].

Page 4/17
For a speci�c module, 29 items re�ecting symptoms and side-effects of PUD were selected to constitute theinitial item pool. We selected these items from literature reviews and nominal / focus group discussions.Focus groups evaluate the importance of each item by ranking each item independently and then discussingthe 9 lowest ranked items that are excluded. Consequently, the remaining 20 items constitute a preliminaryquestionnaire for conducting the pilot test and also Interviews with 29 PUD patients and 14 clinicians andresearchers with extensive experience. We focus on patient opinion, which is most important for assessing theacceptability of interventions and related compliance. Based on the pilot data, the items were re-screenedusing similar development process to the generic module (statistical procedures and focus group discussion).The �nal speci�c module consists of 14 items coded PU1-PU14 (see table 1 in detail), which can be classi�edinto 6 facets.
Table 1 Correlation coefficients r among items and domains of QLICD-PU (n=153)

Page 5/17
Code Items brief description in English Physical Psychological Social SpecificPH1 Take care of daily life (e.g. eating)? 0.70 0.14 0.34 0.06PH2 Felt easily fatigued? 0.65 0.33 0.21 0.19PH3 Have trouble walking 800m or more 0.76 0.12 0.24 0.04PH4 Have trouble going up and down stairs 0.71 0.32 0.20 0.04PH5 Need to take medication 0.65 0.33 0.23 0.19PH6 A good appetite? 0.49 0.10 0.17 0.09PH7 Satisfied with your sleep? 0.55 0.20 0.14 0.15PH8 Felt pain or uncomfortable? 0.52 0.26 0.24 0.43PS1 Memory and concentration affected 0.39 0.46 0.40 0.16PS2 Felt mentally miserable? 0.35 0.59 0.32 0.28PS3 Felt lonely and helpless? 0.14 0.69 0.42 0.19PS4 Felt pessimism and despair 0.18 0.72 0.37 0.26PS5 Worried about disease 0.31 0.72 0.27 0.39PS6 Felt fretful or irritable 0.16 0.56 0.24 0.31PS7 Felt nervous and anxious? 0.26 0.68 0.20 0.31PS8 Stop medication because of side effects? 0.10 0.44 0.05 0.14PS9 To be a burden to the family? 0.36 0.55 0.37 0.23PS10 Felt self-abasement because of disease? 0.03 0.69 0.20 0.23PS11 Hidden emotions but could not forget? 0.11 0.68 0.29 0.27SO1 Interfered with work/housework? 0.29 0.35 0.53 0.18SO2 Family roles? 0.16 0.03 0.38 0.10SO3 Decreased caring and attention to family? 0.28 0.36 0.34 0.20SO4 Good relations with family? 0.01 0.09 0.56 0.04SO5 Help and support from family? 0.06 0.03 0.52 0.08SO6 Affected participating in leisure activities? 0.18 0.35 0.41 0.07SO7 Treat illness positively and optimistically? 0.23 0.30 0.63 0.23SO8 Treatments received good for curing 0.12 0.22 0.35 0.16SO9 Economic problems caused by illness 0.11 0.35 0.48 0.27SO10 Support from friends and relatives? 0.13 0.01 0.51 0.06SO11 Affected sexual activities 0.27 0.27 0.35 0.16PU1 Have pain (sore) in epigastria? 0.28 0.11 0.11 0.53PU2 Have heartburn in epigastria? 0.08 0.17 0.14 0.49PU3 Have pain/discomfort at night or hungry? 0.17 0.08 0.05 0.51PU4 Pain/uncomfortable relieved after dinner? 0.13 0.00 0.07 0.33PU5 Have acid regurgitation? 0.06 0.17 0.05 0.48PU6 Have any belch (burps)? 0.19 0.12 0.08 0.49PU7 Abdominal distension 0.03 0.07 0.15 0.53PU8 Salivate (flow saliva)? 0.06 0.26 0.00 0.38PU9 Move bowels normal? 0.27 0.10 0.19 0.34PU10 Upset/distress for gastroscopy inspection? 0.13 0.21 0.05 0.36PU11 Vexed for food limit 0.05 0.30 0.12 0.43PU12 Troubled/limit by dine at fix time? 0.14 0.18 0.14 0.35PU13 Worried about causing severe disease? 0.04 0.36 0.22 0.51PU14 Vexed for often taking stomach medications? 0.01 0.31 0.17 0.55
*Correlations between each item and its designated scale are in bold type.
Validation of the QLICD-PU
Data Collection and Scoring

Page 6/17
In this study, we enrolled participants with PUD at any stage who were: (1) be able to provide written informedconsent; (2) be able to read and write words with assistance. There were no protocol requirements regardingspeci�c clinical treatment of patients. Physicians could treat the patients according to what they deemedclinically appropriate.
The survey was carried out at the First A�liated Hospital of Kunming Medical University after approved by theethics committee of this University. Each interviewee was required to answer the questionnaire uponadmission. Researchers including doctors and medical graduate students explained the purpose of the studyand obtained informed consent before the test. To assess the reliability of the test-retest, a subsample israndomly selected for the second assessment on the second day of hospitalization. All patients available atthe scheduled third evaluation time point have completed discharge measures to assess the responsiveness ofthe questionnaire.
Besides, the Chinese version of SF-36 [24] was also used to provide data for assessing the criterion-relatedvalidity, as well as convergent and discriminant validity of the QLICD-PU because of the lack of an agreed-upon gold standard for PUD. Baseline socio-demographic characteristics were recorded from hospital medicalrecords, including age, gender, education level, marital status, clinical history, and treatment. Each investigatorchecked the answers immediately to ensure their integrity.
Since each item uses the �ve-point Likert format (not at all, a little bit, somewhat, quite a bit, and very much),positively stated items will be scored directly from 1 to 5, while negatively stated items will receive the oppositescore. The domain/facet and overall scores are obtained by adding related item scores, all of which arelinearly converted to standardized scores on a scale of 0-100. The higher the score of QLICD-PU means thebetter quality of life for both raw and standardized scores.
Psychometric Analysis
The validity, reliability, and responsiveness of QLICD-PU were evaluated in this study. The construct validitywas evaluated by the Pearson correlation coe�cient (r) between the items and the domains and also by factoranalysis, while the criterion-related validity was assessed by correlating the corresponding domains of QLICD-PU and SF-36. Multi-trait scaling analysis [25] was used to test the convergence validity and discriminantvalidity. There are two validity criteria: (1) When the item-domain correlation is 0.40 or higher, it supportsconvergence validity; (2) discriminant validity is revealed when item-domain correlation is higher than that withother domains.
In terms of reliability, for each domain/facet and the overall scale, the internal consistency was assessed byCronbach's alpha coe�cients using the �rst measurement data (at admission) for large sample. Evaluation oftest-retest reliability was by Pearson correlation coe�cient and intra-class correlation (ICC) [26-27] between the�rst and second assessments. The responsiveness (sensitivity to detect change) was assessed by using apaired t-test to compare the average score change between the two assessments before and after treatmentsand also the effect size, standardized response mean (SRM) [28-29].
Generalizability Theory Analysis

Page 7/17
In addition to the classical test theory analysis, we also applied the Generalizability Theory (GT) in thisresearch to study the reliability of the QLICD-PU score. GT is a modern test theory developed based on thecombination of experiment design and analysis of variance. It is proposed as a method to improvemeasurement program design in an attempt to obtain reliable data [30-33]. To control the measurement errors,GT introduces independent variables or factors that interfere with test scores into measurement models, suchas research objects, item di�culty, scoring criteria, and the interaction between these factors. An analysis ofvariance was then used to assess the impact of these variables or factors on test scores, using the variancecomponent as an index. GT includes generalizability study (G-study) and decision study (D-study). G studyquanti�ed the amount of variance related to the different facets (factors) to be examined, while D studyprovides information about which protocol is best for a particular measurement by generating ageneralizability (G) coe�cient.
In our research, both G study and D study were completed in one measurement model to estimate the variancecomponents and dependability coe�cients in one-facet crossed design (person-by-item design, ie. p × i design). We de�ned the patient's quality of life as the measurement target and the item as a facet of measurementerror. Speci�cally, we de�ned an acceptable observation range composed of measurement objects andmeasurement errors and estimated variance components for G-Study. And for D-study, we de�ned theallowable summary based on the measurement object and the measurement facet that the researchers arewilling to summarize to express the measurement conditions. At the same time, the generalized coe�cients ofeach facet and the variance components of the reliability indicators and their interactions were calculated.
ResultsSocio-demographic characteristics of the sample
153 PUD patients range in age from 16 to 79, with a mean age of 45.2±14.8. 110 cases (71.9%) were male,and 134 (87.6%) were of Han ethnicity. 27 cases (17.6%) �nished primary school, while 85 (55.5%) completedhigh school, and 40 (26.2%) had a university or graduate degree. In terms of occupation, workers accountedfor 38.6% (59 cases), farmer 15.0% (23),cadre 12.4% (19), teacher 9.2% (14), and others 24.8% (38). Forperceived Income, poor accounted for 30.7% (49 cases), fair 58.8% (90), and high 9.2% (14).
Construct validity
The construct validity was evaluated by item-domain Pearson’s correlation coe�cient r and by factor analysis.A correlation analysis from the data measured at the time of admission showed that there is a strongcorrelation between the items and their domain (most above 0.40). However, the relationship between the itemand other domains is weak ( see Table 1 in details). For example, the correlation coe�cients between PHD andPH1-PH8 are between 0.49 and 0.76 (the �rst column in bold), which are higher than those between PHD andother items. Similarly, correlation coe�cients between PSD and items of PS1- PS11 ranging from 0.44 to 0.72(the second column in bold) are higher than the value between PSD and other items. Factor analysis wasperformed on the general module and the speci�c module respectively. After extraction standard was set ascriteria of eigenvalues >1, there were 8 principal components extracted from 30 items of the general module(QLICD-GM), accounting for 63.88% of the cumulative variance. By using the Varimax rotation method, it can

Page 8/17
be seen that the 8 principal components re�ected 8 different facets under three domains of the general modulewith the �rst, fourth and �fth principals components mainly representing the psychological domain with higherloadings on PS1-PS11; the second and seventh principal components largely re�ecting the physical domainwith higher loadings on PH1-PH8; the third, sixth and eighth principal components generally depicting thesocial domain with higher loadings on SO1-SO11. Similarly, the principal component factor analysis extracted6 principal components from the 14 items of the speci�c module with the cumulative variance of 65.88%,re�ecting 6 facets.
Criterion-related validity
The correlation coe�cients between the QLICD-PU and SF-36 domain scores were listed in Table 2, indicatingthat the correlation between the same and similar domains (bold in the table) is usually higher than differentand dissimilar domains. For example, the coe�cient between the physical domain of QLICD-PU and thephysical function of SF-36 is 0.67, which is higher than any other coe�cient in this row. Similarly, thecoe�cient between the psychological domain of QLICD-PU and the mental health of SF-36 is 0.51, higher thanany other coe�cient in this row.
Table 2 Correlation Coefficients among domain scores of QLICD-PU and SF-36 (n=153)*QLICD-PU SF-36
PF RP BP GH VT SF RE MH PCS MCSPHD 0.67 0.26 0.26 0.37 0.31 0.18 0.16 0.19 0.61 0.30 PSD 0.23 0.21 0.21 0.40 0.30 0.38 0.27 0.51 0.38 0.51 SOD 0.37 0.20 0.31 0.47 0.33 0.54 0.23 0.31 0.53 0.47 SPD 0.14 0.18 0.33 0.29 0.12 0.24 0.20 0.23 0.31 0.25 TOT 0.49 0.30 0.39 0.56 0.37 0.39 0.31 0.49 0.64 0.54
PHD: physical domain, PSD: psychological domain, SOD: social domain, SPD: specific domain, TOT: total scorePF: physical function, RP: role-physical BP: bodily pain GH: general health VT: vitality SF: social function RE: role-
emotional MH: mental-health, PCS: Physical Component Summary , MCS: Mental Component Summary.
Reliability
As shown in Table 3, the Cronbach's α for these four domains were higher than 0.70 except for SOD (0.62),while they were ranging from 0.35 to 0.81 at facets level.
Table 3 Reliability of the quality of life instrument QLICD-PU (n=153 for α, n=63 for r and ICC)
Page 9/17
Domains/facets (number of items)
Internal consistency coefficient α Test-retestcoefficient r
Test-retest ICC(95% CI )
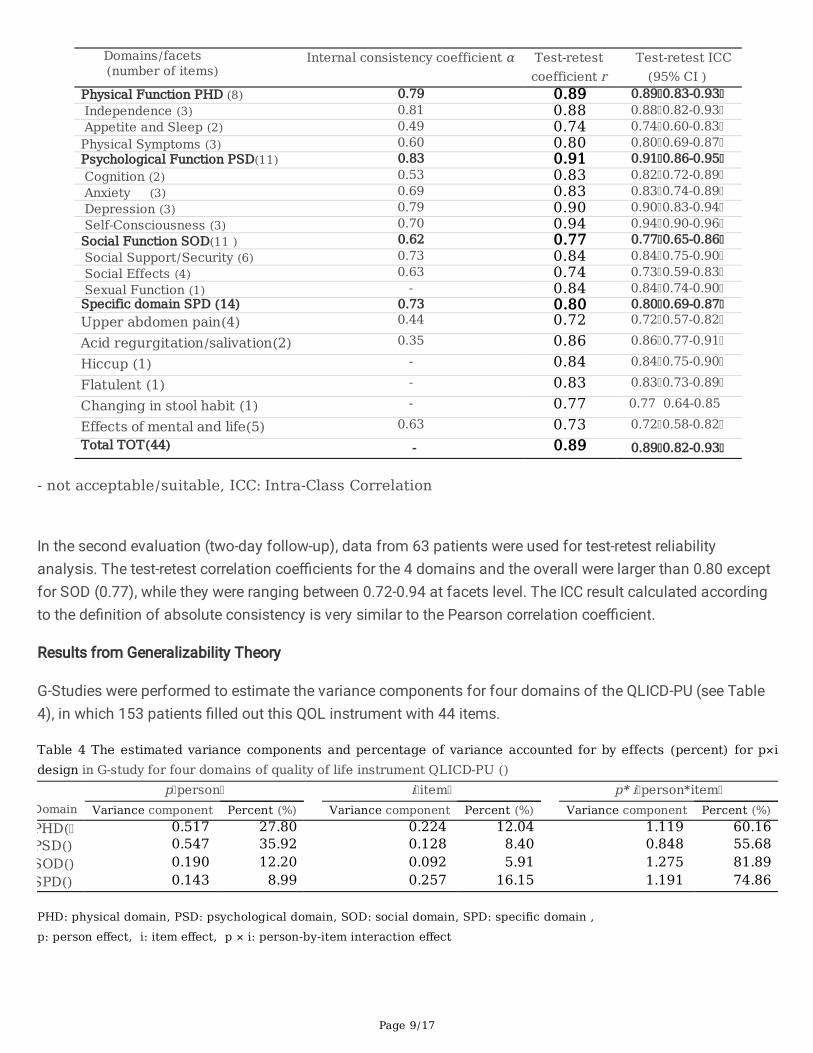
Physical Function PHD (8) 0.79 0.89 0.89 0.83-0.93 Independence (3) 0.81 0.88 0.88 0.82-0.93 Appetite and Sleep (2) 0.49 0.74 0.74 0.60-0.83Physical Symptoms (3) 0.60 0.80 0.80 0.69-0.87Psychological Function PSD(11) 0.83 0.91 0.91 0.86-0.95 Cognition (2) 0.53 0.83 0.82 0.72-0.89 Anxiety (3) 0.69 0.83 0.83 0.74-0.89 Depression (3) 0.79 0.90 0.90 0.83-0.94 Self-Consciousness (3) 0.70 0.94 0.94 0.90-0.96Social Function SOD(11 ) 0.62 0.77 0.77 0.65-0.86 Social Support/Security (6) 0.73 0.84 0.84 0.75-0.90 Social Effects (4) 0.63 0.74 0.73 0.59-0.83 Sexual Function (1) - 0.84 0.84 0.74-0.90Specific domain SPD (14) 0.73 0.80 0.80 0.69-0.87Upper abdomen pain(4) 0.44 0.72 0.72 0.57-0.82
Acid regurgitation/salivation(2) 0.35 0.86 0.86 0.77-0.91
Hiccup (1) - 0.84 0.84 0.75-0.90
Flatulent (1) - 0.83 0.83 0.73-0.89
Changing in stool habit (1) - 0.77 0.77 0.64-0.85
Effects of mental and life(5) 0.63 0.73 0.72 0.58-0.82Total TOT(44) - 0.89 0.89 0.82-0.93
- not acceptable/suitable, ICC: Intra-Class Correlation
In the second evaluation (two-day follow-up), data from 63 patients were used for test-retest reliabilityanalysis. The test-retest correlation coe�cients for the 4 domains and the overall were larger than 0.80 exceptfor SOD (0.77), while they were ranging between 0.72-0.94 at facets level. The ICC result calculated accordingto the de�nition of absolute consistency is very similar to the Pearson correlation coe�cient.
Results from Generalizability Theory
G-Studies were performed to estimate the variance components for four domains of the QLICD-PU (see Table4), in which 153 patients �lled out this QOL instrument with 44 items.
Table 4 The estimated variance components and percentage of variance accounted for by effects (percent) for p×idesign in G-study for four domains of quality of life instrument QLICD-PU ()
p person i item p* i person*itemDomain Variance component Percent (%) Variance component Percent (%) Variance component Percent (%)PHD( 0.517 27.80 0.224 12.04 1.119 60.16PSD() 0.547 35.92 0.128 8.40 0.848 55.68SOD() 0.190 12.20 0.092 5.91 1.275 81.89SPD() 0.143 8.99 0.257 16.15 1.191 74.86
PHD: physical domain, PSD: psychological domain, SOD: social domain, SPD: specific domain ,p: person effect, i: item effect, p × i: person-by-item interaction effect
Page 10/17
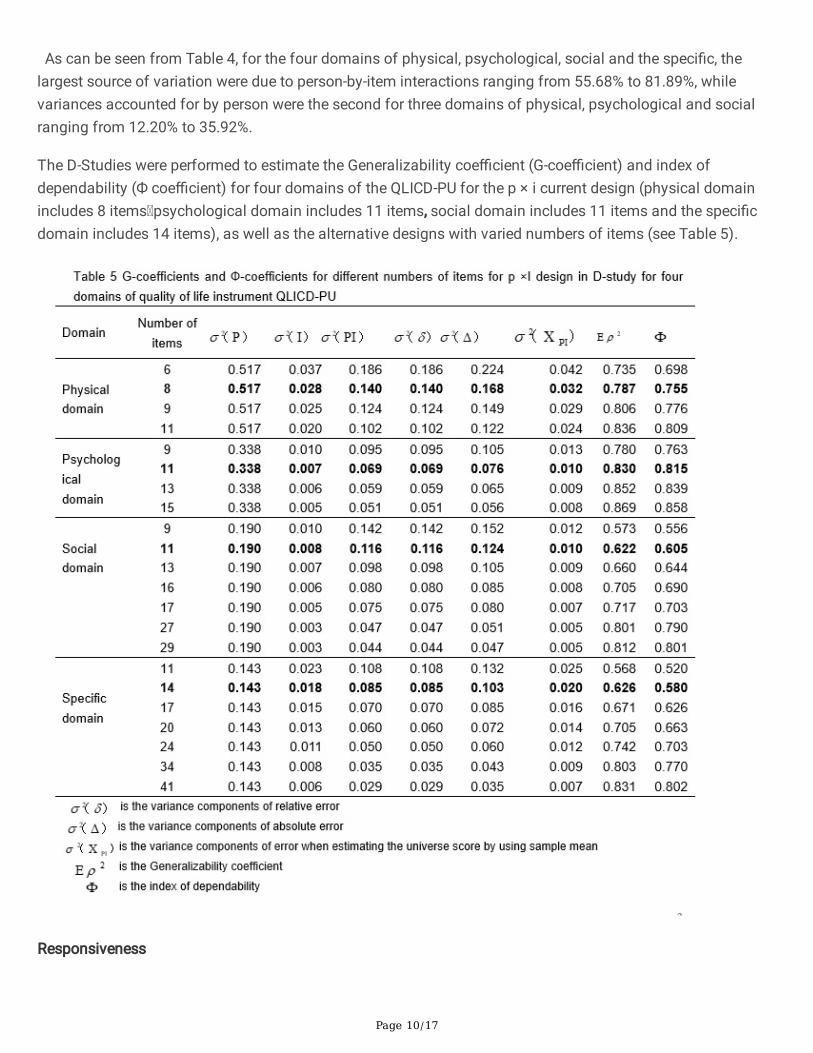
As can be seen from Table 4, for the four domains of physical, psychological, social and the speci�c, thelargest source of variation were due to person-by-item interactions ranging from 55.68% to 81.89%, whilevariances accounted for by person were the second for three domains of physical, psychological and socialranging from 12.20% to 35.92%.
The D-Studies were performed to estimate the Generalizability coe�cient (G-coe�cient) and index ofdependability (Ф coe�cient) for four domains of the QLICD-PU for the p × i current design (physical domainincludes 8 items psychological domain includes 11 items, social domain includes 11 items and the speci�cdomain includes 14 items), as well as the alternative designs with varied numbers of items (see Table 5).
Responsiveness

Page 11/17
The data from 135 patients who completed the questionnaire after treatments were used to assessresponsiveness. The paired t-test and the response index SRM were used to check the average score change ofeach domain/facet of QLICD-PU before and after treatments. The results are shown in Table 6. It can be seenthat except for social impact and sexual function, all domains/facets and overall scale have undergone majorchanges (p <0.01), with SRM ranging from 0.04 to 1.03 and domain-level SRM from 0.34 to 1.03.
Table 6 Responsiveness of the quality of life instrument QLICD-PU (n=135) omains/facets number of items)
Before treatmentMean SD
After treatment Mean SD
Differences Mean SD
t p SRM
ical Function (8) 58.70 19.53 71.57 13.06 -12.87 17.37 -8.61 <0.001 0.74 pendence (3) 71.23 27.41 82.35 16.48 -11.11 23.39 -5.52 <0.001 0.47 etite and Sleep (2) 43.24 25.59 58.33 21.87 -15.09 24.39 -7.19 <0.001 0.62 ical Symptoms (3) 56.48 22.11 69.63 15.75 -13.15 21.07 -7.25 <0.001 0.62 hological Function(11) 75.35 16.15 83.84 13.85 -8.48 11.78 -8.37 <0.001 0.72 nition (2) 68.61 22.85 81.11 17.80 -12.50 23.76 -6.11 <0.001 0.53 ety (3) 69.57 22.24 84.81 17.57 -15.25 20.09 -8.82 <0.001 0.76 ression (3) 82.47 20.70 87.35 14.71 -4.88 14.27 -3.97 <0.001 0.34 Consciousness (3) 78.52 19.09 81.17 16.51 -2.65 10.95 -2.82 0.006 0.24
al Function (11 ) 67.41 14.21 71.16 12.92 -3.75 10.99 -3.97 <0.001 0.34 al Support/Security (6) 69.69 19.73 76.60 15.04 -6.91 13.64 -5.89 <0.001 0.51 al Effects (4) 64.44 22.08 63.75 21.27 0.69 18.00 0.45 0.655 0.04 ual Function (1) 65.56 30.67 68.15 27.90 -2.59 21.22 -1.42 0.158 0.12 Total (QLICD-GM) (30) 68.00 12.56 75.92 10.90 -7.92 10.02 -9.19 <0.001 0.79
ific domain(14) 62.72 11.86 74.44 12.14 -11.72 11.43 -11.91 <0.001 1.03 er abdomen pain(4) 53.47 17.90 68.43 11.66 -14.95 19.60 -8.86 <0.001 0.76 regurgitation/salivation(2) 75.83 21.28 86.94 18.19 -11.11 19.77 -6.53 <0.001 0.56 up (1) 70.00 28.78 85.56 19.19 -15.56 26.43 -6.84 <0.001 0.59 ulent (1) 60.19 29.97 80.00 23.22 -19.81 27.67 -8.32 <0.001 0.72 nging in stool habit (1) 48.89 28.95 54.63 24.66 -5.74 27.14 -2.46 0.014 0.21 cts of mental and life(5) 66.70 18.66 74.89 19.24 -8.19 13.90 -6.84 <0.001 0.59
(44) 66.32 10.73 75.45 10.36 -9.13 9.38 -11.31 <0.001 0.97
SRM: Standardized Response Mean
DiscussionsThe focus of this study was to develop and validate a special QOL instrument QLICD-PU for peptic ulcerdisease. We used a modular method that combines a general module with a speci�c module for a speci�cdisease to capture common features within the disease category and the differences between the speci�cdisease [18-20]. In fact, we have developed a new instrument system for chronic diseases (QLICD)systematically and effectively by adopting this modular approach, in which the general module QLICD-GM isused for various chronic diseases, and QLCID-PU is only for a speci�c scale of PUD. This method uses thesame general module and similar structure to unify all QLICD speci�c disease tools.
Compared with existing instruments, QLICD-PU has several advantages [20-23]. First, it can compare the QOLof various diseases through a general module, and can also capture symptoms and side effects through a

Page 12/17
speci�c module. For example, we can use QLICD-GM to capture general QOL in patients with differentdiseases, while we can also employ QLICD-PU and QLICD-CG to capture differences in QOL in PUD and chronicgastritis patients further. Secondly, the different mean scores can be calculated to detect detailed changes, notonly at the domain level (4 domains) but also at the facet level (16 facets), because the QLICD-PU is consistedof a moderate number of items with a clear hierarchy (item → facet → domain → the overall) . Users canchoose one or two levels for research at their convenience. Third, the most important value of QLICD-PU is theprofound Chinese cultural background behind it. For example, Chinese culture focuses on family relations andpedigree, diet, temperament, and noble spirit, all of which are re�ected in QLICD-PU through items that focuson appetite, sleep, energy, and family support.
Generally speaking, practical QOL instruments require excellent psychometric characteristics, including validity,reliability and responsiveness. Validity is the degree to which the tool can capture what it claims to measure.Follow WHO's de�nition of quality of life [34] and systematic development procedure, we developed QLICD-PUfor PUD patients through focus group discussions, in-depth interviews, and pre-tests to effectively reduce thenumber of items. It has been reduced effectively the number of items to 30 from an initial 73 item bank for the�nal version of the general module [20], and reduced to 14 items of the speci�c module from the �rst 29 items.This process helps us achieve good content validity and conceptual structure of this instrument. Correlationand factor analysis were used to con�rm the construct validity. Correlation analysis showed that therelationship between items and their domains/facets is strong, but the relationship between items and otherdomains/facets is weak. Factor analysis showed that the components extracted from the data are consistentwith the theoretical structural framework of the instrument. These results con�rmed evidence supporting thegood construct validity. The correlation coe�cients between the QLICD-PU and SF-36 domain scoresdemonstrated that the criterion-related validity and construct validity (the convergent and divergent validity)are both high.
Reliability refers to the repeatability or consistency of item ratings in different assessments. In this study,internal consistency reliability (Cronbach's α), test-retest reliability (Pearson r) and ICC were applied. Our resultsshowed that the internal consistency coe�cients for the QLICD-PU domains and the overall are both greaterthan 0.70 except for the social function domain (0.62). The test-retest reliability coe�cient of the overall scoreis 0.89, while the test-retest reliability coe�cients of domains are greater than 0.80 (except for social functiondomain) (0.77). Taking into account that the internal consistency coe�cient should be greater than 0.70 andthe test-retest reliability coe�cient should be greater than 0.80, which are considered satisfactory, these resultsindicated that the instrument has good reliability overall.
Responsiveness (sensitivity to detect changes) is the most important desirable characteristic of the QOL scalein clinical applications. There are two types of assessment methods: internal and external [28, 29]. In thisstudy, we used a paired t-test to focus on internal responses to compare the average response before and aftertreatments. We used SRM as a responsiveness indicator, with 0.20, 0.50, and 0.80 representing small,moderate, and large responsiveness [28,29]. The QOL scores had signi�cant changes after treatments for alldomains and the overall score (P<0.001) with SRM being greater 0.70 exception of the social function domain(0.34), suggesting QLICD-PU has good responsiveness.

Page 13/17
In addition to classical test theory analysis, this study also applied generalization theory. This researchpresented both G-coe�cients and Ф, and also their changes when items assumed to be changing. For thephysical and psychological domains, we estimated a G-coe�cients of 0.787, 0.830 and index of dependabilityof 0.755, 0.815 respectively for the current design. It can be considered that it meets the 0.70 standards. Forthe social domain, the current design G-coe�cient is estimated to be 0.622, and the index of dependability is0.605, which is lower than the acceptable 0.70. Therefore, the items of this domain need to be improved. Foran alternative design with 17 items, the G coe�cient is estimated to be 0.717 and the index of dependability is0.703, which will satisfy acceptable reliability. For the speci�c domain, the G-coe�cient of the current design isestimated to be 0.626, and the index of dependability is 0.580, which is also lower than the acceptable 0.70.Similarly, the G-coe�cient estimated to be 0.742 and the index of dependability 0.703 when an alternativedesign with 24 items. Therefore, these analyses suggested that the number of items of the social domainneeds to be increased from 11 to 17, and the speci�c domain from 11 to 24 to reach acceptable reliability.However, it may not be practical to increase the length of the test in practice, as reliability is reduced if thesubject is required to complete too many items at the same time. Researchers or instrument users can decideto add items or tolerate reasonable low reliability.
ConclusionsIn conclusion, the QLICD-PU can be used as a useful tool for assessing the quality of life of patients with PUD,with good psychometric characteristics and many advantages. The analysis from Generalizability theory notonly con�rmed the reliability of the scale as a whole, but it also provided more information than CTT. However,the number of items for social and the speci�c domains should be increased to increase reliability. Besides, thequality of items in these 2 domains should also be addressed.
List Of AbbreviationsCTT: Classical Test Theory;
D-study: decision study;
FDDQL: Functional Digestive Disorder Quality of Life Questionnaire;
G-study: generalizability study; GSRS: Gastrointestinal Symptom Rating Scale; GT: Generalizability theory;
HRQOL: Health-Related Quality Of Life;
ICC :Intra-Class Correlation;
PGWB: Psychological General Well-Being; PUD :Peptic ulcer disease;
QLDUP: Quality of Life in Duodenal Ulcer Patients;
QLICD: Quality of Life Instruments for Chronic Diseases; QOL: Quality of life;
QOLRAD :Quality Of Life in Re�ux and Dyspepsia ; QPD: quality of life in peptic disease;

Page 14/17
SRM: Standardized Response Mean;
DeclarationsEthics approval and consent to participate
The study protocol and the informed consent form were approved by the IRB (institutional review board) ofKunming Medical University (30860248, Kunming Medical University, 01/17/2009).
Consent to publish
The authors understand and agree to publish.
Availability of data and materials
The data can be available by request.
Competing interests
The authors declare that they have no competing interests.\
Funding
The paper is supported by the National Natural Science Foundation of China (71373058, 30860248), Scienceand Technological Planning Program of Guangdong Province(2013B021800074). The funding bodiesprovided funds to support project development. The grant recipient (Chonghua Wan) designed the study,performed the data collection and data analyses, and extensively revised the manuscript.
Authors' contributions
WCH and CY designed the study. GL, ZQQ performed the data collection and WCH,QP performed dataanalyses, and all authors contributed to interpreting the data. WCH SXY and ZQQ wrote the �rst draft, whichwas critically revised by all others. All authors have read and approved the �nal manuscript.
Acknowledgments
In carrying out this research item, we have received substantial assistance from Liping Duan, Hongying Li andWu Li at the �rst a�liated hospital of Kunming Medical University, Bin Wu and Fuzhen Liu at the a�liatedhospital of Guangdong Medical University,and Susan Messing at University of Rochester, NY, USA. Wesincerely acknowledge all the support.
Authors' Information
Chonghua Wan, PhD; Peng Quan, PhD; Xiaoyuan Sun, PhD: School of Humanities and Management, ResearchCenter for Quality of Life and Applied Psychology, Key Laboratory for Quality of Life and Psychologicalassessment and Intervention, Guangdong Medical University, Dongguan 523808, CHINA

Page 15/17
Ying Chen, MM: School of Public Health, Kunming Medical University, Kunming 650500, CHINA.
Li Gao, MM: Taian city central hospital, Taian 271000, CHINA
Qingqing Zhang, MM: Department of Statistics and Medical Record Management, Shandong ProvincialHospital A�liated to Shandong University, Jinan 250021, CHINA
References1. NIH Consensus Conference. NIH Consensus Development Panel on Helicobacter pylori in Peptic Ulcer
Disease. Helicobacter pylori in peptic ulcer disease. JAMA 1994;272(1):65–69.
2. Sonnenberg A, Everhart JE. Health impact of peptic ulcer in the United States. Am J Gastroenterol1997;92(4):614–620.
3. Baghianimoghadam MH, Mohamadi S, Baghianimoghadam M, Falahi A, Roghani HS. Survey on qualityof life related factors in patients with peptic ulcer based on PRECEDE model in Yazd, Iran. J Med Life.2011;4(4):407-11
4. Ehlin AG, Montgomery SM, Ekbom A, Pounder RE, Wake�eld AJ. Prevalence of gastrointestinal diseases intwo British national birth cohorts. Gut. 2003;52(8):1117-21.
5. Suadicani P, Hein HO, Gyntelberg F. Genetic and life-style determinants of peptic ulcer. A study of 3387men aged 54 to 74 years: The Copenhagen Male Study. Scand J Gastroenterol. 1999;34(1):12-7.
�. van Leerdam ME, Vreeburg EM, Rauws EA, Geraedts AA, Tijssen JG, Reitsma JB, Tytgat GN. Acute upperGI bleeding: did anything change? Time trend analysis of incidence and outcome of acute upper GIbleeding between 1993/1994 and 2000. Am J Gastroenterol. 2003;98(7):1494-9.
7. Lau JY, Sung J, Hill C, Henderson C, Howden CW, Metz DC. Systematic review of the epidemiology ofcomplicated peptic ulcer disease: incidence, recurrence, risk factors and mortality. Digestion.2011;84(2):102-13.
�. Mokrowiecka A, Jurek K, Pińkowski D, Małecka-Panas E. The comparison of Health-Related Quality of Life(HRQL) in patients with GERD, peptic ulcer disease and ulcerative colitis. Adv Med Sci. 2006;51:142-7.
9. Barkun A, Leontiadis G: Systematic review of the symptom burden, quality of life impairment and costsassociated with peptic ulcer disease. Am J Med. 2010;123(4):358-66.
10. Zboralski K, Florkowski A, Talarowska-Bogusz M, MacanderM, Gałecki P. Quality of life and emotionalfunctioning in selected psychosomatic disease. Postepy Hig Med Dosw (Online). 2008;62:36-41.
11. Guyatt GH, Naylor CD,Juniper E,Heyland DK,Jaeschke R,Cook DJ. Users’ guides to the medical literature,XII: how to use articles about health-related quality of life. JAMA.1997;277:1232-1237.
12. De Carli G, Irvine SH, Arpinelli F, Bam� F, Olivieri A, Recchia G. Development and validation of QPD 32, aspeci�c questionnaire for measuring the quality of life of patients with peptic ulcer. Minerva GastroenterolDietol.1995;41(4):275-82.
13. Martin C, Marquis P, Bon�ls S. A 'quality of life questionnaire' adapted to duodenal ulcer therapeutic trials.Scand J Gastroenterol Suppl. 1994;206:40-3
14. Wiklund IK, Junghard O, Grace E, Talley NJ, Kamm M, Veldhuyzen van Zanten S,Paré P, Chiba N, LeddinDS, Bigard MA, Colin R, Schoenfeld P. Quality of Life in Re�ux and Dyspepsia patients. Psychometric
Page 16/17
documentation of a new disease-speci�c questionnaire (QOLRAD). Eur J Surg Suppl. 1998;(583):41-9.
15. Crawley J, Frank L, Joshua-Gotlib S, Flynn J, Frank S, Wiklund I. Measuring change in quality of life inresponse to Helicobacter pylori eradication in peptic ulcer disease: the QOLRAD. Dig Dis Sci.2001;46(3):571-80.
1�. Chassany O, Marquis P, Scherrer B, Read NW, Finger T, Bergmann JF. Validation of a speci�c quality of lifequestionnaire for functional digestive disorders. Gut 1999;44:527–33.
17. Svedlund J, Sjodin I, Dotevall G. GSRS-A clinical rating scale for gastrointestinal symptoms in patientswith irritable bowel syndrome and peptic ulcer disease. Dig Dis Sci 1988;33:129-34.
1�. Sprangers MA, Cull A, Groenvold M, Bjordal K, Blazeby J, Aaronson NK. The European Organization forResearch and Treatment of Cancer approach to developing questionnaire modules: an update andoverview. EORTC Quality of Life Study Group. Qual Life Res 1998,7(4):291-300.
19. Cella D, Nowinski CJ. Measuring quality of life in chronic illness: the functional assessment of chronicillness therapy measurement system. Arch phys med rehabil 2002,83(12 Suppl 2): S10-S17.
20. Wan CH, Tu XM, Messing S, Li XM, Yang Z, Zhao XD, Gao L, Yang YP, Pan JH, Zhou ZF. Development andValidation of the General Module (QLICD-GM) of the System of Quality of Life Instruments for ChronicDiseases and Comparison with SF-36. J Pain Symptom Manage, 2011, 42(1):93-104.
21. Wan C, Li H, Fan X, Yang R, Pan J, Chen W, Zhao R. Development and validation of the coronary heartdisease scale under the system of quality of life instruments for chronic diseases QLICD-CHD:combinations of classical test theory and Generalizability Theory. Health Qual Life Outcomes. 2014;12:82.doi:10.1186/1477-7525-12-82.
22. Wan CH, Jiang RS, Tu XM, Tang W, Pan JH, Yang RX, Li XM, Yang Z, Zhang XQ. The Hypertension Scale ofthe System of Quality of Life Instruments for Chronic Diseases QLICD-HY: Development and ValidationStudy. Int J Nurs Stud, 2012,49(4):465-480.
23. Lei P, Lei G, Tian J, Zhou Z, Zhao M, Wan C. Development and validation of the irritable bowel syndromescale under the system of quality of life instruments for chronic diseases QLICD-IBS: combinations ofclassical test theory and generalizability theory. Int J Colorectal Dis. 2014;29(10):1245-1255.doi:10.1007/s00384-014-1976-x.
24. Yang Z, Li W , Tu XM, Tang W, Messing S, Duan LP. Validation and Psychometric Properties of ChineseVersion of SF-36 in Patients with Hypertension, Coronary Heart Diseases, Chronic Gastritis and PepticUlcer. Int J Clin Pract 2012;66(10):991-998.
25. Hays RD, Hayashi T. Beyond internal consistency reliability: Rationale and use’s guide for multi-traitanalysis program on the microcomputer. Behav Res Methods Instrum Compu 1990;22:167-175.
2�. Ren S, Yang S, Lai S. Intraclass correlation coe�cients and bootstrap methods of hierarchical binaryoutcomes. Stat Med. 2006;25(20):3576-3588.
27. Schuck P. Assessing reproducibility for interval data in health-related quality of life questionnaires: Whichcoe�cient should be used? Qual Life Res 2004;13: 571-586.
2�. Terwee CB, Dekker FW, Wiersinga WM, Prummel MF, Bossuyt PM. On assessing responsiveness of health-related quality of life instruments: Guidelines for instrument evaluation. Qual Life Res 2003;12(4):349-363.

Page 17/17
29. Revicki D, Hays RD, Cella D, Sloan J. Recommended methods for determining responsiveness andminimally important differences for patient-reported outcomes.J Clin Epidemiol. 2008;61(2):102-109.
30. Winterstein BP, Willse JT, Kwapi TR, et al. Assessment of Score Dependability of the Wisconsin SchizotypyScales Using Generalizability Analysis. Psychopathol Behav Assess, 2010; 32,575–585.
31. Stora B, Hagtvet KA, Heyerdahl S. Reliability of observers' subjective impressions of families: Ageneralizability theory approach. Psychother Res. 2013 ;23(4):448-463.
32. Crits-Christoph P, Johnson J, Gallop R, et al. A generalizability theory analysis of group process ratings inthe treatment of cocaine dependence. Psychother Res. 2011;21(3):252-266.
33. Heitman RJ, Kovaleski JE, Pugh SF. Application of generalizability theory in estimating the reliability ofankle-complex laxity measurement. J Athl Train. 2009;44(1):48-52.
34. The WHOQOL Group. The Word Health Organization Quality of Life assessment (WHOQOL): Devolvementand psychometric properties. Sci. Med. 1998;46(12): 1569-1585.
Supplementary Files
This is a list of supplementary �les associated with this preprint. Click to download.
EQLICDPUV1.0.doc
TablesofQLICDPU.pdf