GENERAL PURPOSE FINANCIAL REPORT - … · GENERAL PURPOSE FINANCIAL REPORT FOR THE YEAR 1 JULY 2015...
51
WESTGOLD RESOURCES PTY LTD ACN 009 260 306 GENERAL PURPOSE FINANCIAL REPORT FOR THE YEAR 1 JULY 2015 TO 30 JUNE 2016
Transcript of GENERAL PURPOSE FINANCIAL REPORT - … · GENERAL PURPOSE FINANCIAL REPORT FOR THE YEAR 1 JULY 2015...

WESTGOLD RESOURCES PTY LTD
ACN 009 260 306
GENERAL PURPOSE FINANCIAL REPORT
FOR THE YEAR 1 JULY 2015 TO 30 JUNE 2016
Contents
Directors’ Report ...................................................................................................................... 2
Auditor’s Independence Declaration ....................................................................................... 10
Consolidated Statement of Comprehensive Income for the year ended 30 June 2016 ........... 11
Consolidated Statement of Financial Position as at 30 June 2016 ......................................... 12
Consolidated Statement of Cash Flows for the Year Ended 30 June 2016 ............................. 13
Consolidated Statement of Changes in Equity for the Year Ended 30 June 2016 .................. 14
Notes to the Consolidated Financial Statements for the Year Ended 30 June 2016 ............... 15
Directors’ Declaration ............................................................................................................. 48
Independent Audit Report ...................................................................................................... 49

Page 2
Directors’ Report
The Directors submit their report together with the financial report of Westgold Resources Pty Ltd (“Westgold” or “the Company”) and of the Consolidated Entity, being the Company and its controlled entities, for the year ended 30 June 2016.
DIRECTORS
The names and details of the Company’s Directors in office during the financial period and until the date of this report are as follows. Directors were in office for this entire period unless otherwise stated. Peter Cook Warren Hallam Paul Hucker (resigned - 3 October 2016) Peter Newton (appointed - 6 October 2016) Fiona Van Maanen (appointed – 6 October 2016)
COMPANY SECRETARY
Fiona Van Maanen
DIVIDENDS
No dividends have been paid or declared by the Company during the financial period or up to the date of this report.
PRINCIPAL ACTIVITIES
The principal activities during the year of the Consolidated Entity were:
operation of gold mines in Australia; and
exploration and development of precious metals projects in Australia.
EMPLOYEES
The Consolidated Entity had 251 employees at 30 June 2016 (2015: 178).
OPERATING AND FINANCIAL REVIEW
OPERATING RESULTS
The Consolidated Entity’s net loss after income tax for the period was $20,569,647 (2015: $13,665,501 profit), a decrease of 191% as compared to the previous financial year.
Consolidated revenue: $280,317,331 (2015: $232,776,237);
Consolidated total cost of sales: $279,295,243 (2015: $185,078,076);
Impairment losses on mine properties and development: nil (2015: $4,717,594); and
Exploration and evaluation expenditure write off: $27,063,338 (2015: $5,974,542).
There was an overall increase in revenue resulting from the onset of production from the Central Murchison Gold Project (“CMGP”) after plant commissioning in mid-October 2015 and due to increased production occurring as the HBJ underground mine (at the South Kalgoorlie Operation (“SKO”)) transitioned from a development phase to a production phase. These increases in revenue were offset by lower production due to lower grades from the Trident underground mine at the Higginsville Gold Operation (“HGO”).
There was an increase in the cost of sales resulting from the commencement of production at CMGP and due to higher costs of deeper underground mining and post-fill requirements at HGO and SKO and an increase in amortisation rates.
In the current period no impairment losses were recognised, in 2015 the impairment on mine properties and development related to the closure of the Chalice underground mine (2015: $4,717,594) at the HGO.
Exploration and evaluation expenditure write off of $27,063,338 (2015: $5,974,542) due to a review of each area of interest to determine the appropriateness of continuing to carry forward costs in relation to those areas of interest.
Page 3
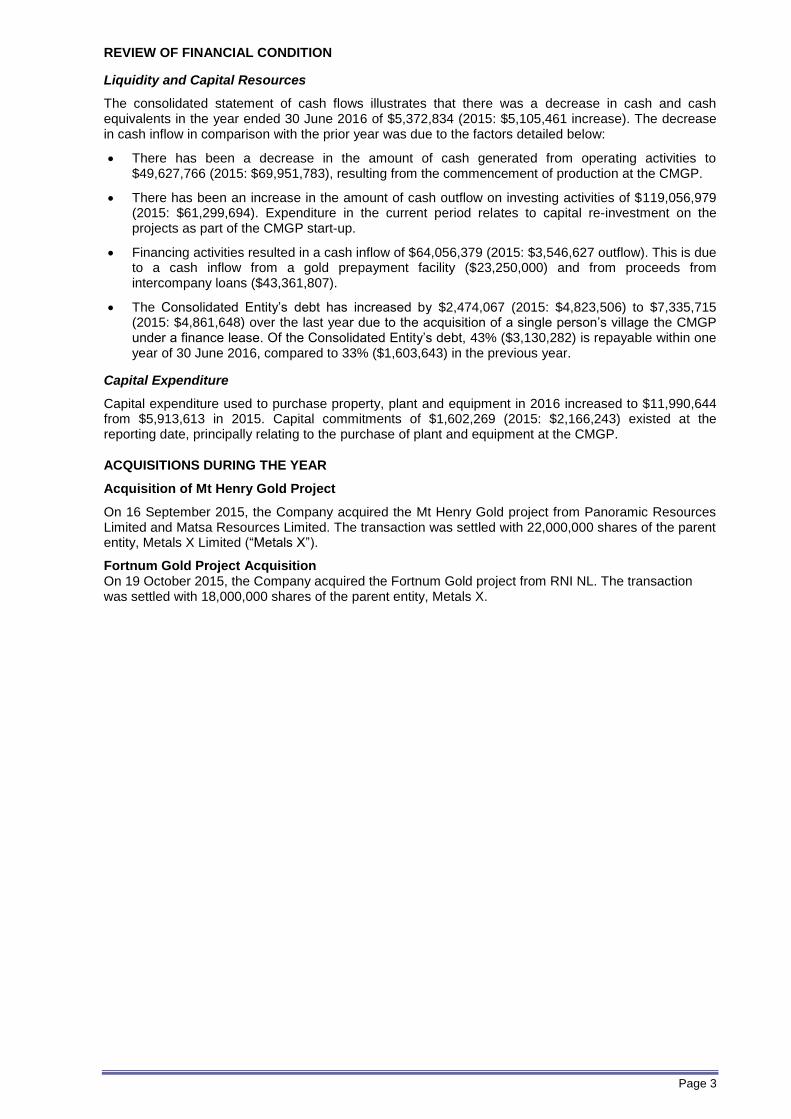
REVIEW OF FINANCIAL CONDITION
Liquidity and Capital Resources
The consolidated statement of cash flows illustrates that there was a decrease in cash and cash equivalents in the year ended 30 June 2016 of $5,372,834 (2015: $5,105,461 increase). The decrease in cash inflow in comparison with the prior year was due to the factors detailed below:
There has been a decrease in the amount of cash generated from operating activities to $49,627,766 (2015: $69,951,783), resulting from the commencement of production at the CMGP.
There has been an increase in the amount of cash outflow on investing activities of $119,056,979 (2015: $61,299,694). Expenditure in the current period relates to capital re-investment on the projects as part of the CMGP start-up.
Financing activities resulted in a cash inflow of $64,056,379 (2015: $3,546,627 outflow). This is due to a cash inflow from a gold prepayment facility ($23,250,000) and from proceeds from intercompany loans ($43,361,807).
The Consolidated Entity’s debt has increased by $2,474,067 (2015: $4,823,506) to $7,335,715 (2015: $4,861,648) over the last year due to the acquisition of a single person’s village the CMGP under a finance lease. Of the Consolidated Entity’s debt, 43% ($3,130,282) is repayable within one year of 30 June 2016, compared to 33% ($1,603,643) in the previous year.
Capital Expenditure
Capital expenditure used to purchase property, plant and equipment in 2016 increased to $11,990,644 from $5,913,613 in 2015. Capital commitments of $1,602,269 (2015: $2,166,243) existed at the reporting date, principally relating to the purchase of plant and equipment at the CMGP.
ACQUISITIONS DURING THE YEAR
Acquisition of Mt Henry Gold Project
On 16 September 2015, the Company acquired the Mt Henry Gold project from Panoramic Resources Limited and Matsa Resources Limited. The transaction was settled with 22,000,000 shares of the parent entity, Metals X Limited (“Metals X”).
Fortnum Gold Project Acquisition On 19 October 2015, the Company acquired the Fortnum Gold project from RNI NL. The transaction was settled with 18,000,000 shares of the parent entity, Metals X.
Page 4
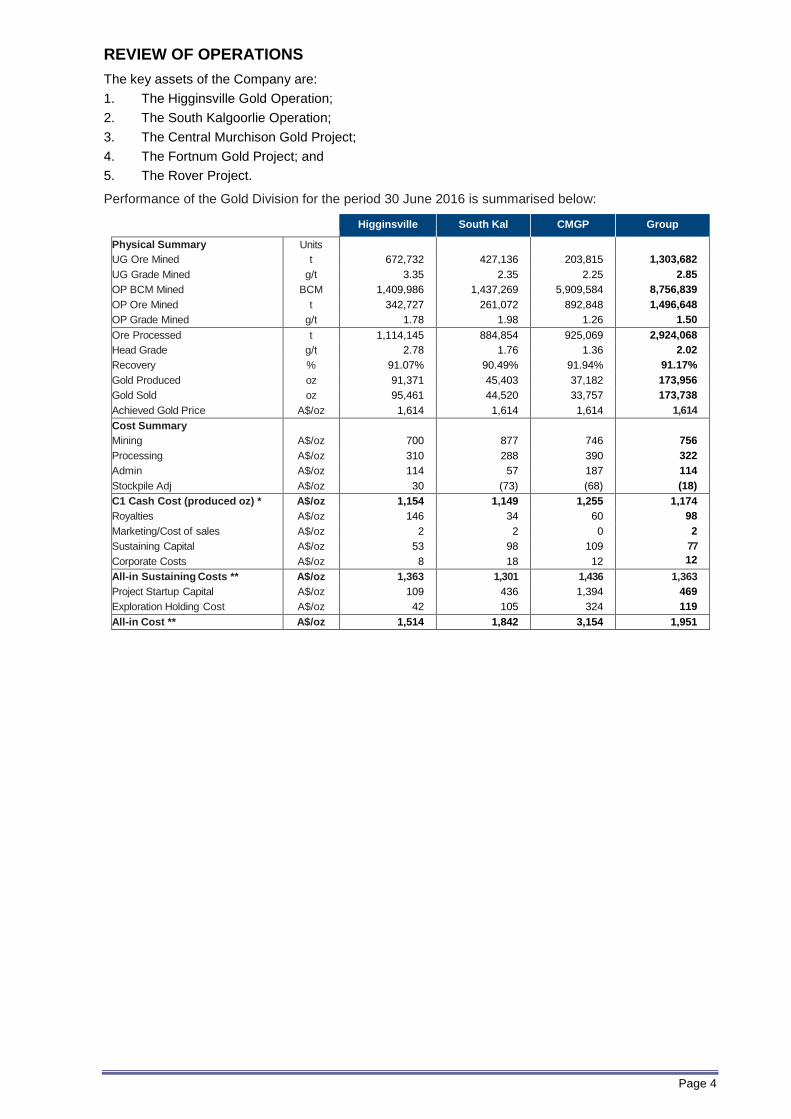
REVIEW OF OPERATIONS
The key assets of the Company are:
1. The Higginsville Gold Operation;
2. The South Kalgoorlie Operation;
3. The Central Murchison Gold Project;
4. The Fortnum Gold Project; and
5. The Rover Project.
Performance of the Gold Division for the period 30 June 2016 is summarised below:
Higginsville South Kal CMGP Group
Physical Summary Units
UG Ore Mined t 672,732 427,136 203,815 1,303,682
UG Grade Mined g/t 3.35 2.35 2.25 2.85
OP BCM Mined BCM 1,409,986 1,437,269 5,909,584 8,756,839
OP Ore Mined t 342,727 261,072 892,848 1,496,648
OP Grade Mined g/t 1.78 1.98 1.26 1.50
Ore Processed t 1,114,145 884,854 925,069 2,924,068
Head Grade g/t 2.78 1.76 1.36 2.02
Recovery % 91.07% 90.49% 91.94% 91.17%
Gold Produced oz 91,371 45,403 37,182 173,956
Gold Sold oz 95,461 44,520 33,757 173,738
Achieved Gold Price A$/oz 1,614 1,614 1,614 1,614
Cost Summary
Mining A$/oz 700 877 746 756
Processing A$/oz 310 288 390 322
Admin A$/oz 114 57 187 114
Stockpile Adj A$/oz 30 (73) (68) (18)
C1 Cash Cost (produced oz) * A$/oz 1,154 1,149 1,255 1,174
Royalties A$/oz 146 34 60 98
Marketing/Cost of sales A$/oz 2 2 0 2
Sustaining Capital A$/oz 53 98 109 77
Corporate Costs A$/oz 8 18 12 12 All-in Sustaining Costs ** A$/oz 1,363 1,301 1,436 1,363
Project Startup Capital A$/oz 109 436 1,394 469
Exploration Holding Cost A$/oz 42 105 324 119
All-in Cost ** A$/oz 1,514 1,842 3,154 1,951
Page 5
REVIEW OF OPERATIONS (continued)
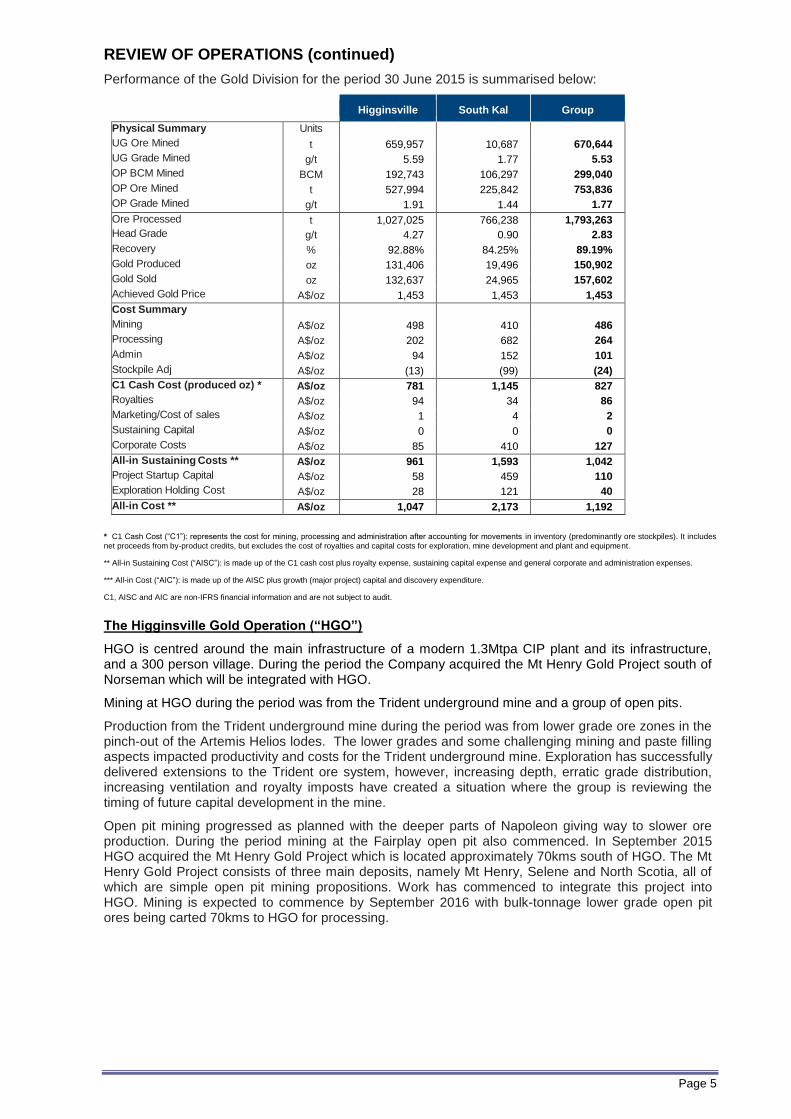
Performance of the Gold Division for the period 30 June 2015 is summarised below:
Higginsville South Kal Group
Physical Summary Units
UG Ore Mined t 659,957 10,687 670,644
UG Grade Mined g/t 5.59 1.77 5.53
OP BCM Mined BCM 192,743 106,297 299,040
OP Ore Mined t 527,994 225,842 753,836
OP Grade Mined g/t 1.91 1.44 1.77
Ore Processed t 1,027,025 766,238 1,793,263
Head Grade g/t 4.27 0.90 2.83
Recovery % 92.88% 84.25% 89.19%
Gold Produced oz 131,406 19,496 150,902
Gold Sold oz 132,637 24,965 157,602
Achieved Gold Price A$/oz 1,453 1,453 1,453
Cost Summary
Mining A$/oz 498 410 486
Processing A$/oz 202 682 264
Admin A$/oz 94 152 101
Stockpile Adj A$/oz (13) (99) (24)
C1 Cash Cost (produced oz) * A$/oz 781 1,145 827
Royalties A$/oz 94 34 86
Marketing/Cost of sales A$/oz 1 4 2
Sustaining Capital A$/oz 0 0 0
Corporate Costs A$/oz 85 410 127
All-in Sustaining Costs ** A$/oz 961 1,593 1,042
Project Startup Capital A$/oz 58 459 110
Exploration Holding Cost A$/oz 28 121 40
All-in Cost ** A$/oz 1,047 2,173 1,192
* C1 Cash Cost (“C1”): represents the cost for mining, processing and administration after accounting for movements in inventory (predominantly ore stockpiles). It includes
net proceeds from by-product credits, but excludes the cost of royalties and capital costs for exploration, mine development and plant and equipment.
** All-in Sustaining Cost (“AISC”): is made up of the C1 cash cost plus royalty expense, sustaining capital expense and general corporate and administration expenses.
*** All-in Cost (“AIC”): is made up of the AISC plus growth (major project) capital and discovery expenditure.
C1, AISC and AIC are non-IFRS financial information and are not subject to audit.
The Higginsville Gold Operation (“HGO”)
HGO is centred around the main infrastructure of a modern 1.3Mtpa CIP plant and its infrastructure, and a 300 person village. During the period the Company acquired the Mt Henry Gold Project south of Norseman which will be integrated with HGO.
Mining at HGO during the period was from the Trident underground mine and a group of open pits.
Production from the Trident underground mine during the period was from lower grade ore zones in the pinch-out of the Artemis Helios lodes. The lower grades and some challenging mining and paste filling aspects impacted productivity and costs for the Trident underground mine. Exploration has successfully delivered extensions to the Trident ore system, however, increasing depth, erratic grade distribution, increasing ventilation and royalty imposts have created a situation where the group is reviewing the timing of future capital development in the mine.
Open pit mining progressed as planned with the deeper parts of Napoleon giving way to slower ore production. During the period mining at the Fairplay open pit also commenced. In September 2015 HGO acquired the Mt Henry Gold Project which is located approximately 70kms south of HGO. The Mt Henry Gold Project consists of three main deposits, namely Mt Henry, Selene and North Scotia, all of which are simple open pit mining propositions. Work has commenced to integrate this project into HGO. Mining is expected to commence by September 2016 with bulk-tonnage lower grade open pit ores being carted 70kms to HGO for processing.

Page 6
REVIEW OF OPERATIONS (continued)
The South Kalgoorlie Operation (“SKO”)
The SKO operations are centred upon an older 1.2Mtpa CIP plant and infrastructure. Numerous open pits and underground deposits have previously been mined within the tenement area since the late 1980’s.
The main focus of SKO during the period continued to be on the HBJ underground mine which remained in a capital development phase for half of the period. HBJ underground mine transitioned to a production phase which significantly improved its physical and financial outputs. The smaller amounts of development ore from HBJ underground mine was blended with existing low-grade stocks and ores from small low grade open pits.
Mining commenced at Stage 1 Cannon open pit mine which is subject to a mine financing and profit sharing agreement with Southern Gold Limited (“SAU”) for the development of the Cannon open pit mine and potentially an underground mine at Bulong. Under the agreement, SKO operates and manages the mine. Ore is batch processed in parcels of approximately 40,000 tonnes through the SKO process plant. The first batch of ore was successfully processed through the SKO process plant in November. All proceeds from the sale of the Cannon production goes first to repay all costs incurred by the project and SKO has the right to a 50% share of all surplus profits. During the period 163,827 tonnes were processed at a grade of 2.50 g/t to produce 12,074 ounces.
In July 2015 SKO acquired the George’s Reward Project which has an adjoining lease boundary with the Cannon open pit. The existing agreement with SAU was extended to allow the mining of a larger open pit across combining the Cannon (50% profit share) with George’s Reward (100% owned by Westgold). Mining of the larger open pit commenced in November 2015.
In June 2016 SKO acquired the Gunga Project which will provide an alternate ore source at the end of the Cannon campaigns.
The Central Murchison Gold Project (“CMGP”)
The CMGP is centred upon the refurbished 2.0 Mtpa process CIP plant (Bluebird process plant) and associated infrastructure. The project has numerous open pit and underground production options.
The overall consolidated CMGP project area has a number of historic gold mining centres and an aggregated gold production of nearly 10 million ounces. These include the Day Dawn, Cuddingwarra, Big Bell, Reedy, Nannine, Yaloginda, Paddy’s Flat and Meekatharra North gold mining centres with the bulk of historic production being sourced from a handful of larger underground mines.
The Bluebird process plant was commissioned on a campaign basis in October 2015 on open pit and low grade stockpile ores. Successful optimisation of the process plant continued during the period.
The Company acquired a new 260 person village at Cue to serve the southern operations and re-work the large Big Bell mineral resource at a higher cut-off grade to enable a better financial outcome for the planned underground mine.
Open pit mining commenced in June 2015. Open pit mining during the period was at Whangamata, Batavia, Jack Ryan, Callisto, Bluebird and Surprise West. Open pit mining in the ensuing period will be at Jack Ryan, Callisto, Bluebird, Surprise, Anarchist, Rhens Hope, Mickey Doolan, Gibraltar, Aladdin and Culiculli.
Underground mining at Paddy’s Flat commenced in mid-October 2015 with the decline now being well established. We have now completed the transition to stoping on both the Prohibition and the Viivien-Consols lodes and monthly production is now at steady state levels with both lots of stope grades reporting positive reconciliations against pre-mined estimates.
Dewatering at Big Bell underground commenced with re-access to the old portal expected late in the 2016 calendar year. A revised development plan using the higher cut-off resource estimate was completed. When operational, Big Bell will become the cornerstone production feed for the CMGP providing approximately 50% of long-term mill feed and over 80,000-100,000 ounces per annum to overall output.
A development plan to commence underground mining at the Comet mine near Cue commenced and submissions for statutory approvals have been lodged. Comet is expected to provide a bridge production feed whilst Big Bell is re-established and builds its production rates.
Page 7
REVIEW OF OPERATIONS (continued)
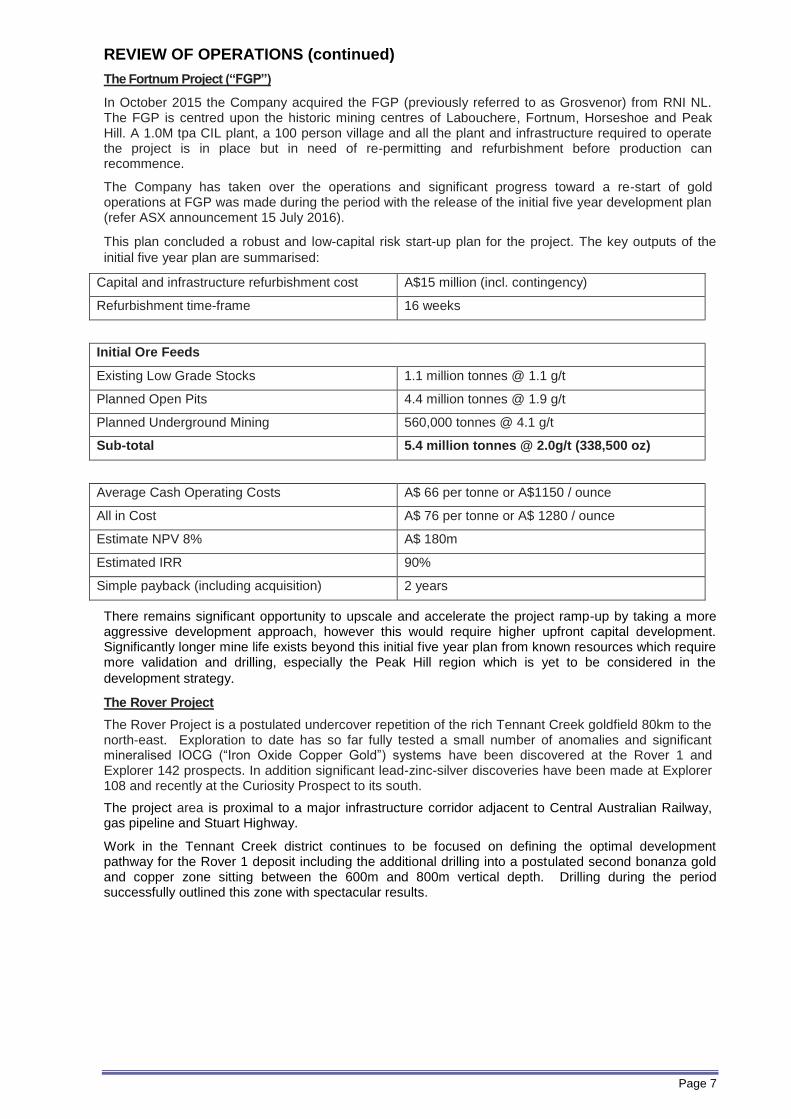
The Fortnum Project (“FGP”)
In October 2015 the Company acquired the FGP (previously referred to as Grosvenor) from RNI NL. The FGP is centred upon the historic mining centres of Labouchere, Fortnum, Horseshoe and Peak Hill. A 1.0M tpa CIL plant, a 100 person village and all the plant and infrastructure required to operate the project is in place but in need of re-permitting and refurbishment before production can recommence.
The Company has taken over the operations and significant progress toward a re-start of gold operations at FGP was made during the period with the release of the initial five year development plan (refer ASX announcement 15 July 2016).
This plan concluded a robust and low-capital risk start-up plan for the project. The key outputs of the
initial five year plan are summarised:
Capital and infrastructure refurbishment cost A$15 million (incl. contingency)
Refurbishment time-frame 16 weeks
Initial Ore Feeds
Existing Low Grade Stocks 1.1 million tonnes @ 1.1 g/t
Planned Open Pits 4.4 million tonnes @ 1.9 g/t
Planned Underground Mining 560,000 tonnes @ 4.1 g/t
Sub-total 5.4 million tonnes @ 2.0g/t (338,500 oz)
Average Cash Operating Costs A$ 66 per tonne or A$1150 / ounce
All in Cost A$ 76 per tonne or A$ 1280 / ounce
Estimate NPV 8% A$ 180m
Estimated IRR 90%
Simple payback (including acquisition) 2 years
There remains significant opportunity to upscale and accelerate the project ramp-up by taking a more aggressive development approach, however this would require higher upfront capital development. Significantly longer mine life exists beyond this initial five year plan from known resources which require more validation and drilling, especially the Peak Hill region which is yet to be considered in the
development strategy.
The Rover Project
The Rover Project is a postulated undercover repetition of the rich Tennant Creek goldfield 80km to the north-east. Exploration to date has so far fully tested a small number of anomalies and significant mineralised IOCG (“Iron Oxide Copper Gold”) systems have been discovered at the Rover 1 and Explorer 142 prospects. In addition significant lead-zinc-silver discoveries have been made at Explorer 108 and recently at the Curiosity Prospect to its south.
The project area is proximal to a major infrastructure corridor adjacent to Central Australian Railway, gas pipeline and Stuart Highway.
Work in the Tennant Creek district continues to be focused on defining the optimal development pathway for the Rover 1 deposit including the additional drilling into a postulated second bonanza gold and copper zone sitting between the 600m and 800m vertical depth. Drilling during the period successfully outlined this zone with spectacular results.
Page 8
REVIEW OF OPERATIONS (continued)
OTHER EXPLORATION ASSETS
Warumpi Joint Operation
Warumpi is a significant grass roots exploration play within the prolific basement rocks of the West-Arunta province in the Northern Territory. These rocks, which have recently been identified as being geologically, tectono-thermally and temporally similar to Proterozoic basins in Eastern Australia that host five of the world’s ten largest stratabound Pb-Zn deposits (Broken Hill, Hilton-George Fisher, Mount Isa, MacArthur River and Century). The Company is undertaking the first modern exploration program in this highly underexplored region.
In the previous period on ground reconnaissance discovered an outcropping gossan at the Huron Prospect with rock chip results at surface returning results up to 120g/t Ag, 9.89% Cu and 4.73% Zn (WR0343). Further reconnaissance revealed a cluster of gossanous outcrops with high anomalous base and precious metal results (silver, copper and zinc). Infill sampling surrounding this zone was completed with results returning up to 182g/t Ag (WR0381), 7.72%Cu (WR0373) and 8.55% Zn (WR0351) (announcement ASX:MLX 22 December 2014). The Company has been negotiating access arrangements for further exploration.
In addition the Company acquired all residual interests in the project during the period and now owns the prospects outright.
SIGNIFICANT CHANGES IN THE STATE OF AFFAIRS
Total equity decreased by 18% ($29,179,550) to $104,110,607 (2015: $133,290,157). The movement was largely a result of the increase in accumulated losses.
SIGNIFICANT EVENTS AFTER THE BALANCE DATE
On 4 August 2016 Metals X the Company’s parent entity announced that it will be commencing the process to separate its gold division from the remainder of the diversified base metals assets by a potential demerger.
The demerger will have a potential financial impact on Westgold:
Metals X will provide funding of $110,000,000 to Westgold upon the demerger;
All intercompany loans between Westgold and its parent entity Metals X will be forgiven immediately before the demerger;
Certain assets and contracts will be assigned or transferred from Metals X to Westgold upon the demerger; and
Westgold will exit the Metals X tax consolidated group and intends to from a new tax consolidated group upon the demerger.
There are no other matters or circumstances that have arisen since 30 June 2016 that have or may significantly affect the operations, results, or state of affairs of the Group in future financial years.
LIKELY DEVELOPMENTS AND EXPECTED RESULTS
It is expected that the Consolidated Entity will continue its exploration, mining, processing, production and marketing of gold bullion in Australia, and will continue the development of its gold exploration projects. These are described in more detail in the Review of Operations above.
ENVIRONMENTAL REGULATION AND PERFORMANCE
The Consolidated Entity's operations are subject to the relevant environmental protection legislation (Commonwealth and State legislation). The Consolidated Entity holds various environmental licenses issued under these laws, to regulate its mining and exploration activities in Australia. These licenses include conditions and regulations in relation to specifying limits on discharges into the air, surface water and groundwater, rehabilitation of areas disturbed during the course of mining and exploration activities and the storage of hazardous substances.
All environmental performance obligations are monitored by the board of directors and subjected from time to time to Government agency audits and site inspections. There have been no material breaches of the Consolidated Entity’s licenses and all mining and exploration activities have been undertaken in compliance with the relevant environmental regulations.

Page 9
SHARE OPTIONS
Unissued shares
As at the date of this report, there were no unissued ordinary shares under options.
Option holders do not have any right, by virtue of the option, to participate in any share issue of the Company or any related body corporate.
Shares issued as a result of exercising options
There were no option conversions during the financial year for further details.
INDEMNIFICATION AND INSURANCE OF DIRECTORS AND OFFICERS
During the financial year, the Company’s parent entity Metals X paid a premium in respect of a contract of insurance to insure Directors and officers of the Company and related bodies corporate against those liabilities for which insurance is permitted under section 199B of the Corporations Act 2001. Disclosure of the nature of the liabilities and the amount of the premium is prohibited under the conditions of the contract of insurance.
INDEMNIFICATION OF AUDITORS
To the extent permitted by law, the Company has agreed to indemnify its auditors, Ernst & Young, as part of the terms of its audit engagement agreement against claims by third parties arising from the audit (for an unspecified amount). No payment has been made to indemnify Ernst & Young during or since the financial year.
AUDITOR INDEPENDENCE
The Directors’ received the Independence Declaration, as set out on page 10, from Ernst & Young.
Signed in accordance with a resolution of the Directors.
PG Cook Director Perth, 19 October 2016
Page 10
Auditor’s Independence Declaration

Page 11
Consolidated Statement of Comprehensive Income for the year ended 30 June 2016
Notes 2016 2015
Revenue 5 280,317,331 232,776,237
Cost of sales 7(a) (279,295,243) (185,078,076)
Gross profit 1,022,088 47,698,161
Other income 6 3,314,900 2,188,475
Other expenses 7(b) (5,402,232) (2,319,838)
Impairment loss on intercompany loan - (242,204)
Impairment loss on mine properties and development 15 - (4,717,594)
Exploration and evaluation expenditure written off 16 (27,063,338) (5,974,542)
(Loss)/profit before income tax and finance costs (28,128,582) 36,632,458
Finance costs 7(c) (963,778) (86,048)
(Loss)/profit before income tax (29,092,360) 36,546,410
Income tax benefit/(expense) 8 8,522,713 (22,880,909)
Net (loss)/profit after tax (20,569,647) 13,665,501
Other comprehensive income
Other comprehensive profit for the period, net of tax - -
Total comprehensive (loss)/profit for the period (20,569,647) 13,665,501
Earnings per share for profit attributable to the ordinary equity
holders of the company
- basic (loss)/profit for the year (cents) 9 (4.93) 3.28
- diluted (loss)/profit for the year (cents) 9 (4.93) 3.28
Page 12
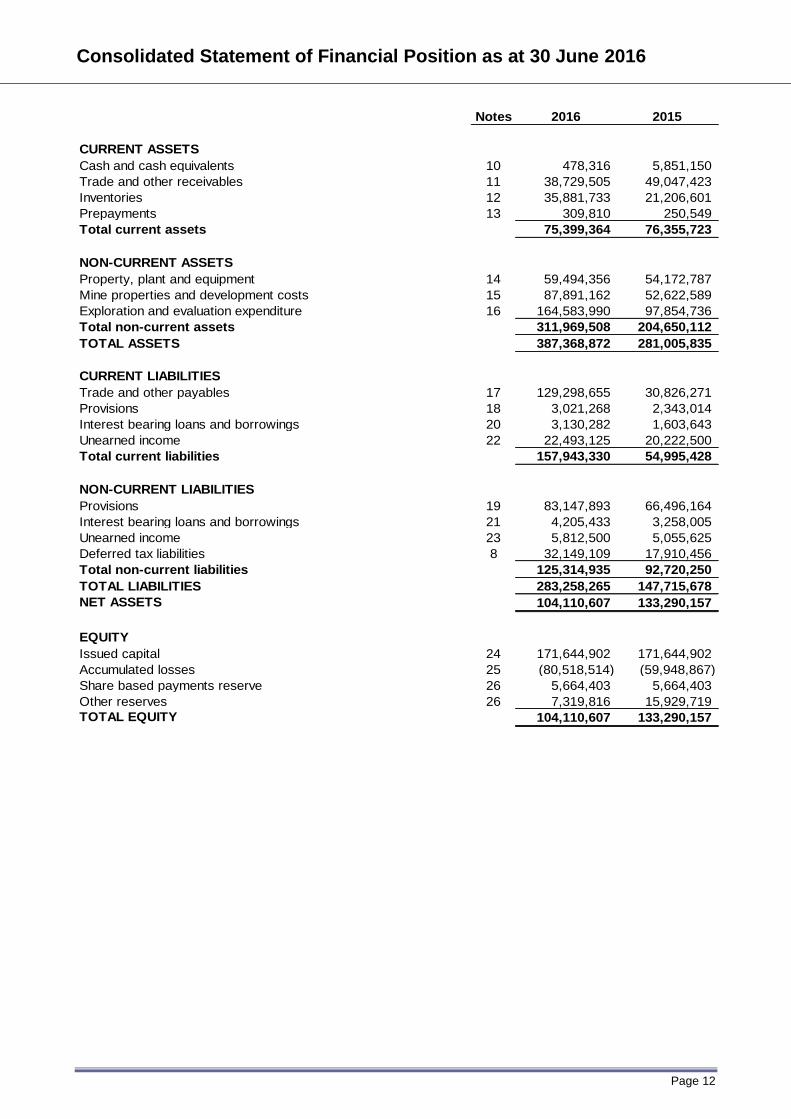
Consolidated Statement of Financial Position as at 30 June 2016
Notes 2016 2015
CURRENT ASSETS
Cash and cash equivalents 10 478,316 5,851,150
Trade and other receivables 11 38,729,505 49,047,423
Inventories 12 35,881,733 21,206,601
Prepayments 13 309,810 250,549
Total current assets 75,399,364 76,355,723
NON-CURRENT ASSETS
Property, plant and equipment 14 59,494,356 54,172,787
Mine properties and development costs 15 87,891,162 52,622,589
Exploration and evaluation expenditure 16 164,583,990 97,854,736
Total non-current assets 311,969,508 204,650,112
TOTAL ASSETS 387,368,872 281,005,835
CURRENT LIABILITIES
Trade and other payables 17 129,298,655 30,826,271
Provisions 18 3,021,268 2,343,014
Interest bearing loans and borrowings 20 3,130,282 1,603,643
Unearned income 22 22,493,125 20,222,500
Total current liabilities 157,943,330 54,995,428
NON-CURRENT LIABILITIES
Provisions 19 83,147,893 66,496,164
Interest bearing loans and borrowings 21 4,205,433 3,258,005
Unearned income 23 5,812,500 5,055,625
Deferred tax liabilities 8 32,149,109 17,910,456
Total non-current liabilities 125,314,935 92,720,250
TOTAL LIABILITIES 283,258,265 147,715,678
NET ASSETS 104,110,607 133,290,157
EQUITY
Issued capital 24 171,644,902 171,644,902
Accumulated losses 25 (80,518,514) (59,948,867)
Share based payments reserve 26 5,664,403 5,664,403
Other reserves 26 7,319,816 15,929,719
TOTAL EQUITY 104,110,607 133,290,157

Page 13
Consolidated Statement of Cash Flows for the Year Ended 30 June 2016
Notes 2016 2015
OPERATING ACTIVITIES
Receipts from customers 260,094,831 217,609,363
Interest received 1,238 92,297
Other income 1,784,248 1,855,750
Payments to suppliers and employees (212,018,299) (149,597,475)
Interest paid (234,252) (8,152)
Net cash flows from operating activities 10 49,627,766 69,951,783
INVESTING ACTIVITIES
Payments for property, plant and equipment (11,990,644) (5,913,613)
Payments for mine properties and development (79,100,887) (33,734,212)
Payments for exploration and evaluation (28,339,756) (21,664,559)
Proceeds from sale of property, plant and equipment 374,308 12,691
Net cash flows used in investing activities (119,056,979) (61,299,694)
FINANCING ACTIVITIES
Payment of finance lease liabilities (2,555,428) (664,990)
Proceeds from /(payment of) intercompany loans 43,361,807 (46,475,638)
Proceeds from gold prepayment 23,250,000 40,445,000
Proceeds from performance bond facility - 3,149,000
Net cash flows from financing activities 64,056,379 (3,546,627)
Net (decrease)/increase in cash and cash equivalents (5,372,834) 5,105,461
Cash and cash equivalents at the beginning of the financial period 5,851,150 745,689
Cash and cash equivalents at the end of the period 10 478,316 5,851,150

Page 14
Consolidated Statement of Changes in Equity for the Year Ended 30 June 2016
Issued capital
Accumulated
losses
Share based
payments
reserve
Other
reserves Total Equity
2015
At 1 July 2014 171,644,902 (73,614,368) 5,664,403 - 103,694,937
Profit for the year - 13,665,501 - - 13,665,501
Other comprehensive income, net of tax - - - - -
Total comprehensive (loss)/profit for the
year net of tax - 13,665,501 - - 13,665,501
Transactions with owners in their capacity
as owners - - - 15,929,719 15,929,719
At 30 June 2015 171,644,902 (59,948,867) 5,664,403 15,929,719 133,290,157
2016
At 1 July 2015 171,644,902 (59,948,867) 5,664,403 15,929,719 133,290,157
Loss for the year - (20,569,647) - - (20,569,647)
Other comprehensive income, net of tax - - - - -
Total comprehensive (loss)/profit for the
year net of tax - (20,569,647) - - (20,569,647)
Transactions with owners in their capacity
as owners - - - (8,609,903) (8,609,903)
At 30 June 2016 171,644,902 (80,518,514) 5,664,403 7,319,816 104,110,607

Page 15
Notes to the Consolidated Financial Statements for the Year Ended 30 June 2016
1. CORPORATE INFORMATION
The financial report of Westgold Resources Pty Ltd for the year ended 30 June 2016 was authorised for issue in accordance with a resolution of the Directors on 19 October 2016.
Westgold Resources Pty Ltd (“the Company”) is a for profit company limited by shares incorporated in Australia.
The nature of the operations and principal activities of the Consolidated Entity are described in the Directors’ Report.
The address of the registered office is Level 3, 18 – 32 Parliament Place, West Perth, WA 6005.
2. SUMMARY OF SIGNIFICANT ACCOUNTING POLICIES
(a) Basis of Preparation
The financial report is a general purpose financial report, which has been prepared in accordance with the requirements of the Corporations Act 2001 and Australian Accounting Standards and other authorative pronouncements of the Australian Accounting Standards Board.
The financial report has been prepared on a historical cost basis.
The financial report is presented in Australian dollars.
(b) Going Concern
As at 30 June 2016, the Consolidated Entity had a net current asset deficit of $82,543,964 (30 June 2015: surplus of $21,360,297), including cash on hand of $478,316 (30 June 2015: $5,851,150).
The directors are satisfied that it is appropriate to prepare the financial statements on a going concern basis as the Company is part of the Metals X closed group and party to a deed of cross guarantee, which the directors of Metals X have confirmed will not be removed unless the proposed demerger proceeds.
In addition, Metals X has committed to provide financial support to Westgold for a period of not less than 12 months from the signing date of these financial statements, in the event that the proposed demerger does not proceed.
Should the proposed demerger proceed, Metals X will provide funding to the value of $110,000,000 to Westgold upon demerger and Westgold will concurrently be removed from the Metals X closed group.
(c) Statement of compliance
The financial report complies with Australian Accounting Standards as issued by the Australian Accounting Standards Board which include International Financial Reporting Standards (IFRS) as issued by the International Accounting Standards Board.
Adoption of new accounting standards
In the current year, the Consolidated Entity has adopted all of the new and revised Standards and Interpretations issued by the Australian Accounting Standards Board (the AASB) that are relevant to its operations and effective for annual reporting periods beginning on 1 July 2015.
The Australian Standards and Interpretations mandatory for reporting periods beginning on or after 1 July 2015, adopted include the following. Adoption of these Standards and Interpretations did not have any effect on the financial position or the performance of the Consolidated Entity.
Reference Title Application date of standard*
Application date for the Consolidated Entity*
AASB 2013-9 Amendments to Australian Accounting Standards – Conceptual Framework, Materiality and Financial Instruments
The Standard contains three main parts and makes amendments to a number of Standards and Interpretations.
Part A of AASB 2013-9 makes consequential amendments arising from the issuance of AASB CF 2013-1.
Part B makes amendments to particular Australian Accounting Standards to delete references to AASB 1031 and also makes minor editorial amendments to various other standards.
1 January 2015 1 July 2015
AASB 2015-3 Amendments to Australian Accounting Standards arising from the Withdrawal of AASB 1031 Materiality The Standard completes the AASB’s project to remove Australian guidance on materiality from Australian Accounting Standards.
1 July 2015 1 July 2015
* Designates the beginning of the applicable annual reporting period unless otherwise stated.
Page 16
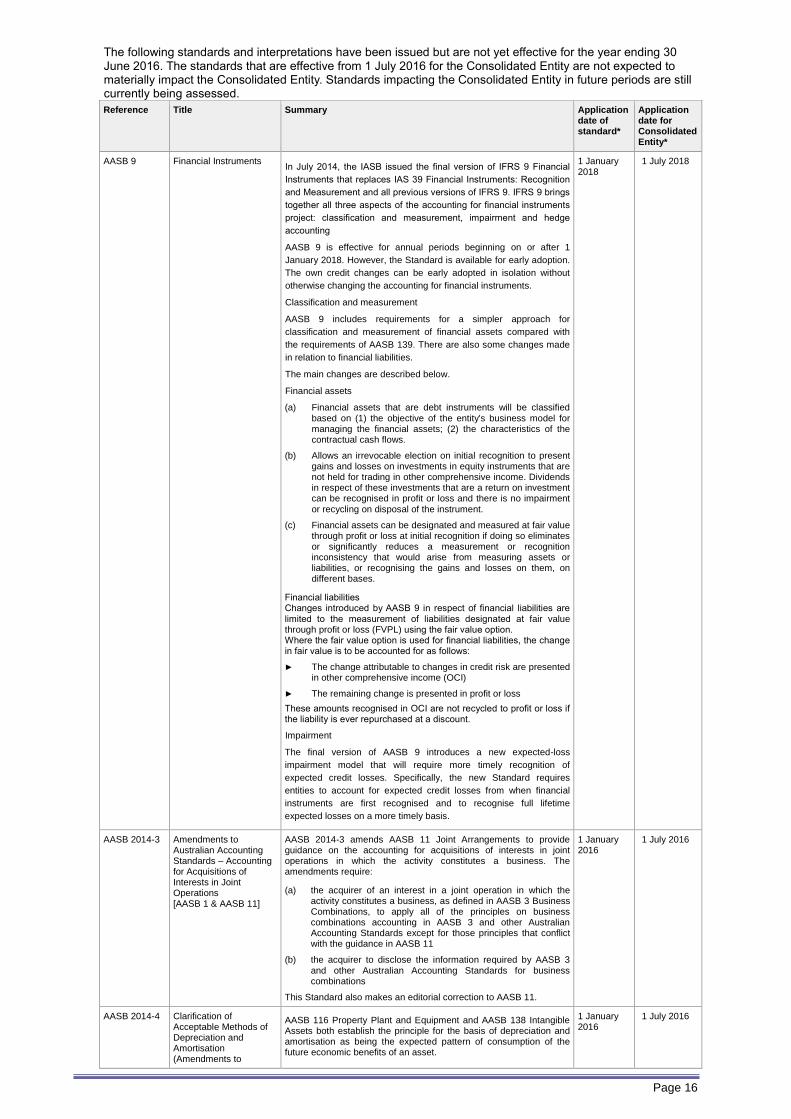
The following standards and interpretations have been issued but are not yet effective for the year ending 30 June 2016. The standards that are effective from 1 July 2016 for the Consolidated Entity are not expected to materially impact the Consolidated Entity. Standards impacting the Consolidated Entity in future periods are still currently being assessed.
Reference Title Summary Application date of standard*
Application date for Consolidated Entity*
AASB 9 Financial Instruments In July 2014, the IASB issued the final version of IFRS 9 Financial
Instruments that replaces IAS 39 Financial Instruments: Recognition
and Measurement and all previous versions of IFRS 9. IFRS 9 brings
together all three aspects of the accounting for financial instruments
project: classification and measurement, impairment and hedge
accounting
AASB 9 is effective for annual periods beginning on or after 1
January 2018. However, the Standard is available for early adoption.
The own credit changes can be early adopted in isolation without
otherwise changing the accounting for financial instruments.
Classification and measurement
AASB 9 includes requirements for a simpler approach for
classification and measurement of financial assets compared with
the requirements of AASB 139. There are also some changes made
in relation to financial liabilities.
The main changes are described below.
Financial assets
(a) Financial assets that are debt instruments will be classified based on (1) the objective of the entity's business model for managing the financial assets; (2) the characteristics of the contractual cash flows.
(b) Allows an irrevocable election on initial recognition to present gains and losses on investments in equity instruments that are not held for trading in other comprehensive income. Dividends in respect of these investments that are a return on investment can be recognised in profit or loss and there is no impairment or recycling on disposal of the instrument.
(c) Financial assets can be designated and measured at fair value through profit or loss at initial recognition if doing so eliminates or significantly reduces a measurement or recognition inconsistency that would arise from measuring assets or liabilities, or recognising the gains and losses on them, on different bases.
Financial liabilities Changes introduced by AASB 9 in respect of financial liabilities are limited to the measurement of liabilities designated at fair value through profit or loss (FVPL) using the fair value option. Where the fair value option is used for financial liabilities, the change in fair value is to be accounted for as follows:
► The change attributable to changes in credit risk are presented in other comprehensive income (OCI)
► The remaining change is presented in profit or loss
These amounts recognised in OCI are not recycled to profit or loss if the liability is ever repurchased at a discount.
Impairment
The final version of AASB 9 introduces a new expected-loss
impairment model that will require more timely recognition of
expected credit losses. Specifically, the new Standard requires
entities to account for expected credit losses from when financial
instruments are first recognised and to recognise full lifetime
expected losses on a more timely basis.
1 January 2018
1 July 2018
AASB 2014-3 Amendments to Australian Accounting Standards – Accounting for Acquisitions of Interests in Joint Operations [AASB 1 & AASB 11]
AASB 2014-3 amends AASB 11 Joint Arrangements to provide guidance on the accounting for acquisitions of interests in joint operations in which the activity constitutes a business. The amendments require:
(a) the acquirer of an interest in a joint operation in which the activity constitutes a business, as defined in AASB 3 Business Combinations, to apply all of the principles on business combinations accounting in AASB 3 and other Australian Accounting Standards except for those principles that conflict with the guidance in AASB 11
(b) the acquirer to disclose the information required by AASB 3 and other Australian Accounting Standards for business combinations
This Standard also makes an editorial correction to AASB 11.
1 January 2016
1 July 2016
AASB 2014-4 Clarification of Acceptable Methods of Depreciation and Amortisation (Amendments to
AASB 116 Property Plant and Equipment and AASB 138 Intangible Assets both establish the principle for the basis of depreciation and amortisation as being the expected pattern of consumption of the future economic benefits of an asset.
1 January 2016
1 July 2016
Page 17
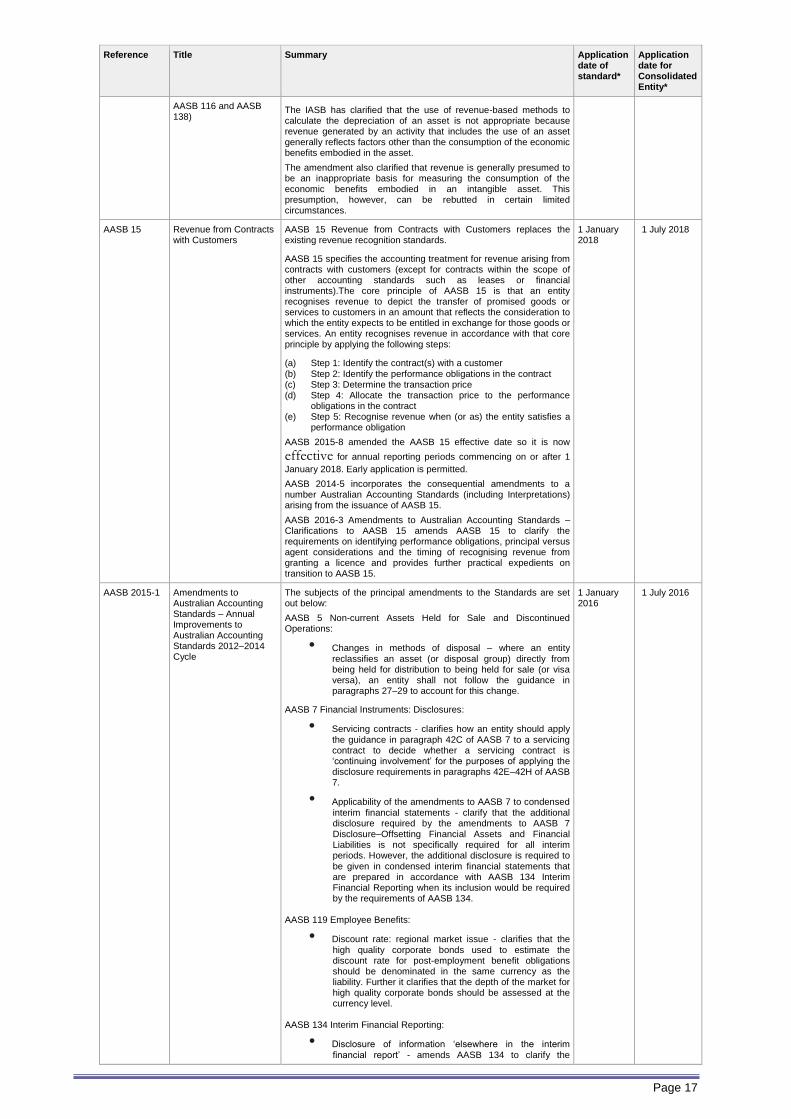
Reference Title Summary Application date of standard*
Application date for Consolidated Entity*
AASB 116 and AASB 138)
The IASB has clarified that the use of revenue-based methods to calculate the depreciation of an asset is not appropriate because revenue generated by an activity that includes the use of an asset generally reflects factors other than the consumption of the economic benefits embodied in the asset.
The amendment also clarified that revenue is generally presumed to be an inappropriate basis for measuring the consumption of the economic benefits embodied in an intangible asset. This presumption, however, can be rebutted in certain limited circumstances.
AASB 15
Revenue from Contracts with Customers
AASB 15 Revenue from Contracts with Customers replaces the existing revenue recognition standards.
AASB 15 specifies the accounting treatment for revenue arising from contracts with customers (except for contracts within the scope of other accounting standards such as leases or financial instruments).The core principle of AASB 15 is that an entity recognises revenue to depict the transfer of promised goods or services to customers in an amount that reflects the consideration to which the entity expects to be entitled in exchange for those goods or services. An entity recognises revenue in accordance with that core principle by applying the following steps:
(a) Step 1: Identify the contract(s) with a customer (b) Step 2: Identify the performance obligations in the contract (c) Step 3: Determine the transaction price (d) Step 4: Allocate the transaction price to the performance
obligations in the contract (e) Step 5: Recognise revenue when (or as) the entity satisfies a
performance obligation
AASB 2015-8 amended the AASB 15 effective date so it is now
effective for annual reporting periods commencing on or after 1
January 2018. Early application is permitted.
AASB 2014-5 incorporates the consequential amendments to a number Australian Accounting Standards (including Interpretations) arising from the issuance of AASB 15.
AASB 2016-3 Amendments to Australian Accounting Standards – Clarifications to AASB 15 amends AASB 15 to clarify the requirements on identifying performance obligations, principal versus agent considerations and the timing of recognising revenue from granting a licence and provides further practical expedients on transition to AASB 15.
1 January 2018
1 July 2018
AASB 2015-1 Amendments to Australian Accounting Standards – Annual Improvements to Australian Accounting Standards 2012–2014 Cycle
The subjects of the principal amendments to the Standards are set out below:
AASB 5 Non-current Assets Held for Sale and Discontinued Operations:
• Changes in methods of disposal – where an entity reclassifies an asset (or disposal group) directly from being held for distribution to being held for sale (or visa versa), an entity shall not follow the guidance in paragraphs 27–29 to account for this change.
AASB 7 Financial Instruments: Disclosures:
• Servicing contracts - clarifies how an entity should apply the guidance in paragraph 42C of AASB 7 to a servicing contract to decide whether a servicing contract is ‘continuing involvement’ for the purposes of applying the disclosure requirements in paragraphs 42E–42H of AASB 7.
• Applicability of the amendments to AASB 7 to condensed interim financial statements - clarify that the additional disclosure required by the amendments to AASB 7 Disclosure–Offsetting Financial Assets and Financial Liabilities is not specifically required for all interim periods. However, the additional disclosure is required to be given in condensed interim financial statements that are prepared in accordance with AASB 134 Interim Financial Reporting when its inclusion would be required by the requirements of AASB 134.
AASB 119 Employee Benefits:
• Discount rate: regional market issue - clarifies that the high quality corporate bonds used to estimate the discount rate for post-employment benefit obligations should be denominated in the same currency as the liability. Further it clarifies that the depth of the market for high quality corporate bonds should be assessed at the currency level.
AASB 134 Interim Financial Reporting:
• Disclosure of information ‘elsewhere in the interim financial report’ - amends AASB 134 to clarify the
1 January 2016
1 July 2016
Page 18
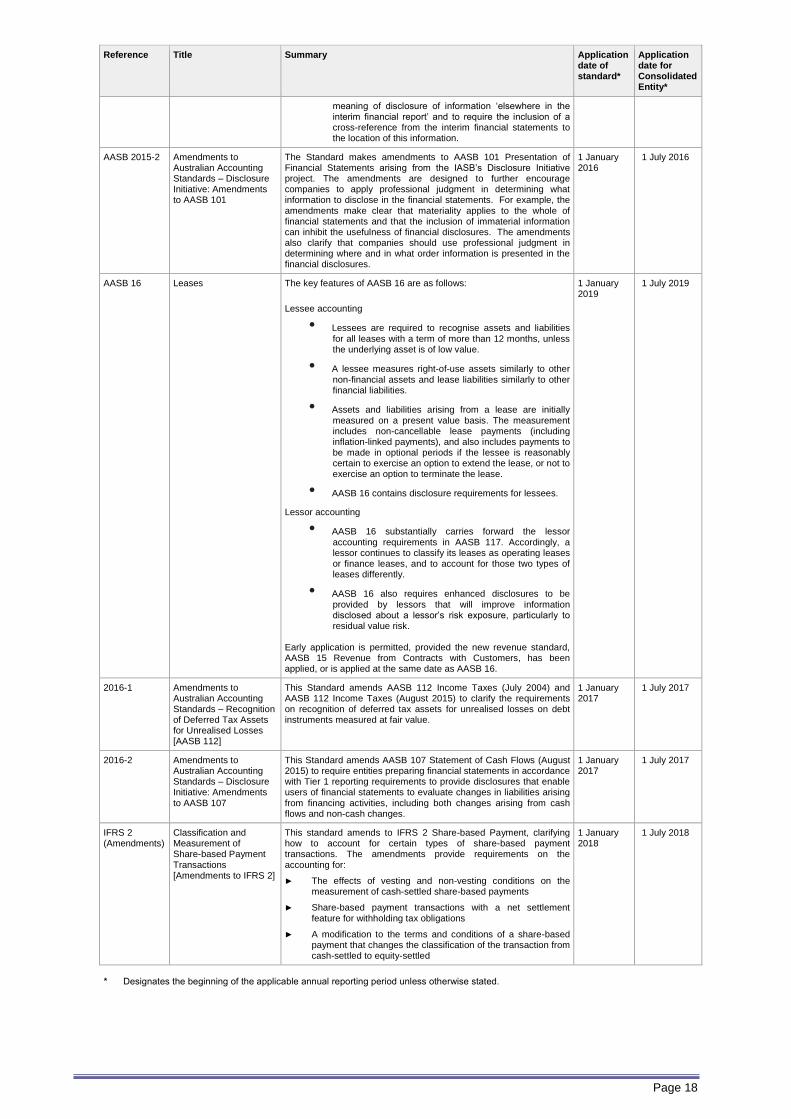
Reference Title Summary Application date of standard*
Application date for Consolidated Entity*
meaning of disclosure of information ‘elsewhere in the interim financial report’ and to require the inclusion of a cross-reference from the interim financial statements to the location of this information.
AASB 2015-2 Amendments to Australian Accounting Standards – Disclosure Initiative: Amendments to AASB 101
The Standard makes amendments to AASB 101 Presentation of Financial Statements arising from the IASB’s Disclosure Initiative project. The amendments are designed to further encourage companies to apply professional judgment in determining what information to disclose in the financial statements. For example, the amendments make clear that materiality applies to the whole of financial statements and that the inclusion of immaterial information can inhibit the usefulness of financial disclosures. The amendments also clarify that companies should use professional judgment in determining where and in what order information is presented in the financial disclosures.
1 January 2016
1 July 2016
AASB 16 Leases The key features of AASB 16 are as follows:
Lessee accounting
• Lessees are required to recognise assets and liabilities for all leases with a term of more than 12 months, unless the underlying asset is of low value.
• A lessee measures right-of-use assets similarly to other non-financial assets and lease liabilities similarly to other financial liabilities.
• Assets and liabilities arising from a lease are initially measured on a present value basis. The measurement includes non-cancellable lease payments (including inflation-linked payments), and also includes payments to be made in optional periods if the lessee is reasonably certain to exercise an option to extend the lease, or not to exercise an option to terminate the lease.
• AASB 16 contains disclosure requirements for lessees.
Lessor accounting
• AASB 16 substantially carries forward the lessor accounting requirements in AASB 117. Accordingly, a lessor continues to classify its leases as operating leases or finance leases, and to account for those two types of leases differently.
• AASB 16 also requires enhanced disclosures to be provided by lessors that will improve information disclosed about a lessor’s risk exposure, particularly to residual value risk.
Early application is permitted, provided the new revenue standard, AASB 15 Revenue from Contracts with Customers, has been applied, or is applied at the same date as AASB 16.
1 January 2019
1 July 2019
2016-1 Amendments to Australian Accounting Standards – Recognition of Deferred Tax Assets for Unrealised Losses [AASB 112]
This Standard amends AASB 112 Income Taxes (July 2004) and AASB 112 Income Taxes (August 2015) to clarify the requirements on recognition of deferred tax assets for unrealised losses on debt instruments measured at fair value.
1 January 2017
1 July 2017
2016-2 Amendments to Australian Accounting Standards – Disclosure Initiative: Amendments to AASB 107
This Standard amends AASB 107 Statement of Cash Flows (August 2015) to require entities preparing financial statements in accordance with Tier 1 reporting requirements to provide disclosures that enable users of financial statements to evaluate changes in liabilities arising from financing activities, including both changes arising from cash flows and non-cash changes.
1 January 2017
1 July 2017
IFRS 2 (Amendments)
Classification and Measurement of Share-based Payment Transactions [Amendments to IFRS 2]
This standard amends to IFRS 2 Share-based Payment, clarifying how to account for certain types of share-based payment transactions. The amendments provide requirements on the accounting for:
► The effects of vesting and non-vesting conditions on the measurement of cash-settled share-based payments
► Share-based payment transactions with a net settlement feature for withholding tax obligations
► A modification to the terms and conditions of a share-based payment that changes the classification of the transaction from cash-settled to equity-settled
1 January 2018
1 July 2018
* Designates the beginning of the applicable annual reporting period unless otherwise stated.
Page 19
2. SUMMARY OF SIGNIFICANT ACCOUNTING POLICIES (Continued)
(d) Changes in accounting policy
The accounting policies used in the preparation of these financial statements are consistent with those used in previous years, except as stated in note 2(c).
(e) Basis of consolidation
The consolidated financial statements comprise the financial statements of the parent entity and its subsidiaries ('the Consolidated Entity') as at 30 June each year. Control is achieved when the Consolidated Entity is exposed, or has rights, to variable returns from its involvement with the investee and has the ability to affect those returns through its power over the investee. Specifically, the Consolidated Entity controls an investee if and only if the Consolidated Entity has:
Power over the investee (i.e. existing rights that give it the current ability to direct the relevant activities of the investee)
Exposure, or rights, to variable returns from its involvement with the investee, and
The ability to use its power over the investee to affect its returns
When the Consolidated Entity has less than a majority of the voting or similar rights of an investee, the Consolidated Entity considers all relevant facts and circumstances in assessing whether it has power over an investee, including:
The contractual arrangement with the other vote holders of the investee
Rights arising from other contractual arrangements
The Consolidated Entity’s voting rights and potential voting rights
The Consolidated Entity re-assesses whether or not it controls an investee if facts and circumstances indicate that there are changes to one or more of the three elements of control. Consolidation of a subsidiary begins when the Consolidated Entity obtains control over the subsidiary and ceases when the Consolidated Entity loses control of the subsidiary. Assets, liabilities, income and expenses of a subsidiary acquired or disposed of during the year are included in the statement of comprehensive income from the date the Consolidated Entity gains control until the date the Consolidated Entity ceases to control the subsidiary.
Profit or loss and each component of other comprehensive income are attributed to the equity holders of the parent of the Consolidated Entity and to the non-controlling interests, even if this results in the non-controlling interests having a deficit balance. When necessary, adjustments are made to the financial statements of subsidiaries to bring their accounting policies into line with the Consolidated Entity’s accounting policies. All intra-Consolidated Entity assets and liabilities, equity, income, expenses and cash flows relating to transactions between members of the Consolidated Entity are eliminated in full on consolidation.
(f) Foreign currency translation
(i) Functional and presentation currency
Both the functional and presentation currency of the Company and its Australian subsidiaries is Australian dollars (A$).
(ii) Transactions and balances
Transactions in foreign currencies are initially recorded in the functional currency by applying the exchange rates ruling at the date of the transaction. Monetary assets and liabilities denominated in foreign currencies are translated at the rate of exchange at the reporting date.
All exchange differences in the consolidated financial report are taken to the profit or loss.
(g) Operating segments
An operating segment is a component of an entity that engages in business activities from which it may earn revenues and incur expenses (including revenues and expenses relating to transactions with other components of the same entity), whose operating results are regularly reviewed by the entity’s chief operating decision maker to make decisions about resources to be allocated to the segment and assess its performance and for which discrete financial information is available.
Operating segments have been identified based on the internal reporting information provided to the chief operating decision makers – being the senior management team for each operation.
Operating segments that meet the quantitative criteria as prescribed by AASB 8 are reported separately. However, an operating segment that does not meet the quantitative criteria is still reported separately where information about the segment would be useful to users of the financial statements.
(h) Cash and cash equivalents
Cash and cash equivalents in the statement of financial position comprise cash at bank and in hand and short -term deposits that are readily convertible to known amounts of cash and which are subject to an insignificant risk of changes in value.
For the purposes of the Statement of cash flows, cash and cash equivalents consist of cash and cash equivalents as defined above, net of outstanding bank overdrafts. Bank overdraft for the current period was nil (2015: nil).
Page 20
2. SUMMARY OF SIGNIFICANT ACCOUNTING POLICIES (Continued)
(i) Trade and other receivables
Trade and other receivables are recognised initially at fair value and subsequently measured at amortised cost using the effective interest rate method, less an allowance for impairment.
Collectability of trade and other receivables is reviewed on an ongoing basis. Individual debts that are known to be uncollectible are written off when identified. An impairment allowance is recognised when there is objective evidence that the Consolidated Entity will not be able to collect the receivable. Financial difficulties of the debtor, default payments or debts more than 60 days overdue are considered objective evidence of impairment. The amount of the impairment loss is the receivable carrying amount compared to the present value of estimated future cash flows, discounted at the original effective interest rate.
(j) Inventories
Inventories are valued at the lower of cost and net realisable value.
Cost includes expenditure incurred in acquiring and bringing the inventories to their existing condition and location and is determined using the weighted average cost method.
(k) Joint arrangements
Joint arrangements are arrangements over which two or more parties have joint control. Joint Control is the contractual agreed sharing of control of the arrangement which exists only when decisions about the relevant activities require unanimous consent of the parties sharing control. Joint arrangements are classified as either a joint operation or a joint venture, based on the rights and obligations arising from the contractual obligations between the parties to the arrangement.
To the extent the joint arrangement provides the Consolidated Entity with rights to the individual assets and obligations arising from the joint arrangement, the arrangement is classified as a joint operation and as such, the Consolidated Entity recognises its:
Assets, including its share of any assets held jointly
Liabilities, including its share of liabilities incurred jointly;
Share of revenue from the sale of the output by the joint operation; and
Expenses, including its share of any expenses incurred jointly
To the extent the joint arrangement provides the Consolidated Entity with rights to the net assets of the arrangement, the investment is classified as a joint venture and accounted for using the equity method. Under the equity method, the cost of the investment is adjusted by the post-acquisition changes in the Consolidated Entity’s share of the net assets of the joint venture.
(l) Borrowing costs
Borrowing costs directly attributable to the acquisition, construction or production of a qualifying asset (i.e. an asset that necessarily takes a substantial period of time to get ready for its intended use or sale) are capitalised as part of the cost of that asset. All other borrowing costs are expensed in the period they occur. Borrowing costs consist of interest and other costs that an entity incurs in connection with the borrowing of funds.
(m) Rehabilitation costs
The Consolidated Entity is required to decommission and rehabilitate mines and processing sites at the end of their producing lives to a condition acceptable to the relevant authorities.
The expected cost of any approved decommissioning or rehabilitation programme, discounted to its net present value, is provided when the related environmental disturbance occurs. The cost is capitalised when it gives rise to future benefits, whether the rehabilitation activity is expected to occur over the life of the operation or at the time of closure. The capitalised cost is amortised over the life of the operation and the increase in the net present value of the provision for the expected cost is included in financing expenses. Expected decommissioning and rehabilitation costs are based on the discounted value of the estimated future cost of detailed plans prepared for each site. Where there is a change in the expected decommissioning and restoration costs, the value of the provision and any related asset are adjusted and the effect is recognised in profit or loss on a prospective basis over the remaining life of the operation.
The estimated costs of rehabilitation are reviewed annually and adjusted as appropriate for changes in legislation, technology or other circumstances. Cost estimates are not reduced by potential proceeds from the sale of assets or from plant clean up at closure.
Page 21
2. SUMMARY OF SIGNIFICANT ACCOUNTING POLICIES (Continued)
(n) Business combinations
Business combinations are accounted for using the acquisition method. The consideration transferred in a business combination shall be measured at fair value, which shall be calculated as the sum of the acquisition-date fair values of the assets transferred by the acquirer, the liabilities incurred by the acquirer to former owners of the acquiree and the equity issued by the acquirer, and the amount of any non-controlling interest in the acquiree. For each business combination, the acquirer measures the non-controlling interest in the acquiree either at fair value or at the appropriate share of the acquiree’s identifiable net assets. Acquisition-related costs are expensed as incurred.
When the Consolidated Entity acquires a business, it assesses the financial assets and liabilities assumed for appropriate classification and designation in accordance with the contractual terms, economic conditions, the Consolidated Entity’s operating or accounting policies and other pertinent conditions as at the acquisition date. This includes the separation of embedded derivatives in the host contracts by the acquiree.
If the business combination is achieved in stages, the acquisition date fair value of the acquirer’s previously held equity interest in the acquiree is remeasured at fair value as at the acquisition date through profit or loss.
Any contingent consideration to be transferred by the acquirer will be recognised at fair value at the acquisition date. Subsequent changes to the fair value of the contingent consideration which is deemed to be an asset or liability will be recognised in accordance with AASB 139 in profit or loss. If the contingent consideration is classified as equity, it shall not be remeasured and subsequent settlement is accounted for within equity. In instances, where the contingent consideration does not fall within the scope of AASB 139, it is measured in accordance with the appropriate AASB.
Goodwill is initially measured at cost, being the excess of the aggregate of the consideration transferred and the amount recognised for non-controlling interest over the fair value of the identifiable net assets acquired and liabilities assumed. If this consideration is lower than the fair value of the identifiable net assets of the subsidiary acquired, the difference is recognised in profit or loss.
After initial recognition, goodwill is measured at cost less any accumulated impairment losses. For the purpose of impairment testing, goodwill acquired in a business combination is, from the acquisition date, allocated to each of the Consolidated Entity’s cash-generating units that are expected to benefit from the combination, irrespective of whether other assets or liabilities of the acquiree are assigned to those units.
Where goodwill forms part of a cash-generating unit and part of the operation within that unit is disposed of, the goodwill associated with the operation disposed of is included in the carrying amount of the operation when determining the gain or loss on disposal of the operation. Goodwill disposed of in this circumstance is measured based on the relative value of the operation disposed of and the portion of the cash-generating unit retained.
(o) Property, plant and equipment
Plant and equipment is stated at historical cost less accumulated depreciation and any impairment in value.
Capital work-in-progress is stated at cost and comprises all costs directly attributable to bringing the assets under construction ready to their intended use. Capital work-in-progress is transferred to property, plant and equipment at cost on completion.
Depreciation is calculated on a straight-line basis over the estimated useful life of the asset, or where appropriate, over the estimated life of the mine.
Major depreciation periods are:
- Mine specific plant and equipment is depreciated using – the shorter of life of mine or useful life. Useful life ranges from 2 to 10 years.
- Buildings – the shorter of life of mine or useful life. Useful life ranges from 5 to 40 years.
- Office equipment is depreciated at 33% per annum for computers and office machines and 20% per annum for other office equipment and furniture.
Derecognition
An item of property, plant and equipment is derecognised upon disposal or when no future economic benefits are expected to arise from the continued use of the asset.
Any gain or loss arising on derecognition of the asset (calculated as the difference between the net disposal proceeds and the carrying amount of the item) is included in the profit and loss in the period the item is derecognised.

Page 22
2. SUMMARY OF SIGNIFICANT ACCOUNTING POLICIES (Continued)
(p) Exploration and evaluation expenditure
Expenditure on acquisition, exploration and evaluation relating to an area of interest is carried forward at cost where rights to tenure of the area of interest are current and;
i) it is expected that expenditure will be recouped through successful development and exploitation of the area of interest or alternatively by its sale and/or;
ii) exploration and evaluation activities are continuing in an area of interest but at reporting date have not yet reached a stage which permits a reasonable assessment of the existence or otherwise of economically recoverable reserves.
A regular review is undertaken of each area of interest to determine the appropriateness of continuing to carry forward costs in relation to that area of interest. Where uncertainty exists as to the future viability of certain areas, the value of the area of interest is written off to the profit and loss or provided against.
Impairment The carrying value of capitalised exploration and evaluation expenditure is assessed for impairment regularly and if after expenditure is capitalised, information becomes available suggesting that the recovery of expenditure is unlikely or that the Consolidated Entity no longer holds tenure, the relevant capitalised amount is written off to the profit or loss in the period when the new information becomes available.
(q) Mine properties and development
Expenditure on the acquisition and development of mine properties within an area of interest are carried forward at cost separately for each area of interest. Accumulated expenditure is amortised over the life of the area of interest to which such costs relate on a production output basis.
A regular review is undertaken of each area of interest to determine the appropriateness of continuing to carry forward costs in relation to that area of interest.
(r) Impairment of non-financial assets
The Consolidated Entity assesses, at each reporting date, whether there is an indication that an asset may be impaired. If any indication exists, or when annual impairment testing for an asset is required, the Consolidated Entity estimates the asset’s recoverable amount. An asset’s recoverable amount is the higher of an asset’s or cash-generating unit’s (CGU) fair value less costs of disposal and its value in use. Recoverable amount is determined for an individual asset, unless the asset does not generate cash inflows that are largely independent of those from other assets or groups of assets. When the carrying amount of an asset or CGU exceeds its recoverable amount, the asset is considered impaired and is written down to its recoverable amount.
In assessing value in use, the estimated future cash flows are discounted to their present value using a pre-tax discount rate that reflects current market assessments of the time value of money and the risks specific to the asset or CGU. In determining fair value less costs of disposal, recent market transactions are taken into account. If no such transactions can be identified, an appropriate valuation model is used. These calculations are corroborated by valuation multiples or other available fair value indicators.
The Consolidated Entity bases its impairment calculation on detailed budgets and forecasts, which are prepared separately for each of the Consolidated Entity’s CGUs to which the individual assets are allocated, based on the life-of-mine plans. The estimated cash flows are based on expected future production, metal selling prices, operating costs and forecast capital expenditure based on life-of-mine plans.
Value in use does not reflect future cash flows associated with improving or enhancing an asset’s performance, whereas anticipated enhancements to assets are included in fair value less costs of disposal calculations.
For assets, an assessment is made at each reporting date to determine whether there is an indication that previously recognised impairment losses no longer exist or have decreased. If such indication exists, the Consolidated Entity estimates the asset’s or CGU’s recoverable amount. A previously recognised impairment loss is reversed only if there has been a change in the assumptions used to determine the asset’s recoverable amount since the last impairment loss was recognised. The reversal is limited so that the carrying amount of the asset does not exceed its recoverable amount, nor exceed the carrying amount that would have been determined, net of depreciation, had no impairment loss been recognised for the asset in prior years. Such reversal is recognised in profit or loss unless the asset is carried at a revalued amount, in which case, the reversal is treated as a revaluation increase.
(s) Trade and other payables
Trade payables and other payables are carried at amortised cost and due to their short-term nature they are not discounted. They represent liabilities for goods and services provided to the Consolidated Entity prior to the end of the financial year that are unpaid and arise when the Consolidated Entity becomes obliged to make future payments in respect of the purchase of these goods and services.
(t) Interest-bearing loans and borrowings
All loans and borrowings are initially recognised at the fair value of the consideration received less directly attributable transaction costs.
After initial recognition, interest-bearing loans and borrowings are subsequently measured at amortised cost using the effective interest rate method.
Borrowings are classified as current liabilities unless the Consolidated Entity has the unconditional right to defer settlement of the liability for at least 12 months after the reporting date.
Page 23
2. SUMMARY OF SIGNIFICANT ACCOUNTING POLICIES (Continued)
(u) Provisions
Provisions are recognised when the Consolidated Entity has a present obligation (legal or constructive) as a result of a past event, it is probable that an outflow of resources embodying economic benefits will be required to settle the obligation and a reliable estimate can be made of the amount of the obligation.
Provisions are measured at the present value of management’s best estimate of the expenditure required to settle the present obligation at the reporting date. The discount rate used to determine the present value reflects current market assessments of the time value of money and the risks specific to the liability. The increase in the provision resulting from the passage of time is recognised in finance costs.
(v) Leases
Leases are classified at their inception as either operating or finance leases based on the economic substance of the agreement so as to reflect the risks and benefits incidental to ownership.
(i) Operating Leases
The minimum lease payments of operating leases, where the lessor effectively retains substantially all of the risks and benefits of ownership of the leased item, are recognised as an expense in profit and loss on a straight-line basis over the lease term.
Contingent rentals are recognised as an expense in the financial year in which they are incurred.
(ii) Finance Leases
Leases which effectively transfer substantially all the risks and benefits incidental to ownership of the leased item to the Consolidated Entity are capitalised at the inception of the lease at the fair value of the leased property or, if lower, at the present value of the minimum lease payments.
Lease payments are apportioned between the finance charges and reduction of the lease liability so as to achieve a constant rate of interest on the remaining balance of the liability. Finance charges are charged directly to profit and loss.
Capitalised leased assets are depreciated over the estimated useful life of the asset or where appropriate, over the estimated life of the mine.
The cost of improvements to or on leasehold property is capitalised, disclosed as leasehold improvements, and amortised over the unexpired period of the lease or the estimated useful lives of the improvements, whichever is the shorter.
(w) Issued capital
Issued and paid up capital is recognised at the fair value of the consideration received by the Consolidated Entity. Any transaction costs arising on the issue of ordinary shares are recognised directly in equity as a reduction in the proceeds received.
(x) Revenue
Revenue is measured at the fair value of the consideration received or receivable to the extent it is probable that the economic benefits will flow to the Consolidated Entity and the revenue can be reliably measured. The following specific recognition criteria must also be met before revenue is recognised:
Revenue from the sale of goods Revenue from the sale of goods is recognised when the significant risks and rewards of ownership have passed to the buyer.
Interest income
Revenue is recognised as interest accrues using the effective interest method.
(y) Earnings per share
Basic earnings per share is calculated as net profit attributable to members of the parent, adjusted to exclude any costs of servicing equity (other than dividends) and preference share dividends, divided by the weighted average number of ordinary shares, adjusted for any bonus element, capitalisation, share split or reverse share split.
Diluted earnings per share is calculated as net profit attributable to members of the parent adjusted for:
cost of servicing equity (other than dividends) and preference share dividends;
the after tax effect of dividends and interest associated with dilutive potential ordinary shares that have been recognised; and
other non-discriminatory changes in revenues or expenses during the period that would result from the dilution of potential ordinary shares;
divided by the weighted average number of ordinary shares and dilutive potential ordinary shares, adjusted for any bonus element, capitalisation, share split or reverse share split. If these changes occur after the reporting period but before the financial statements are authorised for issue, the financial statements are adjusted retrospectively.
Page 24
2. SUMMARY OF SIGNIFICANT ACCOUNTING POLICIES (Continued)
(z) Employee benefits
(i) Wages, salaries, annual leave and sick leave
Liabilities for wages and salaries, including non-monetary benefits, annual leave and accumulating sick leave expected to be settled wholly within 12 months of the reporting date are recognised in respect of employees' services up to the reporting date. They are measured at the amounts expected to be paid when the liabilities are settled.
(ii) Long service leave
The liability for long service leave is recognised and measured as the present value of expected future payments to be made in respect of services provided by employees up to the reporting date using the projected unit credit method. Consideration is given to expected future wage and salary levels, experience of employee departures, and periods of service. Expected future payments are discounted using market yields at the reporting date on corporate bonds with terms to maturity and currencies that match, as closely as possible, the estimated future cash outflows.
(iii) Superannuation
Contributions made by the Consolidated Entity to employee superannuation funds, which are defined contribution plans, are charged as an expense when incurred.
(aa) Onerous operating lease provision
A provision for an onerous operating lease is recognised when the expected benefits to be derived from the lease are lower than the unavoidable cost of meeting the obligations under the lease. The provision is measured at the present value of the expected net cost of continuing with the lease.
(ab) Other taxes
Revenues, expenses and assets are recognised net of the amount of GST except:
when the GST incurred on a purchase of goods and services is not recoverable from the taxation authority, in which case the GST is recognised as part of the cost of acquisition of the asset or as part of the expense item as applicable; and
receivables and payables, which are stated with the amount of GST included.
The net amount of GST recoverable from, or payable to, the taxation authority is included as part of receivables or payables in the statement of financial position.
Cash flows are included in the statement of cash flows on a gross basis and the GST component of cash flows arising from investing and financing activities, which is recoverable from, or payable to, the taxation authority are classified as operating cash flows.
Commitments and contingencies are disclosed net of amounts of GST recoverable from, or payable to, the taxation authority.
(ac) Income tax
Tax consolidated group
With effect from 1 July 2004, Westgold became a member of the Metals X tax consolidated group. Metals X is the head entity of the tax consolidated group.
Members of the Metals X group have entered into a tax sharing agreement that determines the allocation of income tax liabilities between the entities should the head entity default on its tax payment obligations. In accordance with the tax sharing agreement, Metals X must determine the contribution amount for each Member of the tax consolidated group on a stand-alone entity basis. However, at balance date, the possibility of default by the head entity is considered remote.
The tax consolidated group entered into a tax funding agreement that determines the amount payable by each Member for their portion of the group’s current tax and deferred tax liability. The tax funding agreement determines that each Member’s funding amount is calculated as if the Member is a stand-alone entity and not an entity of the tax consolidated group. Payment to the head entity is to be settled in cash or set-off against the Member’s loan account. Taxation liabilities that are set-off against the Member’s loan account are derecognised immediately after initial recognition.
Tax effect accounting by members of the tax consolidated group
The Consolidated Entity has applied the group allocation approach in determining the appropriate amount of current tax and deferred tax expenses (or benefits) to be allocated to members of the tax consolidated group. Under this approach temporary differences are measured with reference to the carrying amounts of the assets and liabilities in Westgold’s financial statements and the tax bases of the assets and liabilities as determined by the tax consolidated group.
Any difference between the taxation liability assumed by the Member in accordance with the tax funding agreement and the amount allocated to the Member in accordance with the group allocation approach is recognised as an equity contribution to (or distribution from) the Member.
Page 25
3. SIGNIFICANT ACCOUNTING JUDGEMENTS, ESTIMATES AND ASSUMPTIONS
The preparation of the financial statements requires management to make judgements, estimates and assumptions that affect the reported amounts in the financial statements. Management continually evaluates its judgements and estimates in relation to assets, liabilities, contingent liabilities, revenue and expenses. Management bases its judgements and estimates on historical experience and on other various factors it believes to be reasonable under the circumstances, the result of which form the basis of the carrying values of assets and liabilities that are not readily apparent from other sources.
Management has identified the following critical accounting policies for which significant judgements have been made as well as the following key estimates and assumptions that have the most significant impact on the financial statements. Actual results may differ from these estimates under different assumptions and conditions and may materially affect financial results or the financial position reported in future periods.
Further details of the nature of these assumptions and conditions may be found in the relevant notes to the financial statements.
Significant accounting estimates and assumptions
Determination of mineral resources and ore reserves
The determination of reserves impacts the accounting for asset carrying values, depreciation and amortisation rates and provisions for mine rehabilitation. The Consolidated Entity estimates its mineral resource and reserves in accordance with the Australian code for Reporting of Exploration Results, Mineral Resources and Ore Reserves 2012 (the “JORC code”). The information on mineral resources and ore reserves were prepared by or under the supervision of Competent Persons as defined in the JORC code. The amounts presented are based on the mineral resources and ore reserves determined under the JORC code.
There are numerous uncertainties inherent in estimating mineral resources and ore reserves and assumptions that are valid at the time of estimation may change significantly when new information becomes available (refer to note 15).
Changes in the forecast prices of commodities, exchange rates, production costs or recovery rates may change the economic status of reserves and may, ultimately, result in the reserves being restated.
Mine rehabilitation provision
The Consolidated Entity assesses its mine rehabilitation provision on an annual basis in accordance with the accounting policy stated in note 2(m). In determining an appropriate level of provision, consideration is given to the expected future costs to be incurred, the timing of those future costs (largely dependent on the life of mine) and the estimated level of inflation. The ultimate rehabilitation costs are uncertain, and cost estimates can vary in response to many factors, including estimates of the extent and costs of rehabilitation activities, technological changes, regulatory changes, cost increases as compared to the inflation rates, and changes in discount rates. The expected timing of expenditure can also change, for example in response to changes in reserves or to production rates. These uncertainties may result in future actual expenditure differing from the amounts currently provided. Therefore, significant estimates and assumptions are made in determining the provision for mine rehabilitation. As a result, there could be significant adjustments to the provisions established which would affect future financial result. The provision at reporting date represents management’s best estimate of the present value of the future rehabilitation costs required.
Impairment of capitalised exploration and evaluation expenditure
The future recoverability of capitalised exploration and evaluation expenditure is dependent on a number of factors, including whether the Consolidated Entity decides to exploit the related area interest itself or, if not, whether it successfully recovers the related exploration and evaluation asset through sale.
Factors that could impact the future recoverability include the level of reserves and resources, future technological changes, which could impact the cost of mining, future legal changes (including changes to environmental restoration obligations) and changes to commodity prices.
To the extent that capitalised exploration and evaluation expenditure is determined not to be recoverable in the future, profits and net assets will be reduced in the period in which this determination is made.
In addition, exploration and evaluation expenditure is capitalised if activities in the area of interest have not yet reached a stage that permits a reasonable assessment of the existence or otherwise of economically recoverable reserves. To the extent it is determined in the future that this capitalised expenditure should be written off, profits and net assets will be reduced in the period in which this determination is made.
Page 26
3. SIGNIFICANT ACCOUNTING JUDGEMENTS, ESTIMATES AND ASSUMPTIONS (Continued)
Significant accounting estimates and assumptions (Continued)
Impairment of capitalised mine development expenditure
The future recoverability of capitalised mine development expenditure is dependent on a number of factors, including the level of proved, probable and inferred mineral resources, future technological changes, which could impact the cost, future legal changes (including changes to environmental restoration obligations) and changes to commodity prices.
The Consolidated Entity regularly reviews the carrying values of its mine development assets in the context of internal and external consensus forecasts for commodity prices and foreign exchange rates, with the application of appropriate discount rates for the assets concerned.
To the extent that capitalised mine development expenditure is determined not to be recoverable in the future, this will reduce profit in the period in which this determination is made. Capitalised mine development expenditure is assessed for recoverability in a manner consistent with property, plant and equipment as described below. Refer to note 2(r) for further discussion on the impairment assessment process undertaken by the Consolidated Entity.
Impairment of property, plant and equipment
Property, plant and equipment is reviewed for impairment if there is any indication that the carrying amount may not be recoverable. Where a review for impairment is conducted, the recoverable amount is assessed by reference to the higher of “value in use” (being net present value of expected future cash flows of the relevant cash generating unit) and “fair value less costs to sell”.
In determining the value in use, future cash flows for each cash generating unit (CGU) (ie each mine site) are prepared utilising managements latest estimates of;
the quantities of ore reserves and mineral resources for which there is a high degree of confidence of economic extraction;
royalties and taxation;
future production levels;
future commodity prices;
future cash costs of production and capital expenditure; and
other relevant cash inflows and outflows.
Cash flow scenarios for a range of commodity prices and foreign exchange rates are assessed using internal and external market forecasts, and the present value of the forecast cash flows is determined utilising a pre-tax discount rate.
The Consolidated Entity’s cash flows are most sensitive to movements in commodity price, expected quantities of ore reserves and mineral resources and key operating costs. The Higginsville and Central Murchison Gold Operations are most sensitive to expected quantities of ore reserves and mineral resources to be extracted and therefore the estimated future cash inflows resulting from the sale of product produced is dependent on these assumptions.
Variations to the expected cash flows, and the timing thereof, could result in significant changes to any impairment losses recognised, if any, which in turn could impact future financial results. Refer to Note 2(r) for further discussion on the impairment assessment process undertaken by the Consolidated Entity.
Life of mine method of amortisation and depreciation
The Consolidated Entity applies the life of mine method of amortisation and depreciation to its mine specific plant and to mine properties and development based on ore tonnes mined. These calculations require the use of estimates and assumptions. Significant judgement is required in assessing the available reserves and the production capacity of the plants to be depreciated under this method. Factors that are considered in determining reserves and production capacity are the Consolidated Entity’s history of converting resources to reserves and the relevant time frames, the complexity of metallurgy, markets and future developments. When these factors change or become known in the future, such differences will impact pre tax profit and carrying values of assets. Refer to note 15 for discussion on change in estimate in current year.
Page 27
4. FINANCIAL RISK MANAGEMENT OBJECTIVES AND POLICIES
The Consolidated Entity’s principal financial instruments comprise receivables, payables, unsecured loans, finance lease and hire purchase contracts, cash and short-term deposits, and intercompany loans.
Risk exposures and responses
The Consolidated Entity manages its exposure to key financial risks in accordance with the Consolidated Entity’s financial risk management policy. The objective of the policy is to support the delivery of the Consolidated Entity’s financial targets while protecting future financial security.
The main risks arising from the Consolidated Entity’s financial instruments are interest rate risk, commodity risk, credit risk and liquidity risk. The Consolidated Entity uses different methods to measure and manage different types of risks to which it is exposed. These include monitoring levels of exposure to interest rate and assessments of market forecasts for interest rate and commodity prices. Ageing analysis of and monitoring of receivables are undertaken to manage credit risk, liquidity risk is monitored through the development of future rolling cash flow forecasts.
The board reviews and agrees policies for managing each of these risks as summarised below.
Primary responsibility for identification and control of financial risks rests with the Board. The Board reviews and agrees policies for managing each of the risks identified below, including for interest rate risk, credit allowances and cash flow forecast projections.
Details of the significant accounting policies and methods adopted, including the criteria for recognition, the basis of measurement and the basis on which income and expenses are recognised, in respect of each class of
financial asset, financial liability and equity instrument are disclosed in note 2 to the financial statements.
(a) Interest rate risk
The Consolidated Entity’s exposure to risks of changes in market interest rates relate primarily to the Consolidated Entity’s interest bearing liabilities and cash balances. The level of debt is disclosed in notes 20 and 21. The Consolidated Entity’s policy is to manage its interest cost using fixed rate debt. Therefore, the Consolidated Entity does not have any variable interest rate risk on its debt. The Consolidated Entity constantly analyses its interest rate exposure. Within this analysis consideration is given to potential renewals of existing positions, alternative financing positions and the mix of fixed and variable interest rates. The following sensitivity analysis is based on the interest rate risk exposures in existence at the reporting date. The sensitivity analysis is for variable rate instruments.
At 30 June 2016, if interest rates had moved by a reasonably possible 0.5%, as illustrated in the table below, with all other variables held constant, post tax profits and equity would have been affected as follows:
2016 2015 2016 2015
Judgements of reasonably possible
movements:
+ 0.5% (50 basis points) 1,653 20,458 - -
- 0.5% (50 basis points) (1,653) (20,458) - -
higher/(lower)
Post tax profit Other Comprehensive Income
higher/(lower)
A sensitivity of +%0.5 or -0.5% has been selected as this is considered reasonable given the current level of short-term and long-term Australian dollar interest rates. The movements in profit are due to possible higher or lower interest income from variable rate cash balances. The sensitivity is lower in 2016 than 2015 due to a decrease in the balance of cash and cash equivalents in 2016.
At the reporting date the Consolidated Entity’s exposure to interest rate risk for classes of financial assets and financial liabilities is set out below.
2016 2015
Floating interest rate
Financial Assets 472,316 5,845,150
Financial Liabilities - -
Net financial assets/(liabilities) 472,316 5,845,150

Page 28
4. FINANCIAL RISK MANAGEMENT OBJECTIVES AND POLICIES (Continued)
(b) Credit risk
Credit risk arises from the financial assets of the Consolidated Entity, which comprises cash and cash equivalents, trade and other receivables. Cash and cash equivalents are held with National Australia Bank which is an Australian Bank with an AA credit rating (Standard & Poor’s). The Consolidated Entity’s exposure to credit risk arises from potential default of the counter party, with the maximum exposure equal to the carrying amount of the financial assets (as outlined in each applicable note).
The Consolidated Entity does not hold any credit derivatives to offset its credit exposure.
The Consolidated Entity trades only with recognised, creditworthy third parties and as such collateral is not requested nor is it the Consolidated Entity’s policy to securitise its trade and other loans and receivables.
Receivable balances are monitored on an ongoing basis with the result that the Consolidated Entity does not have a significant exposure to bad debts.
Significant concentrations of credit risk are in relation to cash and cash equivalents with Australian banks.
(c) Commodity price risk
The Consolidated Entity’s revenues are exposed to commodity price fluctuations. Periodically the Consolidated Entity enters into sales contracts to manage commodity price risk. At the end of the financial period the Consolidated Entity had sales contracts for 187,750 ounces at an average price of $1,652.13 per ounce ending in September 2018, which the Consolidated Entity will deliver physical gold to settle.
(d) Liquidity risk
Liquidity risk arises from the financial liabilities of the Consolidated Entity and the subsequent ability to meet the obligations to repay the financial liabilities as and when they fall due.
The Consolidated Entity’s objective is to maintain a balance between continuity of funding and flexibility through the use of finance and hire purchase leases.
The table below reflects all contractually fixed payables for settlement, repayment and interest resulting from recognised financial liabilities as of 30 June 2016. Cash flows for financial and liabilities without fixed amount or timing are based on the conditions existing as 30 June.
The remaining contractual maturities of the Consolidated Entity’s financial liabilities are:
2016 2015
6 months or less 130,910,064 31,652,035
6 - 12 months 1,647,513 842,346
1 - 5 years 4,378,259 3,388,977
Over 5 years - -
136,935,836 35,883,358
(e) Fair values
For all financial assets and liabilities recognised in the statement of financial position, carrying amount approximates fair value unless otherwise stated in the applicable notes.
The methods for estimating fair value are outlined in the relevant notes to the financial statements.

Page 29
5. REVENUE 2016 2015
Revenue from sale of gold 280,317,331 232,776,237
Total revenue 280,317,331 232,776,237
6. OTHER INCOME
Net profit from toll processing 1,848,433 1,533,234
Interest received - other corporations 1,238 92,297
Other income 1,465,229 562,944
Total other income 3,314,900 2,188,475
7. EXPENSES
(a) Cost of sales
Salaries, wages expense and other employee benefits 29,204,614 15,844,460
Superannuation expense 2,774,438 1,505,224
Other production costs 173,077,577 117,363,674
Write down in value of inventories to estimated net realisable value 1,007,829 139,416
Royalty expense 17,548,052 12,990,754
Depreciation and amortisation expense
Depreciation of non-current assets
Property, plant and equipment 7,856,411 8,529,573
Buildings 622,328 547,664
Amortisation of non-current assets
Mine, properties and development costs 47,203,994 28,157,311
Total cost of sales 279,295,243 185,078,076
(b) Other expenses
Administration expenses
Administration costs 184,613 357,413
184,613 357,413
Depreciation expense
Depreciation of non-current assets
Property plant and equipment 65,845 244,241
Total Administration expenses 250,458 601,654
Other expenses
Care and maintenance costs 440,346 1,490,446
Loss on remeasurement of royalty obligations 3,556,322 -
Net loss on sale of assets 240,588 227,738
Other 914,518 -
Other expenses 5,151,774 1,718,184
Total other expenses 5,402,232 2,319,838
(c) Finance costs
Interest 238,284 62,145
Unwinding of rehabilitation provision discount 725,494 23,903
Total finance costs 963,778 86,048
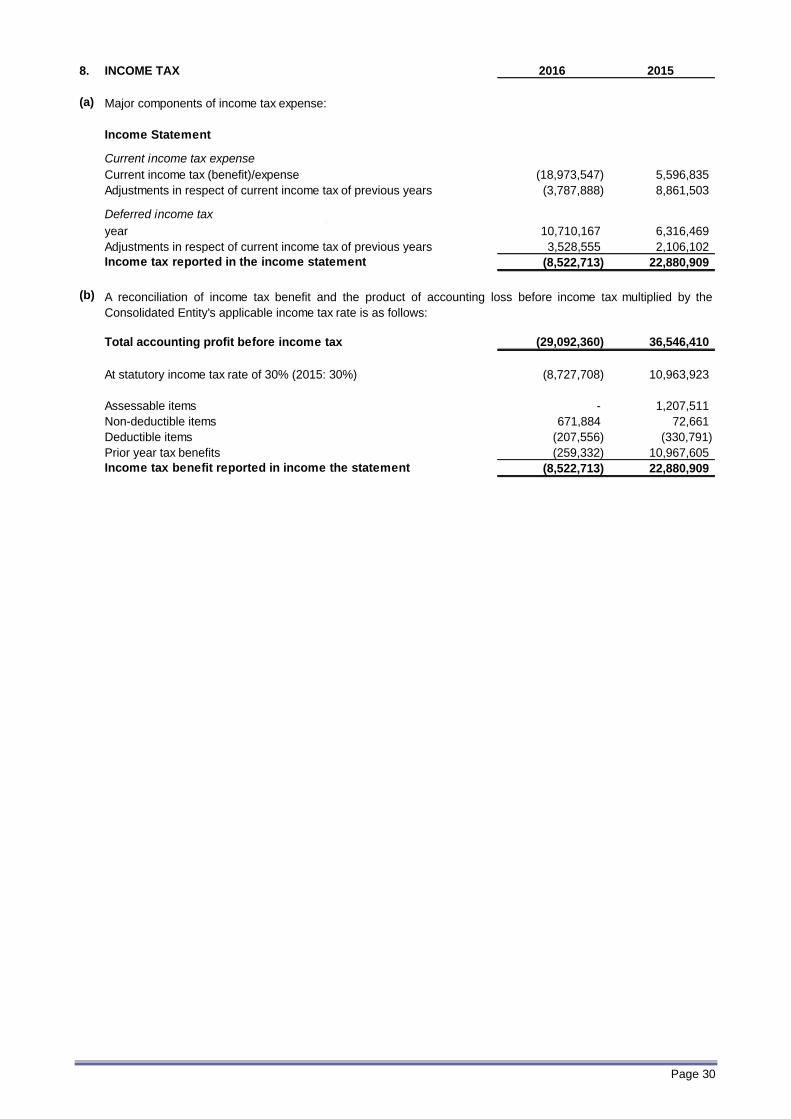
Page 30
8. INCOME TAX 2016 2015
(a)
Income Statement
Current income tax expense
Current income tax (benefit)/expense (18,973,547) 5,596,835
Adjustments in respect of current income tax of previous years (3,787,888) 8,861,503
Deferred income taxRelating to origination and reversal of temporary differences in current
year 10,710,167 6,316,469
Adjustments in respect of current income tax of previous years 3,528,555 2,106,102
Income tax reported in the income statement (8,522,713) 22,880,909
(b)
Total accounting profit before income tax (29,092,360) 36,546,410
At statutory income tax rate of 30% (2015: 30%) (8,727,708) 10,963,923
Assessable items - 1,207,511
Non-deductible items 671,884 72,661
Deductible items (207,556) (330,791)
Prior year tax benefits (259,332) 10,967,605
Income tax benefit reported in income the statement (8,522,713) 22,880,909
Major components of income tax expense:
A reconciliation of income tax benefit and the product of accounting loss before income tax multiplied by the
Consolidated Entity's applicable income tax rate is as follows:

Page 31
8. INCOME TAX (Continued)
(c) Deferred income tax at 30 June relates to the following:
2016 2015 2016 2015
Deferred tax liabilities
Exploration (14,030,042) (8,797,706) 5,232,406 1,394,580
Deferred mining (21,100,042) (14,155,312) 6,944,730 9,154,860
Mine site establishment and refurbishment (4,523,408) (805,703) 3,717,705 673,352
Inventories (1,865,207) (1,704,662) 160,546 445,705
Diesel rebate (250,444) (192,551) 57,893 78,534
Gross deferred tax liabilities (41,769,144) (25,655,934)
Deferred tax assets
Property, plant and equipment 259,698 3,377,551 3,117,853 (3,348,867)
Provision for employee entitlements 1,134,699 932,821 (201,878) 14,056
Provision for fringe benefits tax 1,218 (8,351) (9,569) 13,195
Provision for rehabilitation 8,224,420 3,443,457 (4,780,962) (2,847)
Gross deferred tax assets 9,620,035 7,745,478
Net deferred tax liabilities (32,149,109) (17,910,456)
Deferred tax income/(expense) 14,238,722 8,422,568
Statement of comprehensive incomeStatement of financial position
(d) During the year, the Consolidated Entity transferred carry forward tax losses of $8,609,902 to its parent entity. In accordance with the tax funding arrangement between Metals X and the Consolidated Entity, Metals X paid no consideration for the tax losses transferred and accordingly the Consolidated Entity has accounted for the derecognition of the carry forward tax losses as a distribution to Metals X. During 2015, the Consolidated Entity recognised $15,929,720 carry forward tax losses that were previously transferred to Metals X by the Consolidated Entity. In accordance with the tax funding arrangement between Metals X and the Consolidated Entity, the Consolidated Entity was paid for these tax losses via the intercompany loan accounts. However, in 2015, as the losses had already been transferred to Metals X in previous years this consideration is deemed to be a contribution from Metals X.

Page 32
9. EARNINGS PER SHARE
The following reflects the data used in the basic and diluted earnings per share computations.
2016 2015
(a) Earnings used in calculating earnings per share
For basic earnings per share:
Net (loss)/profit attributable to ordinary equity holders of the parent (20,569,647) 13,665,501
Net (loss)/profit attributable to ordinary equity holders of the parent (20,569,647) 13,665,501
Basic (loss)/earnings per share (cents) (4.93) 3.28
For diluted earnings per share:
Net (loss)/profit attributable to ordinary equity holders of the parent (from
basic EPS) (20,569,647) 13,665,501
Net (loss)/profit attributable to ordinary equity holders of the parent (20,569,647) 13,665,501
Fully (loss)/diluted earnings per share (cents) (4.93) 3.28
(b) Weighted average number of shares
Weighted average number of ordinary shares for basic earnings per
share 417,178,651 417,178,651
Effect of Dilution:
Share Options - -
Weighted average number of ordinary shares adjusted for the
effect of dilution 417,178,651 417,178,651
At 30 June 2016 the Company did not have any share options on issue that are excluded from the calculation of diluted earnings per share for the current financial period (2015: Nil).
There have been no transactions involving ordinary shares or potential ordinary shares since that would significantly change the number of ordinary shares or potential ordinary shares outstanding between the reporting date and before the completion of these financial statements.

Page 33
10. CASH AND CASH EQUIVALENTS 2016 2015
Cash at bank and in hand 472,316 5,845,150
Short-term deposits 6,000 6,000
Total 478,316 5,851,150
CASH FLOW RECONCILIATION
Cash at bank and in hand 472,316 5,845,150
Short-term deposits 6,000 6,000
478,316 5,851,150
CASH FLOW RECONCILIATION
Profit after income tax (20,569,647) 13,665,501
Amortisation and depreciation 55,748,578 37,478,790
Gold prepayment physical deliveries (20,222,500) (15,166,871)
Impairment losses - 4,959,797
Income tax (benefit)/expense (8,522,713) 22,880,909
Unwinding of rehabilitation provision discount 725,494 23,903
Exploration and evaluation expenditure written off 27,063,338 5,974,542
Loss on disposal of property, plant and equipment 240,588 227,738
34,463,138 70,044,309
Changes in assets and liabilities
Decrease/(increase) in inventories (14,675,130) (5,114,301)
Decrease/(increase) in trade and other receivables and prepayments (2,613,249) (1,366,502)
(Decrease)/increase in trade and other creditors 31,783,946 7,498,197
(Decrease)/increase in provisions 669,061 (1,109,920)
Net cash flows from operating activities 49,627,766 69,951,783
11. TRADE AND OTHER RECEIVABLES (current)
Other debtors (a) 6,315,677 3,761,689
Intercompany loans (b) 32,413,828 45,285,734
38,729,505 49,047,423
(a) Trade receivables are non-interest bearing and are generally on 30 - 90 day terms.
(b)
12. INVENTORIES (current)
Ore stocks at net realisable value 11,553,074 5,182,341
Gold in circuit at cost 13,504,552 7,883,128
Gold metal at cost 3,827,322 2,328,351
Stores and spares at cost 9,067,639 7,254,042
Provision for obsolete stores and spares (2,070,854) (1,441,261)
Total inventories at lower of cost and net realisable value 35,881,733 21,206,601
13. PREPAYMENTS (current)
Prepayments 309,810 250,549
For the purposes of the statement of cash flows, cash and cash equivalents comprise the following at 30
June:
Reconciliation of net profit after income tax to net cash flows from operating activities
The carrying amounts disclosed above approximate the fair value.
During the year there were write-downs of $1,007,829 (2015: $139,416 write-downs) for the Consolidated Entity.
This is included in cost of sales refer to note 7(a).
Intercompany loans are non-interest bearing and repayable on demand.

Page 34
14. PROPERTY, PLANT & EQUIPMENT (non-current) 2016 2015
Plant and equipment
At cost 103,189,369 95,803,905
Accumulated depreciation (59,986,563) (52,260,551)
Net carrying amount 43,202,806 43,543,354
Land and buildings
At cost 27,584,066 22,309,583
Accumulated depreciation (15,624,969) (15,002,640)
Net carrying amount 11,959,097 7,306,943
Capital work in progress at cost 4,332,453 3,322,490
Total property, plant and equipment 59,494,356 54,172,787
Movement in property, plant and equipment
Plant and equipment
At 1 July net of accumulated depreciation 43,543,354 44,962,818
Additions 8,196,603 7,754,429
Disposals (614,896) (240,428)
Acquisition of subsidiary - (159,650)
Depreciation charge for the year (7,922,255) (8,773,815)
At 30 June net of accumulated depreciation 43,202,806 43,543,354
Land and buildings
At 1 July net of accumulated depreciation 7,306,943 7,750,665
Additions 5,274,483 103,940
Disposals - -
Depreciation charge for the year (622,329) (547,662)
At 30 June net of accumulated depreciation 11,959,097 7,306,943
Capital work in progress
At 1 July net of accumulated depreciation 3,322,490 1,128,967
Additions 17,852,734 10,922,610
Transfer to mine properties & development (3,371,682) (870,718)
Transfer to plant and equipment (8,196,606) (7,754,429)
Transfer to land and buildings (5,274,483) (103,940)
At 30 June 4,332,453 3,322,490
The carrying value of plant and equipment held under finance leases and hire purchase contracts at 30 June 2016
is $8,489,918 (2015: $5,031,989). Value of plant and equipment leased under finance leases and acquired through
hire purchase contracts during the 30 June 2016 financial year is $4,550,000 (2015: $5,019,500).
Leased assets and assets under hire purchase contracts are pledged as security for the related finance lease and
hire purchase lease liabilities (refer to notes 20 and 21).
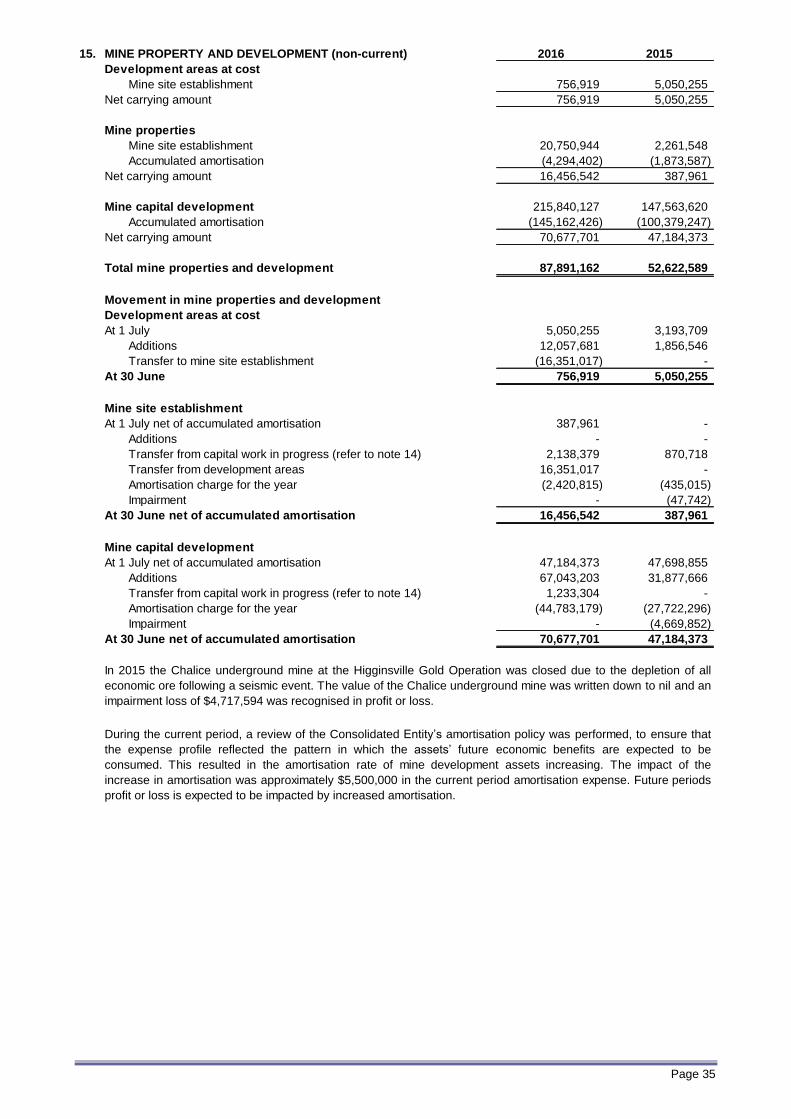
Page 35
15. MINE PROPERTY AND DEVELOPMENT (non-current) 2016 2015
Development areas at cost
Mine site establishment 756,919 5,050,255
Net carrying amount 756,919 5,050,255
Mine properties
Mine site establishment 20,750,944 2,261,548
Accumulated amortisation (4,294,402) (1,873,587)
Net carrying amount 16,456,542 387,961
Mine capital development 215,840,127 147,563,620
Accumulated amortisation (145,162,426) (100,379,247)
Net carrying amount 70,677,701 47,184,373
Total mine properties and development 87,891,162 52,622,589
Movement in mine properties and development
Development areas at cost
At 1 July 5,050,255 3,193,709
Additions 12,057,681 1,856,546
Transfer to mine site establishment (16,351,017) -
At 30 June 756,919 5,050,255
Mine site establishment
At 1 July net of accumulated amortisation 387,961 -
Additions - -
Transfer from capital work in progress (refer to note 14) 2,138,379 870,718
Transfer from development areas 16,351,017 -
Amortisation charge for the year (2,420,815) (435,015)
Impairment - (47,742)
At 30 June net of accumulated amortisation 16,456,542 387,961
Mine capital development
At 1 July net of accumulated amortisation 47,184,373 47,698,855
Additions 67,043,203 31,877,666
Transfer from capital work in progress (refer to note 14) 1,233,304 -
Amortisation charge for the year (44,783,179) (27,722,296)
Impairment - (4,669,852)
At 30 June net of accumulated amortisation 70,677,701 47,184,373
In 2015 the Chalice underground mine at the Higginsville Gold Operation was closed due to the depletion of all
economic ore following a seismic event. The value of the Chalice underground mine was written down to nil and an
impairment loss of $4,717,594 was recognised in profit or loss.
During the current period, a review of the Consolidated Entity’s amortisation policy was performed, to ensure that
the expense profile reflected the pattern in which the assets’ future economic benefits are expected to be
consumed. This resulted in the amortisation rate of mine development assets increasing. The impact of the
increase in amortisation was approximately $5,500,000 in the current period amortisation expense. Future periods
profit or loss is expected to be impacted by increased amortisation.

Page 36
36
16. EXPLORATION EXPENDITURE (non-current) 2016 2015
Exploration and evaluation costs carried forward in respect of mining
areas of interest
Pre-production areas
At Cost 164,583,990 97,854,736
Net carrying amount 164,583,990 97,854,736
Movement in deferred exploration and evaluation expenditure
At 1 July net of accumulated impairment 97,854,736 93,171,427
Additions 93,792,592 10,498,201
Acquisition of subsidiary - 159,650
Expenditure written off (27,063,338) (5,974,542)
At 30 June net of accumulated impairment 164,583,990 97,854,736
17. TRADE AND OTHER PAYABLES (current)
Trade creditors (a) 31,803,210 12,981,973
Sundry creditors and accruals (b) 30,807,008 17,844,298
Intercompany loans (c) 66,688,437 -
129,298,655 30,826,271
(a)
(b)
(c)
18. PROVISIONS (current)
Provision for annual leave 2,135,089 1,542,634
Provision for long service leave 402,624 348,722
Provision for fringe benefits tax payable 4,059 (27,838)
Provision for onerous lease (a) 479,496 479,496
3,021,268 2,343,014
(a)
19. PROVISIONS (non-current)
Provision for long service leave 1,248,164 1,193,986
Provision for onerous operating lease (a) 119,874 599,369
Provision for rehabilitation (b) 81,779,855 64,702,809
83,147,893 66,496,164
(a) Provision for onerous lease
On the acquisition of Alacer in 2014, a provision was recognised for the fact that the lease rentals or payments on
the operating lease were significantly higher than the market rate at acquisition. The provision has been calculated
based on the difference between the market rate and the rate paid. The operating lease has a life of four years.
The nature of the provisions are described below in note 22.
Intercompany loans are non-interest bearing and repayable on demand.
The carrying value of trade and other payables approximates the fair value thereof.
Trade creditors are non-interest bearing and generally on 30 day terms.
Sundry creditors and accruals are non-interest bearing and generally on 30 day terms.
During the year a review was undertaken for each area of interest to determine the appropriateness of continuing
to carry forward costs in relation to that area of interest. In assessing the carrying value of all of the Consolidated
Entity’s projects certain expenditure on exploration and evaluation of mineral resources has not led to the discovery
of commercially viable quantities of mineral resources. As a result exploration and evaluation expenditure of
$27,063,338 (2015: $5,974,542) was written off to the profit and loss. The amount relates to tenements which were
written down to nil as the expenditure did not result in the discovery of commercially viable quantities of mineral
resources and as a result there is no future benefits expected.
The ultimate recoupment of costs carried forward for exploration and evaluation phases is dependent on the
successful development and commercial exploitation or sale of the respective mining areas. Amortisation of the
costs carried forward for the development phase is not recognised pending the commencement of production.
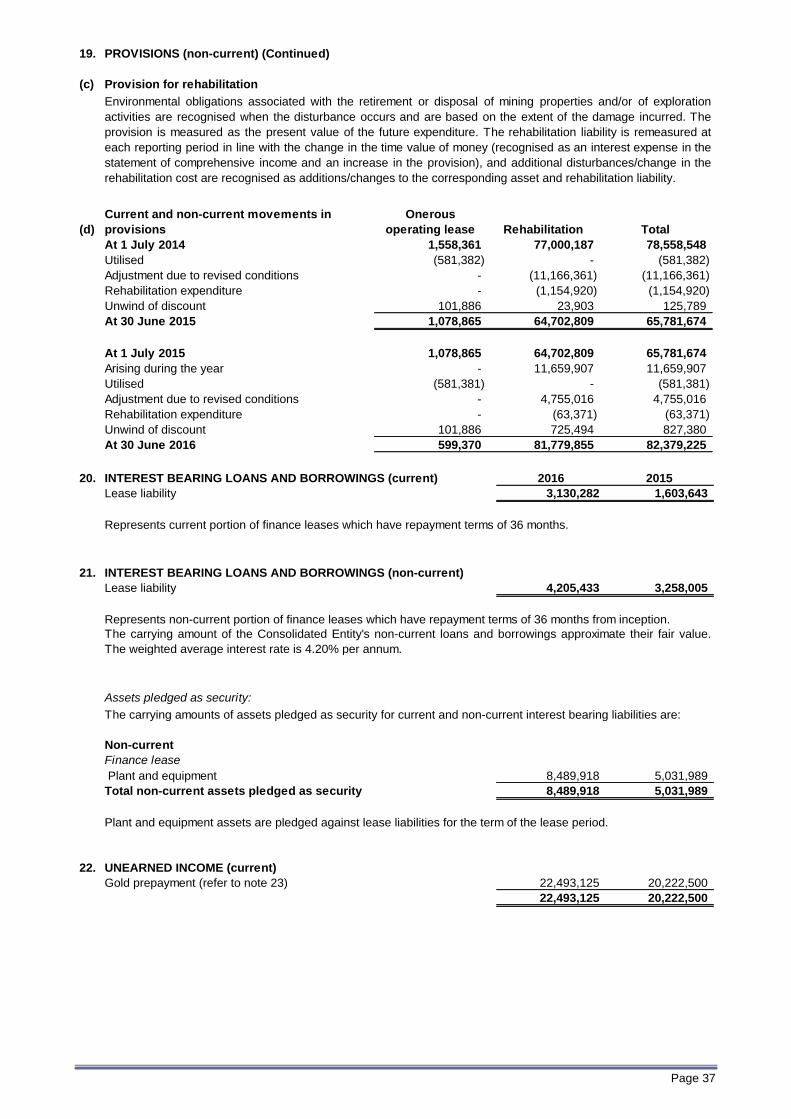
Page 37
37
19. PROVISIONS (non-current) (Continued)
(c) Provision for rehabilitation
Environmental obligations associated with the retirement or disposal of mining properties and/or of exploration
activities are recognised when the disturbance occurs and are based on the extent of the damage incurred. The
provision is measured as the present value of the future expenditure. The rehabilitation liability is remeasured at
each reporting period in line with the change in the time value of money (recognised as an interest expense in the
statement of comprehensive income and an increase in the provision), and additional disturbances/change in the
rehabilitation cost are recognised as additions/changes to the corresponding asset and rehabilitation liability.
(d)
Current and non-current movements in
provisions
Onerous
operating lease Rehabilitation Total
At 1 July 2014 1,558,361 77,000,187 78,558,548
Utilised (581,382) - (581,382)
Adjustment due to revised conditions - (11,166,361) (11,166,361)
Rehabilitation expenditure - (1,154,920) (1,154,920)
Unwind of discount 101,886 23,903 125,789
At 30 June 2015 1,078,865 64,702,809 65,781,674
At 1 July 2015 1,078,865 64,702,809 65,781,674
Arising during the year - 11,659,907 11,659,907
Utilised (581,381) - (581,381)
Adjustment due to revised conditions - 4,755,016 4,755,016
Rehabilitation expenditure - (63,371) (63,371)
Unwind of discount 101,886 725,494 827,380
At 30 June 2016 599,370 81,779,855 82,379,225 20. INTEREST BEARING LOANS AND BORROWINGS (current) 2016 2015
Lease liability 3,130,282 1,603,643
Represents current portion of finance leases which have repayment terms of 36 months.
21. INTEREST BEARING LOANS AND BORROWINGS (non-current)
Lease liability 4,205,433 3,258,005
Represents non-current portion of finance leases which have repayment terms of 36 months from inception.
Assets pledged as security:
The carrying amounts of assets pledged as security for current and non-current interest bearing liabilities are:
Non-current
Finance lease
Plant and equipment 8,489,918 5,031,989
Total non-current assets pledged as security 8,489,918 5,031,989
Plant and equipment assets are pledged against lease liabilities for the term of the lease period.
22. UNEARNED INCOME (current)
Gold prepayment (refer to note 23) 22,493,125 20,222,500
22,493,125 20,222,500
The carrying amount of the Consolidated Entity's non-current loans and borrowings approximate their fair value.
The weighted average interest rate is 4.20% per annum.
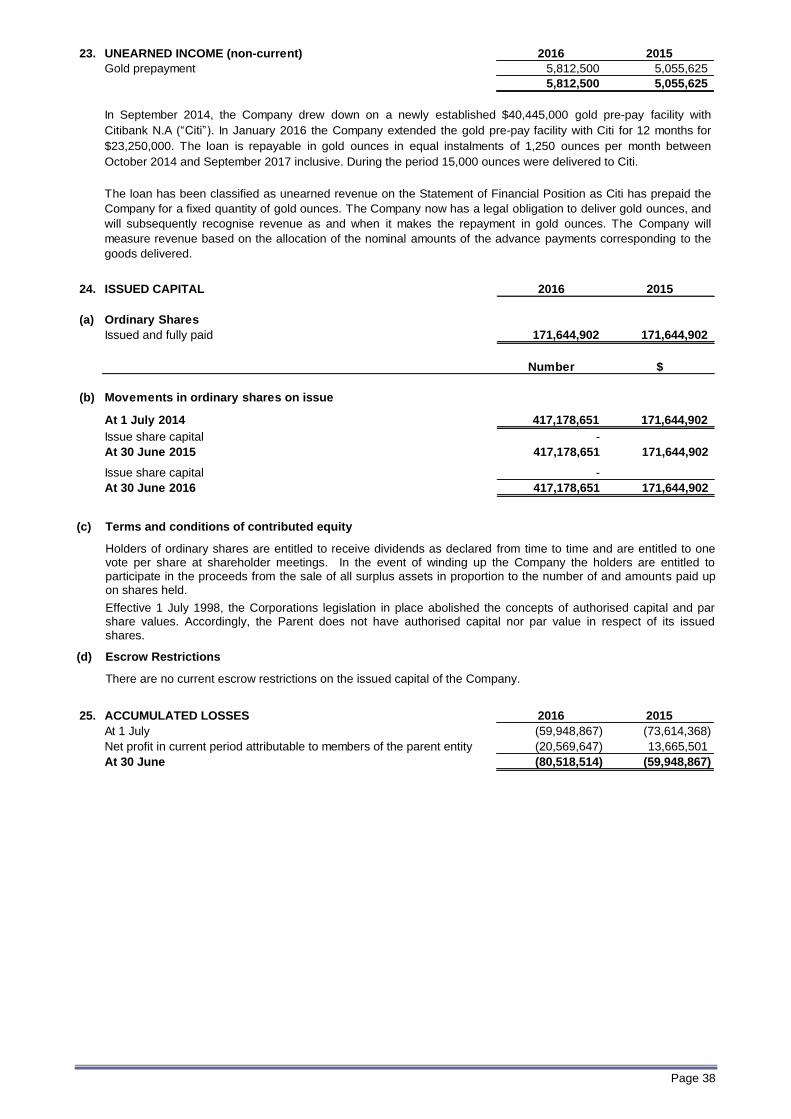
Page 38
38
23. UNEARNED INCOME (non-current) 2016 2015
Gold prepayment 5,812,500 5,055,625
5,812,500 5,055,625
In September 2014, the Company drew down on a newly established $40,445,000 gold pre-pay facility with
Citibank N.A (“Citi”). In January 2016 the Company extended the gold pre-pay facility with Citi for 12 months for
$23,250,000. The loan is repayable in gold ounces in equal instalments of 1,250 ounces per month between
October 2014 and September 2017 inclusive. During the period 15,000 ounces were delivered to Citi.
The loan has been classified as unearned revenue on the Statement of Financial Position as Citi has prepaid the
Company for a fixed quantity of gold ounces. The Company now has a legal obligation to deliver gold ounces, and
will subsequently recognise revenue as and when it makes the repayment in gold ounces. The Company will
measure revenue based on the allocation of the nominal amounts of the advance payments corresponding to the
goods delivered. 24. ISSUED CAPITAL 2016 2015
(a) Ordinary Shares
Issued and fully paid 171,644,902 171,644,902
Number $
(b) Movements in ordinary shares on issue
At 1 July 2014 417,178,651 171,644,902
Issue share capital -
At 30 June 2015 417,178,651 171,644,902
Issue share capital -
At 30 June 2016 417,178,651 171,644,902
(c) Terms and conditions of contributed equity
Holders of ordinary shares are entitled to receive dividends as declared from time to time and are entitled to one vote per share at shareholder meetings. In the event of winding up the Company the holders are entitled to participate in the proceeds from the sale of all surplus assets in proportion to the number of and amounts paid up on shares held.
Effective 1 July 1998, the Corporations legislation in place abolished the concepts of authorised capital and par share values. Accordingly, the Parent does not have authorised capital nor par value in respect of its issued shares.
(d) Escrow Restrictions
There are no current escrow restrictions on the issued capital of the Company.
25. ACCUMULATED LOSSES 2016 2015
At 1 July (59,948,867) (73,614,368)
Net profit in current period attributable to members of the parent entity (20,569,647) 13,665,501
At 30 June (80,518,514) (59,948,867)
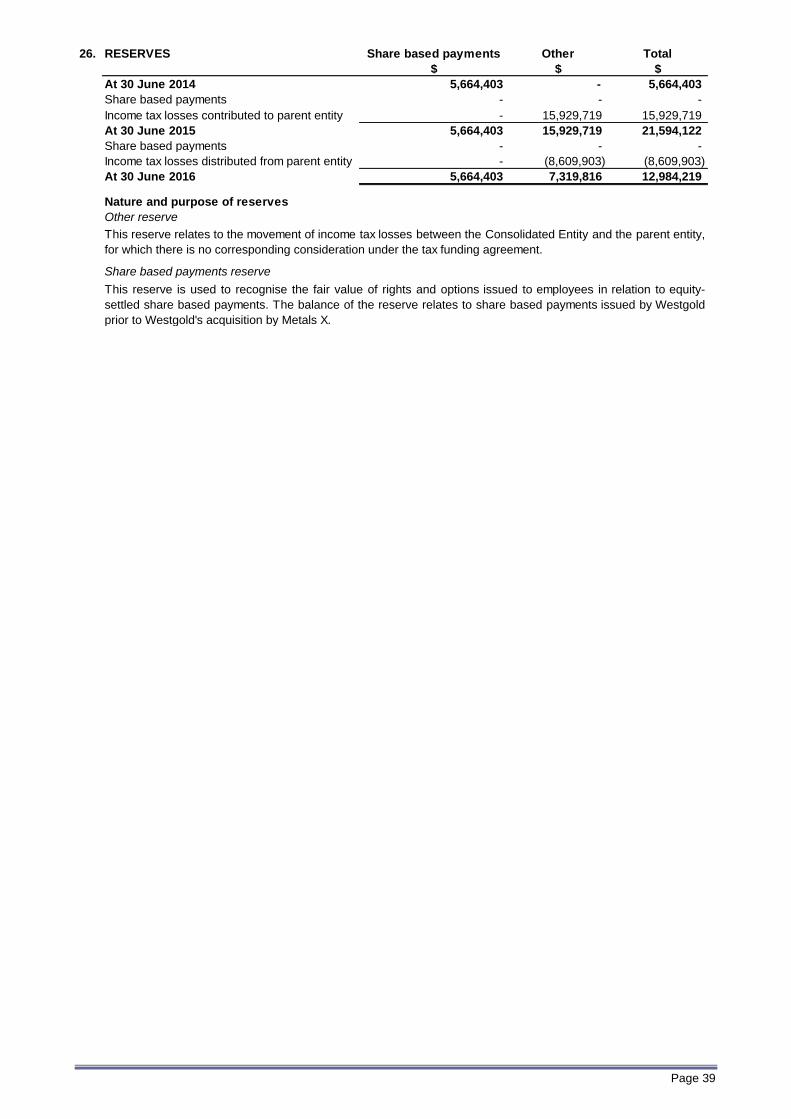
Page 39
39
26. RESERVES Share based payments Other Total
$ $ $
At 30 June 2014 5,664,403 - 5,664,403
Share based payments - - -
- 15,929,719 15,929,719
At 30 June 2015 5,664,403 15,929,719 21,594,122
- - -
- (8,609,903) (8,609,903)
At 30 June 2016 5,664,403 7,319,816 12,984,219
Nature and purpose of reserves
Other reserve
Share based payments reserve
This reserve is used to recognise the fair value of rights and options issued to employees in relation to equity-
settled share based payments. The balance of the reserve relates to share based payments issued by Westgold
prior to Westgold's acquisition by Metals X.
This reserve relates to the movement of income tax losses between the Consolidated Entity and the parent entity,
for which there is no corresponding consideration under the tax funding agreement.
Income tax losses contributed to parent entity
Share based payments
Income tax losses distributed from parent entity

Page 40
40
27. COMMITMENTS
(a) Capital commitments
Capital expenditure commitments
2016 2015
- Within one year 1,602,269 2,166,243
(b) Operating lease commitments - Company as lessee
Future minimum rentals payable under non-cancellable operating leases as at 30 June are as follows:
(i) Property leases as lessee:
- Within one year 1,517,850 1,452,489
- After one year but not more than five years 383,592 1,901,442
1,901,442 3,353,931
(ii) Equipment leases:
- Within one year 30,054 16,392
- After one year but not more than five years 22,514 16,472
52,568 32,864
(iii) Mineral tenement leases:
- Within one year 5,775,736 4,827,032
- After one year but not more than five years 21,527,161 17,122,084
- After more than five years 61,856,425 47,231,220
89,159,322 69,180,336
(c) Operating lease commitments - Company as lessor
Future minimum rentals receivable under non-cancellable operating leases as at 30 June are as follows:
(i) Property leases as lessor: 2016 2015
- Within one year 5,838 8,334
- After one year but not more than five years - -
5,838 8,334
At 30 June 2016 the Consolidated Entity has capital commitments that relate principally to the purchase and
maintenance of plant and equipment for its mining operations.
The Company has entered into commercial property leases on office rental and remote area residential
accommodation. The Company has entered into commercial leases on office equipment. These operating leases
have an average life of between one month and four years with renewal options included in the contracts. The
Company also has commercial leases over the tenements in which the mining operations are located. These
tenement leases have a life of between six months and twenty one years. In order to maintain current rights to
explore and mine the tenements the Consolidated Entity is required to perform minimum exploration work to meet
the expenditure requirements specified by the relevant state governing body. There are no restrictions placed on
the lessee by entering into these contracts.
Estimated capital expenditure contracted for at reporting date, but not recognised as liabilities for the Consolidated
Entity:
The Company has entered into a commercial sub-lease on the above mentioned office space.
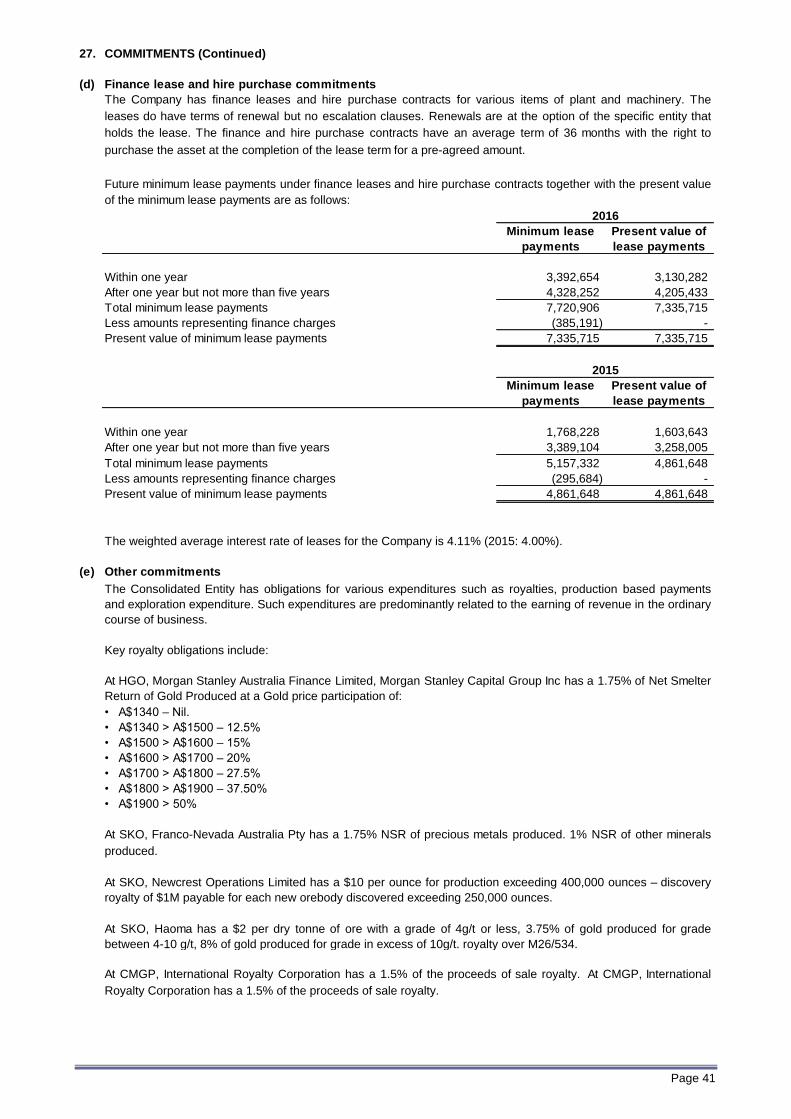
Page 41
41
27. COMMITMENTS (Continued)
(d) Finance lease and hire purchase commitments
Minimum lease
payments
Present value of
lease payments
Within one year 3,392,654 3,130,282
After one year but not more than five years 4,328,252 4,205,433
Total minimum lease payments 7,720,906 7,335,715
Less amounts representing finance charges (385,191) -
Present value of minimum lease payments 7,335,715 7,335,715
Minimum lease
payments
Present value of
lease payments
Within one year 1,768,228 1,603,643
After one year but not more than five years 3,389,104 3,258,005
Total minimum lease payments 5,157,332 4,861,648
Less amounts representing finance charges (295,684) -
Present value of minimum lease payments 4,861,648 4,861,648
(e) Other commitments
Key royalty obligations include:
• A$1340 – Nil.
• A$1340 > A$1500 – 12.5%
• A$1500 > A$1600 – 15%
• A$1600 > A$1700 – 20%
• A$1700 > A$1800 – 27.5%
• A$1800 > A$1900 – 37.50%
• A$1900 > 50%
At CMGP, International Royalty Corporation has a 1.5% of the proceeds of sale royalty. At CMGP, International
Royalty Corporation has a 1.5% of the proceeds of sale royalty.
At SKO, Newcrest Operations Limited has a $10 per ounce for production exceeding 400,000 ounces – discovery
royalty of $1M payable for each new orebody discovered exceeding 250,000 ounces.
At SKO, Haoma has a $2 per dry tonne of ore with a grade of 4g/t or less, 3.75% of gold produced for grade
between 4-10 g/t, 8% of gold produced for grade in excess of 10g/t. royalty over M26/534.
The weighted average interest rate of leases for the Company is 4.11% (2015: 4.00%).
2016
2015
Future minimum lease payments under finance leases and hire purchase contracts together with the present value
of the minimum lease payments are as follows:
The Consolidated Entity has obligations for various expenditures such as royalties, production based payments
and exploration expenditure. Such expenditures are predominantly related to the earning of revenue in the ordinary
course of business.
The Company has finance leases and hire purchase contracts for various items of plant and machinery. The
leases do have terms of renewal but no escalation clauses. Renewals are at the option of the specific entity that
holds the lease. The finance and hire purchase contracts have an average term of 36 months with the right to
purchase the asset at the completion of the lease term for a pre-agreed amount.
At HGO, Morgan Stanley Australia Finance Limited, Morgan Stanley Capital Group Inc has a 1.75% of Net Smelter
Return of Gold Produced at a Gold price participation of:
At SKO, Franco-Nevada Australia Pty has a 1.75% NSR of precious metals produced. 1% NSR of other minerals
produced.
Page 42
42
28. CONTINGENT ASSETS AND LIABILITIES
Clawback agreement
AngloGold Ashanti holds the right to earn back a 75% interest in any individual resource defined within the
tenements acquired from AngloGold by Westgold (with the exception of Rover 1 and Explorer 108), under specific
terms, conditions, specified payments and performance hurdles.
29. INTERESTS IN JOINT OPERATIONS
CANNON GOLD PROJECT
Impairment
During the year inventory write-downs of $361,865 (2015: nil) were recognised in the joint operation.
The Consolidated Entity's interest in the assets and liabilities of joint operations are included in the consolidated
statement of financial position.
The Company has a mine financing and profit sharing agreement with Southern Gold Limited (“SAU”) for the
development of the Cannon Gold Project. Under the agreement, the Consolidated Entity operates and manages the
mine. Ore is batch processed in parcels of approximately 40,000 tonnes through the SKO process plant. All
proceeds from the sale of the Cannon production goes first to repay all costs incurred by the project and SKO has
the right to a 50% share of all surplus profits. In line with the agreement the Company is liable for all mining
associated costs as it is the operator of the joint arrangement. At 30 June 2016 there are no commitments relating
to the joint operation.
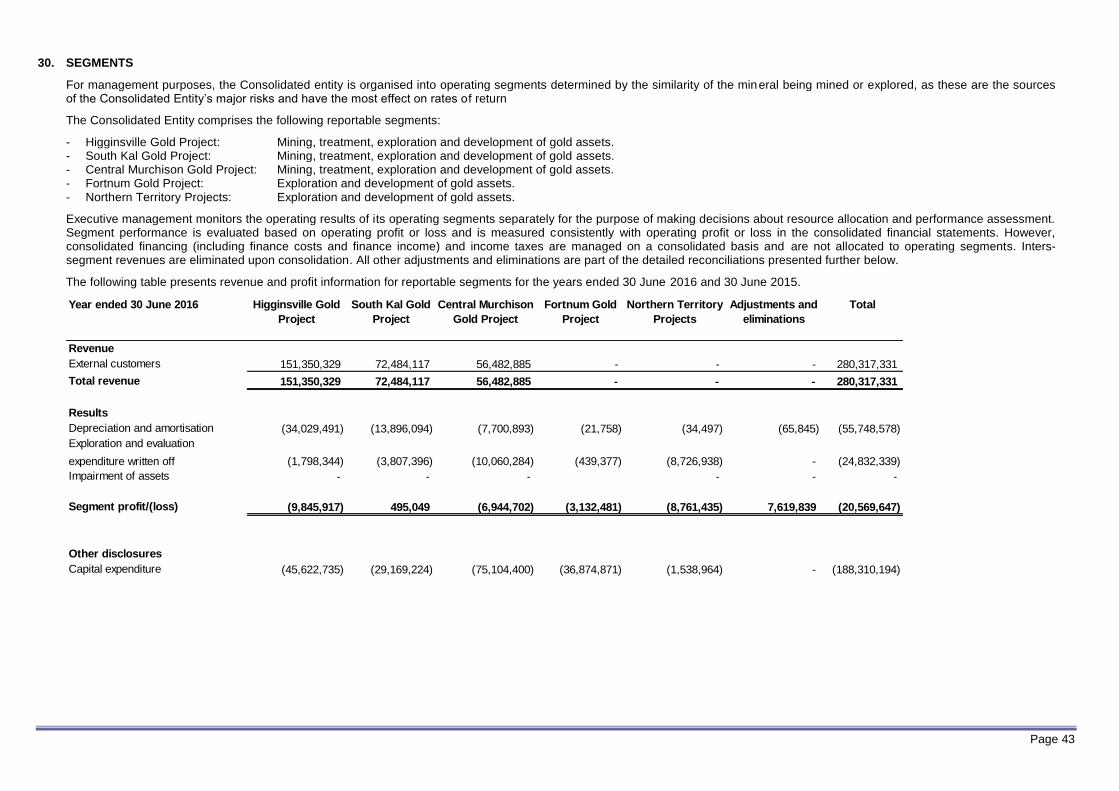
Page 43
43
30. SEGMENTS
For management purposes, the Consolidated entity is organised into operating segments determined by the similarity of the mineral being mined or explored, as these are the sources of the Consolidated Entity’s major risks and have the most effect on rates of return
The Consolidated Entity comprises the following reportable segments:
- Higginsville Gold Project: Mining, treatment, exploration and development of gold assets. - South Kal Gold Project: Mining, treatment, exploration and development of gold assets. - Central Murchison Gold Project: Mining, treatment, exploration and development of gold assets. - Fortnum Gold Project: Exploration and development of gold assets. - Northern Territory Projects: Exploration and development of gold assets.
Executive management monitors the operating results of its operating segments separately for the purpose of making decisions about resource allocation and performance assessment. Segment performance is evaluated based on operating profit or loss and is measured consistently with operating profit or loss in the consolidated financial statements. However, consolidated financing (including finance costs and finance income) and income taxes are managed on a consolidated basis and are not allocated to operating segments. Inters-segment revenues are eliminated upon consolidation. All other adjustments and eliminations are part of the detailed reconciliations presented further below.
The following table presents revenue and profit information for reportable segments for the years ended 30 June 2016 and 30 June 2015.
Year ended 30 June 2016 Higginsville Gold
Project
South Kal Gold
Project
Central Murchison
Gold Project
Fortnum Gold
Project
Northern Territory
Projects
Adjustments and
eliminations
Total
Revenue
External customers 151,350,329 72,484,117 56,482,885 - - - 280,317,331
Total revenue 151,350,329 72,484,117 56,482,885 - - - 280,317,331
Results
Depreciation and amortisation (34,029,491) (13,896,094) (7,700,893) (21,758) (34,497) (65,845) (55,748,578)
Exploration and evaluation
expenditure written off (1,798,344) (3,807,396) (10,060,284) (439,377) (8,726,938) - (24,832,339)
Impairment of assets - - - - - -
Segment profit/(loss) (9,845,917) 495,049 (6,944,702) (3,132,481) (8,761,435) 7,619,839 (20,569,647)
Other disclosures
Capital expenditure (45,622,735) (29,169,224) (75,104,400) (36,874,871) (1,538,964) - (188,310,194)

Page 44
44
30. SEGMENTS (Continued)
Year ended 30 June 2015 Higginsville Gold
Project
South Kal Gold
Project
Central Murchison
Gold Project
Fortnum Gold
Project
Northern Territory
Projects
Adjustments and
eliminations
Total
Revenue
External customers 195,812,444 36,963,793 - - - - 232,776,237
Total segment revenue 195,812,444 36,963,793 - - - - 232,776,237
Results
Depreciation and amortisation (31,421,409) (4,446,557) (1,271,007) - (95,575) (244,241) (37,478,789)
Exploration and evaluation
expenditure written off (418,824) (728,993) (2,003,483) - (2,823,243) - (5,974,543)
Impairment of assets (4,717,594) - - - - - (4,717,594)
Segment profit/(loss) 42,136,886 1,387,087 (4,540,452) - (2,918,817) 481,706 36,546,410
Other disclosures
Capital expenditure (22,594,584) (20,882,269) (20,617,506) - (2,227,024) - (66,321,383)
Adjustments and eliminations
Finance income and costs are not allocated to individual segments as the underlying instruments are managed on a Consolidated Entity basis.
Corporate charges comprise non-segmental expenses such as head office expenses. Corporate charges are not allocated to operating segments.

Page 45
30. SEGMENTS (Continued)
(a) Segment revenue from external customers
Australia 280,317,331 234,070,516
Total revenue 280,317,331 234,070,516
(b) Segment non-current assets are all located in Australia.
The Consolidated Entity has two customers to which it provides gold. The Consolidated Entity sells its gold to two
Australian customers that each accounts for 33% and 67% of external revenue respectively (2015: 66% and 34%).
Revenue from external customers by geographical locations is detailed below. Revenue is attributable to
geographical location based on the location of the customers. The Company does not have external revenues from
external customers that are attributable to any foreign country other than as shown.
31. KEY MANAGEMENT PERSONNEL
(a)
Appointed Resigned
(i) Directors
PG Cook CEO & Executive Director 19 March 2007 -
WS Hallam Executive Director 18 March 2010 -
PD Hucker
Director & Chief Operating Officer -
SKO & HGO 17 October 2012 -
(ii) Other Executives ("KMPs")
JG Brock Chief Operating Officer - CMGP 21 March 2016
Details of Key Management Personnel
There are no other changes of the key management personnel after the reporting date and before the date the
financial report was authorised for issue.
(b)
2016 2015
Short-term employee benefits 626,047 593,124
Post employment benefits 41,603 39,649
Other long-term benefits 19,950 16,780
Share-based payment 89,841 37,620
777,441 687,173
Compensation of Key Management Personnel
The directors and key management personnel are paid by Metals X for services rendered to the Consolidated
Entity, and this has not been on-charged to the Consolidated Entity by Metals X. (c) Loans to Key Management Personnel
There were no loans to key management personnel during the current or previous financial year.

Page 46
32. RELATED PARTY DISCLOSURES
(a)
Country of
Name incorporation 2016 2015
Castile Resources Pty Ltd Australia 100% 100%
Aragon Resources Pty Ltd Australia 100% 100%
Big Bell Gold Operations Pty Ltd Australia 100% 100%
Hill 51 Pty Ltd Australia 100% 100%
Avoca Resources Pty Ltd Australia 100% 100%
Avoca Mining Pty Ltd Australia 100% 100%
HBJ Minerals Pty Ltd Australia 100% 100%
Dioro Exploration NL Australia 100% 100%
Hampton Gold Mining Areas Limited United Kingdom 100% 100%
(b) Ultimate parent
Metals X Limited is the ultimate parent entity.
Subsidiaries
The consolidated financial statements of the Consolidated Entity include Westgold Resources Pty Ltd and the
subsidiaries listed in the following table:
Ownership interest
(c) Transactions with related parties 2016 2015
Amounts attributable to transactions with entities in the wholly-
owned group
Loans (repayment)/drawn down between Metals X Limited * (111,974,171) 51,540,414
Loans draw down/(repayment) between Bluestone Australia Pty Ltd * 32,413,828 (3,835,602)
* Loans are non-interest bearing and repayable on demand.
During the period Metals X issued 22,000,000 shares to acquire the Mt Henry Gold Project on behalf of subsidiary
Avoca Mining Pty Ltd.
During the period Metals X issued 18,000,000 shares to acquire the Fortnum Gold Project on behalf of subsidiary Big
Bell Gold Operations Pty Ltd.

Page 47
33. INFORMATION RELATING TO WESTGOLD RESOURCES PTY LTD ("THE PARENT ENTITY")
2016 2015
Current assets 3,078 1,658
Total assets 134,583,134 106,223,913
Current Liabilities 22,493,125 -
Total Liabilities 28,307,837 1,599
-
Issued capital 171,644,903 171,644,903
Accumulated losses (72,659,408) (72,712,391)
Option premium reserve 5,664,403 5,664,403
Other reserves 1,625,400 1,625,400
Total Equity 106,275,298 106,222,315
Profit/(loss) of the parent entity 52,983 412,777
Total comprehensive profit/(loss) of the parent entity 52,983 412,777
Contingent liabilities of the parent entity. Nil
Nil
Guarantees entered into by the parent entity in relation to the debts of its subsidiaries.
Pursuant to Class Order 98/1418, Metals X the Company's parent entity and its wholly owned subsidiaries entered
into a deed of cross guarantee on 11 November 2013. The effect of the deed is that Metals X has guaranteed to
pay any deficiency in the event of winding up of any controlled entity or if they do not meet their obligations under
the terms of any debt subject to the guarantee. The controlled entities have given a similar guarantee in the event
that Metals X is wound up or if it does not meet its obligations under the terms of any debt subject to the guarantee.
The statement of financial position and statement of comprehensive income for the closed group is not materially
different to the Consolidated Entity's statement of financial position and statement of comprehensive income.
Contractual commitments by the parent entity for the acquisition of property, plant or
equipment.
34. EVENTS AFTER THE BALANCE SHEET DATE
On 4 August 2016 Metals X Limited the Company’s parent entity announced that it will be commencing the process to separate its gold division from the remainder of the diversified base metals assets by a potential demerger.
The demerger will have a potential financial impact on Westgold:
Metals X will provide funding of $110,000,000 to Westgold upon the demerger;
All intercompany loans between Westgold and its parent entity Metals X will be forgiven immediately before the demerger;
Certain assets and contracts will be assigned or transferred from Metals X to Westgold upon the demerger; and
Westgold will exit the Metals X tax consolidated group and intends to from a new tax consolidated group upon the demerger.
Page 48
Directors’ Declaration
In accordance with a resolution of the Directors of Westgold Resources Pty Ltd, I state that: In the opinion of the Directors:
(a) the financial statements and notes of the Company and of the Consolidated Entity are in accordance with the Corporations Act 2001, including:
(i) giving a true and fair view of the Company's and the Consolidated Entity's financial position as at 30 June 2016 and of their performance for the year ended on that date; and
(ii) complying with the Australian Accounting Standards (including the Australian Accounting Interpretations) and Corporations Regulations 2001; and
(b) the financial statements and notes also comply with International Financial Reporting Standards as disclosed in note 2(c) and;
(c) there are reasonable grounds to believe that the Company will be able to pay its debts as and when they become due and payable.
On behalf of the Board.
PG Cook Director
Perth, 19 October 2016
Page 49
Independent Audit Report

Page 50
Independent Audit Report