30 June 2012 Audited Financial Statements - City of …€¦ · General purpose financial...
64
2
Transcript of 30 June 2012 Audited Financial Statements - City of …€¦ · General purpose financial...

2

2
Rockdale City Council
General purpose financial statements for the year ended 30 June 2012
Contents
Page General purpose financial statements
Statement by Councillors and Management 3 Income statement 4 Statement of comprehensive income 5 Balance sheet 6 Statement of changes in equity 7 Statement of cash flows 8 Notes to the financial statements 9 Auditors’ reports 54
AASB101(46)(b),(d) These financial statements are general purpose financial statements of Rockdale City Council and are presented in the Australian currency.
AASB101(126)(a) Rockdale City Council is constituted under the Local Government Act (1993) and has its principal place of business at:
Rockdale City Council 2 Bryant Street Rockdale NSW 2216 AASB110(17) The financial statements are authorised for issue by the Council on 17 October 2012. Council has the power
to amend and reissue the financial statements.
Through the use of the internet, we have ensured that our reporting is timely, complete, and available at minimum cost. All press releases, financial statements and other information are available on our website: www.rockdale.nsw.gov.au

3

4
Rockdale City Council
Income statement for the year ended 30 June 2012
Original budget(1)
2012 $’000 Notes
Actual 2012 $’000
Actual 2011 $’000
Income from continuing operations Revenue: 50,707 Rates and annual charges 3a 50,757 48,789 4,815 User charges and fees 3b 8,697 5,260 3,109 Interest and investment revenue 3c 4,431 3,994 4,342 Other revenues 3d 4,583 4,261 5,252 Grants and contributions provided for operating purposes 3e,f 6,739 5,860 6,735 Grants and contributions provided for capital purposes 3e,f 3,422 7,090 Other Income: - Net gain from the disposal of assets 5 - 75
- Net share of interests in joint ventures and associates using the equity method 19 468 445
74,960 Total income from continuing operations 79,097 75,774 Expenses from continuing operations 29,576 Employee benefits and on-costs 4a 29,864 27,956 387 Borrowing costs 4b 354 378 18,258 Materials and contracts 4c 22,992 17,442 17,355 Depreciation and amortisation 4d 18,230 17,037 - Impairment - - 9,120 Other expenses 4e 9,947 9,422 412 Net loss from the disposal of assets 5 160 - 75,108 Total expenses from continuing operations 81,547 72,235 (148) Operating result from continuing operations (2,450) 3,539 - Operating result from discontinued operations - - (148) Net operating result for the year (2,450) 3,539 Attributable to: (148) – Council (2,450) 3,539 - – Minority interests - -
(6,883) Net operating result for the year before grants and contributions provided for capital purposes (5,872) (3,551)
Note:
(1) Original budget as approved by Council – refer Note 16.
The above Income statement should be read in conjunction with the accompanying notes.

5
Rockdale City Council
Statement of comprehensive income for the year ended 30 June 2012
Notes
Actual 2012 $’000
Actual 2011 $’000
Net operating result for the year – from Income statement (2,450) 3,539 Other comprehensive income Gain (loss) on revaluation of infrastructure, property, plant and
equipment 20(a) - 40,880 Changes in accounting policies 20(b) - (440,664) Adjustment to correct prior period errors 20(d) (4,160) (8,012) Total other comprehensive income for the year (4,160) (407,796) Total comprehensive income for the year (6,610) (404,257) Attributable to – Council (6,610) (404,257) – Minority interests - -
The above Statement of comprehensive income should be read in conjunction with the accompanying notes.

6
Rockdale City Council
Balance sheet as at 30 June 2012
Notes
Actual 2012 $’000
Actual 2011 $’000
ASSETS Current assets Cash and cash equivalents 6a 58,661 36,130 Investments 6b 6,004 5,947 Receivables 7 5,813 7,248 Inventories 8 50 56 Other 8 663 604 Non-current assets classified as held for sale - - Total current assets 71,191 49,985 Non-current assets Investments 6b 5,016 18,393 Receivables 7 445 678 Infrastructure, property, plant and equipment 9 784,876 799,976 Investments accounted for using equity method 19 1,494 1,026 Investment property 14 - - Intangible assets 21 2,335 1,954 Other 8 380 443 Total non-current assets 794,546 822,470 Total assets 865,737 872,455 LIABILITIES Current liabilities Payables 10 7,118 7,380
Borrowings 10 954 964 Provisions 10 10,194 10,268 Total current liabilities 18,266 18,612 Non-current liabilities Payables 10 - - Borrowings 10 4,909 4,989 Provisions 10 1,459 1,140 Total non-current liabilities 6,368 6,129 Total liabilities 24,634 24,741 Net assets 841,103 847,714 EQUITY Asset Revaluation Reserve 20 394,887 399,315 Retained Earnings 20 446,216 448,399 Total equity 841,103 847,714 Council equity interest 841,103 847,714 Minority equity interest - Total equity 841,103 847,714
The above Balance sheet should be read in conjunction with the accompanying notes.

7
Rockdale City Council
Statement of changes in equity for the year ended 30 June 2012
Actual 2012 $’000
Actual 2011 $’000
Notes
Retained earnings
Asset revaluation
reserve Total equity
Retained earnings
Asset revaluation
reserve Total equity
Opening balance 20 448,399 399,315 847,714 892,273 359,698 1,251,971
Correction of errors 20
267
(4,427)
(4,160)
-
-
- Restated opening
balance 20
448,666
34,887 843,553 892,273 359,698 1,251,971
Net operating result for the year 20
(2,450)
-
(2,450) 3,539 - 3,539
Other Comprehensive income 20
-
-
- (447,413) 39,617 (407,796)
Total comprehensive income 20
(2,450)
-
(2,450) (443,874) 39,617 (404,257)
Closing balance 20 446,216 394,887 841,103 448,399 399,315 847,714
The above Statement of changes in equity should be read in conjunction with the accompanying notes.

8
Rockdale City Council
Statement of cash flows for the year ended 30 June 2012
Budget 2012 $’000 Notes
Actual 2012 $’000
Actual 2011 $’000
Cash flows from operating activities Receipts: 50,482 Rates and annual charges 50,595 48,627 8,524 User charges and fees 9,732 6,193 4,058 Investment revenue and interest 4,256 2,619 10,541 Grants and contributions 11,494 12,147 1,400 Deposits and retentions received 1,443 969 4,495 Other revenue 4,274 3,417 Payments: (28,635) Employee benefits and on-costs (29,619) (27,630) (20,884) Materials and contracts (24,187) (18,362) (310) Borrowing costs (312) (378) (1,300) Deposits and retentions refunded (1,346) (1,598) (11,000) Other expenses (10,186) (7,326) 17,371 Net cash provided by operating activities 11(b) 16,144 18,678 Cash flows from investing activities Receipts: 16,935 Redemption of investments 18,351 10,361 923 Sale of infrastructure, property, plant and equipment 990 868 Payments: (4,000) Purchase of investments (4,000) (12,989) (10,000) Purchase of infrastructure, property, plant and equipment 9 (8,643) (12,773) - Purchase of intangible assets 21 (447) - 3,858 Net cash provided by (or used in) Investing activities 6,251 (14,533) Cash flows from financing activities Receipts: 1,100 Proceeds from borrowings 1,100 - Payments: (1,000) Repayment of borrowings (964) (1,090) 100 Net cash provided by (or used in) financing activities 136 (1,090) 21,329 Net increase in cash and cash equivalents 22,531 3,056
36,130 Cash and cash equivalents at beginning of reporting period 11(a) 36,130 33,074
57,459 Cash and cash equivalents at end of reporting period 11(a) 58,661 36,130
The above Statement of cash flows should be read in conjunction with the accompanying notes.

Notes to the financial statements 30 June 2012
9
Rockdale City Council
Notes to the financial statements for the year ended 30 June 2012
Contents of the notes to the financial statements Page
Note 1 Summary of significant accounting policies 10
Note 2(a) Functions or activities 19 Note 2(b) Components of functions or activities 20 Note 3 Income from continuing operations 21 Note 4 Expenses from continuing operations 25 Note 5 Gain or loss from the disposal of assets 27 Note 6(a) Cash and cash equivalents 28 Note 6(b) Investments 29 Note 6(c) Restricted cash, cash equivalents and investments 30 Note 7 Receivables 31 Note 8 Inventories and other assets 32 Note 9(a) Infrastructure, property, plant and equipment 33 Note 9(b) Restricted infrastructure, property, plant and equipment 33 Note 10(a) Payables, borrowings and provisions 35 Note 10(b) Description of and movements in provisions 36 Note 11 Reconciliation of operating result to net cash movement from operating activities37 Note 12 Commitments for expenditure 38 Note 13 Statement of performance measures – Consolidated results 39 Note 14 Investment properties 40 Note 15 Financial risk management 41 Note 16 Material budget variations 45 Note 17 Statement of developer contributions 47 Note 18 Contingencies 50 Note 19 Interests in joint ventures and associates 51 Note 20 Revaluation reserves and retained earnings 52 Note 21 Intangible assets 53
Notes to the financial statements 30 June 2012
10
MANDATORY AASB101(8)(e)
Note 1 Summary of significant accounting policies AASB101(103)(a),(b) AASB127(42)(a)
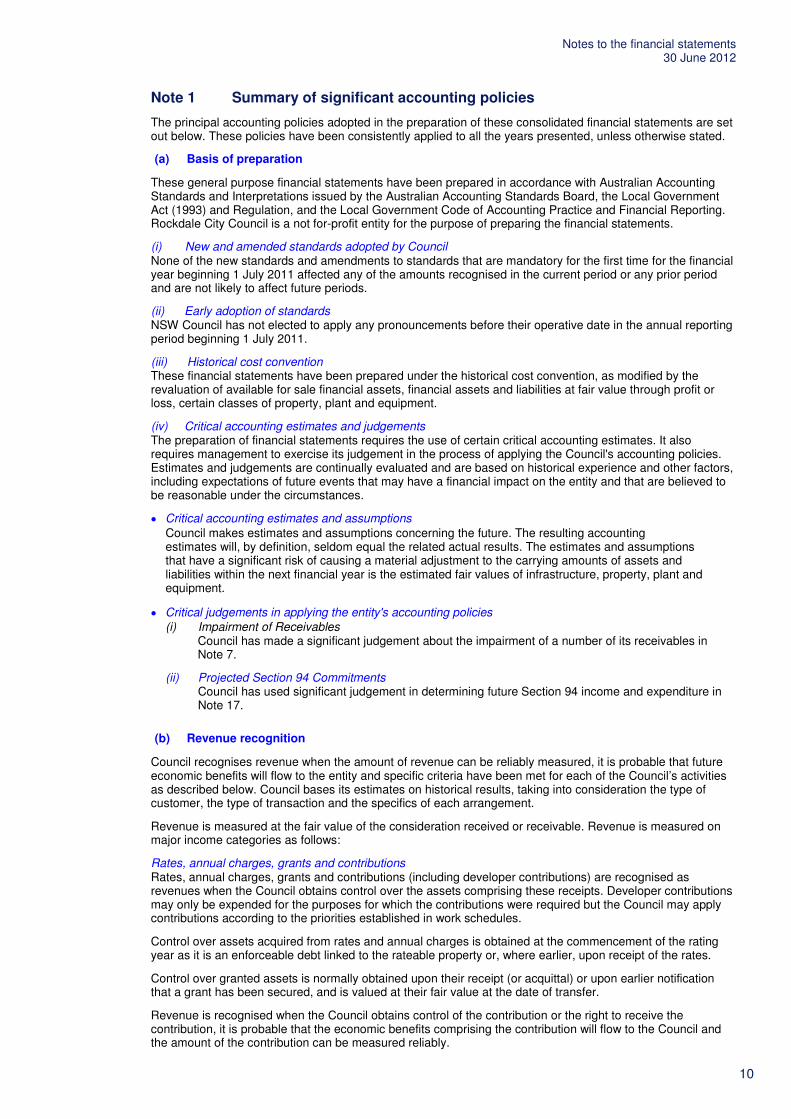
The principal accounting policies adopted in the preparation of these consolidated financial statements are set out below. These policies have been consistently applied to all the years presented, unless otherwise stated.
(a) Basis of preparation
AASB101(Aus15.2), (Aus15.4)
These general purpose financial statements have been prepared in accordance with Australian Accounting Standards and Interpretations issued by the Australian Accounting Standards Board, the Local Government Act (1993) and Regulation, and the Local Government Code of Accounting Practice and Financial Reporting. Rockdale City Council is a not for-profit entity for the purpose of preparing the financial statements. 1
(i) New and amended standards adopted by Council 13 AASB101(117)(a) None of the new standards and amendments to standards that are mandatory for the first time for the financial
year beginning 1 July 2011 affected any of the amounts recognised in the current period or any prior period and are not likely to affect future periods.
(ii) Early adoption of standards 15,16 AASB101(122),(125) NSW Council has not elected to apply any pronouncements before their operative date in the annual reporting
period beginning 1 July 2011.
(iii) Historical cost convention These financial statements have been prepared under the historical cost convention, as modified by the
revaluation of available for sale financial assets, financial assets and liabilities at fair value through profit or loss, certain classes of property, plant and equipment.
(iv) Critical accounting estimates and judgements The preparation of financial statements requires the use of certain critical accounting estimates. It also
requires management to exercise its judgement in the process of applying the Council's accounting policies. Estimates and judgements are continually evaluated and are based on historical experience and other factors, including expectations of future events that may have a financial impact on the entity and that are believed to be reasonable under the circumstances.
• Critical accounting estimates and assumptions Council makes estimates and assumptions concerning the future. The resulting accounting
estimates will, by definition, seldom equal the related actual results. The estimates and assumptions that have a significant risk of causing a material adjustment to the carrying amounts of assets and liabilities within the next financial year is the estimated fair values of infrastructure, property, plant and equipment.
• Critical judgements in applying the entity's accounting policies (i) Impairment of Receivables Council has made a significant judgement about the impairment of a number of its receivables in
Note 7.
(ii) Projected Section 94 Commitments Council has used significant judgement in determining future Section 94 income and expenditure in
Note 17.
AASB101 (b) Revenue recognition
Council recognises revenue when the amount of revenue can be reliably measured, it is probable that future economic benefits will flow to the entity and specific criteria have been met for each of the Council’s activities as described below. Council bases its estimates on historical results, taking into consideration the type of customer, the type of transaction and the specifics of each arrangement.
AAS27 Revenue is measured at the fair value of the consideration received or receivable. Revenue is measured on major income categories as follows:
Rates, annual charges, grants and contributions Rates, annual charges, grants and contributions (including developer contributions) are recognised as
revenues when the Council obtains control over the assets comprising these receipts. Developer contributions may only be expended for the purposes for which the contributions were required but the Council may apply contributions according to the priorities established in work schedules.
Control over assets acquired from rates and annual charges is obtained at the commencement of the rating year as it is an enforceable debt linked to the rateable property or, where earlier, upon receipt of the rates.
Control over granted assets is normally obtained upon their receipt (or acquittal) or upon earlier notification that a grant has been secured, and is valued at their fair value at the date of transfer.
Revenue is recognised when the Council obtains control of the contribution or the right to receive the contribution, it is probable that the economic benefits comprising the contribution will flow to the Council and the amount of the contribution can be measured reliably.

Notes to the financial statements 30 June 2012
11
Note 1 Summary of significant accounting policies (continued) (b) Revenue recognition (continued) Where grants or contributions recognised as revenues during the financial year were obtained on condition
that they be expended in a particular manner or used over a particular period and those conditions were undischarged at balance date, the unused grant or contribution is disclosed in Note 3(g). The note also discloses the amount of unused grant or contribution from prior years that was expended on Council’s operations during the current year.
A liability is recognised in respect of revenue that is reciprocal in nature to the extent that the requisite service has not been provided at balance date.
User charges and fees User charges and fees (including parking fees and fines) are recognised as revenue when the service has
been provided, the payment is received, or when the penalty has been applied, whichever first occurs.
Sale of plant, property, infrastructure and equipment The profit or loss on sale of an asset is determined when control of the asset has irrevocably passed to the
buyer.
Interest and rents Interest and rents are recognised as revenue on a proportional basis when the payment is due, the value of
the payment is notified, or the payment is received, whichever first occurs.
AASB101(110) (c) Principles of consolidation
(i) The Consolidated Fund LGA s.409(1) In accordance with the provisions of Section 409(1) of the Local Government Act 1993, all money and
property received by Council is held in the Council’s Consolidated Fund unless it is required to be held in the Council’s Trust Fund. The consolidated fund and other entities through which the Council controls resources to carry on its functions have been included in the financial statements forming part of this report.
The following entities have been included as part of the Consolidated fund:
• General purpose operations • Rockdale Meal Services
LGA s.411 (ii) The Trust Fund In accordance with the provisions of Section 411 of the Local Government Act 1993 (as amended), a separate
and distinct Trust Fund is maintained to account for all money and property received by the Council in trust which must be applied only for the purposes of or in accordance with the trusts relating to those monies. Trust monies and property subject to Council’s control have been included in these reports.
Trust monies and property held by Council but not subject to the control of Council, have been excluded from these reports. A separate statement of monies held in the Trust Fund is available for inspection at the Council office by any person free of charge.
AASB101(110) (iii) Joint ventures Jointly controlled assets The proportionate interests in the assets, liabilities and expenses of a joint venture activity have been
incorporated in the financial statements under the appropriate headings. Details of the joint venture are set out in Note 19.
Joint venture entities The interest in a joint venture partnership is accounted for using the equity method after initially being
recognised at cost. Under the equity method, the share of the profits or losses of the partnership is recognised in profit or loss, and the share of post acquisition movements in reserves is recognised in other comprehensive income. Details relating to the partnership are set out in note 19.
Profits or losses on transactions establishing the joint venture partnership and transactions with the joint venture are eliminated to the extent of the Council's ownership interest until such time as they are realised by the joint venture partnership on consumption or sale. However, a loss on the transaction is recognised immediately if the loss provides evidence of a reduction in the net realisable value of current assets, or an impairment loss.
(d) Leases
Leases in which a significant portion of the risks and rewards of ownership are not transferred to Council as lessee are classified as operating leases. Payments made under operating leases (net of any incentives received from the lessor) are charged to the income statement on a straight-line basis over the period of the lease.

Notes to the financial statements 30 June 2012
12
Note 1 Summary of significant accounting policies (continued) (d) Leases (continued)
Lease income from operating leases where Council is a lessor is recognised in income on a straight-line basis over the lease term.
AASB101(110),(111) (e) Acquisition of assets
AASB3(14),(24),(28) AASB3(27) AASB3(31)
The purchase method of accounting is used to account for all acquisitions of assets. Cost is measured as the fair value of the assets given, plus costs directly attributable to the acquisition.
AASB101(110) (f) Impairment of assets
AASB136(9),(10) Assets that have an indefinite useful life are not subject to amortisation and are tested annually for impairment or more frequently if events or changes in circumstances indicate that they might be impaired. Other assets are tested for impairment whenever events or changes in circumstances indicate that the carrying amount may not be recoverable. An impairment loss is recognised for the amount by which the asset’s carrying amount exceeds its recoverable amount. The recoverable amount is the higher of an asset’s fair value less costs to sell and value in use.
AASB101(110) (g) Cash and cash equivalents
AASB107(6),(8),(46) For cash flow statement presentation purposes, cash and cash equivalents includes cash on hand, deposits held at call with financial institutions, other short-term, highly liquid investments with original maturities of three months or less that are readily convertible to known amounts of cash and which are subject to an insignificant risk of changes in value, and bank overdrafts. Bank overdrafts are shown within borrowings in current liabilities on the balance sheet.
AASB101(110) (h) Receivables
Receivables are recognised initially at fair value and subsequently measured at amortised cost using the effective interest method, less provision for impairment. Receivables are generally due for settlement within 30 days.
Collectibility of receivables is reviewed on an ongoing basis. Debts which are known to be uncollectible are written off by reducing the carrying amount directly. An allowance account (provision for doubtful debts) is used when there is objective evidence that Council will not be able to collect all amounts due according to the original terms of the receivables. Significant financial difficulties of the debtor, probability that the debtor will enter bankruptcy or financial reorganisation, and default or delinquency in payments (more than 30 days overdue) are considered indicators that the receivable is impaired. The amount of the impairment allowance is the difference between the asset’s carrying amount and the present value of estimated future cash flows, discounted at the original effective interest rate. Cash flows relating to short-term receivables are not discounted if the effect of discounting is immaterial.
The amount of the impairment loss is recognised in the income statement within other expenses. When a receivable for which an impairment allowance had been recognised becomes uncollectible in a subsequent period, it is written off against the allowance account. Subsequent recoveries of amounts previously written off are credited against other expenses in the income statement.
AASB101(110) (i) Inventories
Inventories are stated at the lower of cost and net realizable value. Costs are assigned on the basis of first in first out method.
AASB101(110) AASB7(21)
(j) Investments and other financial assets
Council classifies its investments as financial assets at fair value through profit or loss only. These are financial assets held for trading and are classified in this category as Council has the intention to sell them if the market conditions are favourable.
Recognition and de-recognition Regular purchases and sales of financial assets are recognised on trade-date - the date on which Council
commits to purchase or sell the asset. Investments are initially recognised at fair value plus transaction costs for all financial assets not carried at fair value through profit or loss. Financial assets carried at fair value through profit or loss are initially recognised at fair value and transaction costs are expensed in the income statement. Financial assets are derecognised when the rights to receive cash flows from the financial assets have expired or have been transferred and Council has transferred substantially all the risks and rewards of ownership.
Notes to the financial statements 30 June 2012
13
Note 1 Summary of significant accounting policies (continued) (j) Investments and other financial assets (continued)
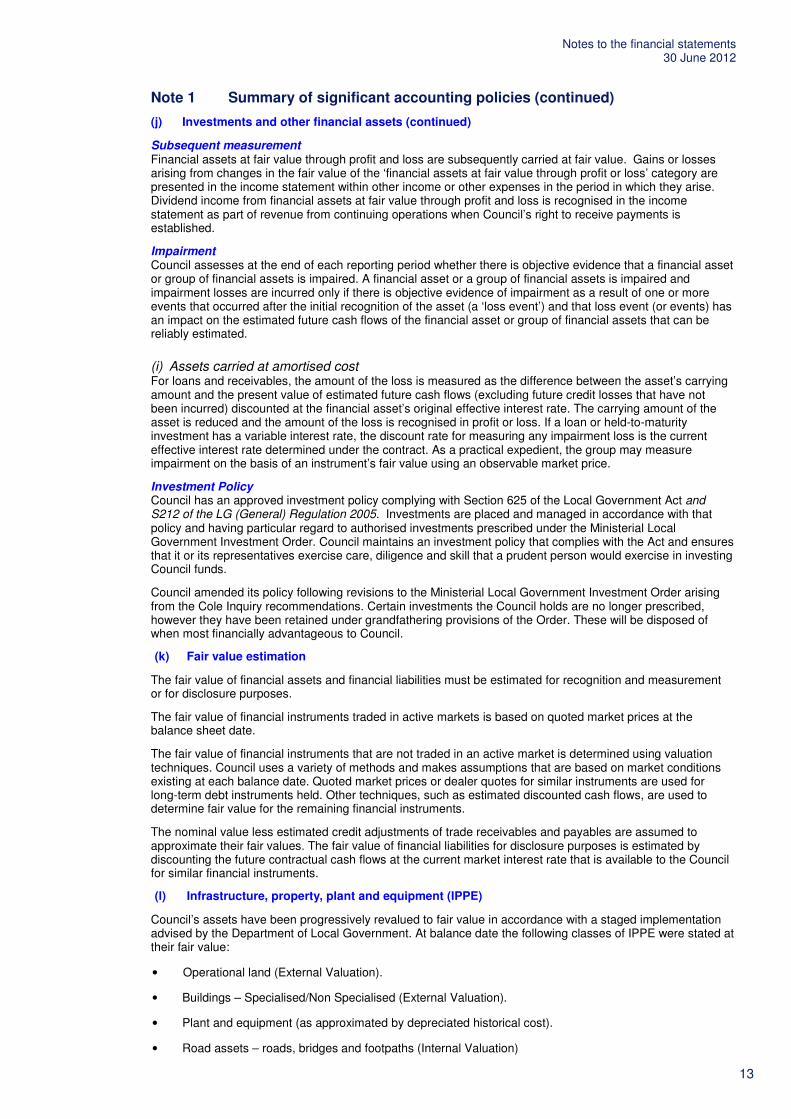
Subsequent measurement Financial assets at fair value through profit and loss are subsequently carried at fair value. Gains or losses
arising from changes in the fair value of the ‘financial assets at fair value through profit or loss’ category are presented in the income statement within other income or other expenses in the period in which they arise. Dividend income from financial assets at fair value through profit and loss is recognised in the income statement as part of revenue from continuing operations when Council’s right to receive payments is established.
Impairment AASB139(58),(67),(68), (69),(70) AASB7(21),(B5)(f) (Revised)
Council assesses at the end of each reporting period whether there is objective evidence that a financial asset or group of financial assets is impaired. A financial asset or a group of financial assets is impaired and impairment losses are incurred only if there is objective evidence of impairment as a result of one or more events that occurred after the initial recognition of the asset (a ‘loss event’) and that loss event (or events) has an impact on the estimated future cash flows of the financial asset or group of financial assets that can be reliably estimated.
(i) Assets carried at amortised cost For loans and receivables, the amount of the loss is measured as the difference between the asset’s carrying
amount and the present value of estimated future cash flows (excluding future credit losses that have not been incurred) discounted at the financial asset’s original effective interest rate. The carrying amount of the asset is reduced and the amount of the loss is recognised in profit or loss. If a loan or held-to-maturity investment has a variable interest rate, the discount rate for measuring any impairment loss is the current effective interest rate determined under the contract. As a practical expedient, the group may measure impairment on the basis of an instrument’s fair value using an observable market price.
DLG Investment Policy Council has an approved investment policy complying with Section 625 of the Local Government Act and
S212 of the LG (General) Regulation 2005. Investments are placed and managed in accordance with that policy and having particular regard to authorised investments prescribed under the Ministerial Local Government Investment Order. Council maintains an investment policy that complies with the Act and ensures that it or its representatives exercise care, diligence and skill that a prudent person would exercise in investing Council funds.
Council amended its policy following revisions to the Ministerial Local Government Investment Order arising from the Cole Inquiry recommendations. Certain investments the Council holds are no longer prescribed, however they have been retained under grandfathering provisions of the Order. These will be disposed of when most financially advantageous to Council.
AASB101(110) (k) Fair value estimation
The fair value of financial assets and financial liabilities must be estimated for recognition and measurement or for disclosure purposes.
AASB132(92) The fair value of financial instruments traded in active markets is based on quoted market prices at the balance sheet date.
The fair value of financial instruments that are not traded in an active market is determined using valuation techniques. Council uses a variety of methods and makes assumptions that are based on market conditions existing at each balance date. Quoted market prices or dealer quotes for similar instruments are used for long-term debt instruments held. Other techniques, such as estimated discounted cash flows, are used to determine fair value for the remaining financial instruments.
The nominal value less estimated credit adjustments of trade receivables and payables are assumed to approximate their fair values. The fair value of financial liabilities for disclosure purposes is estimated by discounting the future contractual cash flows at the current market interest rate that is available to the Council for similar financial instruments.
AASB101(110) (l) Infrastructure, property, plant and equipment (IPPE)
Council’s assets have been progressively revalued to fair value in accordance with a staged implementation advised by the Department of Local Government. At balance date the following classes of IPPE were stated at their fair value:
• Operational land (External Valuation).
• Buildings – Specialised/Non Specialised (External Valuation).
• Plant and equipment (as approximated by depreciated historical cost).
• Road assets – roads, bridges and footpaths (Internal Valuation)

Notes to the financial statements 30 June 2012
14
Note 1 Summary of significant accounting policies (continued) (l) Infrastructure, property, plant and equipment (IPPE) (continued)
• Drainage assets – (Internal Valuation)
• Bulk earthworks - (Internal Valuation)
AASB101(110) • Community land – (Internal Valuation)
• Land Improvements – (Internal Valuation)
• Other structures – (Internal Valuation)
• Other assets (as approximated by depreciated historical cost) Council assesses at each reporting date whether there is any indication that a revalued asset’s carrying
amount may differ materially from that which would be determined if the asset were revalued at the reporting date. If any such indication exists, Council determines the asset’s fair value and revalues the asset to that amount. Full revaluations are undertaken for all assets on a 5 year cycle.
Increases in the carrying amounts arising on revaluation are credited to the asset revaluation reserve. To the extent that the increase reverses a decrease previously recognised in profit or loss, the increase is first recognised in profit or loss. Decreases that reverse previous increases of the same asset are first charged against revaluation reserves directly in equity to the extent of the remaining reserve attributable to the asset; all other decreases are charged to the Income statement.
AASB116(12) Subsequent costs are included in the asset’s carrying amount or recognised as a separate asset, as appropriate, only when it is probable that future economic benefits associated with the item will flow to Council and the cost of the item can be measured reliably. All other repairs and maintenance are charged to the income statement during the financial period in which they are incurred.
AASB116(50),(73)(b) Land is not depreciated. Depreciation on other assets is calculated using the straight line method to allocate their cost, net of their residual values, over their estimated useful lives, as follows:
AASB116(73)(c) Office equipment and furniture 4 - 10 years Drainage - channels 30 years Vehicles,plant & equipment 7 - 8 years - pits and pipe 100 years Library resources 7 years Kerb and gutter 80 years Recycling bins 10 - 25 years Footpaths 40 - 70 years Buildings 20 - 80 years Sealed road-surface 15 years Intangible assets 10 years -pavement 110 years Park furniture and equipment 5 years Road structures 80 - 90 years Street furniture 20 - 50 years Cycleways 60 years Bulk earthworks Infinite Culverts 60 years Foreshore improvement 30 years Bridges – Concrete 120 years Open space car park 20 years
AASB116(51) The assets’ residual values and useful lives are reviewed, and adjusted if appropriate, at each balance sheet
date.
AASB136(59) An asset’s carrying amount is written down immediately to its recoverable amount if the asset’s carrying amount is greater than its estimated recoverable amount.
Gains and losses on disposals are determined by comparing proceeds with carrying amount. These are included in the income statement.
Land, other than land under roads, is classified as either operational or community in accordance with Part 2 of Chapter 6 of the Local Government Act (1993). This classification is made in Note 9(a).
AASB101(110) (m) Land under roads
Council has elected not to recognise land under roads acquired before 1 July 2008 in accordance with AASB 1051. Any land under roads that was recognised before 1 July 2008 was derecognised at 1 July 2008 against the opening balance of retained earnings.
AASB116(68),(71) AASB116(41)
Land under roads acquired after 1 July 2008 is recognised in accordance with AASB 116 – Property, Plant and Equipment.
Land under roads is land under roadways and road reserves including land under footpaths, nature strips and median strips.
Notes to the financial statements 30 June 2012
15
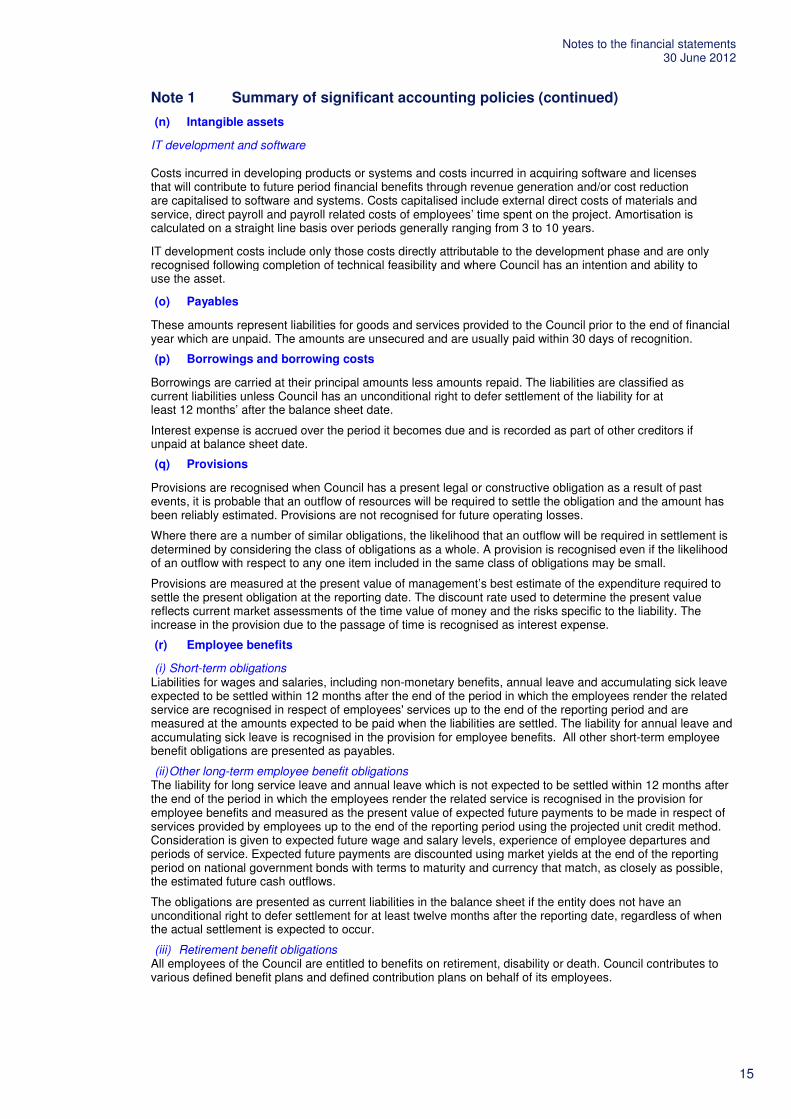
Note 1 Summary of significant accounting policies (continued) (n) Intangible assets
AASB140(75)(a), (75)(d)
IT development and software
Costs incurred in developing products or systems and costs incurred in acquiring software and licenses that will contribute to future period financial benefits through revenue generation and/or cost reduction are capitalised to software and systems. Costs capitalised include external direct costs of materials and service, direct payroll and payroll related costs of employees’ time spent on the project. Amortisation is calculated on a straight line basis over periods generally ranging from 3 to 10 years.
AASB108(28)(c) AASB140(8)(e) AASB2008-5(68)
IT development costs include only those costs directly attributable to the development phase and are only recognised following completion of technical feasibility and where Council has an intention and ability to use the asset.
AASB101(110) (o) Payables
AASB132(60)(a),(60)(b) These amounts represent liabilities for goods and services provided to the Council prior to the end of financial year which are unpaid. The amounts are unsecured and are usually paid within 30 days of recognition.
AASB101(110) AASB7(21)
(p) Borrowings and borrowing costs
AASB139(43),(47) (Revised)
Borrowings are carried at their principal amounts less amounts repaid. The liabilities are classified as current liabilities unless Council has an unconditional right to defer settlement of the liability for at least 12 months’ after the balance sheet date.
AASB139(39),(41) Interest expense is accrued over the period it becomes due and is recorded as part of other creditors if unpaid at balance sheet date.
(q) Provisions
AASB137(14),(24), (63)
Provisions are recognised when Council has a present legal or constructive obligation as a result of past events, it is probable that an outflow of resources will be required to settle the obligation and the amount has been reliably estimated. Provisions are not recognised for future operating losses.
Where there are a number of similar obligations, the likelihood that an outflow will be required in settlement is determined by considering the class of obligations as a whole. A provision is recognised even if the likelihood of an outflow with respect to any one item included in the same class of obligations may be small.
Provisions are measured at the present value of management’s best estimate of the expenditure required to settle the present obligation at the reporting date. The discount rate used to determine the present value reflects current market assessments of the time value of money and the risks specific to the liability. The increase in the provision due to the passage of time is recognised as interest expense.
(r) Employee benefits
(i) Short-term obligations Liabilities for wages and salaries, including non-monetary benefits, annual leave and accumulating sick leave
expected to be settled within 12 months after the end of the period in which the employees render the related service are recognised in respect of employees' services up to the end of the reporting period and are measured at the amounts expected to be paid when the liabilities are settled. The liability for annual leave and accumulating sick leave is recognised in the provision for employee benefits. All other short-term employee benefit obligations are presented as payables.
(ii) Other long-term employee benefit obligations The liability for long service leave and annual leave which is not expected to be settled within 12 months after
the end of the period in which the employees render the related service is recognised in the provision for employee benefits and measured as the present value of expected future payments to be made in respect of services provided by employees up to the end of the reporting period using the projected unit credit method. Consideration is given to expected future wage and salary levels, experience of employee departures and periods of service. Expected future payments are discounted using market yields at the end of the reporting period on national government bonds with terms to maturity and currency that match, as closely as possible, the estimated future cash outflows.
The obligations are presented as current liabilities in the balance sheet if the entity does not have an unconditional right to defer settlement for at least twelve months after the reporting date, regardless of when the actual settlement is expected to occur.
(iii) Retirement benefit obligations All employees of the Council are entitled to benefits on retirement, disability or death. Council contributes to
various defined benefit plans and defined contribution plans on behalf of its employees. AASB137(36),(45), (47),(60)

Notes to the financial statements 30 June 2012
16
Note 1 Summary of significant accounting policies (continued) (r) Employee benefits (continued)
AASB119(54),(64) A liability or asset in respect of defined benefit superannuation plans would ordinarily be recognised in the balance sheet, and measured as the present value of the defined benefit obligation at the reporting date plus unrecognised actuarial gains (less unrecognised actuarial losses) less the fair value of the superannuation fund’s assets at that date and any unrecognised past service cost. The present value of the defined benefit obligation is based on expected future payments which arise from membership of the fund to the reporting date, calculated annually by independent actuaries using the projected unit credit method. Consideration is given to expected future wage and salary levels, experience of employee departures and periods of service. However, when this information is not reliably available, Council accounts for its obligations to defined benefit plans on the same basis as its obligations to defined contribution plans (see below).
The Local Government Superannuation Scheme has advised member councils that, as a result of the global financial crisis, it has a significant deficiency of assets over liabilities. As a result, they have asked for significant increases in contributions to recover that deficiency. Council’s share of that deficiency cannot be accurately calculated as the Scheme is a mutual arrangement where assets and liabilities are pooled together for all member councils. For this reason, no liability for the deficiency has been recognised in Council’s accounts. Council has, however, disclosed a contingent liability in note 18 to reflect the possible obligation that may arise should the Scheme require immediate payment to correct the deficiency.
AASB119(44) Contributions to defined contribution plans are recognised as an expense as they become payable. Prepaid contributions are recognised as an asset to the extent that a cash refund or a reduction in the future payments is available.
(s) Allocation between current and non-current assets and liabilities
In the determination of whether an asset or liability is current or non-current, consideration is given to the time when each asset or liability is expected to be settled. The asset or liability is classified as current if it is expected to be settled within the ensuring 12 months, being the Council’s operational cycle. In the case of liabilities where Council does not have the unconditional right to defer settlement beyond 12 months, such as vested long service leave, the liability is classified as current even if not expected to be settled within the next 12 months.
(t) Rounding of amounts
Unless otherwise indicated, amounts in the financial statements have been rounded off to the nearest thousand dollars.
(u) New accounting standards and interpretations
Certain new accounting standards and interpretations have been published that are not mandatory for 30 June 2012 reporting periods. Council's assessment of the impact of these new standards and interpretations is set out below.
(i) AASB 9 Financial Instruments, AASB 2009 11 Amendments to Australian Accounting Standards arising from AASB 9 and AASB 2010-7 Amendments to Australian Accounting Standards arising from AASB 9 (December 2010) (effective from 1 January 2013*)
AASB 9 Financial Instruments addresses the classification, measurement and derecognition of financial
assets and financial liabilities. The standard is not applicable until 1 January 2013* but is available for early adoption. When adopted, the standard will affect in particular Council’s accounting for its available-for-sale financial assets, since AASB 9 only permits the recognition of fair value gains and losses in other comprehensive income if they relate to equity investments that are not held for trading. Fair value gains and losses on available-for-sale debt investments, for example, will therefore have to be recognised directly in profit or loss.
There will be no impact on Council’s accounting for financial liabilities, as the new requirements only affect the accounting for financial liabilities that are designated at fair value through profit or loss and Council does not have any such liabilities. The derecognition rules have been transferred from AASB 139 Financial Instruments: Recognition and Measurement and have not been changed.
* In December 2011, the IASB delayed the application date of IFRS 9 to 1 January 2015. The AASB is expected to make an equivalent amendment to AASB 9 shortly.
(ii) AASB 10 Consolidated Financial Statements, AASB 11 Joint Arrangements, AASB 12 Disclosure of Interests in Other Entities, revised AASB 127 Separate Financial Statements and AASB 128 Investments in Associates and Joint Ventures and AASB 2011-7 Amendments to Australian Accounting Standards arising from the Consolidation and Joint Arrangements Standards (effective 1 January 2013)
In August 2011, the AASB issued a suite of five new and amended standards which address the accounting
for joint arrangements, consolidated financial statements and associated disclosures.

Notes to the financial statements 30 June 2012
17
Note 1 Summary of significant accounting policies (continued) (u) New accounting standards and interpretations (continued) AASB 10 replaces all of the guidance on control and consolidation in AASB 127 Consolidated and Separate
Financial Statements, and Interpretation 12 Consolidation – Special Purpose Entities. The core principle that a consolidated entity presents a parent and its subsidiaries as if they are a single economic entity remains unchanged, as do the mechanics of consolidation. However, the standard introduces a single definition of control that applies to all entities. It focuses on the need to have both power and rights or exposure to variable returns. Power is the current ability to direct the activities that significantly influence returns. Returns must vary and can be positive, negative or both. Control exists when the investor can use its power to affect the amount of its returns. There is also new guidance on participating and protective rights and on agent/principal relationships. Council does not expect the new standard to have a significant impact on its composition.
AASB 11 introduces a principles based approach to accounting for joint arrangements. The focus is no longer on the legal structure of joint arrangements, but rather on how rights and obligations are shared by the parties to the joint arrangement. Based on the assessment of rights and obligations, a joint arrangement will be classified as either a joint operation or a joint venture. Joint ventures are accounted for using the equity method, and the choice to proportionately consolidate will no longer be permitted. Parties to a joint operation will account their share of revenues, expenses, assets and liabilities in much the same way as under the previous standard. AASB 11 also provides guidance for parties that participate in joint arrangements but do not share joint control.
Council's investment in the joint venture partnership will be classified as a joint venture under the new rules. As Council already applies the equity method in accounting for this investment, AASB 11 will not have any impact on the amounts recognised in its financial statements.
AASB 12 sets out the required disclosures for entities reporting under the two new standards, AASB 10 and AASB 11, and replaces the disclosure requirements currently found in AASB 127 and AASB 128. Application of this standard by Council will not affect any of the amounts recognised in the financial statements, but will impact the type of information disclosed in relation to Council's investments.
Amendments to AASB 128 provide clarification that an entity continues to apply the equity method and does not remeasure its retained interest as part of ownership changes where a joint venture becomes an associate, and vice versa. The amendments also introduce a “partial disposal” concept. Council is still assessing the impact of these amendments.
Council does not expect to adopt the new standards before their operative date. They would therefore be first applied in the financial statements for the annual reporting period ending 30 June 2014.
(iii) AASB 13 Fair Value Measurement and AASB 2011-8 Amendments to Australian Accounting Standards arising from AASB 13 (effective 1 January 2013)
AASB 13 was released in September 2011. It explains how to measure fair value and aims to enhance fair
value disclosures. Council has yet to determine which, if any, of its current measurement techniques will have to change as a result of the new guidance. It is therefore not possible to state the impact, if any, of the new rules on any of the amounts recognised in the financial statements. However, application of the new standard will impact the type of information disclosed in the notes to the financial statements. Council does not intend to adopt the new standard before its operative date, which means that it would be first applied in the annual reporting period ending 30 June 2014.
(iv) Revised AASB 119 Employee Benefits, AASB 2011-10 Amendments to Australian Accounting Standards arising from AASB 119 (September 2011) and AASB 2011-11 Amendments to AASB 119 (September 2011) arising from Reduced Disclosure Requirements (effective 1 January 2013)
In September 2011, the AASB released a revised standard on accounting for employee benefits. It requires
the recognition of all remeasurements of defined benefit liabilities/assets immediately in other comprehensive income (removal of the so-called 'corridor' method) and the calculation of a net interest expense or income by applying the discount rate to the net defined benefit liability or asset. This replaces the expected return on plan assets that is currently included in profit or loss. The standard also introduces a number of additional disclosures for defined benefit liabilities/assets and could affect the timing of the recognition of termination benefits. The amendments will have to be implemented retrospectively. Council does not recognise defined benefit assets and liabilities for the reasons set out in note 1 (r)(iii) and so these changes will not have an impact on its reported results.
There are no other standards that are not yet effective and that are expected to have a material impact on the entity in the current or future reporting periods and on foreseeable future transactions.

Notes to the financial statements 30 June 2012
18
Note 1 Summary of significant accounting policies (continued) (v) Crown Reserves Crown Reserves under Council’s care and control are recognised as assets of the Council. While ownership of
the reserves remains with the Crown, Council retains operational control of the reserves and is responsible for their maintenance and use in accordance with the specific purposes to which the reserves are dedicated.
Improvements on Crown Reserves are also recorded as assets, while maintenance costs incurred by Council and revenues relating the reserves are recognised within Council’s Income Statement.
Representations from both State and Local Government are being sought to develop a consistent accounting treatment for Crown Reserves across both tiers of government.
(w) Goods and Services Tax (GST) Revenues, expenses and assets are recognised net of the amount of associated GST, unless the GST
incurred is not recoverable from the taxation authority. In this case it is recognised as part of the cost of acquisition of the asset or as part of the expense.
Receivables and payables are stated inclusive of the amount of GST receivable or payable. The net amount of GST recoverable from, or payable to, the taxation authority is included with other receivables or payables in the balance sheet.
Cash flows are presented on a gross basis. The GST components of cash flows arising from investing or financing activities which are recoverable from, or payable to the taxation authority, are presented as operating cash flows.

Notes to the financial statements 30 June 2012
19
Note 2(a) Functions or activities Income, expenses and assets have been directly attributed to the following functions or activities. Details of those functions or activities are
provided in Note 2(b).
Income from continuing operations
Expenses from continuing operations
Operating results from continuing operations
Grants included in income from
continuing operations
Total assets held (current and non-
current) Original
budget 2012 $’000
Actual 2012 $’000
Actual 2011 $’000
Original budget
2012 $’000
Actual 2012 $’000
Actual 2011 $’000
Original budget
2012 $’000
Actual 2012 $’000
Actual 2011 $’000
Actual 2012 $’000
Actual 2011 $’000
Actual 2012 $’000
Actual 2011 $’000
Functions/Activities
City Operations 18,391 22,026 18,407 33,031 36,811 31,947 (14,640) (14,785) (13,540) 978 1,801 18,410 21,141 City Planning and
Development 4,087 4,165 4,657 6,470 6,930 6,094 (2,383) (2,765) (1,437) 701 1,379 889 1,743 Corporate and
Community Services 1,391 1,448 1,407 12,465 12,863 12,992 (11,074) (11,415)
(11,585) 629 624 10,960 8,479 Governance - - - 317 295 758 (317) (295) (758) - - 252 243 General Manager 10 114 30 2,621 2,882 1,845 (2,611) (2,768) (1,815) - - 220 535 Infrastructure and
unallocated corporate costs 289 282 275 19,632 19,524 18,280 (19,343) (19,242) (18,005) 282 275 825,900 830,152
Total functions & activities 24,168 28,035 24,776 74,536 79,305 71,916 (50,368) (51,270) (47,140) 2,590 4,079 856,631 862,293
Shares of gains or (losses) in joint ventures using the equity method - 468 445 - - - - 468 445 - - 1,494 1,026
General purpose revenue (1) 44,093 46,486 43,790 572 420 319 43,521 46,066 43,471 3,916 2,767 7,612 9,136
Capital purpose revenue 6,699 4,108 6,763 - 1,822 - 6,699 2,286 6,763 1,114 2,537 - -
Net operating result for the year 74,960 79,097 75,774 75,108 81,547 72,235 (148) (2,450) 3,539 7,620 9,383 865,737 872,455
Note: (1) Rates and annual charges, interest and investment revenue.

Notes to the financial statements 30 June 2012
20
Note 2(b) Components of functions or activities
The activities relating to the Council’s functions reported in Note 2(a) are as follows:
City Operations Construction and maintenance of: • Community buildings • Playing fields and playgrounds • Parks and gardens • Beach facilities • Town centres • Road and bridges • Drainage • Footpaths Services including: • Parking and regulations • Tree services • Environmental protection • Waste services • Public health inspections • Traffic management and road safety • Asset design and inspection • Supply and fleet management City Planning and Development • Strategic asset management • Urban and environmental strategy • Town centres management • Building certification and compliance • Development assessment
Corporate and Community Services • Document management • Financial and administrative management • Information technology and information services • Youth services • Governance • Community relations • Recreation and cultural services • Library and information services • Community and customer service • Age and disability services • Multicultural services General Manager’s Department • Corporate leadership • Human resource management • City media and events Governance This unit is focused on supporting the Executive of Council, the functioning of the office of the Mayor,
operational support for councillors and the performance of their civic duties and corporate governance issues.
Infrastructure and unallocated corporate costs These costs include loan servicing, depreciation expense of infrastructure assets and contributions to
government departments including fire and rescue and state emergency services.
General purpose revenue General purpose revenue includes rates levied on residential, business, and farmland properties, general
purpose grants and interest on investments.
Capital purpose revenue Capital purpose revenue includes grants received for capital expenditure purposes and contributions from
developers under section 94 of the Environmental Planning and Assessment Act (1979).

Notes to the financial statements 30 June 2012
21
Note 3 Income from continuing operations
Actual 2012 $’000
Actual 2011 $’000
(a) Rates and annual charges Ordinary rates Residential 29,406 28,445 Business 4,541 4,405 Farmland 6 6 Total ordinary rates 33,953 32,856
Special rates Local Area Rates 434 426 Community Safety Levy 343 333 Stormwater Levy 798 798 Infrastructure Levy 1,375 1,328 Community Building Levy 1,105 1,074 Total special rates 4,055 3,959 Annual charges (pursuant to s.496, s.501 & s.502) Domestic waste management services 12,749 11,974 Total annual charges 12,749 11,974 Total rates and annual charges 50,757 48,789 Council has used 1/7/2009 valuations provided by the NSW Valuer General in calculating its rates.
(b) User charges and fees User charges (pursuant to s.502) Non-Rateable Waste Management 216 157 Non-Domestic Waste Management 636 624 Total user charges 852 781
Fees Regulatory and statutory fees Building Inspections 126 164 Building Consents and Construction Certificate 84 119 Rating Certificate Fees 135 116 Development & Planning Consent Fees 794 707 Zoning Certificate Fees (section 149) 237 188 Health Inspection & Approvals Fees 282 191 Others 21 41 Total regulatory and statutory fees 1,679 1,526 Discretionary fees Meals on Wheels Fees 195 208 Restoration & Road Opening Fee 5,067 1,743 Environmental Enforcement Fees 230 255 Engineering Inspections & Other Fees 77 89 Street Furniture Advertising Fee 63 65 Permits & Inspection Fees 187 262 Library Fees & Charges 75 85 Others 272 246
Total discretionary fees 6,166 2,953
Total user charges and fees 8,697 5,260

Notes to the financial statements 30 June 2012
22
Note 3 Income from continuing operations (continued)
Actual 2012 $’000
Actual 2011 $’000
(c) Interest and investment revenue
Interest on deposits and investments 3,192 2,689
Interest on overdue rates & charges 209 155 Fair value movements in investments 1,030 1,150
Total interest and investment revenue (losses)(1) 4,431 3,994
(d) Other revenues Fines - Car Parking Infringements 1,582 1,277 - Other 108 118 Rental Income - Residential & Commercial Property 1,271 1,169 - Halls & Community Facilities 163 192 - Parks & Sporting Facilities 424 505 Others 1,035 1,000
Total other revenue 4,583 4,261 Note:
(1) Where interest and investment revenue nets to an overall loss, this is carried to the interest and investment losses line on the Income statement.

Notes to the financial statements 30 June 2012
23
Note 3 Income from continuing operations (continued) Operating Capital
Actual 2012 $’000
Actual 2011 $’000
Actual 2012 $’000
Actual 2011 $’000
(e) Grants
General Purpose (Untied) Financial Assistance 2,622 2,042 - - Pensioner’ Rates Subsidies 681 726 - - LGGC Financial Assistance – Local Road 943 727 - - 4,246 3,495 - - Special Purpose Pensioners’ Rate Subsidies (DWM) 280 279 - - RTA Roads & Traffic 383 425 330 111 Library Assistance Grant 289 253 - - Street Lighting Subsidy 282 275 - - Meals on Wheels Subsidy 230 224 - - Roads to Recovery - - 377 398 Drainage - - 20 160 Waterway & Foreshore Improvements - - - (53) Parks - - 208 1,202 Natural Disaster Mitigation Grant - - - - Federal Government Infrastructure Program - - - 1,752 Others 934 729 41 133 2,398 2,185 976 3,703 Total Grants 6,644 5,680 976 3,703 Comprising: - Commonwealth Funding 3,596 3,787 208 1,472 - State Funding 3,016 1,893 768 2,231 - Other Funding 32 - - - 6,644 5,680 976 3,703
(f) Contributions
Developer Contributions: - Open Space - - 1,057 1,941 - Community Facilities - - 124 148 - Stormwater - - 131 94 - Pollution Control - - 113 180 - Traffic Facilities - - 237 244 - Town Centre Improvements - - 124 132 - Local Infrastructure and Facilities - - 108 16 - Other Section 94 Fees - - 74 154 Other Contributions 95 180 6 101 Section 94A Levies - - 472 377 Total Contributions 95 180 2,446 3,387 Total Grants and Contributions 6,739 5,860 3,422 7,090

Notes to the financial statements 30 June 2012
24
Note 3 Income from continuing operations (continued)
Actual 2012 $’000
Actual 2011 $’000
(g) Restrictions relating to grants and contributions Certain grants and contributions are obtained by Council on the condition
they be spent in a specified manner: Grants and contributions recognised in the current period which have not
been spent 6,074 7,824 Less: Grants and contributions recognised in previous reporting periods which
have been spent in the current reporting period 3,486 3,884 Net increase in restricted grants and contributions 2,588 3,940

Notes to the financial statements 30 June 2012
25
Note 4 Expenses from continuing operations
Actual 2012 $’000
Actual 2011 $’000
(a) Employee benefits and on costs
Salaries and wages 21,652 20,489 Travelling 17 29 Employee leave entitlements 4,176 3,607 Superannuation 2,685 2,868 Workers’ Compensation Insurance 1,172 850 FBT 148 162 Training and seminars 323 299 Occupational health & safety 72 21 Others 69 153 Less: Capitalised costs (450) (522) Total employee costs expensed 29,864 27,956
Number of FTE employees 349 351
(b) Borrowing costs Interest on loans 312 378 Amortisation of premium on interest free loans 42 - Less: Capitalised costs - - Total borrowing costs expensed 354 378
(c) Materials and contracts Printing and stationery 660 853 Computer maintenance 860 772 Roads, parks and property maintenance 6,693 3,296 Recycling contract 1,228 1,186 Waste collection and disposal 9,247 7,648 Community safety, vandalism and graffiti program 104 108 Design and planning 116 11 Other contractor and consultancy 3,572 3,167 Remuneration of Auditors(1) 95 47 Legal fees: – Planning and development 27 158 – Other 390 196 Total materials and contracts 22,992 17,442
(1) During the year the following fees were paid or payable for services provided by the Council’s auditor – PricewaterhouseCoopers:
(i) Audit and other assurance services AASB1054(10)(a) Audit and review of financial statements 51 47 Total remuneration for audit and other assurance services 51 47 AASB1054(10)(b),(11) (ii) Taxation services GST advice 10 - Total remuneration for taxation services 10 - AASB1054(10)(b),(11) (iii) Other services Peer review 34 - Total remuneration for other services 34 - Total remuneration of Pricewaterhousecoopers 95 47

Notes to the financial statements 30 June 2012
26
Note 4 Expenses from continuing operations (continued)
Actual 2012 $’000
Actual 2011 $’000
(d) Depreciation, amortisation and
impairment
Plant and equipment 1,231 1,213 Computer & Office equipment 209 171 Intangibles - software 404 448 Furniture and fittings 72 66 Buildings – Non specialised 882 879 – Specialised 3,712 3,711 Depreciable land improvements 1,695 548 Other structures 593 646 Infrastructure: – roads, bridges and footpaths 8,055 7,992 – stormwater drainage 998 994 Other assets: – library books 379 369 Total depreciation, amortisation and impairment 18,230 17,037
(e) Other expenses
Other expenses for the year including the following: Food and beverages 215 231 Advertising 260 177 Bad and doubtful debts (45) 164 Communications 320 385 Mayoral fees 35 34 Councillors’ fees 237 241 Councillors’ (incl. Mayor) expenses 288 315 Donations and subsidies 161 205 Fees and charges 330 272 Property expenses 474 556 Insurance 1,425 1,373 Contributions and levies 1,435 1,442 Street lighting 1,799 1,688 Utilities/rates/charges 868 710 Postage and courier 150 104 Motor vehicle expenses 912 886 Rental contribution and subsidies 63 112 External hire charges 380 36 Others 640 491 Total other expenses from continuing operations 9,947 9,422

Notes to the financial statements 30 June 2012
27
Note 5 Gain or loss from the disposal of assets
Actual 2012 $’000
Actual 2011 $’000
Gain (or loss) on disposal of property Proceeds from disposal - - Less: carrying amount of assets sold - - Gain (or loss) on disposal - - (Loss) or gain on disposal of infrastructure, plant and equipment Proceeds from disposal 991 868 Less: carrying amount of assets sold 1,127 793 (Loss) or gain on disposal (136) 75 (Loss) or gain on disposal of intangible assets Proceeds from disposal - - Less: carrying amount of assets sold 24 - (Loss) or gain on disposal (24) - Gain (or loss) on disposal of financial assets Proceeds from disposal 3,000 10,361 Transfer to cash equivalent 15,350 - Less: carrying value of financial assets 18,350 10,361 Gain (or loss) on disposal - - Net (loss) or gain from disposal of assets (160) 75

Notes to the financial statements 30 June 2012
28
Note 6(a) Cash and cash equivalents
Actual 2012
Actual 2011
$'000 $'000 Cash at bank and on hand 3,769 5,030 Deposits at call 54,892 31,100 58,661 36,130

Notes to the financial statements 30 June 2012
29
Note 6(b) Investments The following financial assets are held as investments:
Actual 2012
Actual 2011
Current $’000
Non-current $’000
Current $’000
Non-current $’000
Financial assets at fair value through Profit and Loss(1) 6,004 5,016
5,947 18,393
Held to maturity investments - - - - Available for sale financial assets(1) - - - - Total 6,004 5,016 5,947 18,393 Financial assets at fair value through
Profit and Loss
At beginning of year 5,947 18,393 4,117 16,445 Revaluation to income statement 57 973 1,150 - Additions 3,000 1000 11,041 1,948 Disposals (3,000) - (10,361) - Transfer:current/ non-current investment 1,000 (1,000) - - Transfer to cash equivalent (1,000) (14,350) - - At end of year 6,004 5,016 5,947 18,393 Comprising of: – Notes (fixed and floating rates) 6,004 5,011 5,947 6,366 – Other - 5 - 5 – Equity linked notes - - - 12,022 6,004 5,016 5,947 18,393
Note: (1) Fair values for all investments in this Category are determined by quoted prices in active markets for
identical investments.
Notes to the financial statements 30 June 2012
30
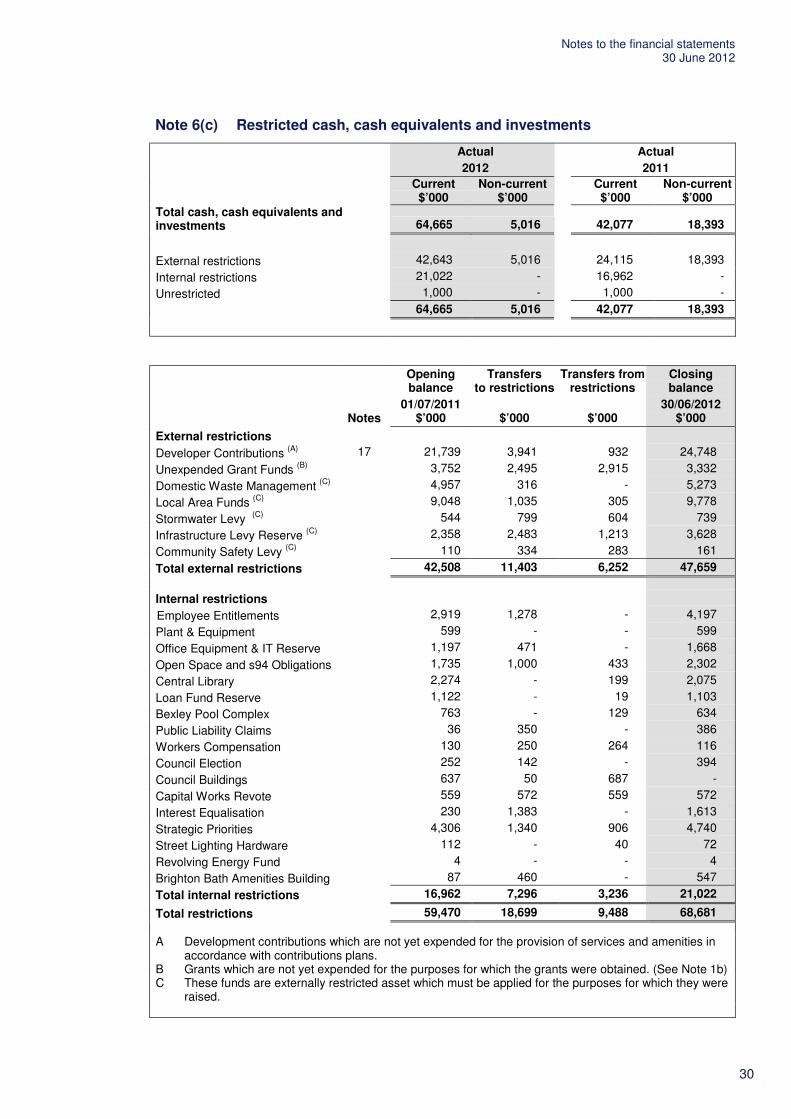
Note 6(c) Restricted cash, cash equivalents and investments
Actual 2012
Actual 2011
Current $’000
Non-current $’000
Current $’000
Non-current $’000
Total cash, cash equivalents and investments 64,665 5,016
42,077 18,393
External restrictions 42,643 5,016 24,115 18,393 Internal restrictions 21,022 - 16,962 - Unrestricted 1,000 - 1,000 - 64,665 5,016 42,077 18,393
Notes
Opening balance
01/07/2011 $’000
Transfers to restrictions
$’000
Transfers from restrictions
$’000
Closing balance
30/06/2012 $’000
External restrictions Developer Contributions (A) 17 21,739 3,941 932 24,748 Unexpended Grant Funds (B) 3,752 2,495 2,915 3,332 Domestic Waste Management (C) 4,957 316 - 5,273 Local Area Funds (C) 9,048 1,035 305 9,778 Stormwater Levy (C) 544 799 604 739 Infrastructure Levy Reserve (C) 2,358 2,483 1,213 3,628 Community Safety Levy (C) 110 334 283 161 Total external restrictions 42,508 11,403 6,252 47,659
Internal restrictions Employee Entitlements 2,919 1,278 - 4,197 Plant & Equipment 599 - - 599 Office Equipment & IT Reserve 1,197 471 - 1,668 Open Space and s94 Obligations 1,735 1,000 433 2,302 Central Library 2,274 - 199 2,075 Loan Fund Reserve 1,122 - 19 1,103 Bexley Pool Complex 763 - 129 634 Public Liability Claims 36 350 - 386 Workers Compensation 130 250 264 116 Council Election 252 142 - 394 Council Buildings 637 50 687 - Capital Works Revote 559 572 559 572 Interest Equalisation 230 1,383 - 1,613 Strategic Priorities 4,306 1,340 906 4,740 Street Lighting Hardware 112 - 40 72 Revolving Energy Fund 4 - - 4 Brighton Bath Amenities Building 87 460 - 547 Total internal restrictions 16,962 7,296 3,236 21,022 Total restrictions 59,470 18,699 9,488 68,681
A Development contributions which are not yet expended for the provision of services and amenities in accordance with contributions plans.
B Grants which are not yet expended for the purposes for which the grants were obtained. (See Note 1b) C These funds are externally restricted asset which must be applied for the purposes for which they were
raised.

Notes to the financial statements 30 June 2012
31
Note 7 Receivables
Actual 2012
Actual 2011
Purpose
Current $’000
Non-current $’000
Current $’000
Non-current $’000
Rates and annual charges - Levies 2,974 - 2,818 - - Interest 426 - 384 - Interest on investment 569 - 439 - User charges and fees 4 - 8 - Government grants and subsidies 367 - 1,700 - GST refund from ATO 443 - 280 - Sundry debtors 1,260 445 1,894 678 Total 6,043 445 7,523 678 Less: Provision for doubtful debts: – Rates and annual charges 46 - 42 - – Interest and extra charges 40 - 35 - – User charges and fees 3 - 3 - – Other doubtful debts 141 - 195 - 230 - 275 - 5,813 445 7,248 678
Restricted receivables
Externally restricted receivables Domestic waste receivable 750 - 715 - Stormwater levy receivable 44 - 43 - Local area waste receivable 24 - 35 - Total externally restricted receivables 818 - 793 - Unrestricted receivables 4,995 445 6,455 678 Total receivables 5,813 445 7,248 678

Notes to the financial statements 30 June 2012
32
Note 8 Inventories and other assets
Actual 2012
Actual 2011
Current $’000
Non-current $’000
Current $’000
Non-current $’000
Inventories Stores and materials 50 - 56 - Total inventories 50 - 56 - Inventories not expected to be realised
within the next 12 months - -
- - Other assets Prepayments 663 380 604 443 Total other assets 663 380 604 443 Externally restricted inventories and
other assets
Domestic waste management Stores and materials - - - - Prepayments - - - - Total domestic waste management - - - -

Notes to the financial statements 30 June 2012
33
Note 9(a) Infrastructure, property, plant and equipment At 30 June 2011 Movements during year At 30 June 2012
By asset type
Cost/Deemed cost $’000
Fair value $’000
Accumulated Depreciation
$’000
Written Down Value $’000
Transfers/Adjust-ments $’000
Additions $’000
WDV of Disposal
$’000
Depreciation Expenses
$’000
Accumulated Depreciation Adjustment
(Revaluation) $’000
Revaluation Increment/
(Decrement) $’000
Cost/Deemed cost $’000
Fair value $’000
Accumulated Depreciation
$’000
Written Down Value $’000
Capital Work in Progress 12,700 - - 12,700 (5,557) 5,828 - - - - 12,971 - - 12,971 Plant and Equipment - 9,781 (4,608) 5,173 153 1,833 (906) (1,231) - - - 9,502 (4,479) 5,023 Computer & Office Equipment - 3,035 (2,250) 785 11 188 (1) (209) - - - 1,358 (583) 775 Furniture and Fittings - 1,598 (1,139) 459 - - - (72) - - - 1,598 (1,211) 387 Land: – Operational Land - 126,180 - 126,180 - 430 (220) - - - - 126,389 - 126,389 – Community Land - 101,469 - 101,469 - - - - - (609) - 100,860 - 100,860 Buildings – Non specialised - 27,755 (13,698) 14,057 - - - (882) - - - 27,755 (14,580) 13,175 – Specialised - 123,231 (66,288) 56,943 398 - - (3,712) - - - 123,630 (69,999) 53,631 Depreciable Land Improvements - 74,474 (10,847) 63,627 (15,172) - - (1,695) - (3,818) - 52,290 (9,348) 42,942 Structure (non-buildings) - - - - 13,909 - - (593) - - - 16,338 (3,024) 13,314 Infrastructure: – Roads, Bridges, Footpaths - 443,560 (201,158) 242,402 4,948 - - (8,055) - - - 448,704 (209,412) 239,292
– Bulk Earthworks (non-depreciable) - 124,711 - 124,711 - - -
- - - - 124,711 - 124,711
– Stormwater Drainage - 90,923 (40,698) 50,225 948 - - (998) - - - 91,871 (41,695) 50,176 Other assets: – Library Books - 3,045 (1,800) 1,245 - 364 - (379) - - - 3,409 (2,179) 1,230 12,700 1,129,762 (342,486) 799,976 (362) 8,643 (1,127) (17,826) - (4,427) 12,971 1,128,415 (356,510) 784,876
Notes: • Exclude investment properties and non-current assets held for sale. • Additions to Buildings and Infrastructure are made up of Asset Renewals ($3,388) and New Assets ($2,861). Renewals are defined as replacements of existing assets with equivalent capacity or
performance as opposed to the acquisition of new assets. • Transfers and assets disposed of are stated in written-down values (cost/deemed costs less accumulated depreciation).

Notes to the financial statements 30 June 2012
34
Note 9(b) Restricted infrastructure, property, plant and equipment
At 30 June 2011
Movements during the year
At 30 June 2012
By asset type
Cost/ Deemed Cost $’000
Fair Value $’000
Accumulated Depreciation
$’000
WDV $’000
Transfers $’000
Additions $’000
Adjustments $’000
WDV of Disposals
$’000
Depreciation Expenses
$’000
Cost/ Deemed Cost $’000
Fair value $’000
Accumulated Depreciation
$’000
Written Down Value $’000
Domestic Waste Management Garbage and Recycling Containers
- 2,092 (1,779) 313 - 228
69 - (28)
- 467 (114) 353
Total Restrictions
- 2,092 (1,779) 313 - 228
69 - (28) - 467 (114) 353

Notes to the financial statements 30 June 2012
35
Note 10(a) Payables, borrowings and provisions
Actual 2012
Actual 2011
Current $’000
Non-current $’000
Current $’000
Non-current $’000
Payables Goods and services 1,772 - 1,228 - Payments received in advance 238 - 788 - Accrued expenses 1,260 - 1,706 - Deposits and retentions 3,727 - 3,620 - Other 121 - 38 - Total payables 7,118 - 7,380 - Current payables not expected to be
settled within the next 12 months 2,430 -
1,692 - Borrowings Loans – secured(1) 954 4,909 964 4,989 Total interest bearing liabilities 954 4,909 964 4,989 Provisions(2) Annual leave 3,375 - 3,263 - Sick leave 1,129 - 1,251 - Long service leave 5,532 922 5,460 780 Gratuities 158 241 146 212 Public liability under excess - 296 148 148 Total provisions 10,194 1,459 10,268 1,140 Current provisions not expected to be
settled within the next 12 months 6,538 -
7,615 - Liabilities relating to restricted assets Domestic waste management 728 - 1,210 - Total 728 - 1,210 - Notes:
(1) Loans are secured over the income of Council. (2) Vested ELE is all carried as a current provision.

Notes to the financial statements 30 June 2012
36
Note 10(b) Description of and movements in provisions
Class of provision
Opening balance
$’000
Increases in provision
$’000 Payments
$’000
Re-measurement
$’000
Closing balance
$’000
Annual leave 3,263 2,068 1,955 - 3,376 Sick leave 1,251 12 135 - 1,128 Long service leave 6,240 1,584 1,370 - 6,454 Gratuities 358 41 - - 399 Public liability under
excess 296 - - - 296 Total 11,408 3,705 3,460 - 11,653

Notes to the financial statements 30 June 2012
37
Note 11 Reconciliation of operating result to net cash movement from operating activities
Notes
Actual 2012 $’000
Actual 2011 ’000
(a) Reconciliation of cash assets
Total cash and cash equivalents 6a 58,661 36,130 Less: Bank overdraft - - Balances as per cash flow statement 58,661 36,130 (b) Reconciliation of net operating result to cash
provided from operating activities
Net operating (loss) profit from income statement (2,450) 3,539 Add: Depreciation and impairment 18,230 17,037 Decrease in receivables 1,669 - Decrease in inventories 6 9 Decrease in other assets 4 - Increase in payables - 1,580 Increase in provisions 243 325 Loss on disposal of assets 160 - Amortisation of premium recongnised on interest free loans 42 - Less: Increase in receivables - 2,021 Increase in other assets - 121 Decrease in payables 262 - Share of profit in joint ventures 468 445 Gain on disposal of assets - 75 Investment revaluation increment 1,030 1,149 Net cash provided from operating activities (from cash
flow statement)
16,144 18,679 (c) Non-cash financing and investing activities
Acquisition of plant and equipment by means of finance
leases
- - S.94 contributions in kind - - Dedications - - - - (d) Financing arrangements
Unrestricted access was available at balance date to the
following:
Bank overdraft facility(1) 350 350 Corporate credit cards 60 60 410 410
Notes: (1) The Bank overdraft facility may be drawn at any time and may be terminated by the bank without notice. (2) Interest rates on overdrafts are variable while the rates for loans are set for the period of the loan.
Notes to the financial statements 30 June 2012
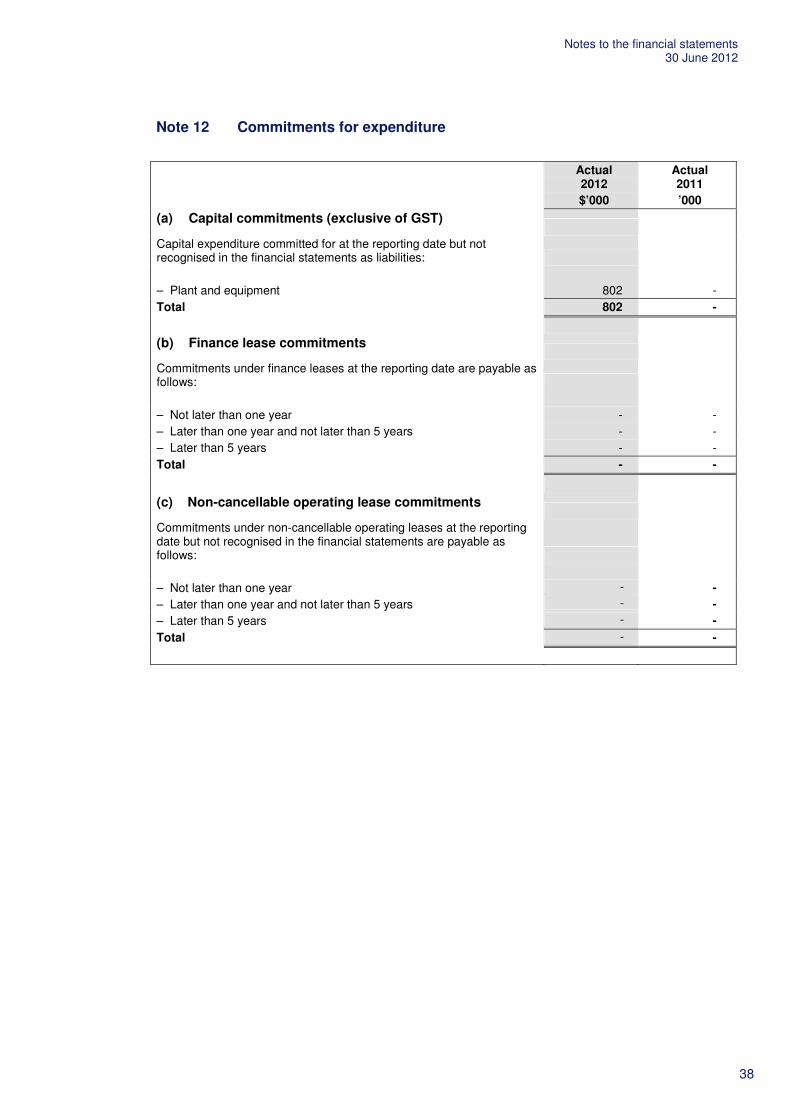
38
Note 12 Commitments for expenditure
Actual 2012 $’000
Actual 2011 ’000
(a) Capital commitments (exclusive of GST)
Capital expenditure committed for at the reporting date but not recognised in the financial statements as liabilities:
– Plant and equipment 802 - Total 802 - (b) Finance lease commitments
Commitments under finance leases at the reporting date are payable as
follows: – Not later than one year - - – Later than one year and not later than 5 years - - – Later than 5 years - - Total - - (c) Non-cancellable operating lease commitments
Commitments under non-cancellable operating leases at the reporting
date but not recognised in the financial statements are payable as follows:
– Not later than one year - - – Later than one year and not later than 5 years - - – Later than 5 years - - Total - -

Notes to the financial statements 30 June 2012
39
Note 13 Statement of performance measures – Consolidated results
2012 Amounts
$’000
Current year
indicators 2011 2010 1. Unrestricted current ratio Current assets less all external restrictions(1) $ 27,731 3.24 3.10 4.31 Current liabilities less specific purpose
liabilities(2), (3), (4) $ 8,568
2. Debt service ratio Debt service cost $ 1,276 0.02 0.02 0.02 Income from continuing operations
excluding capital items and specific purpose grants/contributions
$ 73,181
3. Rate coverage ratio Rates and annual charges $ 50,756 0.64 0.64 0.62 Income from continuing operations $ 79,096 4. Rates and annual charges
outstanding percentage
Rates and annual charges outstanding $ 3,314 6.13%
6.05% 5.63% Rates and annual charges collectible $ 54,082 5. Building and infrastructure renewals
ratio(5)
Asset renewals (building and infrastructure) $ 3,388 0.21 0.17 0.36 Depreciation, amortisation and impairment
(building and infrastructure) $ 15,934
Notes:
(1) Refer to Notes 6-8 inclusive. (2) Refer to Note 10(a). (3) $6.5 million provisions not expected to be settled deducted. (4) $2.4 million payables not expected to be settled deducted. (5) Refer Note 9(a) – Notes.

Notes to the financial statements 30 June 2012
40
Note 14 Investment properties
Actual 2012 $’000
Actual 2011 $’000
At fair value AASB140(76) Opening balance at 1 July 2011 - - AASB140(76)(a) Acquisitions - - AASB140(76)(a) Capitalised subsequent expenditure - - AASB140(76)(c) Classified as held for sale or disposals - - AASB140(76)(d) Net gain (loss) from fair value adjustment - - AASB140(76)(f) Transfer (to) from inventories and owner occupied property - - AASB140(76) Closing balance at 30 June 2012 - -
AASB140(75)(f)
(a) Amounts recognised in profit and loss for investment property AASB140(75)(f)(i) Rental income - - Net gain (loss) from fair value adjustment - - AASB140(75)(f)(ii) Direct operating expenses from property that generated rental income - - AASB140(75)(f)(iii) Direct operating expenses from property that did not generate rental income - - - -
(b) Valuation basis AASB140(75)(a),(d),(e) N/A
AASB140(75)(h) (c) Contractual obligations
N/A
AASB117(56)(c) (d) Leasing arrangements
N/A

Notes to the financial statements 30 June 2012
41
Revised Note 15 Financial risk management
Risk management
Council’s activities expose it to a variety of financial risks including price risk, credit risk, liquidity risk and interest rate risk. The Council's overall risk management program focuses on the unpredictability of financial markets and seeks to minimise potential adverse effects on the financial performance of the Council.
Council does not engage in transactions expressed in foreign currencies and is therefore not subject to foreign currency risk.
Financial risk management is carried out by the Finance Section under policies approved by the Council.
Council held the following financial instruments at balance date:
Carrying value Fair value
2012 $’000
2011 $’000
2012 $’000
2011 $’000
Financial assets Cash and cash equivalents 58,661 36,130 58,661 36,130 Receivables 6,258 7,926 6,258 7,926 Financial assets at fair value through profit
or loss 11,020 24,340
11,020 24,340 Available-for-sale financial assets - - - - Held-to-maturity investments - - - - 75,939 68,396 75,939 68,396
Financial liabilities Payables 7,118 7,380 7,118 7,380 Borrowings 5,863 5,953 5,863 5,657 12,981 13,333 12,981 13,037 Fair value is determined as follows:
• Cash and Cash Equivalents, Receivables, Payables – estimated to be the carrying value which approximates net market value.
• Borrowings, Held-to-Maturity Investments – estimated future cash flows discounted by the current market interest rates applicable to assets and liabilities with similar risk profiles.
• Financial Assets at Fair Value through profit and loss, Available for Sale Financial Assets – based on quoted market prices in active markets for identical investments.

Notes to the financial statements 30 June 2012
42
Note 15 Financial risk management (continued)
(a) Cash and cash equivalents Financial assets at fair value through profit and loss Available-for-sale financial assets Held-to-maturity investments
Council’s objective is to maximise its return on cash and investments whilst maintaining an adequate level of liquidity and preserving capital. The Finance Section manages the cash and investments portfolio with the assistance of independent advisers. Council has an investment policy which complies with the Local Government Act and Minister’s Order. The policy is regularly reviewed by Council and an Investment Report provided to Council monthly setting out the make-up and performance of the portfolio.
The major risk associated with investments is price risk – the risk that the capital value of investments may fluctuate due to changes in market prices, whether these changes are caused by factors specific to individual financial instruments or their issuers or factors affecting similar instruments traded in a market.
Cash and investments are also subject to interest rate risk – the risk that movements in interest rates could affect returns.
Another risk associated with cash and investments is credit risk – the risk that a contracting entity will not complete its obligations under a financial instrument resulting in a financial loss to Council.
Council manages these risks by diversifying its portfolio and only purchasing investments with high credit ratings or capital guarantees. Council also seeks advice from its independent advisers before placing any cash and investments.
2012 $’000
2011 $’000
AASB131(Aus57.2)(b) Impact of a 10%(1) movement in price of investments: −−−− Equity 1,102 2,434 −−−− Income statement 1,102(2) 2,434 (2) Impact of a 1%(1) movement in interest rates on cash and investments: −−−− Equity 587 361 −−−− Income statement 587 361
Notes:
(1) Sensitivity percentages based on management’s expectation of future possible market movements. (Price movements calculated on investments subject to fair value adjustments. Interest rate movements calculated on cash, cash equivalents, managed funds, and FRNs.) Recent market volatility has seen larger market movements for certain types of investments.
(2) Maximum impact.

Notes to the financial statements 30 June 2012
43
Note 15 Financial risk management (continued)
(b) Receivables Council’s major receivables comprise rates and annual charges and user charges and fees. The major risk
associated with these receivables is credit risk – the risk that the debts may not be repaid. Council manages this risk by monitoring outstanding debt and employing stringent debt recovery policies. It also encourages ratepayers to pay rates by the due date through incentives.
Credit risk on rates and annual charges is minimised by the ability of Council to recover these debts as a secured charge over the land – that is, the land can be sold to recover the debt. Council is also able to charge interest on overdue rates and annual charges at higher than market rates which further encourage payment.
There are no significant concentrations of credit risk, whether through exposure to individual customers, specific industry sectors and/or regions.
The level of outstanding receivables is reported to Council monthly and benchmarks are set and monitored for acceptable collection performance.
Council makes suitable provision for doubtful receivables as required and carries out credit checks on most non-rate debtors.
There are no material receivables that have been subject to a re-negotiation of repayment terms.
The profile of the Council’s credit risk at balance date was:
2012
2011
AASB131(Aus57.2)(b) Percentage of Rates and Annual charges: −−−− Current 0.80% 0.64% −−−− Overdue 99.20% 99.36% Percentage of Other Receivables: −−−− Current 80.57% 70.72% −−−− Overdue 19.43% 29.28%

Notes to the financial statements 30 June 2012
44
Note 15 Financial risk management (continued)
(c) Payables Borrowings
Payables and borrowings are both subject to liquidity risk – that is the risk that insufficient funds may be on hand to meet payment obligations as and when they fall due. Council manages this risk by monitoring its cash flow requirements and liquidity levels and maintaining an adequate cash buffer. Payment terms can be extended and overdraft facilities drawn upon in extenuating circumstances.
The contractual undiscounted cash flows of Council’s Payables and Borrowings are set out in the Liquidity Sensitivity Table below:
2012 $’000
Due within 1 year
Due between 1 and 5 years
Due after 5 years
Total Contractual Cash flows
Carrying values
Payables 4,688 2,430 - 7,118 7,118 Borrowings 1,269 4,729 1,210 7,208 5,863 5,957 7,159 1,210 14,326 12,981
2011 $’000
Due within 1 year
Due between 1 and 5 years
Due after 5 years
Total Contractual Cash flows
Carrying values
Payables 5,688 1,692 - 7,380 7,380 Borrowings 1,276 4,690 1,071 7,037 5,953 6,964 6,382 1,071 14,417 13,333
Borrowings are also subject to interest rate risk – the risk that movements in interest rates could adversely affect funding costs. Council manages this risk by borrowing long term and fixing the interest rates. The Finance Section regularly reviews interest rate movements to determine if it would be advantageous to refinance or renegotiate part or all of the loan portfolio.
The following interest rates were applicable to Council’s borrowings at balance date:
30 June 2012 30 June 2011
Weighted average
interest rate %
Balance $’000
Weighted average
interest rate %
Balance $’000
Overdraft - - - - Bank Loans – Fixed 4.33% 5,863 4.98% 5,953 – Variable(1) - - - - 5,863 5,953
Note:
(1) The interest rate risk applicable to Variable Rate Bank Loans is not considered significant.

Notes to the financial statements 30 June 2012
45
Note 16 Material budget variations
Council’s original budget was adopted by the Council on 15 June 2011. The original projections on which the
budget was based have been affected by a number of factors. These include State and Federal Government decisions including new grant programs, changing economic activity, the weather, and by decisions made by the Council. Material variations of more than 10% are explained below:
INCOME STATEMENT Revenues 1. User charges and fees Income was $3.9m (80.64%) above budget mainly because of additional charges received for road
excavation and restoration works. These incomes are difficult to budget because of their user-pay nature.
2. Interest and investment revenue Income was $1.3m above budget because (a) a revaluation of Council’s investment portfolio at 30 June
2012 to fair value led to a capital gain on investment of $1.0m, and (b) interest on investment exceeded budget by $0.3m because of more favourable interest rates.
3. Grants and contributions provided for operating purposes Above budget by $1.5m (28.31%) because the government brought forward one-half of the estimated
2012-13 local government financial assistance grant allocations for payment in the 2011-12 financial year.
4. Grants and contributions provided for capital purposes Under budget by $3.3m because grants received for Roads to Recovery, s94 contributions, parks and
drainage were below target subsequent to lower than expected development works.
5. Net loss from the disposal of assets The loss was under budget by $252k (61.23%) because proceeds from the sale of motor vehicles were
better than budgeted.
6. Net share of interest in joint venture using the equity method This relates to Council’s participation in Metro Pool and UIP (see Note 19). Council’s share may vary
significantly from year to year depending on insurance claim activities. No budget provision was made .
Expenses 1. Materials and contracts Over budget by $4.7m (25.93%). This resulted mainly from additional works not included in the original
budget for road excavation and restoration which were funded from user charges and fees (see 1 under Revenues above). Other contributing factors were the use of more contractors than budgeted for infrastructure maintenance works and higher level of design and planning activities.
CASH FLOW STATEMENT
1. User charges and fees Above budget by $1.2m (14.2%) because of additional income received for road excavation and
restoration works. 2. Materials and contracts Was above budget by $3.3m (15.8%) because of a higher level of infrastructure works than expected.
NOTE 2(a)
1. City Planning and Development Department Net operating deficit was $382k (16.03%) above budget because of grant funded environmental and
research projects that were not provided for in the original budget. 2. General purpose and capital purpose revenue related expenses The combined net variation is not material.
3. Net share of interest in joint venture using the equity method This relates to Council’s participation in Metro Pool and UIP (see Note 19). Council’s share may vary
significantly from year to year depending on insurance claim activities. No budget provision was made.

Notes to the financial statements 30 June 2012
46
Note 17 Statement of developer contributions
(a) Summary of developer contributions
Contributions received during
year Investment returns
during year
Purpose
Opening balance $’000
Cash $’000
Non cash $’000
Interest $’000
Capital gain $’000
Expended during year
$’000
Internal borrowings
during the year $’000
Held as restricted
asset $’000
Projected future contributions
$’000
Projected cost of works
still outstanding
$’000
Projected over/(under)
funding $’000
Cumulative balance of
internal borrowings
(to)/from $’000
Car Parking 799 - - 16 - - - 815 5,245 8,310 (2,250) - Drainage Pollution Control 909 114 - 20 - - - 1,043 1,425 32,374 (29,906) - Community facilities 4,767 124 - 104 383 - - 5,378 5,368 14,640 (3,894) - Open space 10,771 1,057 - 324 647 490 - 12,309 50,972 85,836 (22,555) (4,436) Traffic and Electricity Facilities 106 - - 2 - - - 108 - - 108 - Ramsgate Commercial Centre 65 93 - 2 - - - 160 2,295 10,541 (8,086) - Town Centre Program 437 124 - 6 - - - 567 3,086 11,324 (7,671) 149 Wolli Creek 919 434 - (66) - 362 - 925 16,913 41,348 (23,510) 4,287 Bonar Street Precinct 2,107 15 - 41 - 80 - 2,083 8,248 15,350 (5,019) - Administration (23) 6 - - - - - (17) 6 7 (18) - S94A Levies 877 473 - 22 - - - 1,372 8,090 17,432 (7,970) - S94 under plans 21,734 2,440 - 471 1,030 932 - 24,743 101,648 237,162 (110,771) - S94 not under plans 5 - - - - - - 5 - - 5 - Total contributions 21,739 2,440 - 471 1,030 932 - 24,748 101,648 237,162 (110,766) -

Notes to the financial statements 30 June 2012
47
Note 17 Statement of developer contributions (continued) (b) Contribution under plan
Contributions received during
year
Investment returns during
year
Purpose
Opening balance
$’000 Cash $’000
Non cash $’000
Interest $’000
Capital gain $’000
Expended during year $’000
Internal borrowings during the
year $’000
Held as restricted
asset $’000
Projected future
contributions $’000
Projected cost of works
still outstanding
$’000
Projected over/(under)
funding $’000
Cumulative balance of
internal borrowings
(to)/from $’000
Car Parking West Arncliffe/Turrella Industrial 10 - - - - - - 10 - - 10 - East Arncliffe Industrial Area 36 - - 1 - - - 37 - - 37 - Rockdale-Industrial 1 - - - - - - 1 - - 1 - Rockdale-Business - - - - - - - - 864 3,426 (2,562) - Brighton Le Sands-Business - - - - - - - - - - - - Ramsgate Beach-Business 506 - - 10 - - - 516 - 377 139 - Bexley-Business 41 - - 1 - - - 42 943 985 - - Kingsgrove-Business 8 - - - - - - 8 1980 1,989 (1) - Bexley North 73 - - 1 - - - 74 1458 1,533 (1) - Brighton-New 28 - - 1 - - - 29 - - 29 - Rockdale-New 96 - - 2 - - - 98 - - 98 - Total 799 - - 16 - - - 815 5,245 8,310 (2,250) - Drainage Pollution Control Wolli Creek 101 - - 2 - - - 103 - - 103 - Bardwell Creek 55 - - 1 - - - 56 - - 56 - Bonnie Doon 58 - - 1 - - - 59 - - 59 - Spring Street 75 - - 2 - - - 77 - - 77 - Muddy Creek 162 - - 4 - - - 166 - - 166 - Eve Street 31 - - 1 - - - 32 - - 32 - Scarborough Ponds 23 1 - - - - - 24 - - 24 - Waradiel Creek (6) - - - - - - (6) - - (6) - Bado-berong Creek 5 - - - - - - 5 - - 5 - Goomun Creek 9 - - - - - - 9 - - 9 - Whole of City 396 113 - 9 - - - 518 1,425 32,374 (30,431) - Total 909 114 - 20 - - - 1,043 1,425 32,374 (29,906) -
Community Service
General Community Facilities 2,797 18 - 61 253 - - 3,129 2,541 2,968 2,702 - Libraries 1,803 99 - 40 140 - - 2,082 2,937 11,672 (6,653) - Child Care 167 7 - 3 (10) - - 167 (110) - 57 - Total 4,767 124 - 104 383 - - 5,378 5,368 14,640 (3,894) - Open Space 10,771 1,057 - 324 647 490 - 12,309 50,972 85,836 (22,555) (4,436) Traffic and Electricity
Facilities
Gertrude Street 106 - - 2 - - - 108 - - 108 - Total 106 - - 2 - - - 108 - - 108 -

Notes to the financial statements 30 June 2012
48
Note 17 Statement of developer contributions (continued) (b) Contributions under plans (continued)
Contributions received during
year
Investment returns during year
Purpose
Opening balance
$’000 Cash $’000
Non cash $’000
Interest $’000
Capital gain $’000
Expended during year
$’000
Internal borrowings during the
year $’000
Held as restricted
asset $’000
Projected future
contributions $’000
Projected cost of works
still outstanding
$’000
Projected over/(under)
funding $’000
Cumulative balance of
internal borrowings
(to)/from $’000
Ramsgate Commercial Centre Administration - - - - - - - - - - - - Ramsgate - 78 - 1 - - - 79 2,295 10,541 (8,167) - Sans Souci 65 15 - 1 - - - 81 - - 81 - Total 65 93 - 2 - - - 160 2,295 10,541 (8,086) - Town Centre Program Arncliffe 57 - - 1 - - - 58 93 717 (566) - Bexley 4 - - - - - - 4 25 407 (378) - Bexley North 4 - - - - - - 4 30 881 (847) - Brighton Le Sands 4 - - - - - - 4 10 290 (276) - Kogarah - 1 - - - - - 1 12 447 (434) - Rockdale 3 11 - - - - - 14 337 2,342 (1,991) - Sans Souci 11 2 - - - - - 13 26 642 (603) - Wolli Creek 183 73 - 1 - - - 257 2,135 4,484 (2,092) - City Wide 171 37 - 4 - - - 212 418 1,114 (484) 149 Total 437 124 - 6 - - - 567 3,086 11,324 (7,671) 149 Wolli Creek Flood and Stormwater
Management 342 129 - 50 - 60 - 461 7,286 11,997
(4,250) (2,138) Roadworks, Traffic and Parking 401 237 - (118) - - - 520 7,358 25,037 (17,159) 6,440 Pedestrian/Cycle 120 43 - 9 - - - 172 2,031 4,076 (1,873) (288) Administration 56 25 - (7) - 302 - (228) 238 238 (228) 273 Total 919 434 - (66) - 362 - 925 16,913 41,348 (23,510) 4,287 Administration Whole of city (except Ramsgate) (23) 6 - - - - - (17) 6 7 (18) - Total (23) 6 - - - - - (17) 6 7 (18) - Bonar Street Precinct Administration 90 - - 1 - 80 - 11 42 42 11 - Local infrastructure 2,017 15 - 40 - - - 2,072 8,206 15,308 (5,030) - Total 2,107 15 - 41 - 80 - 2,083 8,248 15,350 (5,019) - Section 94A Levies 877 473 - 22 - - - 1,372 8,090 17,432 (7,970) - Total S94 under Plan 21,734 2,440 - 471 1,030 932 - 24,743 101,648 237,162 (110,771) -

Notes to the financial statements 30 June 2012
49
Note 17 Statement of developer contributions (continued)
(c) Contributions not under plans
Contributions received during
year
Investment returns during
year
Purpose
Opening balance
$’000 Cash $’000
Non cash $’000
Interest $’000
Capital gain $’000
Expended during year $’000
Internal borrowings during the
year $’000
Held as restricted
asset $’000
Projected future
contributions $’000
Projected cost of
works still outstanding
$’000
Projected over/(under)
funding $’000
Cumulative balance of
internal borrowings
(to)/from $’000
Inter-allotment Drainage 5 - - - - - - 5 - - 5 - Total S94 not under Plan 5 - - - - - - 5 - - 5 - Total Contributions 21,739 2,440 - 471 1,030 932 - 24,748 101,648 237,162 (110,766) - -

Notes to the financial statements30 June 2012
50
Note 18 Contingencies Contingent liabilities Council has significant obligations to provide Section 94 infrastructure in new release areas. It is possible
that funds contributed may be less than the cost of this infrastructure requiring Council to borrow or use general revenue to fund the difference. (Refer Note 17.)
The Local Government Superannuation Scheme – Pool B (the Scheme) is a defined benefit plan that has been deemed to be a ‘multi-employer fund’ for purposes of AASB119. Sufficient information under AASB119 is not available to account for the Scheme as a defined benefit plan, because the assets to the Scheme are pooled together for all employers.
The amount of employer contributions to the defined benefit section of the Local Government Superannuation Scheme and recognised as an expense for the year ending 30 June 2012 was $984,591. The last valuation of the Scheme was performed by Mr Martin Stevenson BSc, FIA, FIAA on 16 February 2010 and covers the period ended 30 June 2009. However the position is monitored annually and the Actuary has estimated that as at 30 June 2012 a deficit still exists. Effective from 1 July 2009, employers are required to contribute additional contributions to assist in extinguishing this deficit. The amount of additional contributions included in the total employer contribution advised above is $345,996.
The share of this deficit that can be broadly attributed to this council was estimated to be in the order of $2,459,214 as at 30 June 2012.

Notes to the financial statements 30 June 2012
51
Note 19 Interests in joint ventures and associates Joint venture partnership
AASB131(Aus57.1) (a)-(c)
Council is a member of an insurance group named Metro Pool, which is a joint venture of seven local councils in the Sydney metropolitan area set up to cover public liability and professional indemnity claims against member councils. As at 30 June 2012 Council has a 18.22% interest in the equity of Metro Pool.
Council is also a member of United Independent Pools (UIP), which is an incorporated organisation formed by the members of two Sydney based Local Government risk management Pools, Westpool and Metro Pool. UIP pools the Industrial Special Risk, Commercial Motor Property Damage, Councillors Directors and Officers/ Statutory Liability and Fidelity Guarantee risks of 16 member councils and undertakes various other activities for them including running risk management forums and the bulk purchase of certain other insurances. As at 30 June 2012 Council has a 4.41% interest in the equity of UIP.
Council’s interest in both Metro Pool and UIP have been accounted for in the financial statements using the equity method of accounting and is carried at cost. Information relating to the joint venture is set out below:
Actual 2012
Actual 2011
$'000 $'000 AASB131(Aus57.1)(c) Share of Assets and Liabilities Current assets 3,853 3,140 Non-current assets 26 24 Total Assets 3,879 3,164 Current liabilities 514 561 Non-current liabilities 1,871 1,577 Total Liabilities 2,385 2,138 Net Assets 1,494 1,026 Share of Revenue, Expenses and Operating Results Revenues 1,610 1,196 Expenses 1,142 751 Operating Results 468 445

Notes to the financial statements 30 June 2012
52
Note 20 Revaluation reserves and retained earnings
Notes Actual 2012
Actual 2011
(a) Revaluation reserves Infrastructure, property, plant and equipment revaluation reserve 394,887 399,315 Available-for-sale investments revaluation reserve - - 394,887 399,315
AASB101(97)(c) Movements: AASB116(77)(f) Infrastructure, Property, plant and equipment revaluation
reserve
At beginning of year 399,315 359,698 AASB116(39) Revaluations 9 - 40,880 AASB116(41) Adjustment to correct prior period errors 20(d) (4,427) (1,263) At end of year 394,887 399,315
Available-for-sale investments revaluation reserve At beginning of year - - AASB132(94)(h)(ii) Revaluation – gross - - AASB132(94)(h)(ii) Transfer to net profit – gross - - At end of year - -
(b) Retained earnings Movements in retained earnings were as follows:
At beginning of year 448,399 892,273 Adjustment to correct prior period errors 20(d) 267 (6,749) Changes in accounting policies 20(e) - (440,664) Net operating result for the year (2,450) 3,539 At end of year 446,216 448,399 AASB101(76)(b) (c) Nature and purpose of reserves AASB116(77)(f) The infrastructure, property, plant and equipment revaluation
reserve is used to record increments and decrements on the revaluation of non-current assets.
(d) Correction of errors in previous years Depreciation understated on land improvements(1) - (6,176) 2009 road assets incorrectly held in work-in-progress(1) - (573) 2008 revaluation of building asset (double-counting)(2) - (1,263) Revaluation error of land improvements in 2011 (3,818) - Revaluation error of community land in 2011 (609) - Recognition of premium on interest free loan taken up in 2011 267 - (4,160) (8,012)
Notes: (1) Adjusted to retained earnings (2) Adjusted to asset revaluation reserve (3) Corrections have been made against the current year
balances of IPPE, Retained Earnings and Revaluation Reserves because it was found to be too impracticable to restate the prior year comparatives.
(e) Changes in accounting policies
Community lands were brought to account on 30 June 1995 at replacement costs. On 30 June 2011 Council adopted the NSW Valuer General’s valuation model to represent fair value for the revaluation of community lands. This change in policy resulted in significantly lower land values.
- (440,664)
- (440,664)

Notes to the financial statements30 June 2012
53
Note 21 Intangible assets
Actual Actual 2012 2011
$'000 $'000
Opening net book value(1) 1,954 2,359 Additions – acquisition 447 43 Transfer from infrastructure, property, plant and equipment 362 - Amortisation charge(2) (404) (448) Disposal (24) - Closing net book value 2,335 1,954
At end of year Cost 4,880 5,474 Accumulated amortisation and impairment 2,545 3,520 Net book amount 2,335 1,954
Notes:
(1) Intangible assets include capitalised software development costs.
(2) Amortisation included in depreciation, amortisation and impairment expense in the Income statement.
404 448

54

55

56

57

58

Special Schedules30 June 2012
59
Rockdale City Council
Special schedules for the year ended 2012
Contents
Page Special Schedules (Not Audited)
Special Schedule No. 1 Net cost of services 60 Special Schedule No. 2(a) Statement of long-term debt (all purpose) 62 Special Schedule No. 7 Condition of public works 63 Special Schedule No. 8 Financial projections 64

Special Schedules 30 June 2012
60
Rockdale City Council
Special Schedule No. 1 Net cost of services for the year ended 30 June 2012 $’000
Function or Activity
Expenses from
continuing operations
$’000
Income from continuing operations
(non capital) $’000
Income from continuing operations
(capital) $’000
Net Cost of services
$’000 Governance 1,831 - - (1,831) Administration 28,804 7,551 502 (20,751) Public Order and Safety
Fire service levy, Fire Protection, Emergency Service 1,524 1 - (1,523)
Beach Control 61 10 - (51) Enforcement of Local Govt Regulations 3,298 3,408 - 110 Animal control 201 - - (201) Other 618 - - (618) Total Public Order and Safety 5,702 3,419 - (2,283) Health 591 203 - (388) Environment Environmental Protection 2,382 755 115 (1,512) Solid Waste Management 12,302 13,451 - 1,149 Street Cleaning 390 10 - (380) Drainage 3,487 90 149 (3,248) Public conveniences 134 - 40 (94) Total Environment 18,695 14,306 304 (4,085) Community Services and Education Administration & Education 298 48 - (250) Aged Persons and Disabled 599 461 - (138) Children Services 84 65 7 (12) Other community Services 45 106 - 61 Total Community Services and Education 1,026 680 7 (339) Housing and Community Amenities Street Lighting 1,798 282 - (1,516) Town Planning 1,494 625 - (869) Other Community Amenities 154 342 127 315 Total Housing and Community Amenities 3,446 1,249 127 (2,070) Recreation & Culture Public libraries 3,331 405 99 (2,827) Community Centres and Halls 296 54 - (242) Other Cultural Services 130 134 - 4 Swimming Pools 305 - - (305) Sporting Grounds and Parks 2,855 323 1,265 (1,267) Other Sport & Recreation 4,567 - 2 (4,565) Total Recreation & Culture 11,484 916 1,366 (9,202)

Special Schedules 30 June 2012
61
Net cost of services (continued)
Function or Activity
Expenses from continuing operations
$’000
Income from continuing operations
(non capital) $’000
Income from
continuing operations
(capital) $’000
Net Cost of services
$’000 Transport & Communication Urban Roads-Local 7,643 368 574 (6,701) Urban Roads-Regional 40 102 50 112
Bus Shelters and Servicesl 46 - - (46)
Parking Areas 39 (102) 237 96 Footpath 21 9 128 116 Other Transport & Communication 1,292 122 - (1,170) Total Transport & Communication 9,081 499 989 (7,593) Economic Affairs 887 74 126 (687)
Totals – Functions 81,547 28,897 3,421 (49,229)
General Purpose Revenues(2) - 46,311 - 46,311 Net share of interests in joint ventures and associates using the equity method(1) - 468 - 468
Net operating result for the year(1) 81,547 75,676 3,421 (2,450)
Note:
a. As reported on the Income statement. b. Includes:
i. Rates and annual charges (including ex-gratia but excluding water and sewer) ii. Non-capital general purpose grants iii. Interest on investments

Special Schedules 30 June 2012
62
Rockdale City Council
Special Schedule No. 2(a) Statement of long-term debt (all purpose) for the year ended 30 June 2012
($’000)
Principal outstanding at beginning of year Debt redemption during the
year Principal outstanding at end of year
Classification of debt Current Non-current Total
New loans raised
during the year
From revenue
Sinking funds
Transfers to sinking funds
Interest applicable
for year Current Non-current Total Loans (by source) Commonwealth Government 4 17 21 - 4 - - - 4 13 17 NSW Treasury 50 1,037 1,087 - 50 - - - 50 987 1,037 Other State Government - - - - - - - - - - Public Subscription - - - - - - - - - - Financial Institutions 910 3,935 4,845 1100 910 - - 312 900 4,135 5,035 Other - - - - - - - - - - Total loans 964 4,989 5,953 1,100 964 312 954 5,135 6,089
Other long term debt Ratepayers’ Advances - - - - - - - - - - - Government Advances - - - - - - - - - - - Finance Leases - - - - - - - - - - - Deferred payment - - - - - - - - - - - Total long term debt 964 4,989 5,953 1,100 964 - - 312 954 5,135 6,089
Note: Premiums recognised on initial loan raising and unwinding of those premiums is excluded from this schedule. Total principal outstanding therefore does not balance with ‘Borrowings’ on the Balance Sheet.

Special Schedules 30 June 2012
63
Rockdale City Council Special Schedule No. 7 Condition of public works as at 30 June 2012 $’000
Asset class
Asset category (as determined
by Council)
Depreciation Expense
(%)
Depreciation Expense
$’000
Cost $’000
Valuation $’000
Accumulated Depreciation
and Impairment
$’000
WDV $’000
Asset Condition(4)
Estimated cost to bring
to satisfactory (1)
standard $’000
Required annual
maintenance(2)
$’000
Current annual
maintenance(3)
$’000
Buildings Council owned
buildings 1.3-5.0% 4,594 - 151,385 84,579 66,806 Good/ average 8,414 4,594 2,976
Public Roads Roads, bridges and footpaths
0.8-2.5% 8,055 - 448,704 209,412 239,292 Good/ average 23,342 8,055 2,758
Other Structures Structures not included in buildings
1.2-8.3% 593 - 16,338 3,024 13,314 Excellent/ Good 184 593 45
Drainage Works Stormwater drainage
1.0-3.3% 998 - 91,871 41,695 50,176 Average 3,125 998 614
Total 14,240 - 708,298 338,710 369,588 35,065 14,240 6,393
Notes:
1. Satisfactory refers to estimated cost to bring the asset to a satisfactory condition as deemed by Council. It does not include any planned ‘enhancement(s)’ to the existing asset.
2. Required Annual Maintenance is what should be spent to maintain assets in a satisfactory standard.
3. Current Annual Maintenance is what has been spent in the current year to maintain assets.
4. Asset Condition Assessment (DLG Integrated Planning and Reporting Manual)
Level Condition Description
1 Excellent No work required (normal maintenance).
2 Good Only minor maintenance work required.
3 Average Maintenance work required.

Special Schedules 30 June 2012
64
Rockdale City Council
Special Schedule No. 8 Financial projections as at 30 June 2012 $’000 2012(1)
$’000 2013 $’000
2014 $’000
2015 $’000
2016 $’000
Operating budget Income from continuing operations 78,936 79,217 82,198 84,072 86,612 Expenses from continuing operations 81,386 80,684 82,826 85,771 88,857 Operating result from continuing operations (2,450) (1,467) (628) (1,699) (2,245)
Capital budget New capital works(2) 9,097 12,438 11,155 11,423 11,461 Funded by: – Loans 1,100 2,200 1,100 1,100 1,100 – Asset sales - 950 950 950 950 – Reserves 724 740 389 1,473 1,473 – Grants/Contributions 1,591 3,146 2,899 2,574 2,574 – Recurrent revenue 5,682 5,330 5,745 5,254 5,292 – Other - 72 72 72 72 9,097 12,438 11,155 11,423 11,461
Notes: (1) Actual, from Income Statement. (2) New capital works are major non-recurrent projects.