General enquiries on this form should be made...
36
General enquiries on this form should be made to: Defra, Science Directorate, Management Support and Finance Team, Telephone No. 020 7238 1612 E-mail: [email protected] SID 5 Research Project Final Report SID 5 (2/05) Page 1 of 36
Transcript of General enquiries on this form should be made...

General enquiries on this form should be made to:Defra, Science Directorate, Management Support and Finance Team,Telephone No. 020 7238 1612E-mail: [email protected]
SID 5 Research Project Final Report
SID 5 (2/05) Page 1 of 26
NoteIn line with the Freedom of Information Act 2000, Defra aims to place the results of its completed research projects in the public domain wherever possible. The SID 5 (Research Project Final Report) is designed to capture the information on the results and outputs of Defra-funded research in a format that is easily publishable through the Defra website. A SID 5 must be completed for all projects.
A SID 5A form must be completed where a project is paid on a monthly basis or against quarterly invoices. No SID 5A is required where payments are made at milestone points. When a SID 5A is required, no SID 5 form will be accepted without the accompanying SID 5A.
This form is in Word format and the boxes may be expanded or reduced, as appropriate.
ACCESS TO INFORMATIONThe information collected on this form will be stored electronically and may be sent to any part of Defra, or to individual researchers or organisations outside Defra for the purposes of reviewing the project. Defra may also disclose the information to any outside organisation acting as an agent authorised by Defra to process final research reports on its behalf. Defra intends to publish this form on its website, unless there are strong reasons not to, which fully comply with exemptions under the Environmental Information Regulations or the Freedom of Information Act 2000.Defra may be required to release information, including personal data and commercial information, on request under the Environmental Information Regulations or the Freedom of Information Act 2000. However, Defra will not permit any unwarranted breach of confidentiality or act in contravention of its obligations under the Data Protection Act 1998. Defra or its appointed agents may use the name, address or other details on your form to contact you in connection with occasional customer research aimed at improving the processes through which Defra works with its contractors.
Project identification
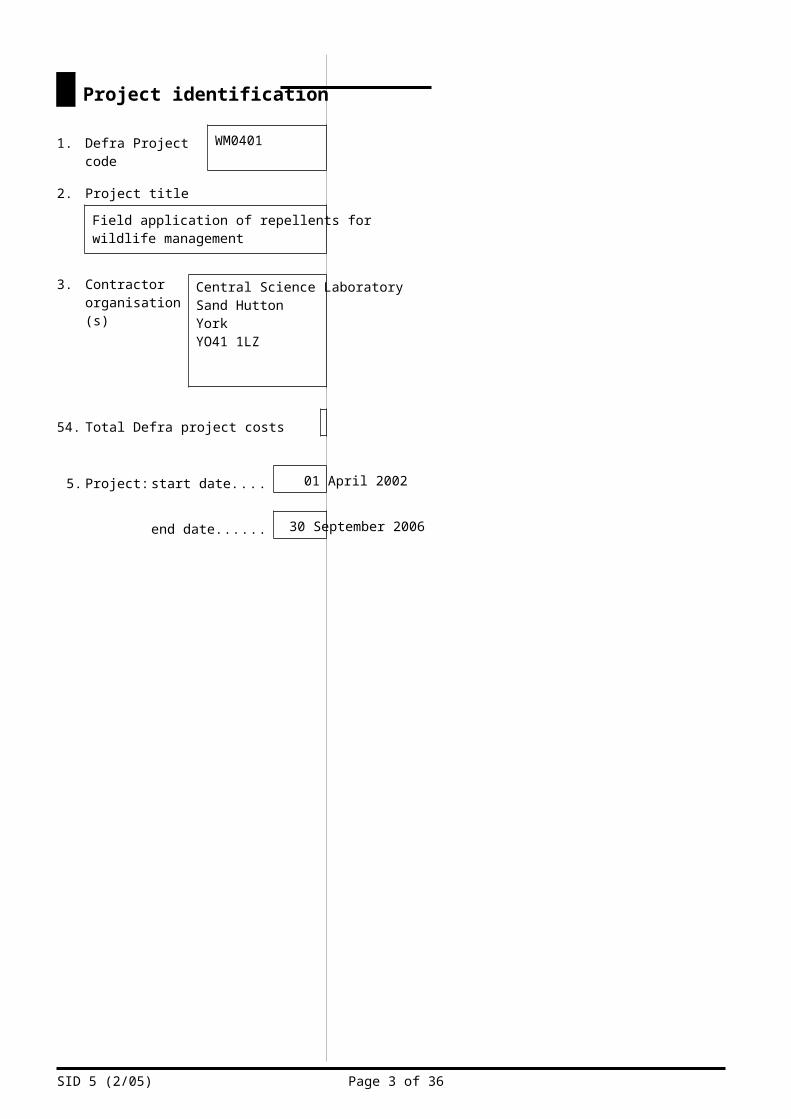
1. Defra Project code WM0401
2. Project title
Field application of repellents for wildlife management
3. Contractororganisation(s)
Central Science LaboratorySand HuttonYorkYO41 1LZ
54. Total Defra project costs £ 298048
5. Project: start date................ 01 April 2002
end date................. 30 September 2006
SID 5 (2/05) Page 2 of 26
6. It is Defra’s intention to publish this form. Please confirm your agreement to do so...................................................................................YES NO (a) When preparing SID 5s contractors should bear in mind that Defra intends that they be made public. They
should be written in a clear and concise manner and represent a full account of the research project which someone not closely associated with the project can follow.Defra recognises that in a small minority of cases there may be information, such as intellectual property or commercially confidential data, used in or generated by the research project, which should not be disclosed. In these cases, such information should be detailed in a separate annex (not to be published) so that the SID 5 can be placed in the public domain. Where it is impossible to complete the Final Report without including references to any sensitive or confidential data, the information should be included and section (b) completed. NB: only in exceptional circumstances will Defra expect contractors to give a "No" answer.In all cases, reasons for withholding information must be fully in line with exemptions under the Environmental Information Regulations or the Freedom of Information Act 2000.
(b) If you have answered NO, please explain why the Final report should not be released into public domain
Executive Summary7. The executive summary must not exceed 2 sides in total of A4 and should be understandable to the
intelligent non-scientist. It should cover the main objectives, methods and findings of the research, together with any other significant events and options for new work.
1. Repellents offer great promise as wildlife management tools, as potentially they can reduce the number of problem animals that would otherwise be the target of lethal control applications, they are relatively environmentally benign and have strong public support and, unlike lethal methods, there is no compensatory increased productivity or enhanced survival amongst the residual target population. Two previous projects VC0404 and VC0414 initiated the development and use of effective repellents including, in particular, the use of silica to protect wheat crops from grazing damage by rabbits. Plants absorbed additional silica from a fertiliser that was applied to the soil just before the crop was sown. The raised silica levels boosted a plant’s own natural physical defences and resulted in those plants becoming unpalatable to rabbits. This project tested the use of silica fertilisers in field-scale trials in order to address the practical consequences of using the technique to protect wheat crops, including the likelihood of increased damage to untreated crops and changes to field margins resulting from rabbits seeking to avoid high-silica plants. The project also sought to extend the applicability of the technique to protect winter barley and oil-seed rape.2. To boost plant silica levels, a phosphorous furnace slag (PFS) containing 22% silica was applied to soil. To determine the optimal application rate for large-scale field trials, preliminary tests were carried out in which rabbits were exposed to barley, wheat or oil-seed rape that had been treated with 0, 1 and 5 t PFS/ha (equivalent to 0, 0.22 and 1.1 t Si/ha). Three varieties of each crop were also tested against each application rate in a randomised block design. For each crop, 27 small plots (each not exceeding 12 x 24 m) were arranged in 3 rows parallel to a field margin that was occupied by rabbits. A 4 th row of 9 plots was added behind a rabbit-proof fence. PFS fertiliser was applied in the autumn and in each test 10-20 rabbits were given access to the plots when the plants had grown sufficiently to be a sustainable food source. Plant silica levels and damage assessments were carried out at regular intervals until harvest and the yields from the different treatments were compared.3. Silica levels in plants peaked around February and then declined as harvest
SID 5 (2/05) Page 3 of 26

approached. The average silica content in barley and wheat was positively related to the amount of fertiliser applied. Most damage to plants was observed during the winter months, but from early spring onwards overall damage declined to a negligible level, presumably as the plants’ growth rate exceeded the losses due to rabbit grazing. In all cases, the yield was not dependent on PFS treatment, but in wheat it was dependent on variety: var. Charger produced the highest yields and also had the highest silica content. (In laboratory trials, it was shown that wheat plants were able to absorb more silica than either barley or oil-seed rape. In this project, captive rabbits did not discriminate between treated and untreated barley or oil-seed rape plants in contrast to the results from trials with wheat in a previous project.)4. Replicated trials to test the efficacy of the silica repellent on a field scale were carried out over 3 crop years, 2003-4, 2004-5 and 2005-6. In each trial, tagged rabbits were released into a field margin next to a wheat crop that had been treated with 5 t PFS/ha. Untreated wheat was available on the opposite side of the treated field and beyond that there was an unoccupied field margin. Separate control replicates were established in which both fields were untreated. A central rabbit-proof fence with access tunnels was erected in both treated and control replicates so that movements between the treated and untreated crops could be monitored. The proportion of time spent in one crop compared with the proportion spent in the other crop was taken as a measure of preference. Rabbits were given access to the crop from midwinter until harvest; plant silica content and damage levels were assessed regularly and the final yield was recorded. 5. In the 2003-4 trials, rabbits spent 66% of the total recorded time in the treated crop and/or the field margin, thus the repellent effect due to silica treatment was unclear. Also, adverse weather conditions and overgrazing prevented a comparison of damage levels and yield. In 2004-5, the trials were repeated with additional fences and access tunnels between the field margin and the treated crop. Throughout the growing season, females spent approximately 75% of recorded activity time in the field margin in both the treated and control replicates and visits to the untreated crop on the far side of the central dividing fence were rare. During winter when the crop was most vulnerable to grazing damage, males in the treated replicate made a significant number of visits to the untreated crop whereas males in the control replicate seldom passed through the central dividing fence. However, average damage levels in the treated and control replicates were similar and varied from light to moderate, although the yield from the treated crop was 17% higher than the equivalent (untreated) crop than in the control replicates. Nevertheless, overall yields in the control replicates were generally lower than those in the treated replicates. It appeared that rabbits found sufficient food in the field margin regardless of the presence of treated or untreated crops nearby. To enable a better assessment of the repellent effect, in 2005-6 the field adjacent to the field margin was divided with treated crop in one half and untreated crop in the other half. Under these conditions, rabbits showed a clear preference for the untreated crop. Overgrazing led to high levels of damage and although yields of the treated crops were on average 3% higher than those of untreated crops, overall, yields were relatively low.6. The results suggested that the use of silica fertilisers to prevent rabbit damage to crops is likely to be marginally effective and without significant environmental costs. Under field conditions, high-silica wheat did not appear to be strongly repellent, thus the maximum treatment effect was seen when rabbits were presented with a simple choice that required no cost, such as additional foraging time, for individuals choosing the more palatable option. There was little evidence that the use of silica fertilisers could be extended to protect other crops. There appears to be a limit in the amount of silica that plants will absorb that cannot be overridden by higher application rates of fertiliser. There may be a limited role for silica fertilisers to protect field edges from rabbit damage, for example, in support of Stewardship Schemes that seek to improve the biodiversity of crop headlands.
SID 5 (2/05) Page 4 of 26
Project Report to Defra8. As a guide this report should be no longer than 20 sides of A4. This report is to provide Defra with
details of the outputs of the research project for internal purposes; to meet the terms of the contract; and to allow Defra to publish details of the outputs to meet Environmental Information Regulation or Freedom of Information obligations. This short report to Defra does not preclude contractors from also seeking to publish a full, formal scientific report/paper in an appropriate scientific or other journal/publication. Indeed, Defra actively encourages such publications as part of the contract terms. The report to Defra should include: the scientific objectives as set out in the contract; the extent to which the objectives set out in the contract have been met; details of methods used and the results obtained, including statistical analysis (if appropriate); a discussion of the results and their reliability; the main implications of the findings; possible future work; and any action resulting from the research (e.g. IP, Knowledge Transfer).
INTRODUCTIONWildlife management requires techniques that are not only effective but, ideally, have little impact on the welfare of the target animals and do not damage the environment. The search to develop such techniques has been encouraged by public pressure for more benign approaches to managing wildlife, and minimal use, wherever possible, of lethal control methods.
Repellents offer great promise as wildlife management tools. Their benefits include (1) a reduction in the number of problem animals that would otherwise be the target of lethal control applications (2) strong public support (3) relatively environmentally benign and (4) unlike lethal methods, no compensatory increased productivity or enhanced survival amongst the residual target population.
Two previous projects, VC0414 and its predecessor VC0404, made considerable progress towards developing humane and cost-effective repellents, identifying and formulating a number of innovative materials for the prevention of both feeding damage and nuisance behaviours. One of those materials was a silica fertiliser that provided an innovative yet simple approach to protecting wheat crops by boosting the plant’s own natural physical defences, a novel form of intervention that raises none of the environmental concerns associated with genetic manipulation or the application of pesticides. Additionally, the fertiliser appeared to boost the plant’s growth during the early stages of development and its resistance to disease. The repellent properties of the fertiliser were demonstrated under laboratory conditions and small-scale field trials produced encouraging results.
The main focus of this project was to test this repellency on a larger scale in order to measure efficacy under the influence of habitat structure and land management factors that in practice determine the cost-effectiveness and wider environmental impact of repellent applications. The test system was grazing damage to cereal crops by wild rabbits (Oryctolagus cuniculus). The effectiveness of any repellent treatment in protecting an area of economic or conservation importance is dependent, in part, on the quality of the alternatives available. Absolute repellency is often considered desirable, but, in practice, is probably unrealistic for all but the most toxic materials. The poorer or scarcer the alternatives are within the habitat, the more potent the repellent will need to be to deter the animal. There is also the risk that an effective repellent simply displaces problems onto adjacent agricultural land, thus compromising any initial benefit. Thus, to encourage the adoption of this wildlife management technique, the ‘rules’ governing the impact of the environment on the cost-effectiveness of repellent
SID 5 (2/05) Page 5 of 26

treatments and the consequence of the repellent application for the ecology of adjacent habitats need to be established.
The first stage of the project was to complete preliminary field trials to determine the most effective application rate of silica fertilisers to protect wheat crops from rabbit grazing damage. Additionally, to test the ability of this technique to protect other vulnerable crops, the fertiliser was applied to oil-seed rape and barley and these crops were then exposed to rabbit grazing pressure under laboratory and small-scale field conditions. The second stage was to treat whole fields with silica and monitor the response of rabbit populations to the treatments.
This project supports the broad objectives of Defra’s policy of encouraging the development of effective, humane and environmentally sensitive wildlife management methods.
OBJECTIVES
1. Quantify the effectiveness of the systemic repellent approach for protecting wheat, barley and oilseed rape. (Finish 31/10/05)
2. Quantify the impact of this management strategy on the behaviour and welfare of the target species and on the surrounding habitat. (Finish 30/09/06)
MATERIALS AND METHODS
1. The repellency of silica-treated barley and oil-seed rape to captive rabbits
Many grasses, like wheat and barley, have a number of physical defences, such as leaf trichomes made of silica, to deter herbivores. Vertebrate herbivores actively discriminate between high and low silica grasses and preferentially feed on the latter. This avoidance of high silica plants is attributed to the increased mechanical abrasion of enamel surfaces, and the ability of ingested silica to cause internal malaise. Raised silica levels in dicotyledonous plants, such as oil-seed rape, might also protect vulnerable crops from herbivore attack.
To boost the silica levels in barley and oil-seed rape for the trials on captive rabbits, plants were grown under greenhouse conditions in soil treated with phosphorous furnace slag (PFS), which contains approximately 22% silica. (In a previous project, PFS was found to be a readily available and relatively cheap source of silicon.) Dose-response tests showed that at application rates of the slag equivalent to 1 and 2 t Si/ha, silica levels in barley were significantly higher than in control plants, but 2 t Si/ha and 5 t Si/ha were required to raise silica levels in oil-seed rape above those of controls. The silica treatment did not affect germination or dry plant weight and silica uptake did not vary among the 3 varieties of each crop that were tested.
Wild rabbits were singly housed in vegetation-free enclosures. They were maintained on a diet of pelleted rabbit economy diet and were accustomed to grazing grass turf from seed trays prior to the start of the trial. A two-choice trial was used, where 8 rabbits were presented with 6 randomly positioned trays (3 untreated, 3 treated) of barley for a 16-hour period (17.00 to 09.00 hrs) on each of 4 consecutive days (6 rabbits were used to test the response to treated rape). During this time their normal maintenance diet was removed and replaced in the morning. Water was available ad libitum.
Barley (var. Fanfare) and oil-seed rape (var. Escort) plants were cultivated at a constant temperature of 18 ° C (+/- 5 ° C) in a greenhouse lit by 2500 lux Holophane high pressure sodium lamps when the outside light level dropped below 150 watts/m2 on a 12 hour light / dark photo period. Seeds were sown in a homogeneous soil mix (riddled John Innes No. 3
SID 5 (2/05) Page 6 of 26

mixed with perlight (9:1 v/v) in perforated seed trays (19 cm by 16 cm). Each tray contained 1 litre of the soil mix, and 30 barley seeds/tray or 20 rape seeds/tray were sown to a depth of 2.5 cm and were watered from beneath with tap water. Untreated plants were grown in the soil mix only, but for treated plants PFS was added to each litre of soil mix at the rate of 14.42 g for barley and 28.84 g for rape (equivalent to 1 and 2 t Si/ha respectively). The plants grew for 3 weeks post-emergence before being used in the trials.
After exposure to rabbit grazing, the trays were removed and damage to barley was assessed as undamaged (0 % reduction in plant height), light damage (< 50% reduction in plant height), moderate (50-90 % reduction in plant height) or severe damage (> 90 % reduction in plant height); damage to rape was assessed as undamaged, light damage (a few nibbles from leaves only), moderate (up to 50 % of the leaf area removed) or severe damage (> 50 % of the leaf area removed). For each crop, the number of damaged plants in each class was then calculated as a percentage of the total number of plants in each tray. As a further measure of damage, the dry plant weight was measured. For each tray, the plants were harvested by removing all leaf material above soil level, placing them in a paper bag and then drying them in an oven at 50 °C until there was no further weight loss.
2. Determining the optimal application rate for the silica fertiliser
Trials were carried out at Bridgets Field station, Hampshire, in order to test the impact of the granular PFS fertiliser on the resistance of winter wheat, barley and oil-seed rape to rabbit grazing. A randomised block design was used in each case to test for differences between 3 application rates (0, 1t PFS /ha and 5t PFS/ha, equivalent to 0, 0.22 and 1.1 t Si/ha respectively) applied to 3 varieties of each crop. The varieties selected were: wheat var. Mercia, Charger and Riband; barley var. Siberia, Pearl and Fanfare; oil-seed rape var. Escort, Shannon and Recital. A total of 27 plots were divided into 3 rows (blocks) of 9 plots with the first row closest to the field margin. A 4-m strip of bare soil separated each row and a 2-m strip separated the plots within each row. A fourth row of 9 plots was established behind a rabbit-proof fence beyond the third row. For the trials on wheat, each plot was 12 m x 24 m, but for those on barley and oil-seed rape plot size was 4 m x 12 m. Each plot was given, at random, one of 9 treatments (a combination of variety and PFS application rate). For the treated plots, PFS was incorporated by direct drill at the appropriate application rate in the autumn (October/November) just before the seeds were sown. Soil samples (5 per plot) were taken from each plot before and after application of the PFS for analysis of silica content. Wheat and barley were then sown at a density of 350 seeds/m2 at 9 rows/m spacing, rape seed at a density of 7 kg/ha. Normal agronomic applications (e.g. NPK) were used throughout the growing season.
Rabbits were introduced into the field margin in the autumn but were only given access to the plots when there was sufficient growth of each crop to sustain them: this occurred between November and February depending on the crop and weather conditions. A minimum of 10 and a maximum of 20 rabbits of one sex only were released. At 4-6-week intervals a random sample of plants was taken from each plot. The number of plants damaged as a percentage of the total number in each sample was recorded and a further classification of the severity of the damage as ‘light’, ‘moderate’ or ‘severe’ was made for each plant (corresponding to 5 %, ≤ 50 % or > 50 % reduction in plant height (barley, wheat) or leaf area (oil-seed rape) respectively). The plants were then dried at 50 °C until there was no further weight loss, the dry weight recorded, and then they were milled using a hammer mill to pass through a 2 mm mesh. Levels of silica in the wheat were quantified by wet ashing and weighing, using an established method (MAFF/ADAS 1986). The levels of silica were calculated as % silica (g silica per 100 g of dry plant material). When each crop was fully-grown and ripe, the plots were harvested, and the seed from each plot was weighed, and adjusted to a standard 15 % moisture content. Two
SID 5 (2/05) Page 7 of 26
measures of yield were obtained, one based on the amount of grain collected in the combine hopper and the other (‘sieve weight’) based on a subsample of 1000g that was cleaned using a Rationel Proverenser sieve i.e. grain passing through a 5mm sieve but retained by a 1mm sieve.
To analyse soil for silica content, air-dried soil (approx. 1.0 g) was weighed accurately into a 125 ml plastic bottle into which 50 ml of de-mineralised water (pH = 6) was added. The bottles were shaken on a horizontal shaker for 3 hours, and the contents then allowed to settle overnight. The contents were then filtered (Whatman no. 42) until a clear filtrate was obtained. Bio-available silica in the soil was quantified using a colorimetric method (Molybdate Blue).
3. Field-scale trials to determine the effects of silica treatment
The trials were carried out over 3 crop years, 2003-4, 2004-5 and 2005-6 and were designed to determine the response of rabbits nesting in a field margin to the presence of silica-treated wheat in an adjacent field. During the first two years, rabbits would need to cross a field containing the treated crop in order to find untreated wheat, thereby increasing their foraging time and risking greater exposure to predation. To minimise this risk, rabbits might move home sites to occupy a field margin that was closer to the untreated wheat. The effect of increased rabbit activity in the newly occupied margin might lead to changes in the vegetation community (e.g. reduction in grass cover and expansion of weed species) that could signify a potential environmental cost due to silica treatment. Additionally, such shifts in home range or migration of rabbits would demonstrate that treated plants were strongly repellent and thus could result inadvertently in increased damage to an untreated crop elsewhere. In the third year, the design was modified to present rabbits with a choice of treated and untreated wheat in the field adjacent to the field margin where they nested. To assess the effects of silica treatment, data were collected from replicated trials on how much time individual rabbits spent on the treated and untreated crops, the levels of damage to those crops during the growing season, the yields at harvest and changes in the ratio of grass to broad-leaved plants if rabbits began occupying other field margins.
Each replicate consisted of a field 140m x 85m (1.19ha) plus a field margin 30m x 85m of meadow grass at each end (Figure 1). A rabbit-proof fence enclosed the whole field including the margins. Three different layouts (A-C) were used over 3 crop years (2003-4, 2004-5, 2005-6), each layout replicated twice. An additional two replicates for A and B were established as controls with untreated wheat on both sides of the central dividing fence.
In each replicate, PFS fertiliser was applied at the rate of 5 t/ha using a modified fertiliser spreader to each section of the field designated as a treated area. The fertiliser was applied in the autumn and wheat (var. Charger) was drilled in all sections within 14 days thereafter subject to weather conditions. Silica levels in the soil were measured from samples taken before the fertiliser was applied and within 14 days post application, just after the crop was sown. Twenty rabbits (10 males, 10 females) were live-trapped and released into the field margin in each replicate (Figure 1), but were not allowed access to the crop until it had grown sufficiently to be a viable food source. Wooden boxes were provided as shelter until the animals had dug their own burrow systems. Before release, all rabbits were vaccinated against Myxomatosis and Rabbit Haemorrhagic Disease (RHD) and each animal was weighed and fitted with a coloured, numbered ear tag. Additionally, rabbits released into one treated and one control replicate for layouts A and B and for one replicate of layout C had an individually coded microtag (passive interrogated transponder) attached to their ear tag so that each individual could be identified as it passed through any of the tunnels connecting different sections of the field. Each tunnel consisted of 3 sections, the middle one being about 1 m long,
SID 5 (2/05) Page 8 of 26

which separated 2, 40 cm long tubes that contained the detector antennae. Each antenna was connected to a reader that transmitted detection events (ID code, day and time) to a 4-channel data logger, which in turn recorded movements through 2 tunnels – 5 loggers were required to monitor the movements through the 10 tunnels deployed in layouts B and C (Figure 1). As all events were synchronised, the time rabbits entered and left a particular section of the field was recorded, thus the time spent in each section (i.e. for layouts B and C: treated crop, untreated crop, field margin) could be calculated. The proportion of time spent in a section compared with the proportions spent in other sections was taken as a measure of preference.
Figure 1 Field layouts to test the response of rabbits to silica-treated wheat during the crop years 2003-4 (A), 2004-5 (B) and 2005-6 (C). Rabbit-proof fences separated different sections of the field with access allowed
through connecting tunnels, which contained microtag detectors that indicated the direction of movement. T = treated wheat (the remaining sections contained untreated wheat); R = field margin where 20 rabbits were
released.
Grazing damage to untreated and treated plants was assessed at monthly intervals after rabbits were given access to the crop. Sampling lines were marked out across each section of the field at different distances from the field margin and samples of whole plants were collected at random points along each line. The height of each plant was recorded and the amount of leaf that had been eaten by rabbits was determined as ≤5% (light damage), >5% ≤50% (moderate damage), or >50% ≤100% (severe damage). All plants were then dried in an oven and analysed for silica content. Yield assessment was based on grain collected in the combine hopper.
RESULTS
1. The repellency of silica-treated barley and oil-seed rape to captive rabbits
Barley
The response of rabbits on the first night seemed hesitant with 70% of treated plants and 66% of untreated plants remaining undamaged, but by day 4, 79% of untreated plants and 81% of treated plants had been grazed. Overall, 48.2% of untreated plants (n=7303) and 51.5% of treated plants (n=7373) were grazed with 7.5% and 7.9% respectively being severely damaged (i.e. plant height reduced by >90%). Pooling the data over 4 days, there was no
SID 5 (2/05) Page 9 of 26
difference between the proportions of treated and untreated plants that received any grazing damage (paired t-test, p=0.34, Figure 2). There was also no difference in dry plant weights between treated and untreated plants (t-test, p=0.38).
Figure 2 Grazing damage by 8 captive wild rabbits offered a choice between untreated winter barley and winter barley grown in soil treated with phosphorus furnace slag (PFS) at the rate of 4.74 t/ha (1 t/ha Si). Rabbits were presented with fresh barley plants each day for 4 days and the bars show damage per rabbit as the mean number of plants grazed in each damage category expressed as a percentage of the total number of plants to which each
rabbit was exposed to over 4 days.
Oil-seed rape
Over the 4 days of the test, 65.4% of untreated rape plants (n=1914) and 63.8% of treated plants (n=2419) received grazing damage with 28.9% and 28.1% respectively being severely damaged (i.e. >50% of the leaf area missing). Pooling the data over 4 days, there was no difference between the proportions of treated and untreated plants that received any grazing damage (paired t-test, p=0.78, Figure 3). There was also no difference in dry plant weights between treated and untreated plants (t-test, p=0.47).
Figure 3 Grazing damage by 6 captive wild rabbits offered a choice between untreated oil-seed rape and oil-seed rape grown in soil treated with phosphorus furnace slag (PFS) at the rate of 9.49 t/ha (2 t/ha Si). Rabbits were presented with fresh rape plants each day for 4 days and the bars show damage per rabbit as the mean number of plants grazed in each damage category expressed as a percentage of the total number of plants to which each
rabbit was exposed to over 4 days.
SID 5 (2/05) Page 10 of 26
2. Determining the optimal application rate for the silica fertiliser(i) Barley
Analysis of soil samples taken before the fertiliser was applied showed no differences in silica levels (Kruskal-Wallis test, p = 0.88) among the plots allocated to receive 0, 1 or 5 t PFS/ha (Table 1). Analysis of samples taken approximately 9 months after application showed a significant difference in silica levels due to treatment (Kruskal-Wallis test, p < 0.001); a comparison between pre- and post-treatment silica levels for plots treated with 1 or 5 t PFS/ha showed, as expected, significantly higher levels post-treatment (t-test, p<0.001 in each case). There was also a significant increase in soil silica on the control plots (0 t PFS/ha) (t-test, p = 0.024).
Table 1 Mean silica content (g/g soil) SD in soil samples taken from plots in the field trial to find the optimal rate of phosphorous furnace slag (PFS) application for raising silica levels in winter barley.
0 t PFS/ha 1 t PFS/ha 5 t PFS/ha
Pre-PFS application 23.1 6.3 21.5 4.4 24.8 14.7
Post-harvest 29.2 3.8 38.7 5.0 51.0 10.1
Overall mean silica levels in barley plant material decreased from 3.61% in February to 2.38% in August (Figure 4). Plants grown on plots treated with 1 t PFS/ha had, on average, 0.19% more silica in the leaf material and those on plots treated with 5 t PFS/ha had 0.7% more silica than plants grown on untreated plots (Analysis of Covariance (Ancova), p<0.001 for a difference between treatments). The silica content of harvested grain (overall mean 0.55%) differed significantly among the varieties (2-way Anova, p = 0.016) with var Siberia having the highest level (0.64%), but there were no differences related to PFS application rates.
Figure 4 Silica content in samples of winter barley grown in soil treated with different application rates of PFS fertiliser.
SID 5 (2/05) Page 11 of 26

Damage assessments were carried out in January, March and April, when 88%, 95% and 90%, respectively, of the plants collected showed reductions in plant height attributable to rabbit grazing. However, less than 4% of plants had been severely damaged (>50% reduction in height). A single ‘damage score’ was calculated for each month from the proportions of plants that showed light, moderate, severe or no damage. Overall, plant damage was assessed as light to moderate between January and April, but by May the degree of damage had decreased, presumably by compensatory growth, and the percentage of plants damaged had reduced to 20% (Figure 5).
Figure 5 Degree of grazing damage by rabbits to winter barley during a randomised block trial to evaluate different application rates of PFS fertiliser. Rabbits were released into a field margin and given access to the
crop after it had grown sufficiently to be a sustainable food source. Damage was defined as a reduction in plant height and an average damage score was calculated for each time point from the proportions of plants
classified as having light, moderate, severe or no damage.
The overall mean yield/plot was 22.7 ± SD 7.33 kg. Including data from the plots behind the rabbit-proof fence, there was no difference in yield due to PFS treatment (Analysis of Variance, p = 0.80) or variety (p = 0.37). There was also no difference due to treatment when the alternative measure of yield (sieve weight) was used.
Table 2 Mean yield SD (kg) per plot for three winter barley varieties treated with PFS fertiliser applied at 0, 1 or 5 t/ha.
Variety
Siberia Pearl Fanfare
PFS fertiliser t/ha
0 18.9 6.9 26.8 8.5 20.1 6.5
1 20.7 8.2 21.5 9.0 26.7 2.4
5 20.6 4.7 23.0 10.8 24.0 9.9
(ii) Oil-seed rape
Pre-treatment, there were no differences in soil silica content among the plots allocated to receive 0, 1 or 5 t PFS/ha (1-way Anova, p = 0.56), but samples taken post-harvest were
SID 5 (2/05) Page 12 of 26

significantly different (1-way Anova, p <0.001, Table 3). On plots that received 5 t PFS/ha, soil silica content was significantly higher post-treatment (t-test, p<0.001), but there was no difference post-treatment on the untreated plots or those treated with 1 t PFS/ha.
Table 3 Mean silica content (g/g soil) SD in soil samples taken from plots in the field trial to find the optimal rate of phosphorous furnace slag (PFS) application for raising silica levels in oil-seed rape.
0 t PFS/ha 1 t PFS/ha 5 t PFS/ha
Pre-PFS application 29.9 4.1 28.9 6.7 27.0 6.1
Post-harvest 28.5 3.3 28.8 5.1 41.4 7.4
Overall mean silica levels in the leaves of oil-seed rape plants fell from 3.06% in February to 0.92% in August (Figure 6). The fertiliser had been applied in November and by February the treatment had produced significantly higher silica levels in rape plants, but only in those grown in soil treated with the highest application rate (2-way Anova, p = 0.001, post-hoc Bonferroni test). Thereafter, silica levels appeared to decrease differentially with a significant interaction between time and PFS application rate (Ancova, p=0.006). By May, the levels did not differ among treatments (2-way Anova). Overall mean silica content in the harvested rape seed was 0.38 ± SD 0.06% and there were no differences related to the PFS application rate (Kruskal-Wallis test, p = 0.41).
Figure 6 Silica content in samples of oil-seed rape grown in soil treated with different application rates of PFS fertiliser.
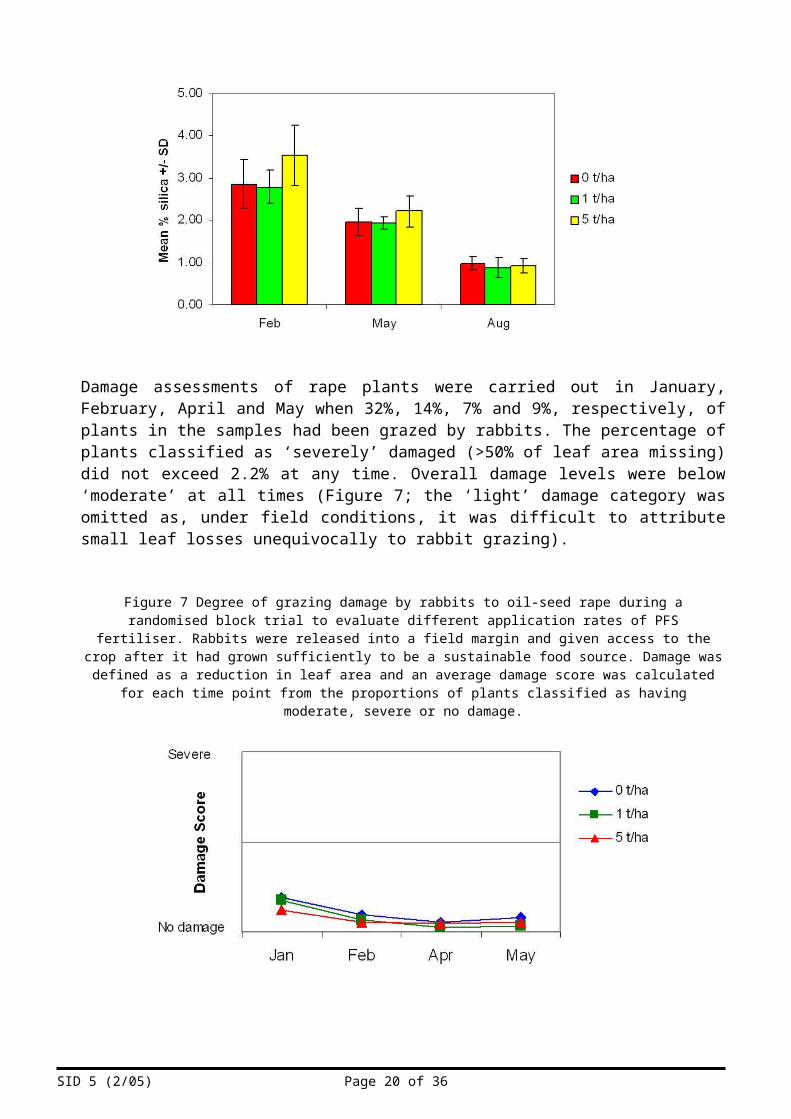
Damage assessments of rape plants were carried out in January, February, April and May when 32%, 14%, 7% and 9%, respectively, of plants in the samples had been grazed by rabbits. The percentage of plants classified as ‘severely’ damaged (>50% of leaf area missing) did not exceed 2.2% at any time. Overall damage levels were below ‘moderate’ at all times (Figure 7; the ‘light’ damage category was omitted as, under field conditions, it was difficult to attribute small leaf losses unequivocally to rabbit grazing).
SID 5 (2/05) Page 13 of 26
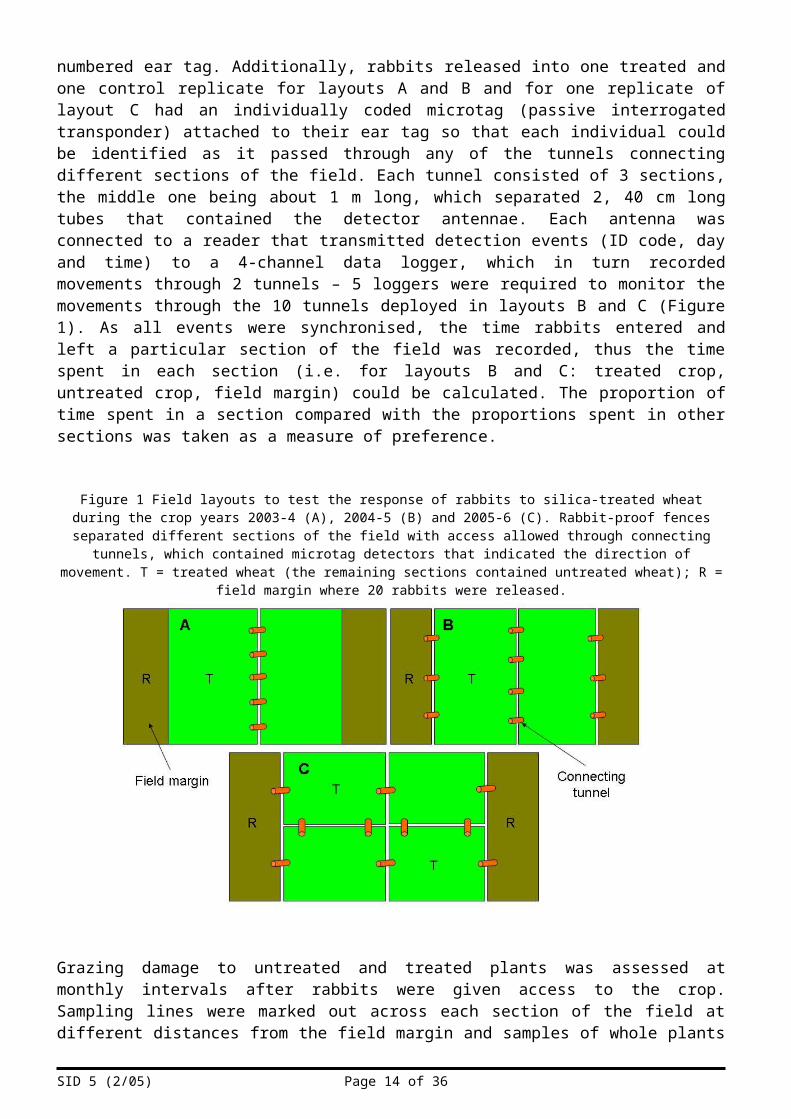
Figure 7 Degree of grazing damage by rabbits to oil-seed rape during a randomised block trial to evaluate different application rates of PFS fertiliser. Rabbits were released into a field margin and given access to the
crop after it had grown sufficiently to be a sustainable food source. Damage was defined as a reduction in leaf area and an average damage score was calculated for each time point from the proportions of plants
classified as having moderate, severe or no damage.
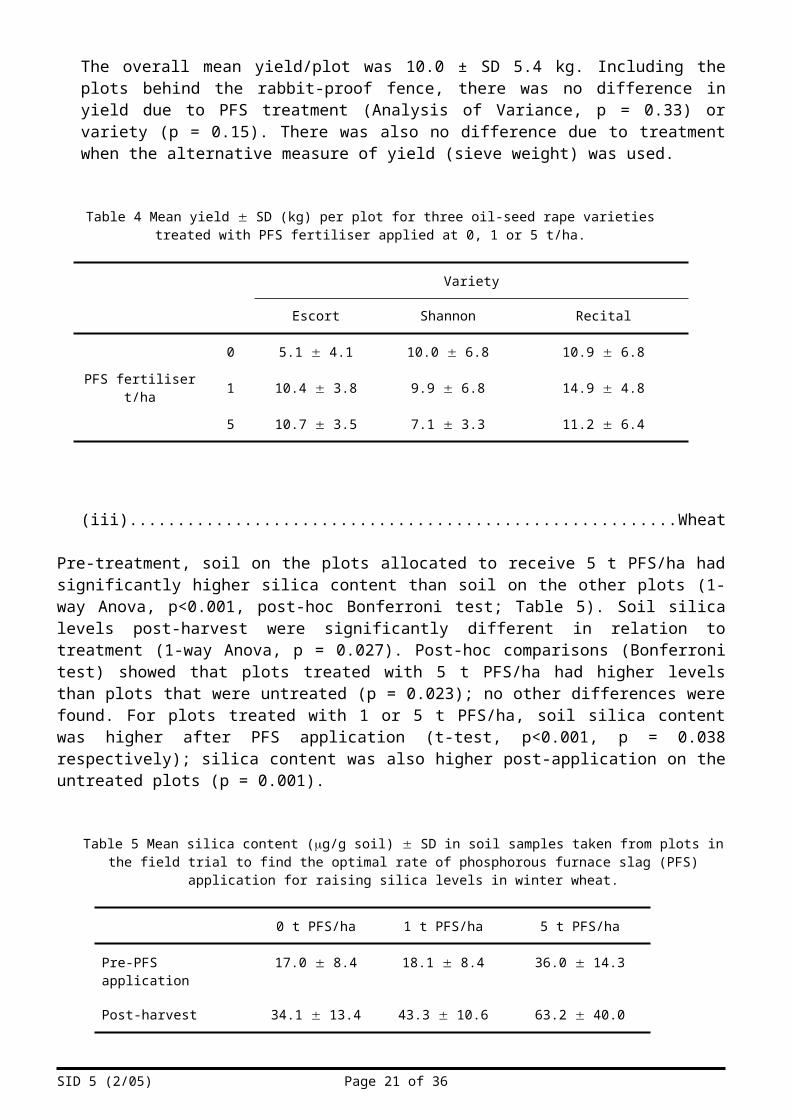
The overall mean yield/plot was 10.0 ± SD 5.4 kg. Including the plots behind the rabbit-proof fence, there was no difference in yield due to PFS treatment (Analysis of Variance, p = 0.33) or variety (p = 0.15). There was also no difference due to treatment when the alternative measure of yield (sieve weight) was used.
Table 4 Mean yield SD (kg) per plot for three oil-seed rape varieties treated with PFS fertiliser applied at 0, 1 or 5 t/ha.
Variety
Escort Shannon Recital
PFS fertiliser t/ha
0 5.1 4.1 10.0 6.8 10.9 6.8
1 10.4 3.8 9.9 6.8 14.9 4.8
5 10.7 3.5 7.1 3.3 11.2 6.4
(iii) Wheat
Pre-treatment, soil on the plots allocated to receive 5 t PFS/ha had significantly higher silica content than soil on the other plots (1-way Anova, p<0.001, post-hoc Bonferroni test; Table 5). Soil silica levels post-harvest were significantly different in relation to treatment (1-way Anova, p = 0.027). Post-hoc comparisons (Bonferroni test) showed that plots treated with 5 t PFS/ha had higher levels than plots that were untreated (p = 0.023); no other differences were found. For plots treated with 1 or 5 t PFS/ha, soil silica content was higher after PFS application (t-test, p<0.001, p = 0.038 respectively); silica content was also higher post-application on the untreated plots (p = 0.001).
SID 5 (2/05) Page 14 of 26
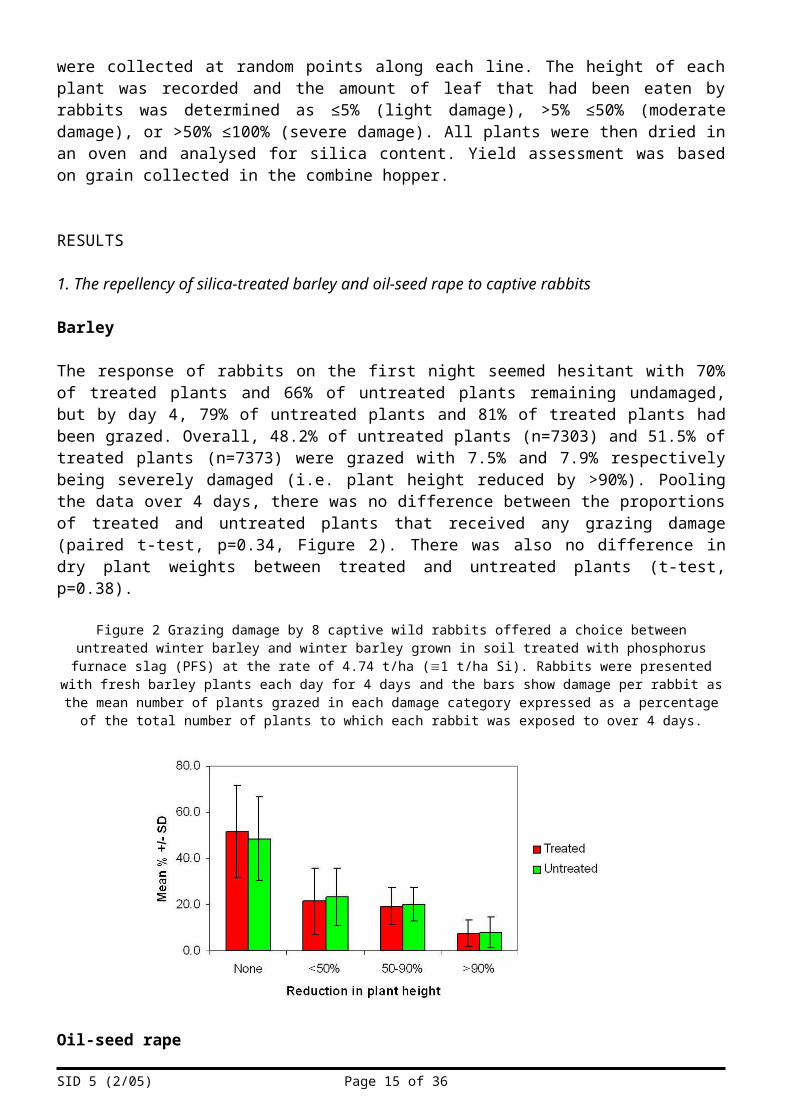
Table 5 Mean silica content (g/g soil) SD in soil samples taken from plots in the field trial to find the optimal rate of phosphorous furnace slag (PFS) application for raising silica levels in winter wheat.
0 t PFS/ha 1 t PFS/ha 5 t PFS/ha
Pre-PFS application 17.0 8.4 18.1 8.4 36.0 14.3
Post-harvest 34.1 13.4 43.3 10.6 63.2 40.0
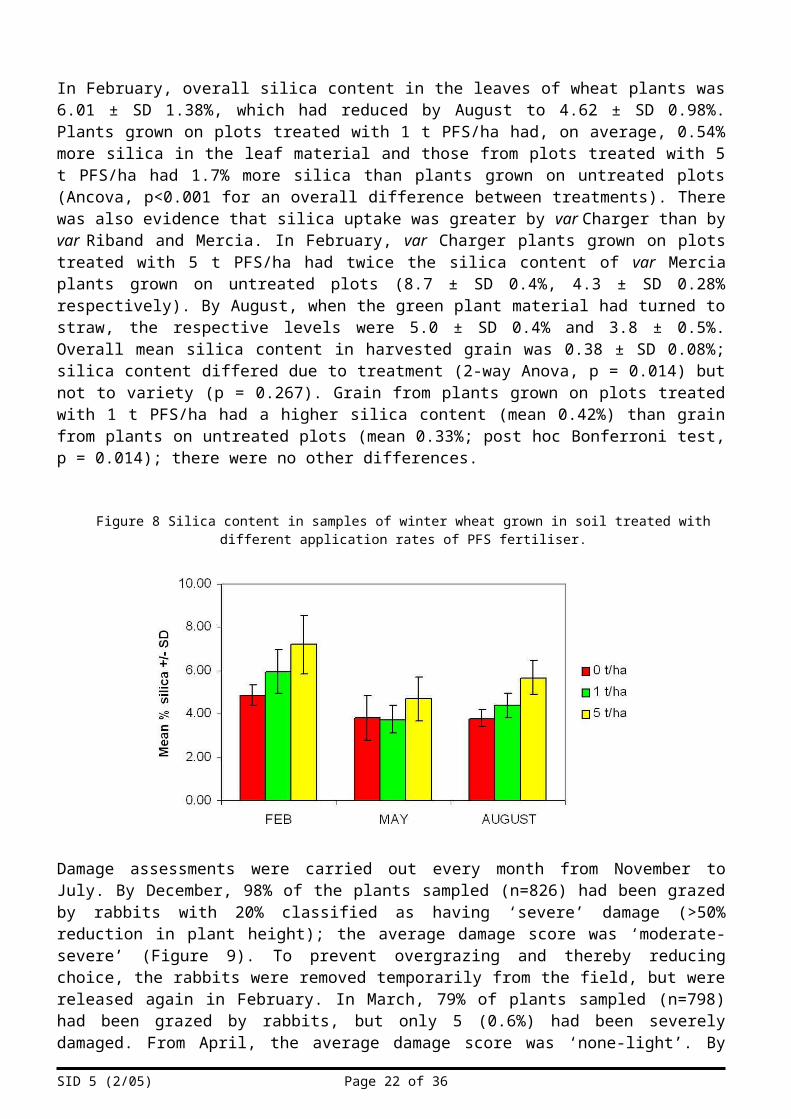
In February, overall silica content in the leaves of wheat plants was 6.01 ± SD 1.38%, which had reduced by August to 4.62 ± SD 0.98%. Plants grown on plots treated with 1 t PFS/ha had, on average, 0.54% more silica in the leaf material and those from plots treated with 5 t PFS/ha had 1.7% more silica than plants grown on untreated plots (Ancova, p<0.001 for an overall difference between treatments). There was also evidence that silica uptake was greater by var Charger than by var Riband and Mercia. In February, var Charger plants grown on plots treated with 5 t PFS/ha had twice the silica content of var Mercia plants grown on untreated plots (8.7 ± SD 0.4%, 4.3 ± SD 0.28% respectively). By August, when the green plant material had turned to straw, the respective levels were 5.0 ± SD 0.4% and 3.8 ± 0.5%. Overall mean silica content in harvested grain was 0.38 ± SD 0.08%; silica content differed due to treatment (2-way Anova, p = 0.014) but not to variety (p = 0.267). Grain from plants grown on plots treated with 1 t PFS/ha had a higher silica content (mean 0.42%) than grain from plants on untreated plots (mean 0.33%; post hoc Bonferroni test, p = 0.014); there were no other differences.
Figure 8 Silica content in samples of winter wheat grown in soil treated with different application rates of PFS fertiliser.
Damage assessments were carried out every month from November to July. By December, 98% of the plants sampled (n=826) had been grazed by rabbits with 20% classified as having ‘severe’ damage (>50% reduction in plant height); the average damage score was ‘moderate-severe’ (Figure 9). To prevent overgrazing and thereby reducing choice, the rabbits were removed temporarily from the field, but were released again in February. In March, 79% of plants sampled (n=798) had been grazed by rabbits, but only 5 (0.6%) had been severely damaged. From April, the average damage score was ‘none-light’. By June, 4% of plants (n=942) showed signs of damage, which in all cases was classified as ‘light’.
SID 5 (2/05) Page 15 of 26
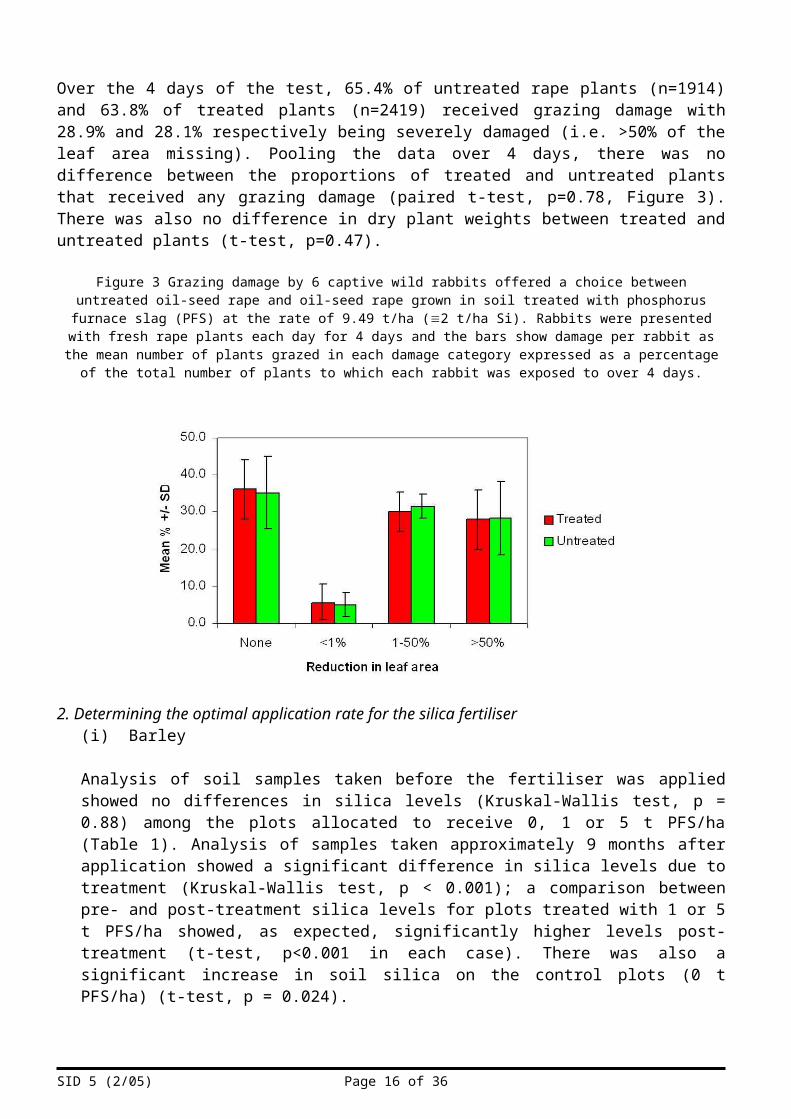
Figure 9 Degree of grazing damage by rabbits to winter wheat during a randomised block trial to evaluate different application rates of PFS fertiliser. Rabbits were released into a field margin and given access to the
crop after it had grown sufficiently to be a sustainable food source. Damage was defined as a reduction in plant height and an average damage score was calculated for each time point from the proportions of plants
classified as having light, moderate, severe or no damage.
The overall mean yield/plot was 137.3 ± SD 42.8 kg. Including the plots behind the rabbit-proof fence, there was no difference in yield due to PFS treatment (Anova, p = 0.504, Table 6). There was also no difference due to treatment when the alternative measure of yield (sieve weight) was used (p = 0.33). However, yield was dependent on the variety of wheat (p<0.001) with var Charger producing the highest yields.
Table 6 Mean yield SD (kg) per plot for three winter wheat varieties treated with PFS fertiliser t 0, 1 or 5 t/ha.
Variety
Mercia Charger Riband
PFS fertiliser t/ha
0 118.0 12.0 169.8 46.9 112.2 55.9
1 126.6 34.3 148.4 40.6 122.1 38.5
5 119.0 58.4 182.2 35.8 137.9 20.1
3. Field-scale trials to determine the effects of silica treatment
After assessing the data to find the optimal application rate, PFS fertiliser was applied in all field-scale trials at a rate of 5 t/ha. Winter wheat var Charger was chosen as the test crop. Within 14 days of PFS application, the silica content in the soil had increased, on average, by a factor of 2 (range 1.5-2.7) (Table 7). The apparently small increase in the soil silica in the control fields in the crop years 2003-4 and 2004-5 was not statistically significant (t-test).
SID 5 (2/05) Page 16 of 26

Table 7 Mean silica content (g/g soil) SD in soil samples taken from fields before PFS application and within 14 days after application and the sowing of winter wheat. PFS was applied to fields in the treated group at the
rate of 5 t/ha. In the crop years 2003-4 and 2004-5, samples were taken from the field adjacent to the field margin where rabbits were released. In 2005-6 in which the field adjacent to the margin was divided into a treated and an untreated half, samples were taken from the treated half only. (NB. In the crop year 2005-6 there were no whole
fields designated as controls.)
Crop Year ReplicateTreated Control
Before planting After planting Before planting After planting
2003-41 24.2 ± 4.6 43.0 ± 18.0 21.4 ± 7.9 25.3 ± 11.4
2 21.2 ± 13.6 39.4 ± 20.1 16.5 ± 6.6 21.0 ± 9.4
2004-51 30.2 ± 5.9 61.7 ± 8.6 28.5 ± 3.8 31.6 ± 6.0
2 21.4 ± 5.9 57.6 ± 15.6 23.9 ± 6.6 25.4 ± 9.1
2005-6
1 27.0 ± 8.2 54.1 ± 6.2 - -
2 32.8 ± 9.2 49.5 ± 5.7 - -
3 21.6 ± 9.2 50.8 ± 5.9 - -
4 21.6 ± 8.3 31.7 ± 6.9 - -
Plant silica levels were determined each month, January-August, during the 2004-5 crop year from samples taken from both fields of each replicate pair. In the two treated fields (replicates 1 and 2), silica levels in wheat leaves were, on average, 54% and 31% higher respectively than those in plants from the corresponding untreated fields (Figure 10). In contrast, in the replicates assigned as controls, the plants growing closest to the field margin where the rabbits were released had, on average, 6% and 5% more silica respectively than those growing in the field furthest from that margin. Plant silica levels were not determined during the crop year 2003-4 due to intensive rabbit grazing exacerbated by adverse weather conditions, or during 2005-6 when intensive rabbit grazing prevented sufficient samples being collected.
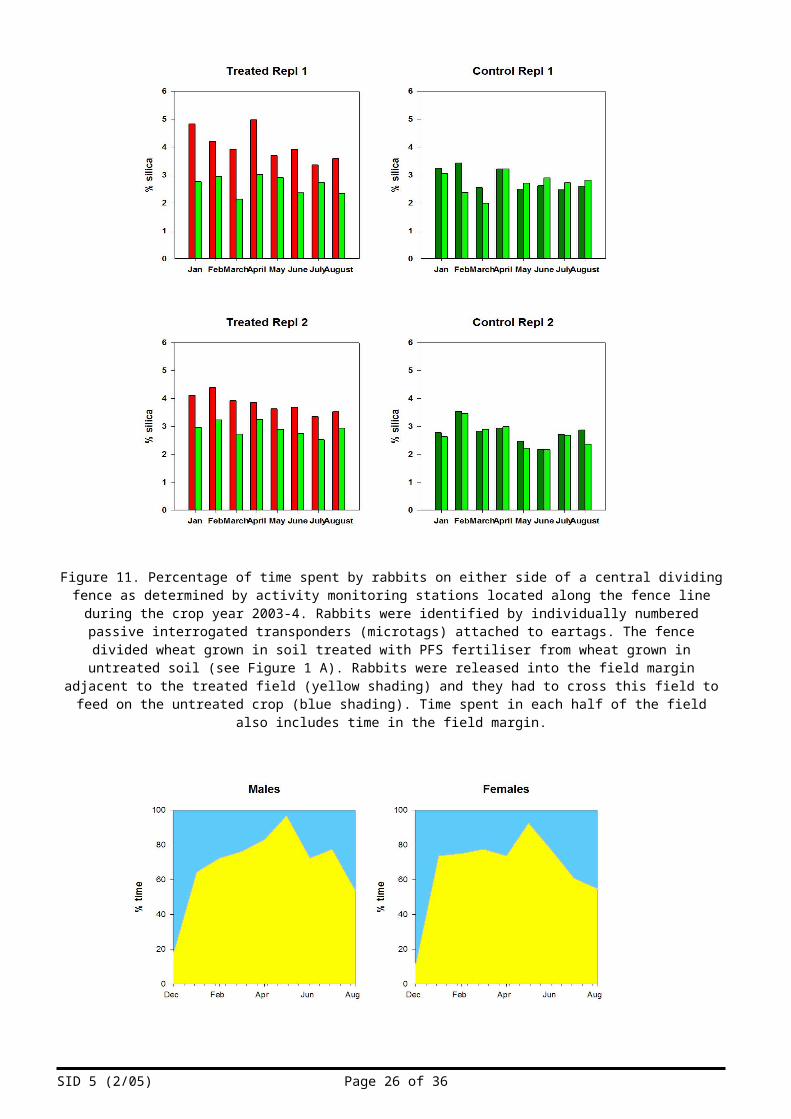
In the crop year 2003-4, microtag detectors monitored the movement of rabbits in relation to the presence of high-silica wheat in the field adjacent to the animals’ harbourage (Figure 1, layout A). Each month between December and August, 4-10 males and 3-10 females crossed the fence more than once allowing the length of visits to treated and untreated crops to be determined. Of 367 hours, in total, of recorded visits made by males, 66.1% of the time was spent on the side of the fence where the high-silica wheat was growing (Figure 11). Similarly, of 335 hours of visits by females, 65.7% of the time was spent on the ‘treated’ side of the fence.
SID 5 (2/05) Page 17 of 26
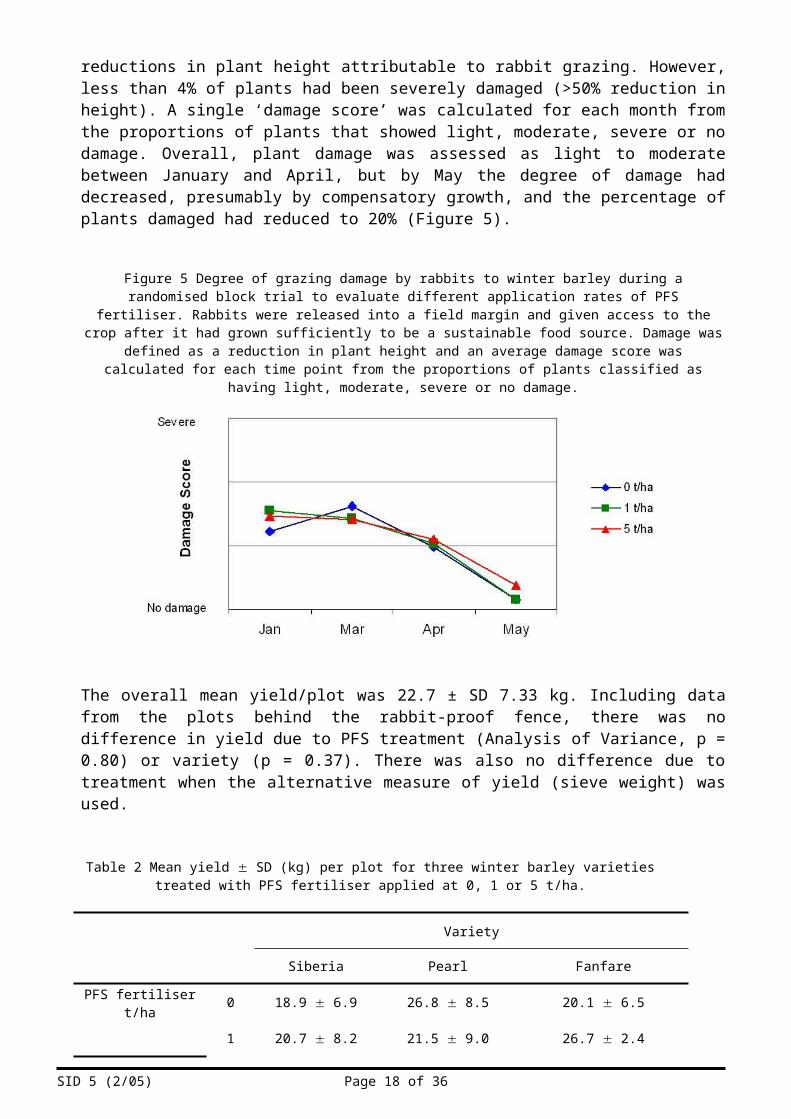
Figure 10 Silica content in the leaves of wheat plants grown in 8 fields arranged into 4 pairs of adjacent fields during the 2004-5 crop year. In each graph, for each month the bar on the left shows the silica level in the field
adjacent to the harbourage where rabbits were released (see Figure 1, layout B). Red bars show levels for plants grown in soil treated with a single application of 5 t PFS/ha; green bars show levels for plants grown in untreated
soil.
Figure 11. Percentage of time spent by rabbits on either side of a central dividing fence as determined by activity monitoring stations located along the fence line during the crop year 2003-4. Rabbits were identified by
individually numbered passive interrogated transponders (microtags) attached to eartags. The fence divided wheat grown in soil treated with PFS fertiliser from wheat grown in untreated soil (see Figure 1 A). Rabbits were released into the field margin adjacent to the treated field (yellow shading) and they had to cross this field to feed
on the untreated crop (blue shading). Time spent in each half of the field also includes time in the field margin.
SID 5 (2/05) Page 18 of 26
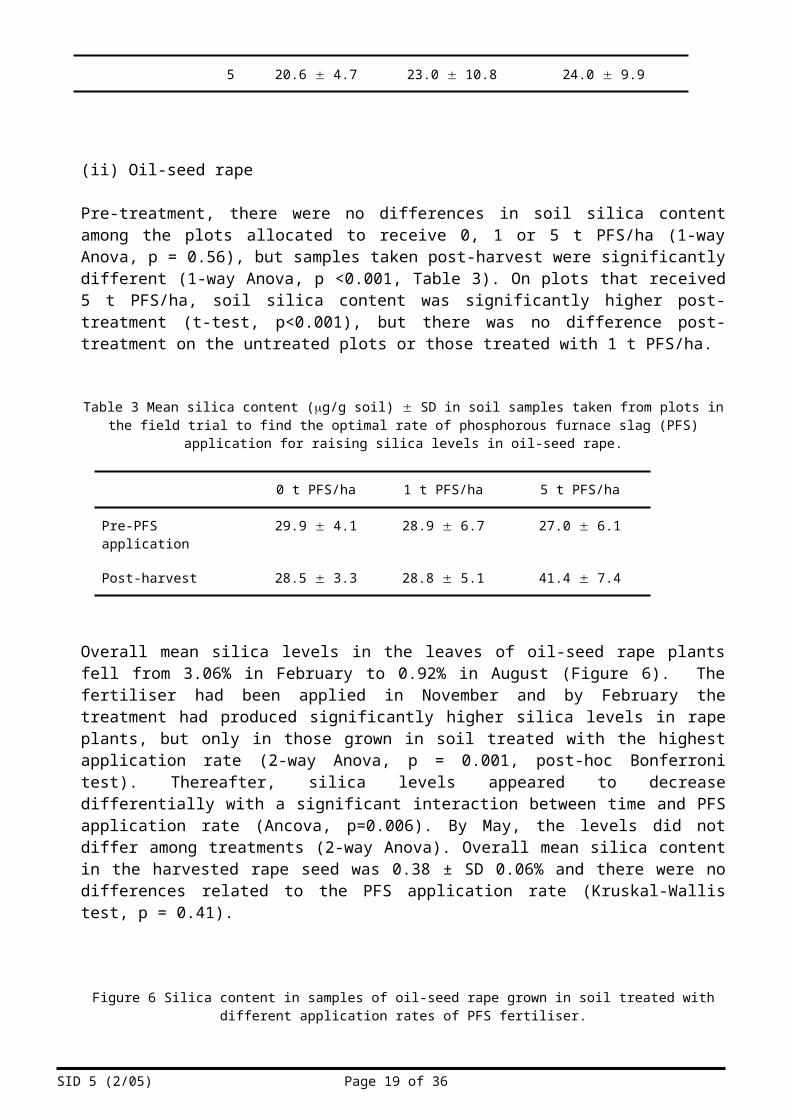
Figure 12 Percentage of time, shown as a 3-point moving average, spent by rabbits in each section of the whole field during the crop year 2004-5, as determined by activity monitoring stations located along fence lines that separated adjacent areas. In each chart, the light green area represents the field margin where rabbits were
initially released and the darker green is the field margin at the opposite end of the field (see Figure 1, layout B). The yellow shading represents time spent in the field where PFS fertiliser had been applied (no fertiliser was
applied to the equivalent sections in the controls).
SID 5 (2/05) Page 19 of 26
It was not possible to exclude time spent in the field margin from the calculations and in the crop year 2004-5, additional fencing and microtag detectors were installed along the edge of each field margin that separated it from the adjacent field (see Figure 1, B). In the treated replicate, where activity monitoring was carried out, the ratio of time spent by males in the field margins to that in the fields was 47.2:52.8; in the control replicate where monitoring was also carried out the ratio was 50.3:49.7. Comparable ratios for females were, respectively, 23.7:76.3 and 24.2:75.8 (Figure 12). For male rabbits in the treated replicate, there were seasonal differences in the time spent in either the treated and untreated sections of the field: 48% of the total visit time to the field was spent in the untreated section during the winter months December-February compared with 11% spent by males in the same part of the field in the control replicate (i.e. on the far side of the central dividing fence). Equivalent figures for spring (March-May) were, respectively, 29% and 36% and for summer (June-July) 25% and 50%. These differences were also apparent when the number of visits to each section of the field were compared: during winter 31% of recorded visits by males (n = 3352) in the treated replicate were to the untreated crop and differed significantly from 18% of visits (n = 2289) to
SID 5 (2/05) Page 20 of 26
the untreated crop (far side of fence) in the control replicate (z-test, p < 0.001). In spring and summer, males in the control replicate made proportionally more visits to the crop on the far side of the fence than did males in the treated replicate (z-tests, p = 0.01 and p < 0.001, respectively). For females, visits to the untreated crop in the treated replicate and to the untreated crop on the far side of the central dividing fence in the control replicate were rare and accounted for less than 2.6% of all recorded visits.
Few visits to the field margin at the opposite end of the field were recorded and no rabbits appeared to establish a homesite there. Consequently, no changes in vegetation due to rabbit activity were observed. The results on rabbit movement patterns during the crop year 2004-5 suggested a further refinement in the field layout to make the measurement of any repellence due to silica-treated wheat easier to assess (Figure 1, layout C).
Figure 13 Percentage of time, shown as a 3-point moving average, spent by rabbits in each section of the whole field during the crop year 2005-6, as determined by activity monitoring stations located along fence lines that separated adjacent areas. In each chart, the light green area represents the field margin where rabbits were initially released (see Figure 1, layout C). Data on activity from both ends of the field have been combined.
SID 5 (2/05) Page 21 of 26
In the winter months (January-February) of the final crop year 2005-6, male rabbits spent 44% of the total visit time to the field in the untreated sections (Figure 13). In spring (March-May) and summer (June-July), 51% and 50% of the total visit time to the field, respectively, was spent in the untreated sections. For females, the equivalent figures were 47%, 67% and 59% respectively. There were 3727 recorded visits by males during winter to the treated and untreated sections of the field, 52% of which were to the untreated crop. This suggested a preference for the untreated crop that was significant against a null hypothesis of an equal number of visits to each section (Chi Sq = 4.4, p = 0.04, 1 df). In spring, there were 7841 visits of which 59% were to the untreated crop and in summer 2040 visits with 60% to the untreated crop: for both seasons, the preference for the untreated crop was significant (p < 0.001 in each case). For females, the percentages of visits to the field that were to the untreated sections in the different seasons were: winter 54%, spring 59% and summer 61% (n = 3806, 5728 and 1853 respectively). These preferences were also significant against a null hypothesis of equal numbers of visits (p < 0.001 in all cases).
Figure 14 Degree of grazing damage by rabbits to wheat during the crop year 2004-5. Damage was defined as a reduction in plant height and an average damage score was calculated for each time point from the proportions of plants classified as having light, moderate, severe or no damage. The red symbols show damage to the crop in
the field adjacent to the field margin where rabbits were released and the green symbols damage to the untreated crop on the far side of the central dividing fence. In the treated replicates, the soil in the field adjacent to the field
margin had been treated with 5 t PFS/ha; in the control replicates the soil in this field was untreated.
SID 5 (2/05) Page 22 of 26

The degree of grazing damage by rabbits to the wheat plants was assessed at monthly intervals (January-July) during the crop year 2004-5. An average of 118 plants (range 80-155) were examined each month from each of 8 fields (6 untreated and 2 treated). In the fields adjacent to the rabbits’ harbourage, the proportion of plants damaged increased between January and March: in the 2 treated fields 98.8% and 96.3% were damaged in March compared with 100% and 96.7% in the equivalent fields in the 2 control replicates. The average level of damage each month in the treated replicates did not exceed ‘moderate’ (<50% reduction in plant height) and from April-July did not exceed ‘light’ (<5% reduction in height) (Figure 14); average damage levels in the control replicates followed similar trends.Average damage levels in the fields on the far side of the central dividing fence were consistently lower than those in fields adjacent to the harbourage.
Adverse weather conditions and overgrazing during the crop years 2003-4 and 2005-6 led to excessively high levels of damage to plants thereby precluding regular assessments.
Figure 15 Wheat yields for the crop year 2004-5. The bar on the left of each treated or control replicate shows the yield from the field closest to the field margin where the rabbits were initially released: red bars indicate wheat
grown in soil treated with 5 t PFS/ha; light and dark green bars, soil was untreated.
Figure 16 Wheat yields for the crop year 2005-6. In each replicate, rabbits were released into both field margins (see Figure 1 C) and the field adjacent to each margin was divided in half with one section treated with 5 t PFS/ha
and the other untreated.
SID 5 (2/05) Page 23 of 26

In 2004-5, the yield from the treated fields was 17% higher than that from the corresponding untreated fields (i.e. adjacent to the rabbits’ harbourage) in the control replicates (Figure 15). The yield from the untreated fields farthest from the harbourage was on average 6% higher than that from the untreated fields adjacent to it. In 2005-6, the yield from the treated sections of the field was on average 3% higher than that from the untreated sections (Figure 16).
Figure 17 Body weight changes in rabbits released into field margins adjacent to a wheat crop in which the soil was either untreated or had been treated with 5 t PFS/ha during the crop year 2004-5. Rabbits were first weighed Oct-Dec 2004 and the end weights were obtained approximately 1 year later. Data from rabbits in the two treated
replicates were combined as were data from the untreated replicates. Error bars show ± 1 SD.
Figure 18 Body weight changes in rabbits released into field margins adjacent to wheat growing in either untreated soil or soil that had been treated with 5 t PFS/ha during the crop year 2005-6. Rabbits were first
weighed in November 2005 and the end weights were obtained 10 months later. Data from the two replicates were combined. Error bars show ± 1 SD.
In 2004-5, the body weights of 18 male and 22 female rabbits were recorded at the time of release and then again when the animals were removed, approximately 1 year later (Figure 17). Overall, there was a significant increase in body weight (16%) in both sexes (p<0.001 in each case) with no difference between the weights of rabbits in the treated replicates from those in the untreated replicates (p= 0.57 males, p=0.92 females, Repeated Measures Anova). Similarly, in 2005-6, the body weights of 17 male and 17 female rabbits were recorded at the time of release and removal 10 months later (Figure 18). Overall, there were significant gains in weight (15% for males, 12% for females, p<0.001 in each case, paired t-test).
SID 5 (2/05) Page 24 of 26

DISCUSSION
Overall, the results suggested that the use of silica fertilisers to prevent rabbit damage to crops is likely to be marginally effective and without significant environmental costs. Under field conditions, high-silica wheat did not appear to be strongly repellent, thus the maximum treatment effect was seen when rabbits were presented with a simple choice that required no cost, such as additional foraging time or movement, for individuals choosing the more palatable option. A strong repellent may be desirable to protect a high value crop with the consequence that the target animals will invariably divert their attention to the nearest untreated crop. Under such circumstances, it may be more cost-effective to provide a sacrificial crop close by to prevent the animals moving to a neighbour’s property. With a relatively weak repellent, the problem may be relatively self-contained, but to minimise damage to the susceptible crop an alternative food source must be available. In the field-scale trials, this alternative was apparently provided within the field margin as the activity data suggested that many individuals, particularly females, spent relatively little time in the crop, especially during the late winter/early spring period when the crop plants were most vulnerable to heavy grazing (Figure 12). This was perhaps fortuitous, as the number of rabbits was not high enough to deplete the resources in the margins during the crucial period. Consequently, the crop did not come under heavy grazing pressure, damage levels were, on average, light-moderate and yields were subsequently unaffected. In practice, some field margins might not provide such a ready alternative or population density will be too high and the crop will be attacked instead. This occurred in the last crop year 2005-6 when more rabbits were released into the fields and heavy grazing pressure resulted in permanent damage and loss of yield in both treated and untreated wheat. Even though the rabbits showed a preference for the untreated crop, once that had been overgrazed there was no alternative except the treated wheat.
There was little evidence that the use of silica fertilisers could be extended to protect other crops. There appears to be a limit in the amount of silica that plants will absorb that cannot be overridden by higher application rates of fertiliser. The upper limit for oil-seed rape appears to be lower than that for barley, which is lower than that for wheat. Consequently, the natural silica content in the soil together with an application rate of PFS (i.e. 5 t/ha) was unable to boost the plant silica content to the highest possible level in barley and oil-seed rape. PFS application rates needed to do so were considered excessive and thus impractical and the evidence from the trials on captive rabbits suggested that even at the highest levels there would be little or no repellence.
From the results in this project, silica fertilisers appear to offer maximum protection to crops when an alternative food source is readily available and the target’s population density is relatively low. With no alternative food, rabbits appear reluctant to forage further or to abandon burrow systems even when population pressure has increased. It is unlikely to be cost-effective to treat an entire field with these fertilisers, particularly as the area of crop most susceptible to attack is likely to be around the field edge. If rabbit densities are generally low on a farm, wheat crops may be given limited protection by treating the headlands. Reducing rabbit damage along the field edge might support some of Defra’s Environmental Stewardship Schemes whereby farmers instigate land management practices that encourage biodiversity. One such practice is the establishment of conservation headlands in order to allow populations of broadleaved weeds and their associated insects to develop and to provide a feeding habitat for several farmland birds. Use of silica fertilisers may be permitted under some options (e.g. EF9) that involve managing a 6 to 24 m wide headland along the edge of a cereal crop.
SID 5 (2/05) Page 25 of 26
References to published material9. This section should be used to record links (hypertext links where possible) or references to other
published material generated by, or relating to this project.
Cotterill J.V, Watkins R.W., Brennan, C. B., & Cowan D.P. (2007) Boosting wheat leaf silicification to reduce grazing by rabbits. Pest Management Science 63,247-253.
Slag could limit wheat loss – Chemistry & Industry (2006) 24, 8
Slagged off: the rabbits with tummy ache (18-12-2006) Northern Echo (UK)
Rabbits caught on hop by anti-pest powder (18-12-2006) YORKSHIRE POST
FURNACE SLAG ON FIELDS `CAN KEEP RABBITS AWAY' (18-12-2006) PA News By John von Radowitz, PA Science Correspondent
Dust keeps wheat safe from rabbits (18-12-2006) Herald (Glasgow, Scotland)
Slag keeps rabbits out of wheat fields (18-12-2006) UPI Science News
http://www.sciencedaily.com/releases/2006/12/061218081458.htm
http://www.innovations-report.com/html/reports/life_sciences/report-76078.html
http://www.terradaily.com/reports/Slag_keeps_rabbits_out_of_wheat_fields.html
SID 5 (2/05) Page 26 of 26