General enquiries on this form should be made...
25
General enquiries on this form should be made to: Defra, Science Directorate, Management Support and Finance Team, Telephone No. 020 7238 1612 E-mail: [email protected] SID 5 Research Project Final Report SID 5 (Rev. 3/06) Page 1 of 25
Transcript of General enquiries on this form should be made...
General enquiries on this form should be made to:Defra, Science Directorate, Management Support and Finance Team,Telephone No. 020 7238 1612E-mail: [email protected]
SID 5 Research Project Final Report
SID 5 (Rev. 3/06) Page 1 of 18

NoteIn line with the Freedom of Information Act 2000, Defra aims to place the results of its completed research projects in the public domain wherever possible. The SID 5 (Research Project Final Report) is designed to capture the information on the results and outputs of Defra-funded research in a format that is easily publishable through the Defra website. A SID 5 must be completed for all projects.
This form is in Word format and the boxes may be expanded or reduced, as appropriate.
ACCESS TO INFORMATIONThe information collected on this form will be stored electronically and may be sent to any part of Defra, or to individual researchers or organisations outside Defra for the purposes of reviewing the project. Defra may also disclose the information to any outside organisation acting as an agent authorised by Defra to process final research reports on its behalf. Defra intends to publish this form on its website, unless there are strong reasons not to, which fully comply with exemptions under the Environmental Information Regulations or the Freedom of Information Act 2000.Defra may be required to release information, including personal data and commercial information, on request under the Environmental Information Regulations or the Freedom of Information Act 2000. However, Defra will not permit any unwarranted breach of confidentiality or act in contravention of its obligations under the Data Protection Act 1998. Defra or its appointed agents may use the name, address or other details on your form to contact you in connection with occasional customer research aimed at improving the processes through which Defra works with its contractors.
Project identification
1. Defra Project code PS2602
2. Project title
Investigation of gastrointestinal effects of organophosphate/carbamate pesticide residues on young children.
3. Contractororganisation(s)
Health & Safety LaboratoryHarpur HillBuxtonSK17 9JN
54. Total Defra project costs £ 217,631(agreed fixed price)
5. Project: start date................ 01 March 2004
end date................. 31 May 2009
SID 5 (Rev. 3/06) Page 2 of 18
6. It is Defra’s intention to publish this form. Please confirm your agreement to do so...................................................................................YES NO (a) When preparing SID 5s contractors should bear in mind that Defra intends that they be made public. They
should be written in a clear and concise manner and represent a full account of the research project which someone not closely associated with the project can follow.Defra recognises that in a small minority of cases there may be information, such as intellectual property or commercially confidential data, used in or generated by the research project, which should not be disclosed. In these cases, such information should be detailed in a separate annex (not to be published) so that the SID 5 can be placed in the public domain. Where it is impossible to complete the Final Report without including references to any sensitive or confidential data, the information should be included and section (b) completed. NB: only in exceptional circumstances will Defra expect contractors to give a "No" answer.In all cases, reasons for withholding information must be fully in line with exemptions under the Environmental Information Regulations or the Freedom of Information Act 2000.
(b) If you have answered NO, please explain why the Final report should not be released into public domain
Executive Summary7. The executive summary must not exceed 2 sides in total of A4 and should be understandable to the
intelligent non-scientist. It should cover the main objectives, methods and findings of the research, together with any other significant events and options for new work.
Objectives
To recruit a population of >100 children aged 1.5 to 4.5 years old to participate in a prospective study investigating gastrointestinal effects and pesticide residue exposure.
To determine whether there is any association between gastrointestinal effects and pesticide residue exposure (as measured by metabolite levels in urine and faecal samples).
To describe background levels of pesticide residues in urine and faecal samples of healthy children.
Main Findings
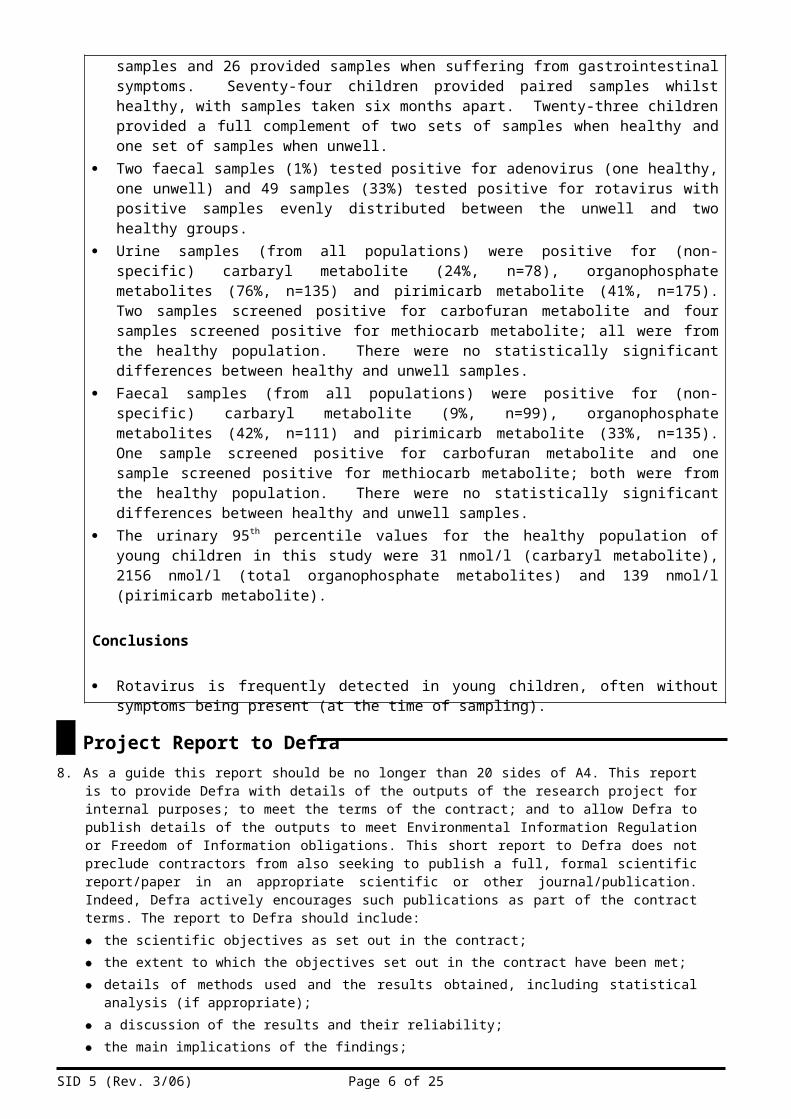
One hundred and thirty six children between the ages of 1.0 and 4.2 years were recruited. Of these, 107 provided background baseline samples and 26 provided samples when suffering from gastrointestinal symptoms. Seventy-four children provided paired samples whilst healthy, with samples taken six months apart. Twenty-three children provided a full complement of two sets of samples when healthy and one set of samples when unwell.
Two faecal samples (1%) tested positive for adenovirus (one healthy, one unwell) and 49 samples (33%) tested positive for rotavirus with positive samples evenly distributed between the unwell and two healthy groups.
Urine samples (from all populations) were positive for (non-specific) carbaryl metabolite (24%, n=78), organophosphate metabolites (76%, n=135) and pirimicarb metabolite (41%, n=175). Two samples screened positive for carbofuran metabolite and four samples screened positive for methiocarb metabolite; all were from the healthy population. There were no statistically significant differences between healthy and unwell samples. Faecal samples (from all populations) were positive for (non-specific) carbaryl metabolite (9%, n=99), organophosphate metabolites (42%, n=111) and pirimicarb metabolite (33%, n=135). One sample screened positive for carbofuran metabolite and one sample screened positive for methiocarb metabolite; both were from the healthy population. There were no
SID 5 (Rev. 3/06) Page 3 of 18

statistically significant differences between healthy and unwell samples. The urinary 95th percentile values for the healthy population of young children in this study
were 31 nmol/l (carbaryl metabolite), 2156 nmol/l (total organophosphate metabolites) and 139 nmol/l (pirimicarb metabolite).
Conclusions
Rotavirus is frequently detected in young children, often without symptoms being present (at the time of sampling).
In this study, samples from children suffering gastrointestinal symptoms are no more associated with anti-cholinergic pesticide metabolite levels or rotaviral infection than samples from healthy children.
Background levels of anti-cholinergic pesticide metabolites in health children are in agreement with previously reported levels.
Project Report to Defra8. As a guide this report should be no longer than 20 sides of A4. This report is to provide Defra with
details of the outputs of the research project for internal purposes; to meet the terms of the contract; and to allow Defra to publish details of the outputs to meet Environmental Information Regulation or Freedom of Information obligations. This short report to Defra does not preclude contractors from also seeking to publish a full, formal scientific report/paper in an appropriate scientific or other journal/publication. Indeed, Defra actively encourages such publications as part of the contract terms. The report to Defra should include: the scientific objectives as set out in the contract; the extent to which the objectives set out in the contract have been met; details of methods used and the results obtained, including statistical analysis (if appropriate); a discussion of the results and their reliability; the main implications of the findings; possible future work; and any action resulting from the research (e.g. IP, Knowledge Transfer).
INTRODUCTIONIt has been suggested that anticholinergic organophosphate and/or carbamate pesticide (OP/C) exposure in humans may cause gastrointestinal (GI) effects and children, having the highest short-term intakes of OP/C residues on a body weight basis, may be at particular risk. This study was designed to help address the question of whether organophosphates (OPs) may have GI effects, a point that has been raised by the Committee on Toxicity (COT). A review (Hughes et al, 2002) of the effects of OP pesticide exposure on young children recommended further work including a biomonitoring survey and greater elucidation of the sources of OP exposure. Non-governmental organisations such as Pesticides Action Network UK have also questioned the possible effects of OP exposure on children. HSL undertook a pilot study for the Department for Environment, Food and Rural Affairs (DEFRA) in collaboration with Sheffield Children’s Hospital (PR1146 – ‘a pilot/feasibility study monitoring possible effects of organophosphate/carbamate (OP/C) pesticide residues on young children and infants’) which
SID 5 (Rev. 3/06) Page 4 of 18

demonstrated that urine and faecal samples could be obtained from young children suffering from GI effects and that HSL’s analytical methodologies were suitable to test for the presence of metabolites of OP/C pesticides in these samples. This pilot study also showed that pesticide metabolites could be detected in samples provided by the healthy children who formed a control population. This follow up study aims to analyse urine and faecal samples for OP/C pesticide metabolites from a larger number of children (n=100), both when healthy and when suffering from gastrointestinal effects. Dietary information will be recorded at the time when samples are provided. It is intended to ascertain any link between GI effects, diet and OP/C pesticide metabolite levels. In this way, our proposal aims to answer questions raised both by COT and consumers regarding whether OP/C exposure from diet can lead to GI effects in young children and, in turn, enable sound and scientifically robust guidance to be provided to the public. Samples from the children when healthy will provide a population to determine background levels of these pesticide metabolites in young children.
The pilot study aimed to determine the feasibility of collecting biological samples from young children (1.5 to 4.5 years) and to analyse those samples for evidence of exposure to organophosphate and carbamate (OP/C) pesticide residues. It was intended that if suitable sample media and analytes could be determined, then the hypothesis that OP/C pesticide residues from dietary sources is a possible cause of acute GI effects in young children could be tested using a full study protocol. The pilot study initially set out to analyse urine samples (and faecal samples where presented) in young children suffering from acute GI symptoms admitted to the accident and emergency department of Sheffield Children’s Hospital. A control population was drawn from the same hospital using children admitted for routine surgery. Parents of participating children also completed a brief questionnaire regarding the recent dietary intake of their child and any possible sources of pesticides in their home (insecticides, flea shampoo etc.). It was proposed that urine (and faecal samples if available) samples would be analysed for metabolites of OP/C pesticides. The pilot study included 15 children suffering from GI problems (urine and/or faecal samples) and 12 controls (urine samples only). As has previously been reported outside the UK, the control population had detectable levels of OP pesticide metabolites in urine. The levels found were comparable with the child population studied by Aprea et al (2000) but significantly higher than for adult control populations in the UK (Cocker et al, 2002). This supports the hypothesis that young children may be at greater risk of ill-health effects from pesticide residues due to: their greater consumption of fruit and vegetables by body weight; and their high levels of floor play and hand to mouth behaviour. However, the samples obtained from the symptomatic population contained lower levels of OP pesticide metabolites. We have suggested that this was due to the time delay between the onset of symptoms and the provision of samples. Some of the children were not admitted to the hospital accident and emergency department until several days after the onset of symptoms and, because of the very nature of the symptoms, had eaten virtually nothing since that time. Metabolites of OP pesticides are mostly eliminated within the first 24 hours when exposure is by the oral route (Griffin et al, 1999; Garfitt et al, 2002). Faecal samples were obtained from some symptomatic children; two of these contained detectable levels of OP metabolites. Metabolites of pirimicarb (a carbamate insecticide) were detected in the control population but not the symptomatic population indicating a possible dietary source of exposure. Urine samples were also analysed for metabolites of N-methyl carbamates. No metabolites were found in the control population, two symptomatic patients screened positive. The response from DEFRA to the PR1146 project report was that, although diet may be a minor source of pesticide exposure, it was worthwhile investigating pesticide metabolite levels in a larger number of symptomatic children and elucidating any link between these levels and dietary intake. The determination of background ranges for OP and carbamate pesticide metabolite levels in a non-symptomatic population was also suggested. The Advisory Committee on Pesticides’ Medical and Toxicology Panel were consulted on the full study protocol and supported DEFRA’s suggestion of determining background population ranges for the various analytes. There was some concern over the influence of viral infection in GI symptoms and how this might compromise the study (some 50% of cases of GI symptoms are thought to be caused by viral infection). Some difficulties were identified during the pilot study that would need to be addressed in any larger, follow up survey to enable a valid testing of the hypothesis that pesticide residues can cause GI effects. These included obtaining sufficient numbers of samples within the time scale, obtaining the samples within 24 hours of the onset of symptoms and a slight age difference between the control and symptomatic populations.
This study aims to determine the background population distribution for OP and carbamate metabolite levels in urine and faeces of young children (1.5 to 4.5 years) by conducting a sufficiently large survey. The survey population will be sampled twice, six months apart, to determine whether season has an
SID 5 (Rev. 3/06) Page 5 of 18
effect on metabolite levels. In addition, the population will be monitored to see if they become symptomatic; if and when they do, they will be sampled to determine whether they have a different distribution of OP and carbamate metabolites. In both surveys the relationship to recent dietary intake, obtained from questionnaires, will be investigated.
SID 5 (Rev. 3/06) Page 6 of 18

Methods
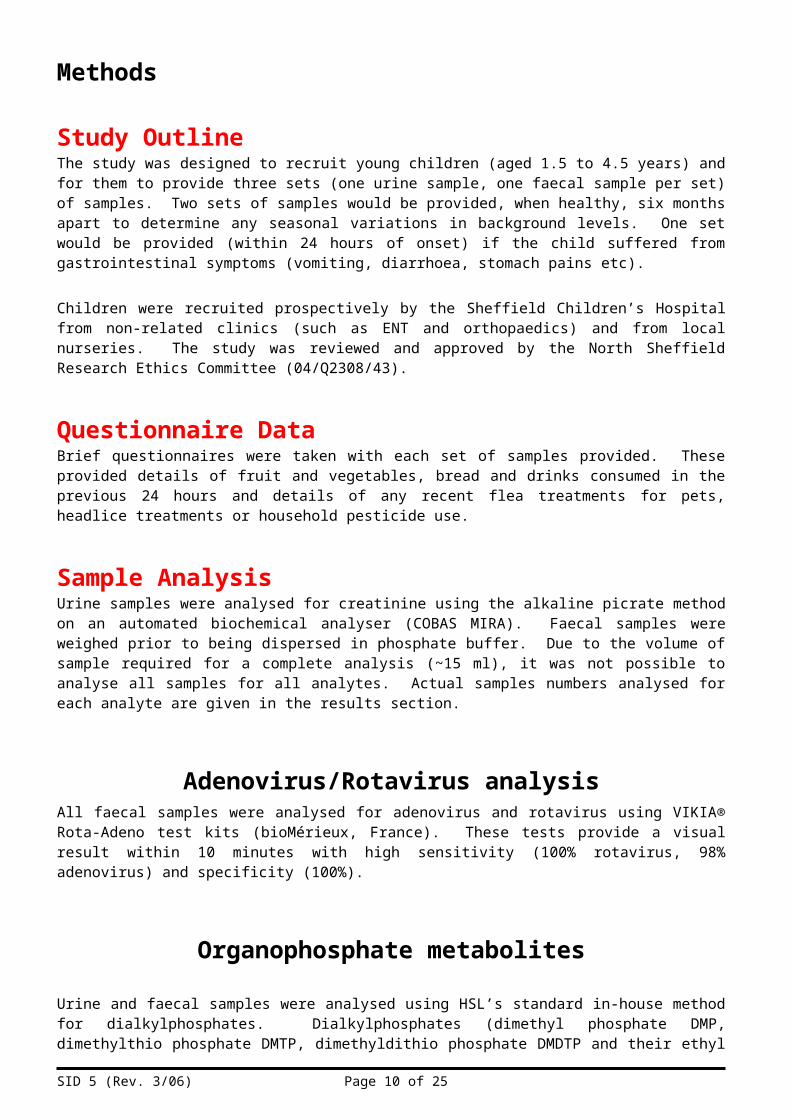
Study OutlineThe study was designed to recruit young children (aged 1.5 to 4.5 years) and for them to provide three sets (one urine sample, one faecal sample per set) of samples. Two sets of samples would be provided, when healthy, six months apart to determine any seasonal variations in background levels. One set would be provided (within 24 hours of onset) if the child suffered from gastrointestinal symptoms (vomiting, diarrhoea, stomach pains etc).
Children were recruited prospectively by the Sheffield Children’s Hospital from non-related clinics (such as ENT and orthopaedics) and from local nurseries. The study was reviewed and approved by the North Sheffield Research Ethics Committee (04/Q2308/43).
Questionnaire DataBrief questionnaires were taken with each set of samples provided. These provided details of fruit and vegetables, bread and drinks consumed in the previous 24 hours and details of any recent flea treatments for pets, headlice treatments or household pesticide use.
Sample AnalysisUrine samples were analysed for creatinine using the alkaline picrate method on an automated biochemical analyser (COBAS MIRA). Faecal samples were weighed prior to being dispersed in phosphate buffer. Due to the volume of sample required for a complete analysis (~15 ml), it was not possible to analyse all samples for all analytes. Actual samples numbers analysed for each analyte are given in the results section.
Adenovirus/Rotavirus analysisAll faecal samples were analysed for adenovirus and rotavirus using VIKIA® Rota-Adeno test kits (bioMérieux, France). These tests provide a visual result within 10 minutes with high sensitivity (100% rotavirus, 98% adenovirus) and specificity (100%).
Organophosphate metabolites
Urine and faecal samples were analysed using HSL’s standard in-house method for dialkylphosphates. Dialkylphosphates (dimethyl phosphate DMP, dimethylthio phosphate DMTP, dimethyldithio phosphate DMDTP and their ethyl analogues (DEP, DETP, DEDTP) are generic metabolites of about 80% of the organophosphates currently registered for use and so give a useful indication of ‘total organophosphate’ exposure although individual pesticide exposures cannot be elucidated.
Aliquots of sample (2 ml) were acidified and extracted into diethyl ether:acetonitrile (50:50 v/v). The organic layer was removed and evaporated under nitrogen. The residue was then reconstituted in acetonitrile and derivatised (40oC, 14 –16 hours) with pentafluorobenzyl bromide (50 μl) in the presence of anhydrous potassium carbonate. Samples were analysed by gas chromatography – mass spectrometry (GC-MS) in negative ion chemical ionisation using Selected Ion Monitoring (m/z 125 DMP, 141 DMTP, 153 DEP, 157 DMDTP, 169 DETP, 185 DEDTP, 209 DBP (dibutyl phosphate, internal standard)). The detection limit is 50 nmol/l and coefficients of variation are < 20%.
SID 5 (Rev. 3/06) Page 7 of 18

Pirimicarb metaboliteUrine and faecal samples were analysed using HSL’s standard in-house method for the specific major pirimicarb metabolite, 2-methylamino-4-hydroxy-5,6-dimethylpyrimidine (MDHP), after hydrolysis. Previous work at HSL has shown that total MDHP gives the most consistent data between individuals given a fixed dose (Sams et al, 2009).
Sample aliquots (2 ml) were alkalised with 0.5M sodium hydroxide and boiled for two hours. After cooling samples were extracted using ChemElut® cartridges (3 ml, unbuffered; Varian, UK) and eluted with 2 x 3 ml ethyl acetate followed by 1 ml 0.1% formic acid in ethyl acetate. The eluate was evaporated under nitrogen and reconstituted in 50% methanol. Analysis was by liquid chromatography – mass spectrometry (LC-MS) using positive electrospray ionisation detecting m/z 154 ([M+H]). Chromatography used a C18 column with a methanol:ammonium formate eluent. The detection limit was 7 nmol/l with a coefficient of variation of 16%.
N-methyl carbamatesExposure to the anticholinergic carbamates carbaryl, carbofuran and methiocarb was determined by measuring their respective metabolites 1-naphthol, 3-hydroxycarbofuran and methiocarb sulphoxide. The carbaryl metabolite, although the major metabolite, is not specific to carbaryl as exposure to naphthalene also gives rise to this metabolite. Naphthalene exposure from the environment is widespread. 3-Hydroxycarbofuran is specific to carbofuran exposure and methiocarb sulphoxide is specific to methiocarb exposure. The method was based on solid phase extraction followed by HPLC-fluorescence with post-column derivatisation.
Sample aliquots (3 ml) were extracted using Isolute 101 cartridges (100 mg, 3 ml; Kinesis, UK) and eluted with 2 x 2 ml acetonitrile. The eluate was evaporated under nitrogen and reconstituted in 50 μl acetonitrile. Chromatography was via a C8 column using a methanol:water gradient. Post-column the carbamates were hydrolysed and derivatised using OPA. Detection was by fluorescence (excitation 330 nm, emission 465 nm). The detection limit was 10 nmol/l for all three carbamates with coefficients of variation of <20%.
Data AnalysisPesticide metabolite levels in each of the three groups (two healthy sample sets and one unwell sample set) were compared using non-parametric one-way ANOVA testing (Kruskal-Wallis test). Where pairs of healthy samples were provided six months apart, the metabolite levels were analysed using the paired t-test. Descriptive statistics were used to describe the background levels of metabolites (from one healthy sample set). Questionnaire answers and rotaviral infection in the three groups were compared using chi-squared and Fisher’s exact tests. Non-parametric one-way ANOVA testing and the Mann-Whitney test were used to explore associations between background levels of metabolites and questionnaire data. Results below the detection limit of an assay were reported as half the limit of detection for statistical analyses.
SID 5 (Rev. 3/06) Page 8 of 18

Results & DiscussionStudy PopulationOne hundred and thirty six children between the ages of 1.0 and 4.2 years were recruited. Of these, 107 provided background baseline samples and 26 provided samples when suffering from gastrointestinal symptoms (one participant only provided samples when unwell). Seventy-four children provided paired samples whilst healthy with samples taken six months apart. Twenty-three children provided a full complement of two sets of samples when healthy and one set of samples when unwell.
Table 1. Description of study population.Mean Range
Age 2.4 years 1.0 – 4.2 years
Weight 13.5 kg 7.8 – 20 kgSex 65 male (60%), 43 female
The study population was subdivided into the three sample sets: two healthy (H1 (also used for determining background levels) and H2 (taken six months later)) and one unwell (U).
The following sections (3.2, 3.4 – 3.6) are based on group analyses, as sample numbers were too small to be analysed on an individual grouped basis. When analysed for a couple of tests there were no significant differences between healthy and unwell samples for individuals (although sample numbers were low).
Adenovirus/Rotavirus analysisTwo faecal samples (1%) tested positive for adenovirus (one healthy, one unwell) and 49 samples (33%) tested positive for rotavirus. with positive samples evenly distributed between the unwell and two healthy groups (Table 2).
Table 2. Results for rotaviral infection.N No. positive % positive
H1 78 28 36H2 48 15 31U 24 6 27
Using non-parametric one-way ANOVA testing there was no significant difference in rotaviral infection rate between the three groups. As expected a proportion of the samples when unwell tested positive for rotavirus, although perhaps less than expected. However it is not certain that the symptoms in these cases were due to viral infection as about a third of children tested positive for rotaviral infection without any symptoms (H1 and H2). It should be noted that the test used only gave a present/absent result and did not quantify the extent of infection. There was no evidence of a seasonal variation in infection prevalence. Three-quarters of children tested the same (either both positive or both negative) for both healthy samples even though they were provided six months apart.
Creatinine AnalysisOne hundred and forty two urine samples were analysed for creatinine. Results ranged from 0.05 mmol/l (which is at the reporting limit of the technique) to 20.78 mmol/l with a mean of 4.11 mmol/l (median 3.54 mmol/l). The WHO guidelines for acceptable creatinine levels to be used for correction in the occupational field are 3 to 30 mmol/l. It is well known that children have much lower creatinine excretion than adults (due to their lower muscle mass). Forty-two percent of the samples analysed in this study were less than 3 mmol/l and 15% were less than 1 mmol/l – in these situations creatinine correction would have resulted in a higher result than the raw data. In light of this data and in agreement with other researchers looking at biomonitoring for young children (O’Rourke et al, 2000) we
SID 5 (Rev. 3/06) Page 9 of 18
have reported all the urinary pesticide metabolite data in nmol/l without creatinine correction. There was no statistically significant difference in creatinine values between the healthy and unwell populations.
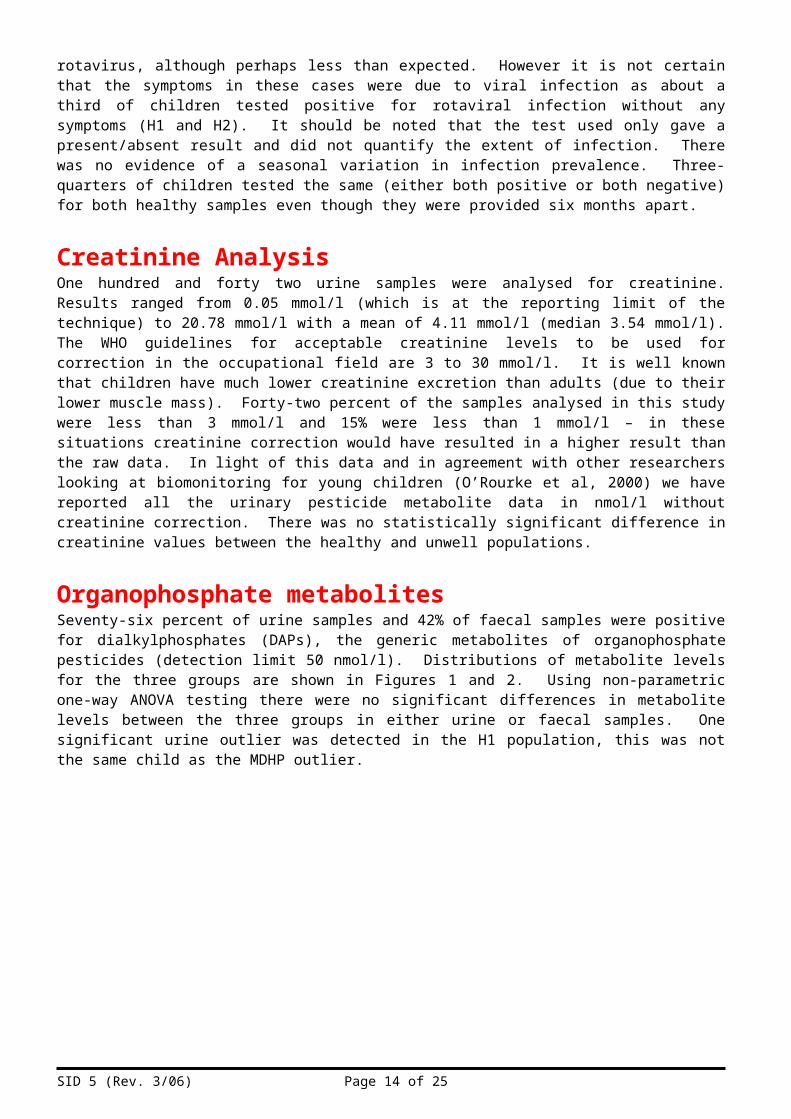
Organophosphate metabolitesSeventy-six percent of urine samples and 42% of faecal samples were positive for dialkylphosphates (DAPs), the generic metabolites of organophosphate pesticides (detection limit 50 nmol/l). Distributions of metabolite levels for the three groups are shown in Figures 1 and 2. Using non-parametric one-way ANOVA testing there were no significant differences in metabolite levels between the three groups in either urine or faecal samples. One significant urine outlier was detected in the H1 population, this was not the same child as the MDHP outlier.
Figure 1. DAP levels in urine samples for baseline healthy (H1, N=72), six-month repeat healthy (H2, N=50) and unwell (U, N=13) groups.
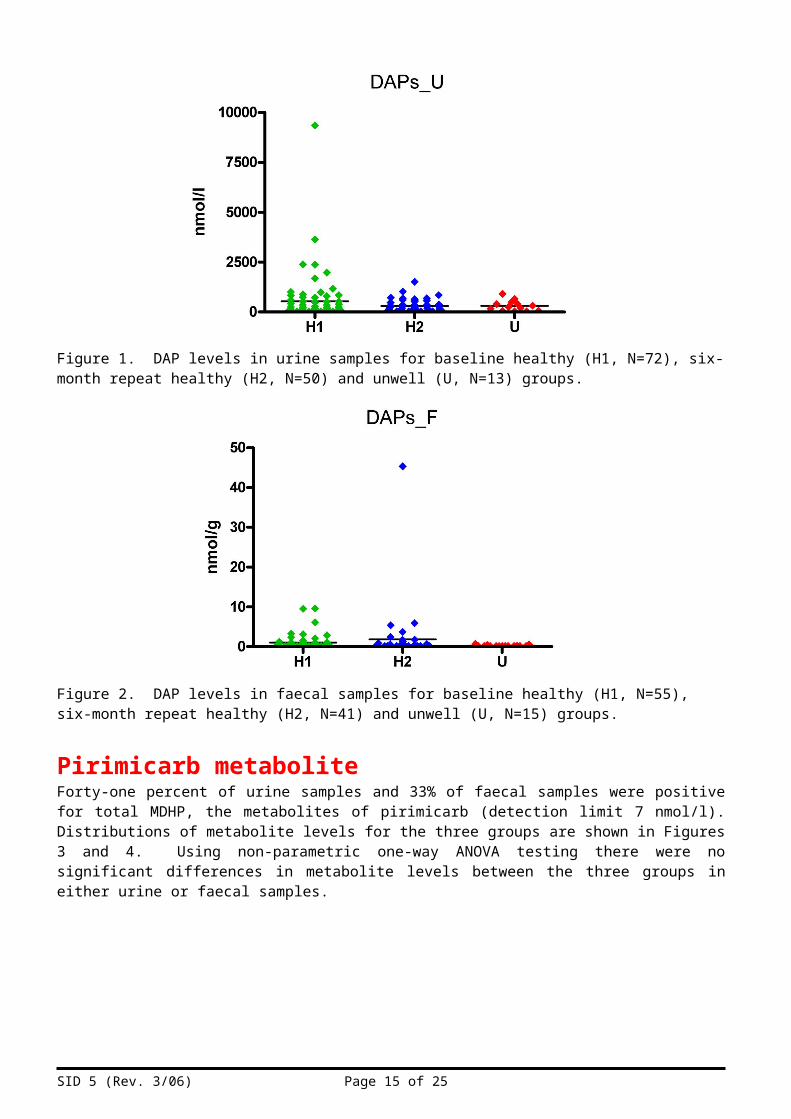
Figure 2. DAP levels in faecal samples for baseline healthy (H1, N=55), six-month repeat healthy (H2, N=41) and unwell (U, N=15) groups.
Pirimicarb metaboliteForty-one percent of urine samples and 33% of faecal samples were positive for total MDHP, the metabolites of pirimicarb (detection limit 7 nmol/l). Distributions of metabolite levels for the three groups are shown in Figures 3 and 4. Using non-parametric one-way ANOVA testing there were no significant differences in metabolite levels between the three groups in either urine or faecal samples.
SID 5 (Rev. 3/06) Page 10 of 18
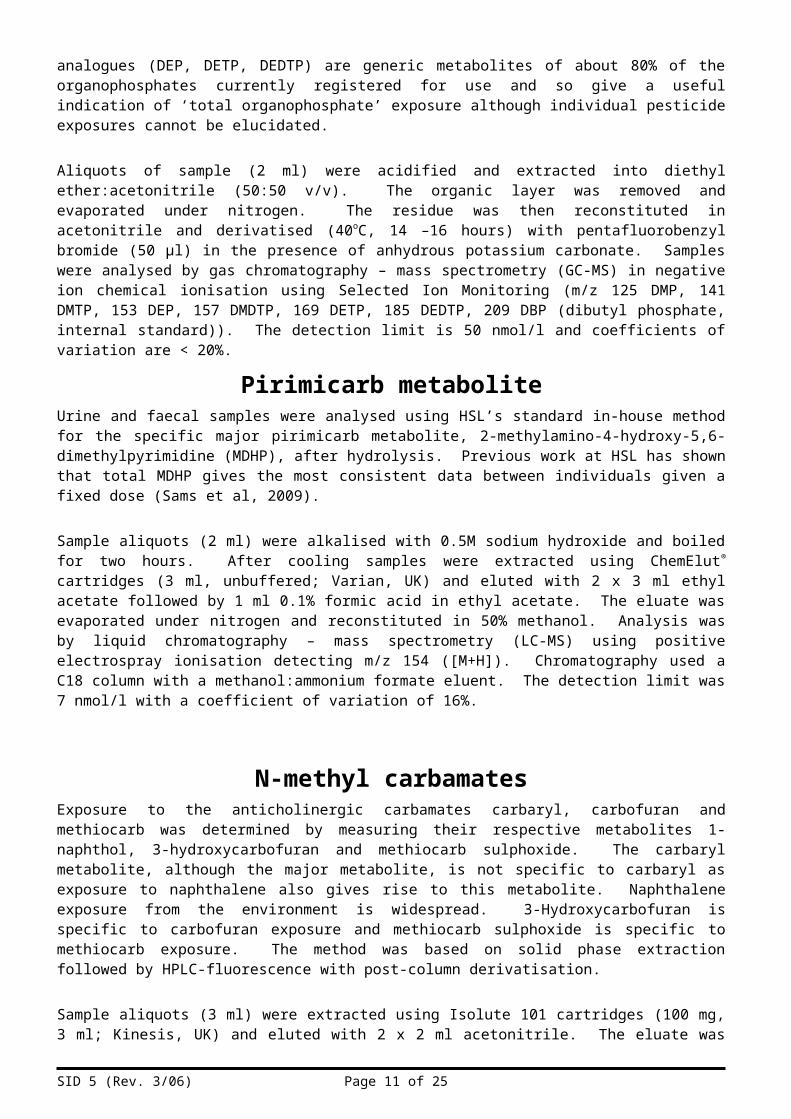
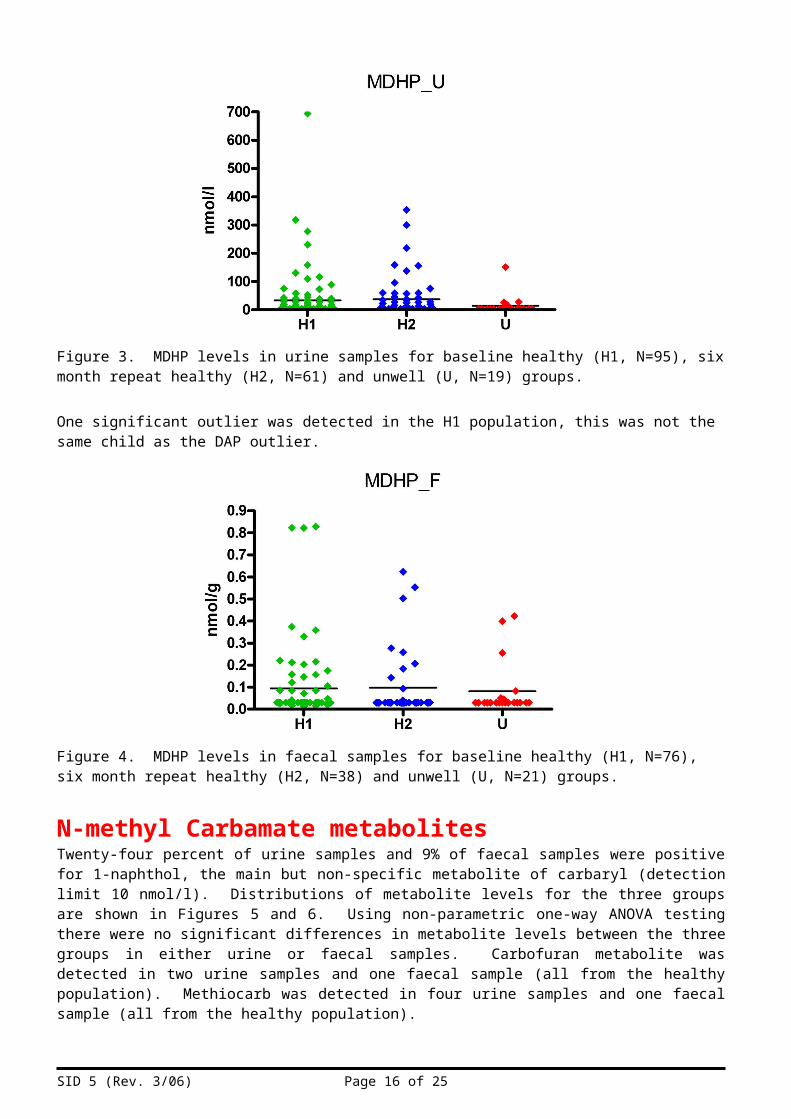
Figure 3. MDHP levels in urine samples for baseline healthy (H1, N=95), six month repeat healthy (H2, N=61) and unwell (U, N=19) groups.
One significant outlier was detected in the H1 population, this was not the same child as the DAP outlier.
Figure 4. MDHP levels in faecal samples for baseline healthy (H1, N=76), six month repeat healthy (H2, N=38) and unwell (U, N=21) groups.
N-methyl Carbamate metabolitesTwenty-four percent of urine samples and 9% of faecal samples were positive for 1-naphthol, the main but non-specific metabolite of carbaryl (detection limit 10 nmol/l). Distributions of metabolite levels for the three groups are shown in Figures 5 and 6. Using non-parametric one-way ANOVA testing there were no significant differences in metabolite levels between the three groups in either urine or faecal samples. Carbofuran metabolite was detected in two urine samples and one faecal sample (all from the healthy population). Methiocarb was detected in four urine samples and one faecal sample (all from the healthy population).
SID 5 (Rev. 3/06) Page 11 of 18

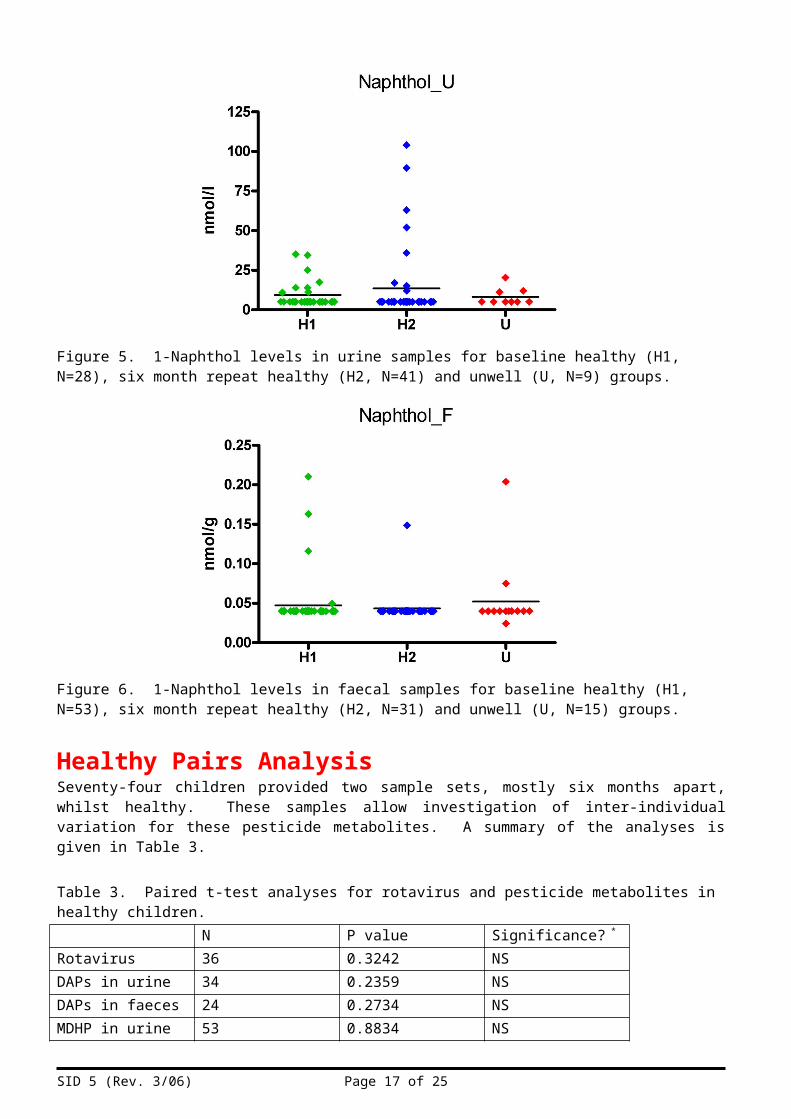
Figure 5. 1-Naphthol levels in urine samples for baseline healthy (H1, N=28), six month repeat healthy (H2, N=41) and unwell (U, N=9) groups.
Figure 6. 1-Naphthol levels in faecal samples for baseline healthy (H1, N=53), six month repeat healthy (H2, N=31) and unwell (U, N=15) groups.
Healthy Pairs AnalysisSeventy-four children provided two sample sets, mostly six months apart, whilst healthy. These samples allow investigation of inter-individual variation for these pesticide metabolites. A summary of the analyses is given in Table 3.
Table 3. Paired t-test analyses for rotavirus and pesticide metabolites in healthy children.N P value Significance? *
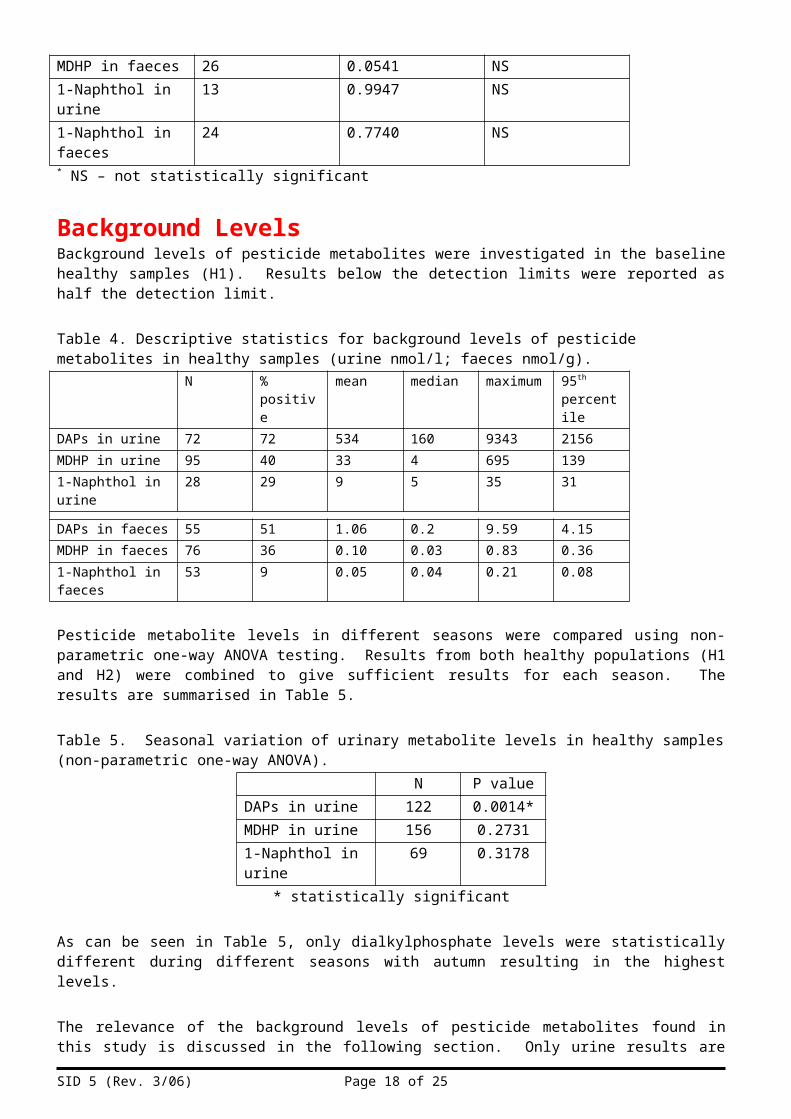
Rotavirus 36 0.3242 NSDAPs in urine 34 0.2359 NSDAPs in faeces 24 0.2734 NSMDHP in urine 53 0.8834 NSMDHP in faeces 26 0.0541 NS1-Naphthol in urine 13 0.9947 NS1-Naphthol in faeces
24 0.7740 NS
* NS – not statistically significant
SID 5 (Rev. 3/06) Page 12 of 18

Background LevelsBackground levels of pesticide metabolites were investigated in the baseline healthy samples (H1). Results below the detection limits were reported as half the detection limit.
Table 4. Descriptive statistics for background levels of pesticide metabolites in healthy samples (urine nmol/l; faeces nmol/g).
N % positive mean median maximum 95th percentile
DAPs in urine 72 72 534 160 9343 2156MDHP in urine 95 40 33 4 695 1391-Naphthol in urine 28 29 9 5 35 31
DAPs in faeces 55 51 1.06 0.2 9.59 4.15MDHP in faeces 76 36 0.10 0.03 0.83 0.361-Naphthol in faeces
53 9 0.05 0.04 0.21 0.08
Pesticide metabolite levels in different seasons were compared using non-parametric one-way ANOVA testing. Results from both healthy populations (H1 and H2) were combined to give sufficient results for each season. The results are summarised in Table 5.
Table 5. Seasonal variation of urinary metabolite levels in healthy samples (non-parametric one-way ANOVA).
N P valueDAPs in urine 122 0.0014*MDHP in urine 156 0.27311-Naphthol in urine 69 0.3178
* statistically significant
As can be seen in Table 5, only dialkylphosphate levels were statistically different during different seasons with autumn resulting in the highest levels.
The relevance of the background levels of pesticide metabolites found in this study is discussed in the following section. Only urine results are discussed as there is no published literature looking at human faecal samples for these analytes.
SID 5 (Rev. 3/06) Page 13 of 18
Urinary organophosphate metabolitesDialkylphosphate metabolites were detected in more than 70% of urine samples from healthy children. This is as expected from previous studies. Levels found are in agreement with previous studies as shown in Table 6. Levels in population H1 are slightly distorted by a few high outliers but still within maximum levels reported from other studies.
Table 6. Comparison of data with reported literature for urinary DAPs (µM).Study N Mean Maximum 95th percentileHSL (H1) 72 0.53 9.34 2.16HSL (H2) 50 0.29 1.51 0.79Curl et al, 2002 211 15.63 0.63Koch et al, 2002 44 0.12 0.61Lu et al, 2001 96 0.24 1.24 0.52HSL (Adults)Cocker et al, 2002
69 0.35 1.41 0.88
Heudorf et al (2006) proposed reference ranges for the German population (they found no age-related differences) as follows: DMP 135 µg/l, DMTP 160 µg/l and DEP 16 µg/l. The healthy population data (H1) fits well with these reference ranges with 95th percentiles of DMP 140 µg/l, DMTP 86 µg/l and DEP 22µg/l, indicating that the UK children in this study have similar pesticide residue exposures to the German population. As can be seen from Table 6 above, the data from this study agree well with previous UK data on adults (Cocker et al, 2002), this is in agreement with Heudorf et al (2006) that there are no age-related differences in dialkylphosphate metabolite levels.
However, it is unlikely that dialkylphosphate levels in urine exclusively reflect exposure to organophosphate pesticides. There is evidence that dialkylphosphate residues are also present on foodstuffs (Jones et al, 2008, Zhang et al, 2008) – if dialkylphosphates are excreted unmetabolised and are less toxic than the parent chemicals then the risk assumed from urinary metabolite levels may be over-estimated. Heudorf et al (2004) estimated that the urinary levels found were several times higher than would be expected from the levels of pesticides detected on foodstuffs, perhaps indicating that urinary levels are also reflecting ingestion of the metabolites.
Urinary pirimicarb metaboliteMDHP was detected in 40% of urine samples from healthy children. The mean MDHP level was 33 nM; this is comparable with the mean for controls in the pilot study (PR1146) of 19 nM. The maximum seen in this study (695 nM) is far in excess of levels seen in the pilot (maximum 52 nM) although it should be noted that the number of samples in this study (N=95) is also much greater than for the pilot study (N=12). There has been little previous work looking at MDHP levels in the general population. Hardt et al (1999) reported no MDHP levels in adult controls using the same detection limit (7 nM, 1 µg/l) as in this study. Using data from a recent volunteer study conducted by HSL (Sams et al, 2009), if the urinary excretion of MDHP is similar in children and adults, an exposure at the ADI for the average weight of child in the study (13.5 kg) would give rise to an expected total MDHP level of 115 to 261 nM (95% confidence interval) in a 24-hour sample. Although this study used single spot samples not 24-hour collections, 97.5% of the samples from the healthy (H1) population are within this expected ADI range.
Urinary carbaryl metabolite1-Naphthol was detected in 29% of urine samples from healthy children. Preuss et al (2004) recommended an upper reference value of 23.5 µg/l (163 nM) for urinary 1-naphthol in young children. All results from this study were well below this, with the maximum value for any sample being 90 nM. As 1-naphthol is also produced following exposure to naphthalene (a widespread airborne pollutant), it is likely that a substantial proportion of a child’s 1-naphthol urinary output results from naphthalene exposure rather than carbaryl exposure.
SID 5 (Rev. 3/06) Page 14 of 18
Questionnaire DataThere were no significant differences (non-parametric one-way ANOVA testing) between the three groups (H1, H2 and U) in terms of exposure to flea treatment or collars for pets, use of head lice shampoo or use of domestic insecticides for ants, aphids, wasps or flies. Similarly there were no significant differences between the groups for consumption of bread, fresh produce (no difference either between organic and non-organic distribution in the three groups) or different types of beverages. The fact that there was no significant difference between the diet of the unwell population (U) compared with the healthy populations (H1 and H2) gives reassurance that children provided samples sufficiently early in their symptoms to still have eaten a normal diet in the preceding 24 hours. This was an issue in the pilot study where children were taken to A&E and by this time had already abstained from food for an extended period of time.
Positive responses to questions about use of flea collar (9%), flea treatment (7%), head lice shampoo (3%) and insecticides for ants (3%), aphids (1%) and wasps/flies (4%) were too few to look at statistically. In addition, only one of the named products could be identified as a potential anti-cholinergic; most were synthetic pyrethroid based.
Levels of individual pesticide metabolites were compared to dietary consumption of bread, fresh produce and beverages. Further details are given below.
Organophosphate metabolitesThe only statistically significant correlation between diet and urinary organophosphate metabolites was that milk consumption was associated with lower DAP metabolites (p=0.035, Mann Whitney) although this was influenced by a single outlier. Removing this outlier the relationship was approaching but not significant (p=0.06). Fruit juice consumption indicated higher DAP levels as did consumption of more fresh produce. Consumption of organic fresh produce was indicative of lower DAP levels. Mutlivariate analysis found no further significant associations.
The only statistically significant correlation between diet and faecal organophosphate metabolites was that fruit juice consumption was associated with higher DAP levels (p=0.014, Mann Whitney).
Pirimicarb metaboliteNo statistically significant associations were found between diet and either urinary or faecal MDHP levels. Organic consumption of fresh produce visually suggested lower MDHP levels in urine.
Carbaryl metaboliteNo statistically significant associations were found between diet and either urinary or faecal 1-naphthol levels. Organic consumption of fresh produce visually suggested lower 1-naphthol levels in urine whilst bread consumption visually suggested higher 1-naphthol levels.
SID 5 (Rev. 3/06) Page 15 of 18
ConclusionsA study has been conducted to look at the possible relationship between gastrointestinal symptoms in young children and their recent exposure to pesticide residues. As planned, in excess of 100 young children (aged 1.0 to 4.2 years) was recruited and 107 healthy baseline samples were provided with 74 providing a second healthy sample approximately six months later. During the study only 26 sample sets were provided by children suffering from gastrointestinal symptoms, despite regular follow-up and reminders. Whether this is a result of ‘non-compliance’ with the study protocol or a lower actual incidence of gastrointestinal symptoms than envisaged is not certain. Twenty-seven percent of the unwell samples were positive for rotavirus however their symptoms cannot necessarily be assigned to the infection as a similar incidence of rotaviral infection was determined in the healthy samples.
Comparing the two healthy sets and the unwell set of samples there were no significant differences in diet, indicating that the prospective design of the study was adequate for sampling children suffering from gastrointestinal symptoms before they started abstaining from food due to their symptoms. Use of the children as their own control meant that no significant differences in diet were expected to be reported for the two healthy sample sets and this was confirmed.
Comparing the two healthy sets and the unwell set of samples there were no significant differences in pesticide metabolite levels. There is therefore no evidence from this study that pesticide residues (as measured by urinary or faecal metabolites) are associated with gastrointestinal symptoms in young children.
There were no age-related differences in pesticide metabolite levels and levels were within background ranges for UK adults where available. However if converting a urinary level back to a potential intake, this will result in children having a higher potential intake (assuming similar absorption and excretion to adults) in dose per kg body weight due to their lower body mass.
The healthy samples were used to generate data of background levels of the measured metabolites in young children. The frequency of detecting metabolites in urine ranged from 29% (1-naphthol) to 70% (dialkylphosphates). The 95th percentiles for each metabolite were within previously reported ranges (where available). There was evidence of some samples (< 3%) potentially exceeding the ADI for pirimicarb and the dialkylphosphates were in agreement with reported literature, some of which has suggested that the levels indicate possible exceedance of ADIs (although this is harder to define for dialkylphosphates as they are generic metabolites for many organophosphate pesticides with widely varying potencies). Although this may indicate some potentially excessive exposures, it should also be noted that recent work has shown that dialkylphosphates themselves may be present on food and then consumed thus over-estimating the risk assumed from the dialkylphosphate level in urine. It is not known whether this is also true for MDHP.
SID 5 (Rev. 3/06) Page 16 of 18
References to published material9. This section should be used to record links (hypertext links where possible) or references to other
published material generated by, or relating to this project.
Aprea C, Strambi M, Novelli MT, Lunghini L, Bozzi N. (2000) Biologic monitoring of exposure to organophosphorus pesticides in 195 Italian children. Environ Health Perspect. Jun;108(6):521-5.Cocker J, Mason HJ, Garfitt SJ, Jones K. (2002) Biological monitoring of exposure to organophosphate pesticides. Toxicol Lett. Aug 5;134(1-3):97-103.Curl CL, Fenske RA, Kissel JC, Shirai JH, Moate TF, Griffith W, Coronado G, Thompson B. (2002). Evaluation of take-home organophosphorus pesticide exposure among agricultural workers and their children. Environ Health Perspect. Dec;110(12):A787-92.Garfitt SJ, Jones K, Mason HJ, Cocker J. (2002). Exposure to the organophosphate diazinon: data from a human volunteer study with oral and dermal doses. Toxicol Lett. Aug 5;134(1-3):105-13.Griffin P, Mason H, Heywood K, Cocker J. (1999). Oral and dermal absorption of chlorpyrifos: a human volunteer study. Occup Environ Med. Jan;56(1):10-3.Hardt J, Appl U, Angerer J. (1999). Biological monitoring of exposure to pirimicarb: hydroxypyrimidines in human urine. Toxicol Lett. Jun 30;107(1-3):89-93.Heudorf U, Angerer J, Drexler H. (2004). Current internal exposure to pesticides in children and adolescents in Germany: urinary levels of metabolites of pyrethroid and organophosphorus insecticides. Int Arch Occup Environ Health. Jan;77(1):67-72. Heudorf U, Butte W, Schulz C, Angerer J. Reference values for metabolites of pyrethroid and organophosphorous insecticides in urine for human biomonitoring in environmental medicine. Int J Hyg Environ Health. 2006 May;209(3):293-9.Hughes J., Capleton A. and Courage, C. (2002). A REVIEW OF THE EFFECTS OF LOW-LEVEL EXPOSURE TO ORGANOPHOSPHATE PESTICIDES ON FETAL AND CHILDHOOD HEALTH. IEH Web Report W11.Jones K., Johnson P., Garner F. (2008). Pilot study into the chemical nature of organophosphate pesticide residues and the implications for urinary metabolite analysis - FSA T10018. HSL Internal Report.Koch D, Lu C, Fisker-Andersen J, Jolley L, Fenske RA. (2002). Temporal association of children's pesticide exposure and agricultural spraying: report of a longitudinal biological monitoring study. Environ Health Perspect. Aug;110(8):829-33.Lu C, Knutson DE, Fisker-Andersen J, Fenske RA. (2001). Biological monitoring survey of organophosphorus pesticide exposure among pre-school children in the Seattle metropolitan area. Environ Health Perspect. Mar;109(3):299-303.O'Rourke MK, Lizardi PS, Rogan SP, Freeman NC, Aguirre A, Saint CG. (2000). Pesticide exposure and creatinine variation among young children. J Expo Anal Environ Epidemiol. Nov-Dec;10(6 Pt 2):672-81.
SID 5 (Rev. 3/06) Page 17 of 18
SID 5 (Rev. 3/06) Page 18 of 18