General Anaesthesia – the Reducing Atelectasis during ...661744/FULLTEXT01.pdf · ACTA...
60
ACTA UNIVERSITATIS UPSALIENSIS UPPSALA 2013 Digital Comprehensive Summaries of Uppsala Dissertations from the Faculty of Medicine 954 Reducing Atelectasis during General Anaesthesia – the Importance of Oxygen Concentration, End-Expiratory Pressure and Patient Factors A Clinical Study Exploring the Prevention LENNART EDMARK ISSN 1651-6206 ISBN 978-91-554-8808-6 urn:nbn:se:uu:diva-209714 of Atelectasis in Adults
Transcript of General Anaesthesia – the Reducing Atelectasis during ...661744/FULLTEXT01.pdf · ACTA...
ACTAUNIVERSITATIS
UPSALIENSISUPPSALA
2013
Digital Comprehensive Summaries of Uppsala Dissertationsfrom the Faculty of Medicine 954
Reducing Atelectasis duringGeneral Anaesthesia – theImportance of OxygenConcentration, End-ExpiratoryPressure and Patient Factors
A Clinical Study Exploring the Prevention
LENNART EDMARK
ISSN 1651-6206ISBN 978-91-554-8808-6urn:nbn:se:uu:diva-209714
of Atelectasis in Adults
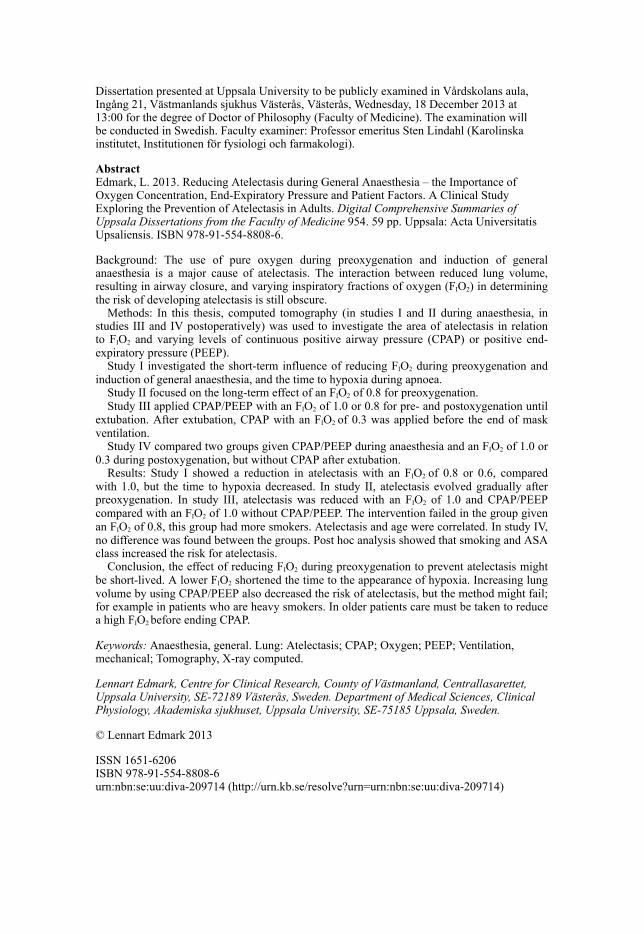
Dissertation presented at Uppsala University to be publicly examined in Vårdskolans aula,Ingång 21, Västmanlands sjukhus Västerås, Västerås, Wednesday, 18 December 2013 at13:00 for the degree of Doctor of Philosophy (Faculty of Medicine). The examination willbe conducted in Swedish. Faculty examiner: Professor emeritus Sten Lindahl (Karolinskainstitutet, Institutionen för fysiologi och farmakologi).
AbstractEdmark, L. 2013. Reducing Atelectasis during General Anaesthesia – the Importance ofOxygen Concentration, End-Expiratory Pressure and Patient Factors. A Clinical StudyExploring the Prevention of Atelectasis in Adults. Digital Comprehensive Summaries ofUppsala Dissertations from the Faculty of Medicine 954. 59 pp. Uppsala: Acta UniversitatisUpsaliensis. ISBN 978-91-554-8808-6.
Background: The use of pure oxygen during preoxygenation and induction of generalanaesthesia is a major cause of atelectasis. The interaction between reduced lung volume,resulting in airway closure, and varying inspiratory fractions of oxygen (FIO2) in determiningthe risk of developing atelectasis is still obscure.
Methods: In this thesis, computed tomography (in studies I and II during anaesthesia, instudies III and IV postoperatively) was used to investigate the area of atelectasis in relationto FIO2 and varying levels of continuous positive airway pressure (CPAP) or positive end-expiratory pressure (PEEP).
Study I investigated the short-term influence of reducing FIO2 during preoxygenation andinduction of general anaesthesia, and the time to hypoxia during apnoea.
Study II focused on the long-term effect of an FIO2 of 0.8 for preoxygenation.Study III applied CPAP/PEEP with an FIO2 of 1.0 or 0.8 for pre- and postoxygenation until
extubation. After extubation, CPAP with an FIO2 of 0.3 was applied before the end of maskventilation.
Study IV compared two groups given CPAP/PEEP during anaesthesia and an FIO2 of 1.0 or0.3 during postoxygenation, but without CPAP after extubation.
Results: Study I showed a reduction in atelectasis with an FIO2 of 0.8 or 0.6, comparedwith 1.0, but the time to hypoxia decreased. In study II, atelectasis evolved gradually afterpreoxygenation. In study III, atelectasis was reduced with an FIO2 of 1.0 and CPAP/PEEPcompared with an FIO2 of 1.0 without CPAP/PEEP. The intervention failed in the group givenan FIO2 of 0.8, this group had more smokers. Atelectasis and age were correlated. In study IV,no difference was found between the groups. Post hoc analysis showed that smoking and ASAclass increased the risk for atelectasis.
Conclusion, the effect of reducing FIO2 during preoxygenation to prevent atelectasis mightbe short-lived. A lower FIO2 shortened the time to the appearance of hypoxia. Increasing lungvolume by using CPAP/PEEP also decreased the risk of atelectasis, but the method might fail;for example in patients who are heavy smokers. In older patients care must be taken to reducea high FIO2 before ending CPAP.
Keywords: Anaesthesia, general. Lung: Atelectasis; CPAP; Oxygen; PEEP; Ventilation,mechanical; Tomography, X-ray computed.
Lennart Edmark, Centre for Clinical Research, County of Västmanland, Centrallasarettet,Uppsala University, SE-72189 Västerås, Sweden. Department of Medical Sciences, ClinicalPhysiology, Akademiska sjukhuset, Uppsala University, SE-75185 Uppsala, Sweden.
© Lennart Edmark 2013
ISSN 1651-6206ISBN 978-91-554-8808-6urn:nbn:se:uu:diva-209714 (http://urn.kb.se/resolve?urn=urn:nbn:se:uu:diva-209714)

To my parents Roland and Bergljot And to my daughter Emma

List of Papers
This thesis is based on the following papers, which are referred to in the text by their Roman numerals.
I. Edmark, L., Kostova-Aherdan, K., Enlund, M., Hedenstierna, G. (2003)
Optimal oxygen concentration during induction of general anesthesia. Anesthesiology, 98:28-33.
II. Edmark, L., Auner U., Enlund, M., Östberg E., Hedenstierna G. (2011)
Oxygen concentration and characteristics of progressive atelectasis formation during anaesthesia. Acta Anaesthesiol Scand., 55(1):75-81.
III. Edmark L., Auner U., Hallén J., Lassinantti-Olowsson L., Hedenstierna
G., Enlund M. Reduction in postoperative atelectasis by continuous positive airway pressure and low oxygen concentration after endotracheal extubation. In manuscript.
IV. Edmark L., Auner U., Lindbäck J., Enlund M., Hedenstierna G.
Atelectasis after anaesthesia: a randomised trial of positive airway pres-sure and low oxygen. Submitted.
Reprints were made with permission from the respective publishers.

Contents
Introduction ................................................................................................... 11
Aims of the studies ........................................................................................ 15
Materials and Methods .................................................................................. 17 Patients ...................................................................................................... 17 Apparatus and monitoring ........................................................................ 17 Anaesthesia ............................................................................................... 18 Ventilation ................................................................................................ 18 Duration of apnoea without desaturation (DAWD) ................................. 20 Computed Tomography of the lungs ........................................................ 20 Arterial Oxygenation ................................................................................ 21 Statistical analysis ..................................................................................... 21 Keeping track of time ............................................................................... 22
Results ........................................................................................................... 23 General ...................................................................................................... 23 Duration of apnoea without desaturation (DAWD) ................................. 24 Computed Tomography of the lungs and the area of atelectasis .............. 24 Oxygenation .............................................................................................. 28 Post hoc analysis of pooled data from studies I-IV .................................. 29
Discussion ..................................................................................................... 33 Duration of apnoea without desaturation (DAWD) ................................. 33
Methodological consideration: Why a short duration of preoxygenation? ................................................................................... 33
Computed Tomography of the lungs and the area of atelectasis .............. 34 The area of atelectasis in the basal CT scans, general observations from study I-II ...................................................................................... 34 How did the investigation of atelectasis and DAWD in the same occasion in study I affect the comparisons between the early (study I) and late 80 % group (study II)? ....................................................... 35 Is there a window of opportunity? ....................................................... 37 The area of atelectasis in the basal CT scans, general observations from study III ........................................................................................ 38 The area of atelectasis in the basal CT scans, general observations from study IV ........................................................................................ 39
More on the topic of lung volumes and small airway closure .................. 39 The end-expiratory lung volume and airway closure .......................... 39 The missing links .................................................................................. 40
Patient factors ........................................................................................... 41 Age and atelectasis .............................................................................. 41 Age and the duration of preoxygenation .............................................. 41 Age and CPAP/PEEP .......................................................................... 42 Smoking and atelectasis ....................................................................... 43
Comments on the post hoc analysis of pooled data from studies I-IV ..... 45 Can lessons be learned from outliers? ...................................................... 45 Oxygenation .............................................................................................. 46
SpO2 as an oxygenation index and correlation to atelectasis .............. 46 SpO2 as an oxygenation index perioperatively .................................... 47
Clinical implications ................................................................................. 49
Conclusions ................................................................................................... 51
Acknowledgements ....................................................................................... 53
References ..................................................................................................... 55
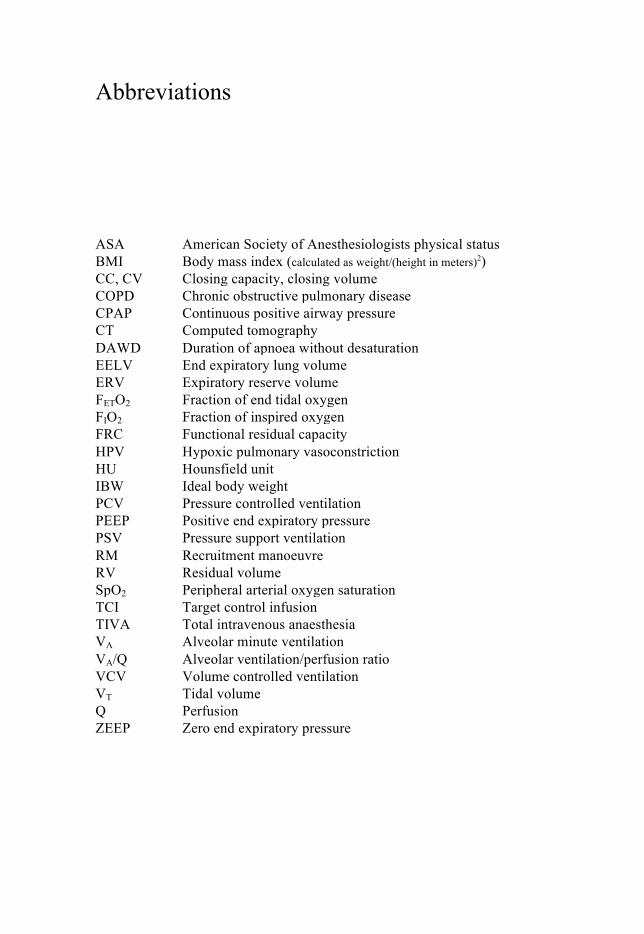
Abbreviations
ASA American Society of Anesthesiologists physical status BMI Body mass index (calculated as weight/(height in meters)2) CC, CV Closing capacity, closing volume COPD Chronic obstructive pulmonary disease CPAP Continuous positive airway pressure CT Computed tomography DAWD Duration of apnoea without desaturation EELV End expiratory lung volume ERV Expiratory reserve volume FETO2 Fraction of end tidal oxygen FIO2 Fraction of inspired oxygen FRC Functional residual capacity HPV Hypoxic pulmonary vasoconstriction HU Hounsfield unit IBW Ideal body weight PCV Pressure controlled ventilation PEEP Positive end expiratory pressure PSV Pressure support ventilation RM Recruitment manoeuvre RV Residual volume SpO2 Peripheral arterial oxygen saturation TCI Target control infusion TIVA Total intravenous anaesthesia VA Alveolar minute ventilation VA/Q Alveolar ventilation/perfusion ratio VCV Volume controlled ventilation VT Tidal volume Q Perfusion ZEEP Zero end expiratory pressure

Preface
The first two studies in this thesis were conceived more than ten years ago, although the second study was published only recently. These two studies were relevant at the time they were designed. However, when the opportuni-ty to expand the research focus arose, the ever changing nature of science and knowledge, as well as a little bit on a personal level, made the last two studies turn in what might appear as quite a new direction. Therefore, it may seem that the two parts come from different perspectives. However, from different angles these studies tell a common story, and put together a main theme emerges.
11
Introduction
A crucial question for the anaesthetist responsible for the high-risk patient during surgery involving general anaesthesia and mechanical ventilation is: what type of lung do we deliver to the post-operative ward?1 The recent identification of ventilator-induced lung injury as a possible mechanism, starting perioperatively2, has made the concept of “lung protective ventila-tion” a serious concern both in the intensive care unit and the operating thea-tre. Applying strategies of lung protective ventilation during general anaes-thesia has produced mixed results. However, according to a recent meta-analysis3, lung protective intraoperative ventilatory settings have “the poten-tial to protect against postoperative pulmonary complications”. The im-portance of reducing the risk of such complications relates to their incidence, and severity4, and the vast number of major surgical procedures undertaken worldwide5 every year. In 2013, a small randomised trial of protective me-chanical ventilation during general anaesthesia showed improved postopera-tive pulmonary function6. The first multicentre study of the benefits of using lung-protective ventilation during anaesthesia for abdominal surgery emerged in the summer of 20137. The lung-protective strategy used in these two trials rests on three pillars: low tidal volumes (VT), positive end-expiratory pressure (PEEP), and the repeated use of a recruitment manoeuvre (RM). It is interesting to note that even though the results in the studies are impressive, we do not really know why the lung-protective strategy is effec-tive.
In the context of this thesis on reducing atelectasis formation during gen-eral anaesthesia in adults, we have to ask if it is possible that some of the positive effects seen in the mentioned studies originated from less “atelec-trauma”, i.e. repetitive opening and closing of dependent lung tissue during anaesthesia with mechanical ventilation, or from reduced area of atelectasis postoperatively?
Etymologically, the term atelectasis refers to incomplete expansion, and in practice, the word has come to indicate collapse of alveoli in the lungs. Ate-lectasis is a pathological condition that is not observed in healthy people but occurs in about 90 % of patients given general anaesthesia. It occurs pre-dominately in the most dependent parts of the lungs8 and impairs oxygena-tion9. The clinical significance of atelectasis might be substantial10. An

12
experimental study linked atelectasis to lung injury11. Reducing atelectasis attenuated bacterial growth and translocation in a study of experimental pneumonia12.
One of the pioneers studying atelectasis was the 19th century German physi-cian Ludwig Lichtheim. He observed that if a lung unit was closed off com-pletely, this unit, if perfused, would collapse in a time frame that was de-pendent on the gas mixture in the unit13. This observation is of critical im-portance, and the mechanism described by Lichtheim is referred to as “static atelectasis” in this thesis. Static atelectasis evolves if, for example, mucous, a tumour, swelling, oedema, pressure, or a foreign body blocks the commu-nication to a lung unit.
In 1933, Beecher14 was the first to show the importance of decreased lung volume after abdominal surgery in the origin of postoperative respiratory failure, and the functional residual capacity (FRC) was identified as “the most important of all volumes”14. Static atelectasis might also evolve if clos-ing capacity (CC) in the lungs exceeds the sum of the functional residual capacity and the tidal volume (VT)15 for some critical time. As long as CC > (FRC + VT) there is widespread closure of small airways, and parts of the lungs are unable to participate in ventilation even during inspiration. The phenomenon of airway closure explains probably most of the age-dependent deterioration in arterial oxygenation, and occurs as soon as CC > FRC. The negative effect will increase as more and more of the fraction of the VT is needed to open up the airway during inspiration16. In the supine position FRC is reduced, which is why airway closure is first revealed in the recum-bent position.
Another way of expressing the impact of airway closure is to address it as a disturbance in the alveolar ventilation (VA) to lung perfusion (Q) relation-ship (VA/Q). Greater and more prominent airway closure reduces ventilation, and the VA/Q ratio declines, although the negative influence can be reduced by hypoxic pulmonary vasoconstriction (HPV)17. A simple way of treating hypoxemia caused by the occurrence of regions in the lungs with low VA/Q is to give extra oxygen. Applying the right amount of extra oxygen, depend-ing on the degree of VA/Q disturbance, will normalise oxygenation com-pletely. In everyday clinical work, we do not normally calculate the degree of VA/Q mismatch, and there is a risk of overdosing oxygen when treating hypoxemia. For every fraction of inspired oxygen (FIO2) there exists a criti-cal inspiratory VA/Q where the expiratory volume decreases to zero. It has been calculated, that this critical VA/Q is increases from about 0.001 to 0.1, as the inspired gas is changed from air to 100 % oxygen18. The lungs com-prise of units with different VA/Q. Units that reach their critical level will not eliminate gas, but they may continue gas uptake until atelectasis develops. The partial pressure difference between gases in the alveoli and the lung
13
capillaries governs the movement of these gases. With 100 % oxygen, also units with very low VA/Q will contribute to oxygenation because of the low partial pressure in mixed venous blood and the function of the haemoglobin dissociation curve. These intricate events, leading to atelectasis, were first suggested by Briscoe et al19 and elucidated further by Dantzker et al18, and these mechanisms leading to alveolar collapse are referred to as “dynamic atelectasis” in this thesis.
Thus, the theoretical backgrounds for understanding both static and dy-namic atelectasis have been known for some time.
Atelectasis also reflects disturbance in the morphology of the lungs, but it was not until the technical advantages offered by computed tomography (CT), that it became possible to diagnose in detail the occurrence of atelecta-sis and to combine this information with the results from other investigations or procedures. Since 1980, the use of CT20 for measuring atelectasis has revealed much new information. In 1985, transmitted compression on the lower part of the lungs by the abdominal viscera was thought to play a cru-cial role in the genesis of atelectasis in adults21. Later, the importance of the oxygen concentration was “rediscovered” and established firmly 22, 23.
In 2003, the importance of opposing airway closure during anaesthesia was demonstrated. Counteracting airway closure before and during induction of general anaesthesia with the use of continuous positive airway pressure (CPAP), followed by a positive end-expiratory pressure (PEEP), completely stopped early atelectasis from developing in spite of preoxygenation with 100 % oxygen. This was first demonstrated in patients with normal weights24 and then in obese patients25. Using CPAP/PEEP in this way also prolonged the period of non-hypoxic apnoea26, 27. It looked like the problem might be solved; i.e., pure oxygen and open lungs working together.
Applying CPAP was not a common feature in anaesthesia ventilators 10 years ago, but is now common in modern ones. With this background in mind, the first two studies should be seen in the perspective of what could be done and what was known before 2003. The last two studies aimed to inves-tigate the importance of oxygen concentration combined with the practise of keeping the lungs open by increasing FRC with CPAP/PEEP before, during, and after anaesthesia.


15
Aims of the studies
Computed tomography was used, when applicable, in adults:
1. To examine the effect of 60 and 80 % oxygen compared with 100 % oxygen during preoxygenation and induction of anaesthesia on the early formation of atelectasis (Study I).
2. To measure the duration of apnoea without desaturation after induction of anaesthesia (Study I).
3. To follow the effects of 60 and 80 % oxygen compared with 100 % oxygen during preoxygenation and induction of anaesthesia on formation of atelectasis 4, 7 and 14 min after the start of preoxygenation (Study II).
4. To follow the time course of atelectasis formation using 80 % oxygen during preoxygenation and induction of anaesthesia 14, 21, 28, and 45 minutes after the start of preoxygenation (Study II).
5. To compare the area of postoperative atelectasis after pre- and postoxy-genation with 100 % oxygen and a ventilatory strategy during anaesthesia, comprising the coherent use of CPAP/PEEP and a reduced fraction of end-tidal oxygen (FETO2) before ending CPAP mask ventilation after extubation with that of a control group after pre- and postoxygenation with 100 % oxy-gen but without CPAP/PEEP and a high FETO2 before ending mask ventila-tion (Study III).
6. To compare the influence of 80 or 100 % oxygen for pre- and post-oxygenation in combination with this ventilatory strategy on the area of postoperative atelectasis (Study III).
7. To compare the influence of 30 or 100 % oxygen for postoxygenation in combination with coherent use of CPAP/PEEP until extubation on the area of postoperative atelectasis (Study IV).
8. To investigate whether using peripheral arterial oxygen saturation (SpO2) as an oxygenation index perioperatively can be used to identify patients with presumed differences in the area of atelectasis (Studies III and IV).

17
Materials and Methods
Patients The Regional Ethics Committee (Uppsala, Sweden) approved the studies. A total of 135 adult patients gave their written informed consent and participat-ed. The last study was registered internationally at ClinicalTrials.gov.
In studies I and II, only non-smoking women with American Society of Anesthesiologists physical status (ASA) class I or II and a body mass index (BMI) of ≤ 31 were enrolled. A total of 36 females were randomised to one of three preoxygenation groups with 60, 80, or 100 % oxygen (in nitrogen if applicable). Preoperative evaluation included haemoglobin level, electrocar-diogram (ECG), arterial blood gases, spirometry, lung volumes and metabol-ic rate. All preoperative values were normal.
In study II, 27 of the patients from study I were included (early group) and 10 women with the same preoperative demographic characteristics as the patients in the early group were studied in a consecutive order (late group).
In study III, 30 non-smoking or smoking patients, excluding those with chronic obstructive pulmonary disease (COPD), with ASA class I-III and a BMI of ≤ 31 were included and randomised to one of three groups. Only routine preoperative evaluation as dictated by departmental policy was per-formed.
In study IV, 60 non-smoking or smoking patients (excluding COPD pa-tients) with ASA class I-III and a BMI of < 35 were included and random-ised to one of two groups. Only routine preoperative evaluation as dictated by departmental policy was performed.
Apparatus and monitoring In all patients, ECG and SpO2 were continuously monitored during anaesthe-sia, as were end-tidal CO2 concentration and end-expiratory oxygen fraction (FETO2). Blood pressure was measured non-invasive and periodically with a CS 3 (Datex-Ohmeda, Helsinki, Finland), Infinity Delta XL (Draeger Medi-cal Ag & Co. KG, Lubeck, Germany), or Philips IntelliVue MP Anesthesia (Philips Medizin Systeme, Boeblingen, Germany) monitor.

18
In studies I and II, the Mentell system was used for ventilation and sponta-neous breathing (Anmedic, Vallentuna, Sweden). In studies III and IV, the Primus Draeger (Draeger Medical Ag & Co. KG) and the Datex-Ohmeda S/5 Avance (GE Healthcare, Datex-Ohmeda, Madison, WI, USA) were used for mechanical ventilation and spontaneous breathing, respectively, with both ventilators functioning as circle systems.
Neuromuscular function was monitored using a neuromuscular train-of-four (TOF) monitor from Draeger (Medical Ag & Co. KG) or the TOF-Watch S (Organon Ltd., Dublin, Ireland).
In studies I and II, a target control infusion (TCI) of propofol was delivered by a Diprifusor target-controlled infusor pump (Astra Zeneca, Macclesfield, Cheshire, United Kingdom). In studies III and IV, a TCI of propofol and remifentanil were delivered by a Care Fusion (Alaris Medical UK Ltd., Hampshire, UK) or the Agilia Injectomat TIVA (Fresenius Vial, Brezius, France).
SpO2 was measured continuously postoperatively with an Infinity Masimo SET (Masimo Corporation, Irvine, CA, USA) or Ohmeda TuffSat (GE Healthcare Finland Oy, Kuortaneenkatu, Helsinki, Finland).
Anaesthesia As a general principle, patients did not receive sedative premedication. However, on request, some patients were given a benzodiazepine, but the number of such patients did not differ between the randomisation groups. In all four studies patients were investigated during (studies I and II) or after (studies III and IV) total intravenous anaesthesia (TIVA) with a TCI of propofol. In studies I and II, repeated doses of fentanyl and alfentanil com-plemented propofol, whereas in studies III and IV, a TCI of remifentanil was added. TIVA was administered in accordance to clinical signs of the depth of anaesthesia. To facilitate endotracheal intubation, in studies I, II, and III, rocuronium was given at a dose of ~0.5 mg/kg ideal body weight (IBW)28. All patients were checked for residual muscle relaxation block.
In study IV, a laryngeal mask airway was used without a muscle relaxant. To eliminate the postoperative need for opiates in all patients in studies III and IV, local anaesthesia complemented TIVA.
Ventilation Preoxygenation lasted for 1 min before any anaesthetic drugs were given in all studies. Thereafter, induction of anaesthesia started, and the patients lost consciousness progressively. When spontaneous breathing ceased gradually,
19
ventilation was assisted through the mask. During preoxygenation and in-duction of anaesthesia a fresh gas flow of 6-8 L/min was used to avoid re-breathing and improve denitrogenation. In studies I and II, patients were randomised to one of three preoxygenation groups of 60, 80, or 100 % oxy-gen. The late group in study II comprised 10 consecutive patients who re-ceived 80 % oxygen for preoxygenation.
In studies I and II, patients breathed and were mechanically ventilated in volume-controlled ventilation (VCV) mode through the Mentell system, a hybrid low-flow anaesthetic circuit29. This circuit had a built-in PEEP of 3 cmH2O; no other level of PEEP was used. During maintenance of anaesthesia, a standard ventilatory setting was used, comprising 40 % inspir-atory oxygen in nitrogen, a VT of 10 mL/kg and a respiratory rate of 12 breaths/min. Normocapnia, defined as an end-tidal CO2 concentration of 4-6 %, was achieved by adjusting the fresh gas flow.
In studies III and IV, ventilators based on a circle system with advanced features were used in different modes and different levels of CPAP/PEEP according to the randomisation. During maintenance of anaesthesia a stand-ard ventilatory setting was used, which comprised 30-40 % inspiratory oxy-gen in nitrogen, a VT of 6-7 mL/kg IBW and a respiratory rate of 8-11 breaths/min. Normocapnia (CO2 concentration 4-6 %) was achieved by ad-justing the minute ventilation.
In study III, two intervention groups were placed on 6 cmH2O CPAP/PEEP from the start of preoxygenation to the end of mask ventilation after extubation; one group received 80 and the other 100 % oxygen during pre- and postoxygenation. In both groups, breathing by mask (CPAP 6 cmH2O) with 30 % oxygen was started after extubation and aimed at an FETO2 ≤ 0.30. When patients in these intervention groups where spontane-ously breathing, the ventilator was in the pressure-support ventilation (PSV) mode and during controlled ventilation in the pressure-controlled ventilation (PCV) mode. In the control group in study III, no CPAP/PEEP was applied, and 100 % oxygen was used for pre- and postoxygenation, including the period by mask breathing after extubation. When spontaneous breathing ceased in the control group, ventilation was assisted manually, and during controlled ventilation the ventilator was set to VCV mode.
In study IV, 100 % oxygen was used for preoxygenation in both groups. The ventilator was in PSV mode with CPAP at 6-8 cmH2O during spontan-eous breathing. During maintenance of anaesthesia, a standard ventilatory setting was used as described with the ventilator in the PCV- volume guaran-teed mode and a PEEP of 6-8 cmH2O. CPAP/PEEP was set to 6 cmH2O when BMI was <25, to 7 cmH2O when BMI was 25-30, and to 8 cmH2O when BMI was ≥30. In study IV patients were randomised to postoxygena-tion with 30 or 100 % oxygen before extubation. After extubation all patients immediately breathed air.

20
Duration of apnoea without desaturation (DAWD) DAWD was investigated in study I. Before recording DAWD, anaesthesia was induced after 1 min of strict preoxygenation. The recording of DAWD started at the time mask ventilation ended before intubation, and stopped when SpO2 reached 90 %. Anaesthesia was induced with the patient in a strict horizontal position on the CT table. Endotracheal intubation was per-formed at the beginning of the apnoea, and in all patients, the tube could be seen passing the vocal cords. All patients were intubated on the first attempt and correct placements were confirmed on the CT scan. During the record-ing of DAWD, the endotracheal tube was left open to air.
Computed Tomography of the lungs Throughout the studies, the lungs were investigated with CT using a stand-ardised procedure. All CT scans were transverse single-slice with 5 mm thickness. All studies included a basal scan 10-20 mm above the dome of the right diaphragm. The patient was placed in the supine position with the arms parallel to the body. All scans were performed in apnoea at the end of expi-ration.
In studies I and II, a control scan was taken in alert patients to exclude any atelectasis before anaesthesia. Remaining scans in studies I and II were performed during anaesthesia at different time points as measured from the start of preoxygenation. In studies III and IV, CT scans were performed only postoperatively.
The radiologist was unaware of the group affiliation of individual patients when the examining the CT scans. The atelectasis area in the scans was cal-culated using the region of interest (ROI) program included in the CT com-puter software. To trace the atelectasis, the window level and width were set at -500 and ±1500 Hounsfield units (HU), respectively. Atelectasis was de-fined as area with attenuation values between -100 and +100 HU and was expressed in cm2 and as a percentage of the total area of the lung in a par-ticular scan8. The dorsal border was drawn manually between the atelectasis and the pleura. The ventral border was drawn manually between atelectasis and adjacent aerated lung area. The atelectasis area was calculated using the software program. Each ROI was redrawn twice, and the mean value was used.
When presenting results for the area of atelectasis, the aim is to display data in both cm2 and per cent, however this is not always appropriate. When comparing data with those of earlier studies, the choice of data presentation in earlier studies governs the presentation in the present studies. A simple rule of thumb is to remember that atelectasis expressed in cm2 corresponds approximately to half the value when expressed in percentage of the lung

21
area, and consequently atelectasis expressed in percentage corresponds to twice the value in cm2.
Another source of inconsistency relates to presenting descriptive statisti-cal data as mean ± SD or as median and range (minimum to maximum), the former is used when indicated by comparisons with earlier studies.
The smallest possible value of atelectasis area that can be detected by CT30 has been assumed to be 0.1 cm2. The theoretical resolution of CT is most likely greater than the inter-observer variability. However, even with this in mind, radiologists might report atelectasis as differing in size, but seldom disagree on the fact that atelectasis is present or not.
Arterial Oxygenation In studies III and IV, oxygenation was estimated by measuring SpO2 with the patient breathing air before the start of preoxygenation. In study III, SpO2 was measured twice during stable anaesthesia with the patients ventilated with air. In studies III and IV, oxygenation was estimated continuously post-operatively after the end of mask ventilation.
Statistical analysis The average and spread of data are described by median and range. In stud-ies I, II, and III, the sample size was based on the assumption that a differ-ence in the area of atelectasis of 50 % or more would be of clinical im-portance. In study IV the secondary dependent variable, SpO2, determined the sample size. In all instances, α = 0.05 and 1- β = 0.8 were assumed. This implied that 10-12 patients would be needed in each group in studies I-III and 30 patients in each group in study IV. In study IV the number of patients also included a margin for a high variability.
Few patients were included in studies I, II, and III, and the main variables were not assumed to have a normal distribution; therefore non-parametric tests were used to compare groups. The Kruskal-Wallis one-way analysis of variance was used to compare data between the three groups in study I. The Wilcoxon matched-pairs signed-rank test or the Mann-Whitney U test was used to compare two groups. In study III the Spearman rank correlation coef-ficient was used to analyse relationships between variables, and the Willett’s residual method for post hoc adjustment of the results was used to control for the influence of effect modifiers31. For post hoc comparisons, Fisher’s exact test was used to analyse the occurrence of uneven distribution of potential effect modifiers.
22
In the post hoc analysis, because of the use of repeated comparisons, the results in the late group in study II were modified using Bonferroni correc-tion. The correction was based on calculation of the cumulative Type I error and adjusting for the number of comparisons. Assuming an unadjusted α = 0.05 and performing four comparisons, the adjusted α was 0.0125. Data in the late group was also analysed using a mixed model regression analysis with random effects for patients, and common effects for time and time squared, with α = 0.05.
Keeping track of time A professional sport watch with built-in memory was used during all studies, and the timer was started exactly as preoxygenation began. Specific peri-operative events were stored in sequential order as laps, and the time corre-sponding to the events could be retrieved from the watch memory.
23
Results
General No adverse effects were observed in connection to the studies. General demographic data for the 135 patients are presented in Table 1. Table 1. Demographic characteristics of patients in studies I-IV (mean ± SD). Patients were classified to the control- or intervention group; for definitions see the text.
Σ N=135 Controls Intervention group Patients (n) 62 73 Age (years) 50±12 52±10 Sex (M/F) 13/49 23/50 Height (cm) 169±8 170±9 Weight (kg) 72±12 77±15 BMI (kg/m2) 25.4±3.2 26.4±3.7 ASA (n) I, II, III 41, 16, 5 48, 23, 2 Smokers 15/47 14/59
In this table, the patients are grouped into the control or intervention group. Sixty-two patients were classified into the control group, which comprised 12 patients from study I (100 % oxygen during preoxygenation), 10 patients from study II (80 % oxygen during preoxygenation, late group), 10 patients from study III (100 % oxygen during preoxygenation, no CPAP/PEEP), and 30 patients from study IV (100 % during both pre- and postoxygenation). Seventy-three patients were classified into the intervention group, which comprised 24 patients from study I (60 or 80 % oxygen during preoxygena-tion), 20 patients from study III (80 or 100 % oxygen during preoxygenation, 6 cmH2O CPAP/PEEP), and 29 patients from study IV (100 % oxygen dur-ing preoxygenation, 30 % oxygen during postoxygenation).
The rationale for this division was based on the findings of the primary studies, in which patients had been randomly assigned to either a control or an intervention group. However, as explained later, the patients in the late group in study II were not classified into the combined intervention group but were assigned to the control group. The data from the 24 patients from study I, who were classified into the combined intervention group, were not
24
included in the analysis of the effect of intervention on the area of atelecta-sis; this is also explained later.
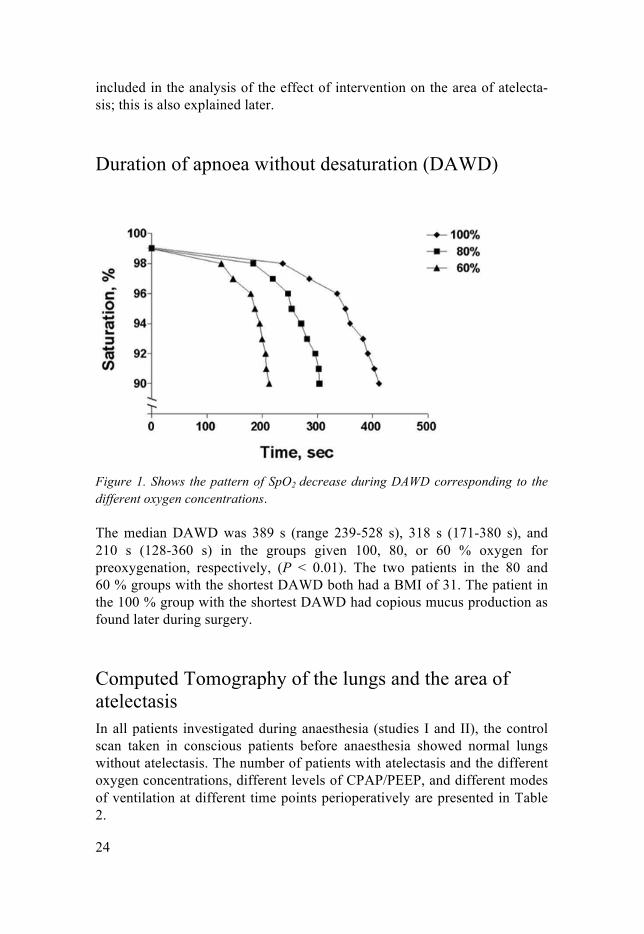
Duration of apnoea without desaturation (DAWD)
Figure 1. Shows the pattern of SpO2 decrease during DAWD corresponding to the different oxygen concentrations. The median DAWD was 389 s (range 239-528 s), 318 s (171-380 s), and 210 s (128-360 s) in the groups given 100, 80, or 60 % oxygen for preoxygenation, respectively, (P < 0.01). The two patients in the 80 and 60 % groups with the shortest DAWD both had a BMI of 31. The patient in the 100 % group with the shortest DAWD had copious mucus production as found later during surgery.
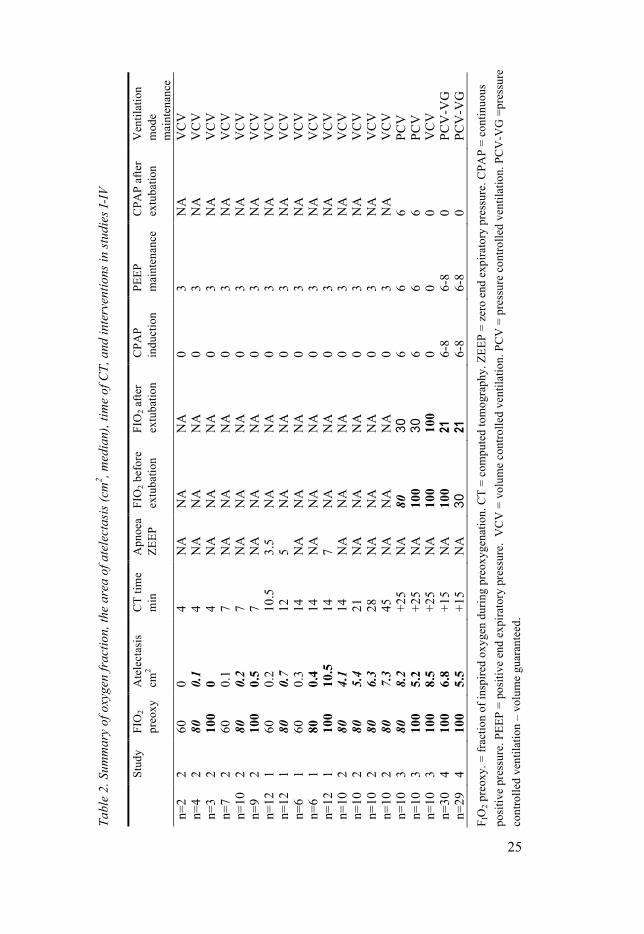
Computed Tomography of the lungs and the area of atelectasis In all patients investigated during anaesthesia (studies I and II), the control scan taken in conscious patients before anaesthesia showed normal lungs without atelectasis. The number of patients with atelectasis and the different oxygen concentrations, different levels of CPAP/PEEP, and different modes of ventilation at different time points perioperatively are presented in Table 2.
Tabl
e 2.
Sum
mar
y of
oxy
gen
frac
tion,
the
area
of a
tele
ctas
is (c
m2 , m
edia
n), t
ime
of C
T, a
nd in
terv
entio
ns in
stud
ies I
-IV
St
udy
FIO
2 pr
eoxy
A
tele
ctas
is
cm2
CT
time
m
in
Apn
oea
ZEEP
FI
O2 b
efor
e ex
tuba
tion
FIO
2 afte
r ex
tuba
tion
CPA
P in
duct
ion
PEEP
m
aint
enan
ce
CPA
P af
ter
extu
batio
n V
entil
atio
n m
ode
m
aint
enan
ce
n=2
2 60
0
4 N
A
NA
N
A
0 3
NA
V
CV
n=
4 2
80
0.1
4 N
A
NA
N
A
0 3
NA
V
CV
n=
3 2
100
0 4
NA
N
A
NA
0
3 N
A
VC
V
n=7
2 60
0.
1 7
NA
N
A
NA
0
3 N
A
VC
V
n=10
2
80
0.2
7 N
A
NA
N
A
0 3
NA
V
CV
n=
9 2
100
0.5
7 N
A
NA
N
A
0 3
NA
V
CV
n=
12
1 60
0.
2 10
.5
3.5
NA
N
A
0 3
NA
V
CV
n=
12
1 80
0.
7 12
5
NA
N
A
0 3
NA
V
CV
n=
6 1
60
0.3
14
NA
N
A
NA
0
3 N
A
VC
V
n=6
1 80
0.
4 14
N
A
NA
N
A
0 3
NA
V
CV
n=
12
1 10
0 10
.5
14
7 N
A
NA
0
3 N
A
VC
V
n=10
2
80
4.1
14
NA
N
A
NA
0
3 N
A
VC
V
n=10
2
80
5.4
21
NA
N
A
NA
0
3 N
A
VC
V
n=10
2
80
6.3
28
NA
N
A
NA
0
3 N
A
VC
V
n=10
2
80
7.3
45
NA
N
A
NA
0
3 N
A
VC
V
n=10
3
80
8.2
+25
NA
80
30
6
6 6
PCV
n=
10
3 10
0 5.
2 +2
5 N
A
100
30
6 6
6 PC
V
n=10
3
100
8.5
+25
NA
10
0 10
0 0
0 0
VC
V
n=30
4
100
6.8
+15
NA
10
0 21
6-
8 6-
8 0
PCV
-VG
n=
29
4 10
0 5.
5 +1
5 N
A
30
21
6-8
6-8
0 PC
V-V
G
F IO
2 pre
oxy.
= fr
actio
n of
insp
ired
oxyg
en d
urin
g pr
eoxy
gena
tion.
CT
= co
mpu
ted
tom
ogra
phy.
ZEE
P =
zero
end
exp
irato
ry p
ress
ure.
CPA
P =
cont
inuo
us
posi
tive
pres
sure
. PEE
P =
posi
tive
end
expi
rato
ry p
ress
ure.
VC
V =
vol
ume
cont
rolle
d ve
ntila
tion.
PC
V =
pre
ssur
e co
ntro
lled
vent
ilatio
n. P
CV
-VG
=pr
essu
re
cont
rolle
d ve
ntila
tion
– vo
lum
e gu
aran
teed
.
25

26
Performing the scanning procedure, including positioning the patients in studies I and II, took 1.5 min. Intubation was complete after 5.5 min after the start of preoxygenation (i.e., 4.5 min after start of induction in studies I and II.) The results from 4 to 45 min apply to the patients in studies I and II investigated during anaesthesia.
4 min: A total of nine patients with a PEEP of 3 cmH2O were studied 4 min after the start of preoxygenation (i.e., only 3 min after start of induction. Regardless of oxygen concentration, atelectasis was negligible.
7 min: A total of 26 patients with a PEEP of 3 cmH2O were studied 7 min after the start of preoxygenation (i.e., 6 min after start of induction and 1.5 min after intubation). Tiny areas of atelectasis were found in all oxygenation groups, but the areas were slightly larger with 100 % oxygen.
10.5-14 min: A total of 36 patients with a PEEP of 3 cmH2O were studied 10.5, 12, and 14 min after the start of preoxygenation. This corresponded to 9.5, 11, and 13 min after the start of induction and 5, 6.5 and 8.5 min after intubation in the groups given 60, 80, and 100 % oxygen for preoxygenation, respectively (n = 12 patients in each group). The scans taken at these occa-sions were performed after a period of apnoea (3.5, 5, and 7 min) corre-sponding to the different oxygenation levels used during preoxygenation. Small areas of atelectasis were found in the groups given 60 or 80 % oxygen during preoxygenation, and large areas of atelectasis were present in the 100 % group (P < 0.001).
14 min: A total of 12 patients, six given 60 % and six given 80 % oxygen during preoxygenation, with a PEEP of 3 cmH2O, were studied 14 min after the start of preoxygenation (i.e., 13 min. after start of induction and 8.5 min. after intubation.) These 12 patients were also investigated immediately after a period of apnoea, as reported in the preceding paragraph, which allowed us to compare the area of atelectasis after apnoea with the area after some more minutes with controlled ventilation in the same patients. This also made it possible to compare atelectasis at the same time point, 14 min after the start of preoxygenation, in all three oxygenation groups. Only small areas of ate-lectasis of similar size were found regardless of whether the oxygen concen-tration was 60 or 80 %, or the timing of the CT scans.
14-45 min: A total of 10 non-randomised, consecutive patients, all given 80 % oxygen during preoxygenation and induction, and 40 % oxygen during maintenance of anaesthesia with a PEEP of 3 cmH2O, were studied 14, 21, 28, and 45 min after the start of preoxygenation. In contrast to the patients
27
reported in the preceding paragraphs, apnoea tolerance time was not investi-gated in this trial.
The median areas of atelectases at the referred time points were 4.1 cm2
(range 1.3-12.3 cm2), 5.4 cm2 (1.7-16 cm2), 6.3 cm2 (1.8-18 cm2), and 7.3 cm2 (2.0-21 cm2), respectively. The median areas of atelectasis expressed as a percentage of the total lung area were 2.3 % (range 0.8-7.7 %), 2.9 % (1.0-9.8 %), 3.5 % (1.1-11.0 %), and 4.2 % (1.1-12.8 %), respectively.
Wilcoxon signed-ranks tests to compare the areas of atelectasis between awake and 14 min, between 14 and 21 min, between 21 and 28 min, and between 28 and 45 min, showed that, after a Bonferroni correction, the two first comparisons (both P = 0.005) were significant, but the last two were not significant (both P = 0.028), P = 0.0125. In a post hoc analysis of a common time effect for all patients, we found a quadratic function of time, with a linear term showing an increase of atelectasis of 0.3 cm2 per min, (P = 0.002), while the quadratic term showed that this effect gradually decreased with 0.004 cm2 per min squared (P = 0.002).
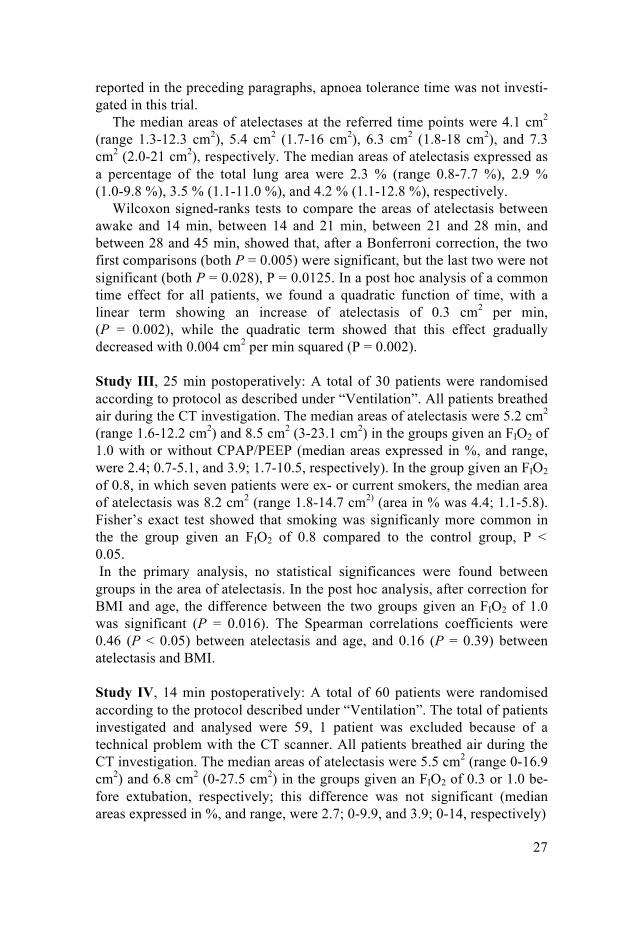
Study III, 25 min postoperatively: A total of 30 patients were randomised according to protocol as described under “Ventilation”. All patients breathed air during the CT investigation. The median areas of atelectasis were 5.2 cm2 (range 1.6-12.2 cm2) and 8.5 cm2 (3-23.1 cm2) in the groups given an FIO2 of 1.0 with or without CPAP/PEEP (median areas expressed in %, and range, were 2.4; 0.7-5.1, and 3.9; 1.7-10.5, respectively). In the group given an FIO2 of 0.8, in which seven patients were ex- or current smokers, the median area of atelectasis was 8.2 cm2 (range 1.8-14.7 cm2) (area in % was 4.4; 1.1-5.8). Fisher’s exact test showed that smoking was significanly more common in the the group given an FIO2 of 0.8 compared to the control group, P < 0.05. In the primary analysis, no statistical significances were found between groups in the area of atelectasis. In the post hoc analysis, after correction for BMI and age, the difference between the two groups given an FIO2 of 1.0 was significant (P = 0.016). The Spearman correlations coefficients were 0.46 (P < 0.05) between atelectasis and age, and 0.16 (P = 0.39) between atelectasis and BMI.
Study IV, 14 min postoperatively: A total of 60 patients were randomised according to the protocol described under “Ventilation”. The total of patients investigated and analysed were 59, 1 patient was excluded because of a technical problem with the CT scanner. All patients breathed air during the CT investigation. The median areas of atelectasis were 5.5 cm2 (range 0-16.9 cm2) and 6.8 cm2 (0-27.5 cm2) in the groups given an FIO2 of 0.3 or 1.0 be-fore extubation, respectively; this difference was not significant (median areas expressed in %, and range, were 2.7; 0-9.9, and 3.9; 0-14, respectively)

28
The post hoc analysis using the exact Wilcoxon test showed a significant difference (P = 0.038) in the square root of the area of atelectasis between non-smokers, defined as patients (n = 41) smoking less than 6 pack-years compared with smoking patients (n = 18), defined as smoking more than 6 pack-years (median 22; range 7-43 pack-years). The median areas of ate-lectasis were 5.4 cm2 (range 0-19.1 cm2) in non-smokers, and 9.0 cm2 (1.3-27.5 cm2) in smokers.
The median atelectasis areas were 5.3 cm2 (range 0-11.5 cm2) in ASA class I patients (n=34) and 8.7 cm2 (1.3-27.5 cm2) in ASA class II-III pa-tients (n=25). The difference in the square root area of atelectasis between these two groups was also significant (P = 0.015). Finally, we performed post hoc analysis of the interaction between being a non-smoker or smok-er/ex-smoker and ASA class. The areas of atelectasis in the group of smok-er/ex-smoker did not differ from the group of non-smoker, neither if classi-fied as ASA class I, nor for those classified as ASA II-III.
Oxygenation Table 3 shows the SpO2 of patients breathing air before the start of preoxy-genation in the different groups in studies III and IV, during test 1 and 2 with the patients ventilated with air during anaesthesia in study III, and postopera-tively in the different groups in studies III and IV.
Table 3. Peripheral oxygen saturation, (SpO2) in % (median and range) in the study groups measured with FIO2 = 0.21.
FIO2 1.0, 1.0, 1.0 ZEEP
FIO2 1.0, 1.0, 0.3 6 cm H2O CPAP/PEEP
FIO2 0.8, 0.8, 0.3 6 cm H2O CPAP/PEEP
FIO2 1.0, 1.0, air 6-8 cm H2O CPAP/PEEP
FIO2 1.0, 0.3, air 6-8 cm H2O CPAP/PEEP
Study III, n=10 III, n=10 III, n=10 IV, n=30 IV=29 SpO2 preop 99; 95-100 98; 94-99 99, 96-100 98; 95-100 99; 95-100 Test 1 96; 90-99∗ 96; 92-98∗ 95; 93-97∗ NA NA Test 2 96; 87-98∗ 95; 93-96∗ 95; 92-98∗ NA NA SpO2 postop 9/10 ≥ 94 9/10 ≥ 94 9/10 ≥ 94 94; 87-98 93; 87-98 SpO2 at CT All ≥ 94 All ≥ 94 All ≥ 94 All ≥ 94 All ≥ 94
FIO2 x, y, z = fraction of inspired oxygen for preoxygenation, postoxygenation, and after extubation, respectively ZEEP = zero end expiratory pressure. CPAP = continuous positive airway pressure. PEEP = positive end expiratory pressure. preop = preoperatively in the su-pine position before anaesthesia. postop = postoperatively in the supine position after anaes-thesia. CT = computed tomography.
29
Test 1 and 2 were performed during anaesthesia. ∗ P < 0.025, Wilcoxon signed-rank test (limited because of Bonferroni correction) comparing SpO2 values in patients in the same group preoperatively with values during anaesthesia. No differences between groups at any time. The SpO2 when breathing air did not differ significantly between groups before, during or after anaesthesia. The median differences in SpO2, ob-served by comparing values immediately before anaesthesia with values measured twice during ventilation with air during anaesthesia in study III, were significant in both groups.
Post hoc analysis of pooled data from studies I-IV As mentioned earlier, the results from the 24 patients from study I (given 60 or 80 % oxygen during preoxygenation), classified in the combined interven-tion group, is not included in this overview. The reason is that the results from these patients in study I cannot be regarded as providing any infor-mation about the final development of atelectasis, because the CT-scan was performed early.
The irrelevance of early CT-investigations using low oxygen concentra-tions during preoxygenation was demonstrated in study II, which showed that using 80 % oxygen during preoxygenation is probably not better than conventional preoxygenation (i.e., using 100 % oxygen, assuming no CPAP/PEEP). Therefore, the results from the late group in study II was transferred to the control group, which now included a “failed intervention”. Another indication that 80 % oxygen is a failed intervention comes from the result in study III, in which the group given 80 % oxygen for pre- and post-oxygenation had as much atelectasis as the control group. However, in this trial, 80 % oxygen was used with CPAP/PEEP, and therefore, it was still defined as an intervention. As noted earlier, 7/10 patients in this group were ex- or current smokers.
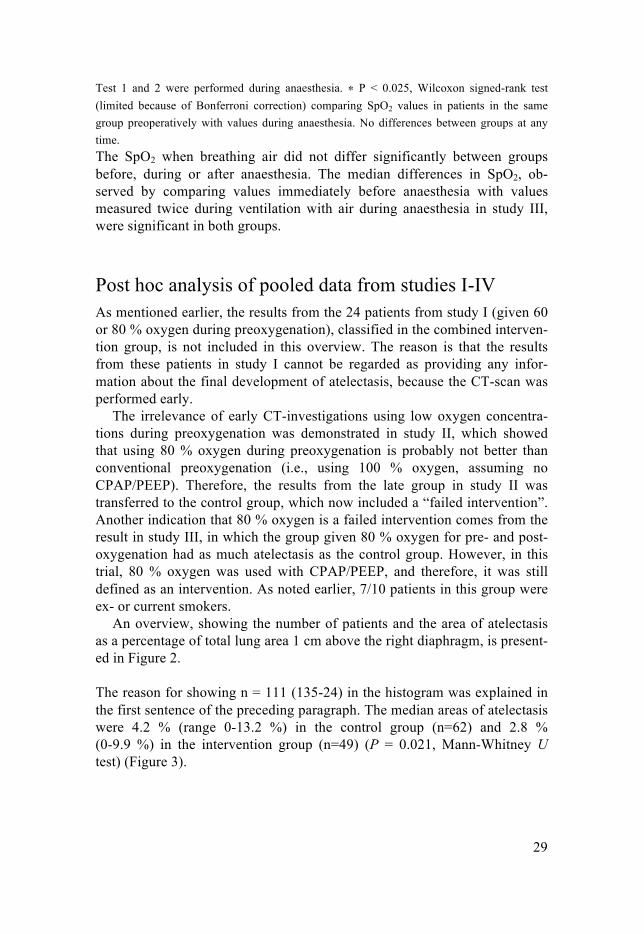
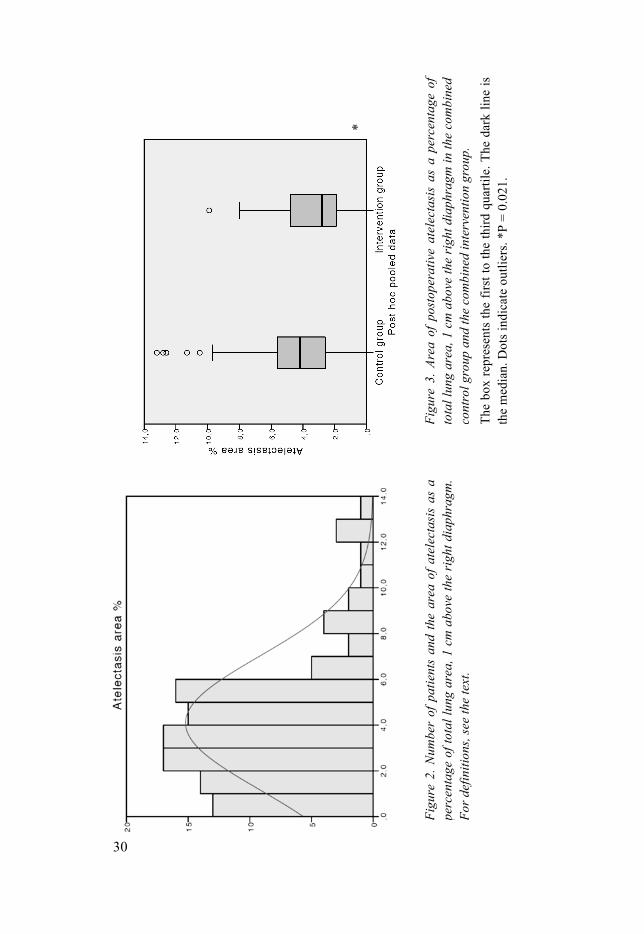
An overview, showing the number of patients and the area of atelectasis as a percentage of total lung area 1 cm above the right diaphragm, is present-ed in Figure 2.
The reason for showing n = 111 (135-24) in the histogram was explained in the first sentence of the preceding paragraph. The median areas of atelectasis were 4.2 % (range 0-13.2 %) in the control group (n=62) and 2.8 % (0-9.9 %) in the intervention group (n=49) (P = 0.021, Mann-Whitney U test) (Figure 3).
Figu
re 2
. Num
ber
of p
atie
nts
and
the
area
of a
tele
ctas
is a
s a
perc
enta
ge o
f tot
al lu
ng a
rea,
1 c
m a
bove
the
righ
t dia
phra
gm.
For d
efin
ition
s, se
e th
e te
xt.
Fi
gure
3. A
rea
of p
osto
pera
tive
atel
ecta
sis
as a
per
cent
age
of
tota
l lun
g ar
ea, 1
cm
abo
ve th
e ri
ght d
iaph
ragm
in th
e co
mbi
ned
cont
rol g
roup
and
the
com
bine
d in
terv
entio
n gr
oup.
Th
e bo
x re
pres
ents
the
first
to th
e th
ird q
uarti
le. T
he d
ark
line
is
the
med
ian.
Dot
s ind
icat
e ou
tlier
s. *P
= 0
.021
.
30
*

31
A histogram showing the distribution of patients in relation to age is present-ed in Figure 4. A significant linear correlation coefficient for atelectasis and age of 0.38 (P = 0.008) was found in the intervention group but not in the control group.
Figure 4. Number of patients according to age in patients with atelectasis that was presumed to be fully developed. The area of atelectasis is presented as a percentage of total lung area 1 cm above the right diaphragm.


33
Discussion
Duration of apnoea without desaturation (DAWD) An expected result was that the DAWD was significantly shortened using less than 100 % oxygen for preoxygenation. In general, the DAWD in this study was shorter compared with the value in more optimal procedures be-cause we used only normal breathing for 60 s, in contrast to normal breath-ing for 3 min32 or with the eight deep-breaths technique for 60 s 33. The hori-zontal position of the patient on the CT-table probably also contributed to the reduced DAWD.
Methodological consideration: Why a short duration of preoxygenation? The vital importance of the oxygen concentration during preoxygenation and its duration on the development of atelectasis has been demonstrated in theo-retical and clinical studies34-36. Consistently, strict preoxygenation (i.e., be-fore any drug was administered), lasted only 1 min in all four studies. After 1 min of preoxygenation with 100 % oxygen at normal tidal ventilation, denitrogenation is about 80 % complete37. We chose to study this duration for preoxygenation, because it was the routine in our department. The conse-quence was a systematically reduced FETO2 at the time of starting induction compared with the recommended duration of preoxygenation of 3 min.
The more important reason for adopting this relatively short time for pre-oxygenation was to avoid exaggerating the extent of atelectasis in our studies compared with what can occur during routine anaesthesia, by assuming that a shorter duration of preoxygenation is more common in practise than a longer duration. That said, we measured FETO2 continuously but recorded the values only at the end of mask ventilation.
34
Computed Tomography of the lungs and the area of atelectasis
The area of atelectasis in the basal CT scans, general observations from study I and II The early and late atelectasis formation, as found in studies I and II, clearly showed that atelectasis formation is an oxygen- and time-dependent process. The development of static atelectasis was dependent on the FIO2, especially during preoxygenation, but also during induction (i.e., the timing of total airway closure, as proposed in a mathematical model35 and in a clinical trial36). In the mathematical model, the airway to the dependent parts of the lungs closes with induction of anaesthesia, and these areas then behave as a closed collapsible cavity. The model assumed the full effect of preoxygena-tion on denitrogenation (3 min) and that a closed collapsible cavity formed immediately at induction.
In our clinical studies, even though preoxygenation was for only 1 min, the appearance of total airway closure in the dependent parts of the lungs was not instantaneous, rather more gradual, probably giving some “preoxy-genation effect” also during the induction of anaesthesia. With 100 % oxy-gen for preoxygenation and induction, the model predicts alveolar collapse in 7.9 (no HPV) or 8.7 (intact HPV) min. Only small areas of atelectasis were seen in patients immediately after intubation, 6 min after the start of induction, which fits with the model. We know that atelectasis formation increased markedly between 6 and 13 min after the start of induction in the group given 100 % oxygen, but the exact time of development could not be identified. Thus, we cannot rule out that the atelectasis in this group was complete some minutes before the time when it was observed. On the other hand, we cannot rule out another possibility: that the atelectasis area in-creased beyond 13 min. However, the area of atelectasis in this work is simi-lar to that reported by earlier studies8, 38, 39.
It should be observed that when presenting the area in percentage, some earlier studies calculated this in proportion of the total inner thoracic area. In the current studies the calculations were in proportion of the total lung area.
The model also predicts that alveolar collapse will ensue after 8.7 (no HPV) or 9.3 (intact HPV) min after preoxygenation with 100 % oxygen, followed by 80 % oxygen during induction of anaesthesia. The model does not incorporate the effect of preoxygenation with 80 % or 60 % oxygen, but the importance of the duration of preoxygenation was demonstrated, and as stated most of the effect occurred during the first three minutes.
Atelectasis in our late group given 80 % oxygen increased progressively during anaesthesia but more slowly as time passed and appeared as static atelectasis. This mechanism was demonstrated in 198938.
35
In a post hoc analysis, a common time effect on the development of atelecta-sis during the study period in the late group could be established, using a mixed model regression analysis. The exact values to describe the linear progression of atelectasis and the exponential opposing effect, expressed in cm2, is of no practical use, but it illustrates the nature of the development of static atelectasis as an oxygen- and time dependent process.
The areas of atelectasis in the 60 and 80 % groups in study I found after 14 min were probably influenced by the preceding prolonged period of apnoea, which is discussed more in detail in the following paragraph.
How did the investigation of atelectasis and DAWD in the same occasion in study I affect the comparisons between the early (study I) and late 80 % group (study II)? In study I, the patients were apnoeic until desaturation before atelectasis was measured, whereas in study II, the late group was studied without any prolonged period of apnoea. The median areas of atelectasis 14 min after the start of preoxygenation were 0.6 cm2 (range 0.1–3.2) in the patients given 80 % oxygen in study I and 4.1 cm2 (1.3–12.3 cm2) in the patients given 80 % oxygen in the late group in study II. The patients’ characteristics, level of PEEP, and other ventilatory variables did not differ between these groups of patients.
This raises the question of what could explain the difference in atelectasis formation between these two groups. Putting aside the possibility that the result of study I could represent a type 1 error or that the result of study II might represent a type 2 error, the exposure to prolonged apnoea probably explained the difference between groups. In study I patients were apnoeic with an endotracheal tube in place, which was not connected to the ventilator during the DAWD, leaving the lungs open to apnoeic oxygenation at ZEEP with air40, 41. A fresh gas flow of 6 L/min with 40 % oxygen in nitrogen was used when ventilation was started after completion of the apnoea period. Analysing this situation in terms of the risk of inducing static or dynamic atelectasis formation, ZEEP might increase the area of static atelectasis on the one hand, but air and 40 % oxygen might reduce the area of dynamic atelectasis on the other hand.
Without prolonged apnoea, ventilation in the late group started immediately after intubation with a PEEP of 3 cmH2O. During the time when the lungs were auscultated for bilateral breaths sounds and when securing the endotra-cheal tube, a fresh gas flow of 6 L/min with 80 % oxygen in nitrogen was used. As soon as a normal capnography curve was identified and bilateral breaths sounds were confirmed, the fresh gas flow was set to 1 L/min with
36
40 % oxygen in nitrogen. These findings suggest that a PEEP of 3 cmH2O instead of ZEEP might reduce the area of static atelectasis, but the period with 80 % oxygen after intubation and the time for the inspiratory oxygen concentration to decrease from about 80 % to 40 % with a fresh gas flow of 1 L/min might increase the area of dynamic atelectasis. The duration of the period with 80 % oxygen after intubation was not recorded, neither the time it took to decrease the oxygen concentration from 80 % to 40 %, but it might be estimated as several minutes. Thus, it appears that there may have been opposing effects in the two groups regarding the tendency towards static or dynamic atelectasis, which might have cancelled each other. However, one reasonable hypothesis is that the exposure to a prolonged period of 80 % oxygen after intubation in the late group was more important than ZEEP in the early group.
The results during anaesthesia 45 min after starting preoxygenation in the late group showed that the median atelectasis area had increased to 7.3 cm2 (range 2.0-21 cm2). During the interval from 14 to 45 min, ventilation was unchanged with 40 % oxygen and a PEEP of 3 cmH2O. In an earlier study42, that presumably used 100 % oxygen during preoxygenation, the area of ate-lectasis during anaesthesia was stable during an interval of about 50 min with 40 % oxygen at ZEEP. Therefore, it is unlikely that the increased area of atelectasis can be explained by the ventilation variables used between 14 to 45 minutes in our late group.
Rather, the increased area of atelectasis might indicate that closed sec-tions in the dependent parts of the lungs had become more atelectatic as oxygen left more quickly than nitrogen entered. In other words, most of the final atelectasis was potentially static and the full extent of atelectasis occurred as time passed without opening the airway with a high enough PEEP or a high enough inspiratory pressure. However, it is uncertain whether this line of reasoning can fully explain the finding of smaller atelec-tasis area in the 80 % group submitted to a prolonged apnoea. Certainly, a prolonged period of apnoea does not happen often, and the increased area of atelectasis with 80 % oxygen for preoxygenation that develops over time offers no real benefit, but a reduced DAWD is always negative.
37
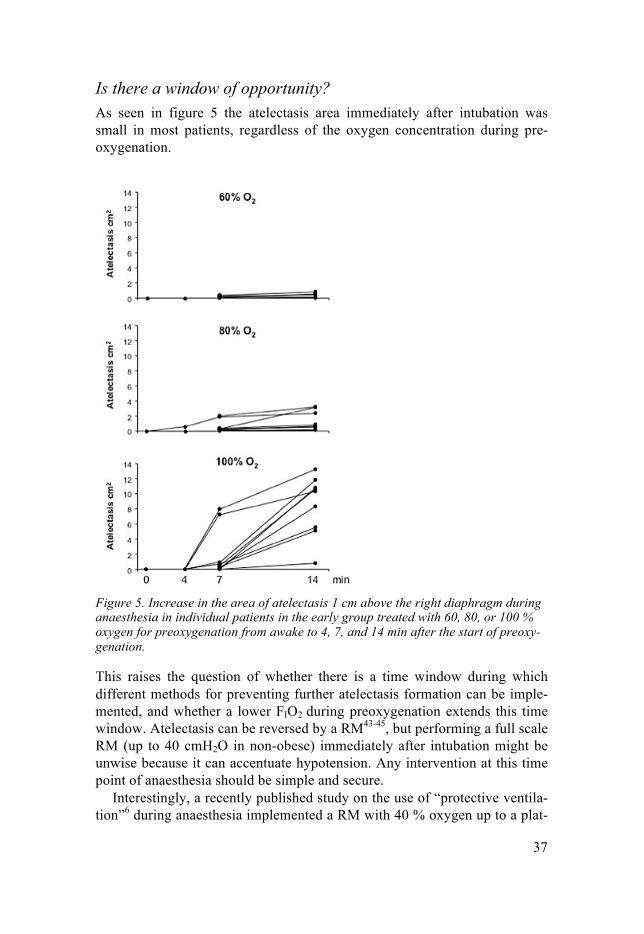
Is there a window of opportunity? As seen in figure 5 the atelectasis area immediately after intubation was small in most patients, regardless of the oxygen concentration during pre-oxygenation.
Figure 5. Increase in the area of atelectasis 1 cm above the right diaphragm during anaesthesia in individual patients in the early group treated with 60, 80, or 100 % oxygen for preoxygenation from awake to 4, 7, and 14 min after the start of preoxy-genation.
This raises the question of whether there is a time window during which different methods for preventing further atelectasis formation can be imple-mented, and whether a lower FIO2 during preoxygenation extends this time window. Atelectasis can be reversed by a RM43-45, but performing a full scale RM (up to 40 cmH2O in non-obese) immediately after intubation might be unwise because it can accentuate hypotension. Any intervention at this time point of anaesthesia should be simple and secure.
Interestingly, a recently published study on the use of “protective ventila-tion”6 during anaesthesia implemented a RM with 40 % oxygen up to a plat-
38
eau pressure of 30 cmH2O immediately after induction, which must have been very early after intubation and perhaps within the time frame outlined in study II.
The area of atelectasis in the basal CT scans, general observations from study III The time point of investigation is of obvious concern when interpreting dif-ferent studies. The “normal” amount of atelectasis during anaesthesia was proposed as 3-4 % of the total lung area in a basal scan1. It is unknown what percentage should be considered a normal amount of postoperative atelecta-sis. A study in 13 patients who were investigated 2 hours after lower ab-dominal surgery46 showed that 11 patients developed atelectasis and that ~1 % of the intrathoracic area (~2 % of the lung area) was atelectatic.
In a 2002 study47 of high relevance, a vital capacity manoeuvre was performed, i.e a RM up to 40 cmH2O, 10 min before the presumed end of surgery, the patients were randomly assigned to an FIO2 of 1.0 or 0.4 before extubation, and no PEEP was used. Twenty min after extubation, the atelec-tatic areas comprised 2.6 % ± 1.1 % (mean ± SD) in the group given an FIO2 of 0.4, and 6.8 % ± 3.4 % in the group given an FIO2 of 1.0. This study also included a control group without a vital capacity manoeuvre but with an FIO2 of 1.0 before tracheal extubation. Atelectasis in this group was 8.3 % ± 6.2 %. The patients in this study were all preoxygenated with 100 % oxygen for 3 min, and BMI was <30 in all patients.
At least two important conclusions can be drawn from the information dis-cussed above. First, the area of atelectasis can be almost eliminated by using a vital capacity manoeuvre and low oxygen concentration before extubation. Second, the area of atelectasis postoperatively is probably larger after both pre- and postoxygenation with 100 % oxygen than after preoxygenation with 100 % oxygen but administration of 40 % oxygen during anaesthesia, i.e. before postoxygenation and extubation. Study III investigated the area of atelectasis about the same time point postoperatively as in the study dis-cussed above, and the results were similar. However, probably because of differences in methodologies and study populations between these studies, the results in study III were significant only after a post hoc adjustment for age, or BMI, or both.
The control group in study III had an area of atelectasis of only 5.0 % ± 2.9 % (mean ± SD), compared with 8.3 % ± 6.2 % (mean ± SD) in the study discussed above, suggesting that the short period of preoxygenation may have reduced atelectasis formation. The results for the intervention groups are similar in the two studies: 2.6 % ± 1.1 % (mean ± SD) in the mentioned trial and 2.6 % ± 1.5 % (mean ± SD) in study III. The result in
39
study III suggest that even without a vital capacity manoeuvre, the coherent use of CPAP/PEEP and low FIO2 after extubation is as effective in reducing atelectasis as a vital capacity manoeuvre and a low FIO2 before extubation.
In terms of patient safety, the technique in study III omitted the vital ca-pacity manoeuvre and included CPAP initially with on-mask 100 % oxygen after extubation; i.e.; FIO2 decreased only after securing a free upper airway and a satisfactory spontaneous breathing. This means that immediately after extubation, the safe apnoea time in the event of a total failure of ventilation should be compared between patients with an FIO2 of 1.0 and increased FRC because of CPAP, and patients with an FIO2 of 0.4 and no CPAP.
The area of atelectasis in the basal CT scans, general observations from study IV The primary study objective was to investigate whether reducing the oxygen concentration from 100 to 30 % during emergence from anaesthesia would reduce the area of atelectasis. This objective could not be achieved. Howev-er, it is of interest to look at the results in the context of the preceding para-graph. In study IV, the area of atelectasis was 3.4 % ± 2.4 % (mean ± SD) in the intervention group, and 4.4 % ± 3.4 % (mean ± SD) in the control group. Although the results in the intervention groups were similar between studies III (2.6 % ± 1.5 %), IV (3.4 % ± 2.4 %), and the study discussed above from 2002 (2.6 % ± 1.1 %), very different results were found in the control groups, in which the area of atelectasis ranged from 4.4 % ± 3.4 % (IV), 5.0 % ± 2.9 % (III) to 8.3 % ± 6.2 % in the study from 2002. This result in the control group in study IV probably reflects the fact that CPAP/PEEP was used during preoxygenation and anaesthesia; the only difference from the intervention group was the use of 100 % instead of 30 % oxygen during postoxygenation.
The ventilation strategies used in studies III and IV did not achieve the goal of delivering a “clean” lung to the postoperative ward. The level of CPAP/PEEP might have been insufficient for the task of keeping the small airways open in dependent parts of the lungs during anaesthesia; 10 cmH2O has been proposed as the optimal PEEP in normal-weight patients after an RM48.
More on the topic of lung volumes and small airway closure The end-expiratory lung volume and airway closure One important aspect in the nomenclature of lung volumes differs from ordi-nary use, going from a conscious to an anaesthetic state. The term denoting
40
resting volume in the lungs after expiration is called the functional residual capacity (FRC) during normal spontaneous breathing and end expiratory lung volume (EELV) during anaesthesia. This is in order to highlight the fact that the balancing forces involved are changed. In 196349, the first report demonstrating decreased FRC during anaesthesia was published. FRC in-creases slightly by age, it is linearly related to height, and the supine position will reduce FRC compared with the upright position in the range of 500 to 1000 ml50. Obesity can induce significant reduction in FRC51. With the ex-ception of ketamine, all anaesthetic drugs have been confirmed to reduce FRC in the awake supine position by 400 to 500 ml, or by 15-20 % of the awake value. Thus, anaesthesia induction has an immediate effect on the respiratory system52. The combined effect of the supine position and anaes-thesia will give an EELV close to residual volume (RV). EELV is the sum of RV and end expiratory reserve volume (ERV), which means that ERV is decreased first by the supine position and later by anaesthesia.
A reduction in ERV and therefore in EELV must be considered along with the closing volume (CV) and the CC (RV + CV); i.e. the vol-ume/capacity at which small airways in the dependent parts of the lungs will close. CC increases by age and equals FRC in the supine position at the age of 45-50 years and in the standing position at the age of 65-70 years.
Whereas a reduced resting volume in the lungs from FRC to EELV is firmly established, a consistent reduction in CV or CC during anaesthesia is disputed30, 53-55. The conflicting results might be explained by differences in the maximal inspiratory pressure used to inflate the lungs before the meas-urements: 30 or 40 cmH2O. Only the latter pressure will reliably open up the lungs to vital capacity45. Thus, overall, the data favours the interpretation that CV will be larger than ERV in many patients during anaesthesia, which implies partial or total airway closure during the respiratory cycle. The de-gree of airway closure will depend on the actual difference between CV and ERV in relation to the size of the VT. Use of PEEP immediately increases ERV and thus reduces the risk of airway closure.
In this context, we note that FRC are higher in the lungs of patients with asthma or COPD than in normal lungs. However, the increased FRC in these diseases occurs because of increased RV, not increased ERV. Because CV also increases in asthma and COPD, these patients exhibit more extensive airway closure than what is normally found.
The missing links These data suggest that a correlation between atelectasis and airway closure, and between atelectasis and age should have been found in earlier studies, especially concerning the fact that airway closure is the main explanation for the observed deterioration in arterial oxygenation with age and that airway closure increases even more during anaesthesia. However, no such correla-
41
tions have been found. Based on the findings in the present studies, we pre-sent tentative theoretical explanations for this inconsistency. To begin, these explanations are explored by looking at possible implications related to patient factors.
Patient factors Age and atelectasis In 1987, Strandberg et al56 published a study of 38 patients on the constitu-tional factors correlated with the increased extent of atelectasis. They found no indications of atelectasis being more abundant because of gender, age or smoking habits. Calculation of BMI was not reported. Instead, they found Broca’s index (ideal weight in kg=height in cm - 100) and weight to be cor-related to atelectasis, the linear correlation coefficients reported as 0.34 and 0.28 (P < 0.05). These patients were ventilated with a Servo 900C, the level of PEEP was not reported.
The results had not been refuted until tentative findings in studies III and IV, in which CPAP/PEEP was used to counteract for the reduced ERV dur-ing anaesthesia. Moreover, in study IV some adjustments of CPAP/PEEP were made according to BMI. Linear correlation coefficients between atelec-tasis and BMI were only ~0.2 in studies III and IV. This is a reasonable find-ing, indicating that the applied CPAP/PEEP was effective against ERV re-duction related to overweight. In study III, the linear correlation coefficient for atelectasis and age was 0.40 (P = 0.03) and the Spearman correlation coefficient for atelectasis and age was 0.46 (P < 0.05). In study IV, in which CPAP/PEEP was higher than in study III, no linear correlation was found between age and atelectasis for the whole study group. A significant linear correlation was found (r = 0.37, P = 0.048) in the group given 30 % oxygen but not for the group given 100 % oxygen (r = 0.14). However, there were significantly more patients classified as smokers in 100 % group.
Thus, with the use of CPAP/PEEP, what is the possible explanation be-hind the preliminary finding of a correlation between age and atelectasis in study III?
Age and the duration of preoxygenation To explain this preliminary finding, we start from the very beginning - dur-ing preoxygenation and induction. If we acknowledge that airway closure increases with age and is more likely to occur in the supine position than in the sitting position, the time to achieve a final FETO2 should be longer in older patients than in the young ones. Studies on preoxygenation confirm this57-59. If alveolar minute ventilation is depressed, more time is needed for an older patient to reach the same FETO2 as in the young.
42
Another aspect is that the areas of low VA/Q that result from airway closure, respond completely to oxygen treatment. Thus, after some time, there should be no difference in the FETO2 between older and younger patients. Studies of preoxygenation suggest that the critical time lies 1-2 min from start of pre-oxygenation. Premedication that reduces minute ventilation and leaks around the face mask will both prolong the critical time.
Knowing this, and the pivotal role of the oxygen concentration behind closed or semi-closed airways for events to come, any study on the early formation of atelectasis conducted without control of these parameters will probably have a systematic error. Inducing anaesthesia without having exact control of the duration of preoxygenation and the timing of FETO2, in relation
to the fundamental effects of anaesthetic drugs on the respiratory muscle tone and thus ERV, probably creates a situation where younger patients will have higher FETO2 than older patients. In younger patients, higher FETO2 will increase the early formation of atelectasis, and in older patients, lower FETO2 will reduce the early formation of atelectasis. Age and CPAP/PEEP Application of CPAP/PEEP will fundamentally change the interaction be-tween FETO2 and airway closure, but most studies of atelectasis have been performed without CPAP during preoxygenation and induction, and in many studies even without (or not reporting) the use of PEEP during anaesthesia. Looking at atelectasis formation over time will yield different results de-pending on the conditions. However, it may be proposed that at the begin-ning of anaesthesia, a low oxygen concentration behind permanently closed airways will not have sufficient time to promote atelectasis. Consistent use of CPAP/PEEP during preoxygenation, induction and maintenance of anaes-thesia will have a profound effect on the events described in the preceding paragraph. The difference in FETO2 related to age will be much reduced, but the age-dependent airway closure will also be reduced as long as CPAP/PEEP is maintained.
Returning to the correlation between atelectasis and age found in study III, we propose that the patients of different ages in study III were more ho-mogeneous regarding FETO2 during induction of anaesthesia. After induction and intubation atelectasis develops according to the level of FETO2 and the amount of airway closure. If the level of PEEP is insufficient in relation to FETO2, static and/or dynamic atelectasis will follow. In study III and IV, the levels of CPAP/PEEP were fixed at 6-8 cmH2O and these levels might be too low to fully avoid airway closure. An insufficient level of PEEP will affect older patients more as closing volume increases with age. Assuming no difference in FETO2 at the time of intubation, older patients will have more airway closure after intubation and therefore an increased risk of atelectasis.
43
The time it takes exchanging high FETO2 to low will probably influence the risk. Thus, applying a CPAP/PEEP technique in older patients could become a double-edged sword. On the one hand, better oxygenation and less airway closure should occur, provided that CPAP/PEEP is working; on the other hand, if left without this protection, the risk of formation of atelectasis would increase if FETO2 remained high.
As studies III and IV investigated the occurrence of postoperative atelectasis, more than one hour had passed since induction of anaesthesia, letting more of the final development of atelectasis to reveal itself. The effect of reducing the FETO2 after extubation with an FIO2 of 0.3, as in study III, will not be uncovered until after ~3 hours34. We did not include a group in which 100 % oxygen was given with CPAP on mask after extubation. Inclusion of such a group might have given insights into the importance of high FETO2 after end-ing CPAP, but a similar group was studied by Lumb et al60. Lumb et al used the alveolar-arterial PaO2-difference as a surrogate marker for atelectasis.
Their data were collected postoperatively after a RM and the use of CPAP at 10 cmH2O until extubation but not thereafter. The surrogate marker meas-ured 1 hour after extubation did not differ between the group treated with a RM and CPAP, and a control group not given RM. Therefore, a high FIO2
when CPAP ends, was proved ineffective. In study III, a CPAP of 6 cmH2O was used during the period in which FETO2 was deliberately reduced. Even if there were leaks that diminished the effectiveness, it is unlikely that an FE-
TO2 of less than 0.5 was not achieved, and static atelectasis caused by this level of FETO2 would not have appeared in the CT scan after 14-25 minutes.
To summarise, and to answer the question about the possible link found between age and atelectasis, using CPAP during preoxygenation and induc-tion in older patients might expose them to higher FETO2 during induction of anaesthesia. If the level of PEEP is insufficient during anaesthesia, and air-way closure follows, this might later lead to increased areas of atelectasis compared with younger patients. Smoking and atelectasis Another new finding of the post hoc analysis from study IV was the correla-tion coefficient of 0.3 (P = 0.022) between smoking more than 6 pack-years and atelectasis formation. Most of the smokers (14/18) were in the control group, and as noted earlier, atelectasis and age correlated significantly in the intervention group but not in the control group. Added to this is the fact that, in study III, the intervention failed in the group given 80 % oxygen with CPAP/PEEP. Overall, smoking was more common in this group compared with the other two groups in study III. Circumstantial evidence about smok-ing as a contributor to atelectasis is thus gaining relevance. Clinically, an

44
association between smoking and atelectasis makes sense. However, this association can be overlooked because of the great variability in the effects of smoking in patients relating to different exposure in pack-years and individual susceptibility, especially when studying the early formation of atelectasis in a small number of patients. Both studies III and IV observed the late formation of atelectasis, and study IV included the largest number of patients in any study using CT to detect atelectasis.
It would seem that when smoking has an effect, this occurs early during an-aesthesia, and it is questionable whether a fixed level of CPAP/PEEP will suffice to prevent atelectasis formation. It might have been more relevant to look at CPAP/PEEP as a possible double-edged sword in terms of smoking and its effects on airway closure, FETO2, and the degree of respiratory dis-turbance. In 1991, Gunnarson et al61 studied 10 patients with COPD and found only minor areas of atelectasis during anaesthesia in three of the pa-tients. The VA/Q relationship was also studied with the multiple inert gas elimination technique, and the amount of true shunting found (mean 1 %) was consistent with only minor atelectasis. Gas trapping because of airway closure was proposed as a possible mechanism. The pivotal role of the oxy-gen concentration as a determinant of atelectasis had not established in 1991, and the duration of preoxygenation was not specified in the article.
In 2000, Samain et al62 studied 10 patients with COPD (FRC 5.6 ± 1.1 L; mean ± SD) and 10 patients without COPD (FRC 3.l ± 0.4 L) during preox-ygenation. After 3 min of preoxygenation FETO2 was 0.83 and 0.91 in the group with and without COPD, respectively. Thus, if one does not take into account the effect of increased FRC and increased CC in COPD for achiev-ing a predefined level of FETO2 during preoxygenation, the gas trapped in the closed-off units in the lungs during anaesthesia will contain more nitrogen. More nitrogen protects against atelectasis formation, and this protection is increased by concomitant HPV. Using CPAP during preoxygenation and induction probably reduces this protection. The smokers included in studies III and IV had not been diagnosed clinically with COPD, but they might be suspected to have been in different stages in the progression to COPD. What these stages might possibly look like is impossible to say, other than that it somehow increased the tendency to develop atelectasis. We suspect that, as in older patients, the level of PEEP during anaesthesia was insufficient in regard to the tendency of airway closure.
45
Comments on the post hoc analysis of pooled data from studies I-IV There was a significant effect on the area of atelectasis in the combined in-tervention group as compared with the combined control group. Even though the definitions of the groups might be discussed, the post hoc analysis showed that the interventions were a step in the right direction. The pooling of data gained the statistical power that was missing in study III. The aver-age area of atelectasis in the control group was similar to that reported in other compilations.
Can lessons be learned from outliers? As mentioned, atelectasis appears in ~90 % of anaesthetised patients. The frequency and the area of atelectasis will depend on many different factors; the time point after the start of preoxygenation during or after anaesthesia is one key factor. In the four studies of this thesis, the radiologist reported only 3/135, or 2 % of patients as completely free of atelectasis. In one of these patients, only 60 % oxygen had been given during preoxygenation, and this patient was studied early during anaesthesia. Of more interest are the two other patients who exhibited no atelectasis even at 14 min after awakening. One patient who had been given 100 % oxygen during pre- and postoxygen-ation was 46 years old and had a BMI of 19.6. The other patient who had been given 100 % oxygen during preoxygenation and 30 % oxygen for post-oxygenation was 41 years old and had a BMI of 33.3. A BMI of 19.6 might be a light burden for the lungs but this cannot be said of a BMI of 33.3. Thus, the results for two positive outliers are contradictory.
However, there were also patients on the negative side of the scale, who developed much more atelectasis than others in their group. If we arbitrarily identify patients with increased area of atelectasis as outliers when the area of atelectasis is more than 19 cm2 (as used in study I; i.e., almost twice the normal amount, irrespective of the time of investigation), six patients were exhibited. All six patients belonged to a control group. The characteristics of these patients are given in Table 4.
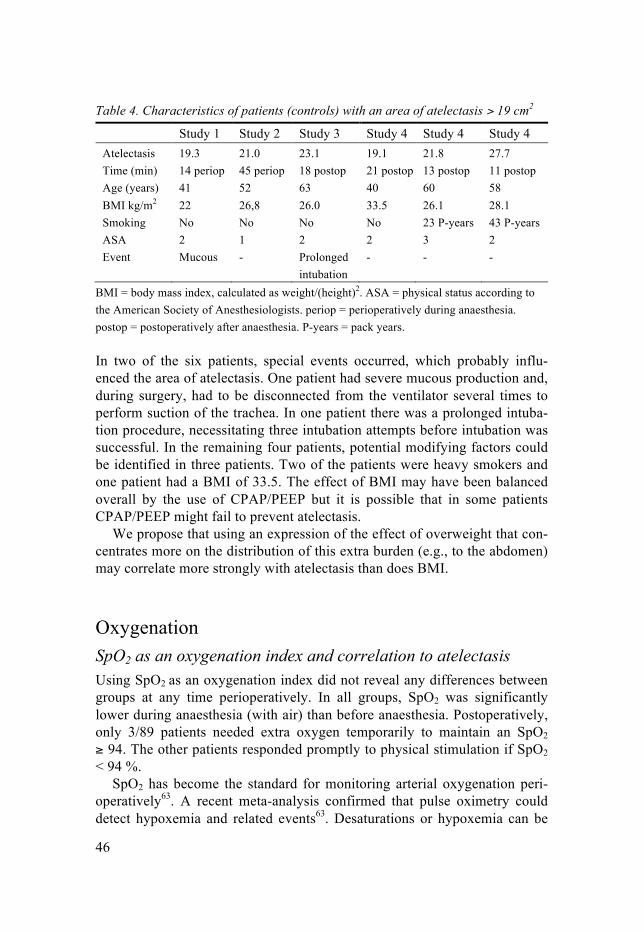
46
Table 4. Characteristics of patients (controls) with an area of atelectasis > 19 cm2
Study 1 Study 2 Study 3 Study 4 Study 4 Study 4 Atelectasis 19.3 21.0 23.1 19.1 21.8 27.7 Time (min) 14 periop 45 periop 18 postop 21 postop 13 postop 11 postop Age (years) 41 52 63 40 60 58 BMI kg/m2 22 26,8 26.0 33.5 26.1 28.1 Smoking No No No No 23 P-years 43 P-years ASA 2 1 2 2 3 2 Event Mucous
- Prolonged
intubation - - -
BMI = body mass index, calculated as weight/(height)2. ASA = physical status according to the American Society of Anesthesiologists. periop = perioperatively during anaesthesia. postop = postoperatively after anaesthesia. P-years = pack years. In two of the six patients, special events occurred, which probably influ-enced the area of atelectasis. One patient had severe mucous production and, during surgery, had to be disconnected from the ventilator several times to perform suction of the trachea. In one patient there was a prolonged intuba-tion procedure, necessitating three intubation attempts before intubation was successful. In the remaining four patients, potential modifying factors could be identified in three patients. Two of the patients were heavy smokers and one patient had a BMI of 33.5. The effect of BMI may have been balanced overall by the use of CPAP/PEEP but it is possible that in some patients CPAP/PEEP might fail to prevent atelectasis.
We propose that using an expression of the effect of overweight that con-centrates more on the distribution of this extra burden (e.g., to the abdomen) may correlate more strongly with atelectasis than does BMI.
Oxygenation SpO2 as an oxygenation index and correlation to atelectasis Using SpO2 as an oxygenation index did not reveal any differences between groups at any time perioperatively. In all groups, SpO2 was significantly lower during anaesthesia (with air) than before anaesthesia. Postoperatively, only 3/89 patients needed extra oxygen temporarily to maintain an SpO2
≥ 94. The other patients responded promptly to physical stimulation if SpO2
< 94 %. SpO2 has become the standard for monitoring arterial oxygenation peri-
operatively63. A recent meta-analysis confirmed that pulse oximetry could detect hypoxemia and related events63. Desaturations or hypoxemia can be
47
defined as mild (SpO2 86-90 %), moderate (SpO2 81-85 %), or severe (SpO2 < 81 %)64. Assessment of the efficiency of pulmonary oxygenation is often influenced by FIO2.
When data for mixed venous blood gases are lacking, an estimate of the venous admixture based on arterial blood gas analysis and an assumption of the arteriovenous O2 content difference can be used65. During anaesthesia, FIO2 is usually 0.3-0.4, which is a good way of hiding or treating desatura-tions that would have been seen with ventilation with air.
In fact, using an FIO2 of 0.4 and assuming “normal” values for the varia-bles in the shunt equation and a haemoglobin value of 120 g/L gives an arte-rial oxygen saturation (SaO2) of 94 % with a true shunt of ~23 %66. With air, a true shunt of 23 % would give an SaO2 of ~90 %, and a true shunt of 13 % would give an SaO2 of ~94 %. During total intravenous anaesthesia, the true shunt has been correlated to the area of atelectasis30 and is expressed as shunt (% CO) = 2.9 + 0.55 × atelectasis area in cm2. Using this formula, a true shunt of 23 % would correspond to an atelectasis area of 36.5 cm2, and a true shunt of 13 % would correspond to an atelectasis area of 18.4 cm2. Based on studies67, 68 showing correlations between SaO2 and SpO2, in the following paragraph, SpO2 is used as a surrogate variable for SaO2.
SpO2 as an oxygenation index perioperatively In study III, SpO2 with air was measured before anaesthesia, twice during anaesthesia using air and continuously postoperatively with air. The absolute value of SpO2, 99-100 %, before anaesthesia indicates a systematic error, because, according to the alveolar equation of ideal alveolar PO2, breathing air at normal atmospheric pressure with normal alveolar ventilation cannot produce such high values. SpO2 measured using the same pulse oximeter during anaesthesia revealed values of 95-96 % with no difference between groups. Assuming that the error was unchanged, one may conclude that SpO2 decreased significantly during anaesthesia.
This might look like trivial information, but there is a point to be made. If we assume the systematic error to be +2 %, SpO2 before anaesthesia would be 96-97 % if corrected for this error, and 93-94 % during anaesthesia (with air). Thus, systematic error in the SpO2 reading that produces values that are too high, will underestimate an oxygenation problem. In addition, giving extra oxygen without caution, for example in the recovery ward after sur-gery, will make it even harder to diagnose the existence of an oxygenation problem.
These shortcomings were addressed some years ago in the guidelines of the British Thoracic Society for emergency oxygen use in adult patients69. For normal patients, the guidelines recommend that the lower limit for giving extra oxygen should be set at an SpO2 of 94 %, and that pulse oximeters

48
should have an accuracy of ± 1-2 %. The guidelines also acknowledge that a deterioration of 3 % in SpO2 is a warning sign.
To summarise the point discussed, when patients are monitored with SpO2 and the readings are judged as correct, an SpO2 < 94 % might indicate a serious shunt, equivalent to more than 23 % of cardiac output and the exist-ence of large areas of atelectasis of more than 36 cm2.
The discussion so far has assumed that the full decrease in SpO2 represents only true shunt, which is seldom the case. There are many possible reasons for impaired oxygenation during and after anaesthesia. Perfusion of areas with low VA/Q is almost obligatory, adding venous admixture to the equa-tions. As much as 75 % of the impairment of arterial oxygenation during anaesthesia might be explained by the combined effects of atelectasis and airway closure30. Other causes for impaired oxygenation include hemody-namic disturbances or increased metabolic demands. In the recovery ward, hypoventilation is a frequent feature that is effectively disguised by oxygen treatment.
Postoperatively, with a few brief exceptions, all patients in studies III and IV had an SpO2 ≥ 94 %. The median area of atelectasis was 8.5 cm2 in the con-trol group in study III. Using the formula given above, this would corre-spond to a true shunt of ~8 % and an SpO2 of 95 % during air breathing. Thus, it is not surprising that in the clinical situation with “normal” amounts of atelectasis, pulse oximetry alone will not alert us to the situation.
One control patient in study III and three control patients in study IV had an area of atelectasis of more than 19 cm2. Theoretically, using the formula as cited, atelectasis in these patients might have been detected by pulse oxi-metry if SpO2 had declined below 94 %, but they were not. There could be several explanations for this. A systematic false high SpO2 value is one pos-sibility. Using the formula linking atelectasis to true shunt as derived from conditions during anaesthesia postoperatively might be inaccurate. Finally, we know very little about how alterations in HPV affect these calculations. It is reasonable to assume that HPV is more effective in the wake patient than during anaesthesia70, 71; therefore, stronger HPV might reduce the effect of atelectasis, especially when breathing air.
To summarise, pulse oximetry is not a suitable tool for revealing normal-size atelectasis that often accompanies anaesthesia. Even greater amounts of de-aerated lung tissue, up to ~20 cm2, may escape detection because of:
• inaccurately high SpO2 readings up to +2 percentage points; • inappropriate use of oxygen supplementation, which can mask impaired
oxygenation; • an effective HPV response in the postoperative period;
49
• confounding factors such as disturbance of VA/Q or postoperative hypoventilation.
Clinical implications The standard routine of using 100 % oxygen during preoxygenation is still the optimal procedure. Using 80 % oxygen during preoxygenation shortens the time available in a “cannot ventilate, cannot intubate” situation and the size of the area of atelectasis will eventually be similar to that with 100 % oxygen. Avoiding airway closure with CPAP/PEEP increases the effect of preoxygenation and simultaneously reduces the tendency for atelectasis for-mation, even with 100 % oxygen.
However, precautionary measures might be considered if CPAP/PEEP is used combined with 100 % oxygen for pre- and postoxygenation, especially in a high-risk older patient. First, immediately before extubation, a RM can be performed, eliminating any atelectasis evolved hitherto. Second, after extubation, ventilation with CPAP, or bi-level positive airway pressure, on-mask should start, and before ending maskventilation, the original high FIO2 should be exchanged to a low value using 30-40 % oxygen in nitrogen.
In the postoperative ward, deep-breathing exercises might be implement-ed. In patients unable to maintain SpO2 by breathing air at ≥ 94 %, a more detailed diagnosis might be needed, including arterial blood gas analysis. In selected cases, postoperative use of non-invasive ventilation might be an appropriate treatment.
The use of CPAP/PEEP probably needs titrating to individual demands when the pulmonary physiology deviates from normal limits. A history of heavy smoking, especially with a high ASA class, should always raise a warning flag.

51
Conclusions
1. The early formation of atelectasis was halted by the use of 60 or 80 % oxygen compared with 100 % oxygen during preoxygenation and induc-tion of general anaesthesia
2. The duration of apnoea without desaturation shortened markedly when the oxygen concentration was reduced from 100 % during preoxygena-tion.
3. During induction of anaesthesia, only small areas of atelectasis appeared around the time of intubation, irrespective of oxygen concentration. In the time window starting after intubation, from 7 until 14 min after start of preoxygenation, the area of atelectasis expanded substantially with 100 but not with 80 or 60 % oxygen used during preoxygenation. These processes were probably influenced by the fact that the duration of ap-noea without desaturation was investigated at the same occasion.
4. The benefit of using 80 % oxygen during preoxygenation seemed to be short lived because the area of atelectasis evolved gradually from 14 to 45 min after start of preoxygenation; the area approached the size normal-ly found after 14 min with 100 % oxygen during preoxygenation.
5. A ventilation strategy using 100 % oxygen during pre- and postoxy-genation with a combination of CPAP or PEEP and a reduced FETO2
before ending mask ventilation with CPAP after extubation reduced the area of atelectasis compared with a group with no CPAP/PEEP and a high FETO2 after ending maskventilation after extubation. In a post hoc analysis, after correction for modifying effects of age and BMI, this reduction became statistically significant.
6. The areas of atelectasis did not differ between ventilation strategies using 80 or 100 % oxygen during pre- and postoxygenation with a combination of CPAP or PEEP and a reduced FETO2 before ending mask ventilation with CPAP after extubation.
7. The area of atelectasis after a ventilation strategy using 100 % oxygen during preoxygenation with a combination of CPAP or PEEP and 30 % oxygen during postoxygenation before extubation, did not differ from that observed in a group treated with the same strategy but with 100 % oxygen during postoxygenation.
8. The use of SpO2 in patients when ventilated with, or breathing, air to detect possible differences in the area of atelectasis between different treatment groups was discouraged in relation to the area of atelectasis that had developed.

52
53
Acknowledgements
The clinical studies in this thesis were dispersed in place and time. A long time ago, it all began early in the mornings at the Department of Radiology at the Central Hospital, Västerås, then moved to “A-huset” and the Department of Radiology of the University Hospital in Örebro, and final-ly settled in Västmanlands sjukhus Köping, the town where Carl Wilhelm Scheele described oxygen as “fire air”. I owe so many people deep gratitude for helping me out through the years; this is the proof the effort was not made in vain. Individuals do make the difference and in the fulfilment of this particular task these are the persons who really made it a realization: Göran Hedenstierna; my first supervisor, a man of great generosity and tremendous knowledge, with an astute capacity to with a phrase illuminate even the most obscure corners in the realm of respiratory physiology. However, in the final analysis, most of all his trust and patience finally made it possible for the spy to come in from the cold.
Mats Enlund; my second supervisor, life goes on and for a chosen few the years make them better and better. When the right time came, I discovered his many strengths and how they enzymatically act together in chain reactions, suddenly I was in one of them.
Jerzy Leppert; co-supervisor, for putting even the smallest detail in the right perspective, and for pointing in new directions after the fall of the Wall.
Kent Nilsson; (extra supervisor)ln, for sharing his capacity of grasping scientific problems from empty space and instantaneously suggest a statisti-cal solution.
Björn Revenäs; the best chief of staff that I could possibly have come across. He invited me to the department in Västerås, and he introduced me to Göran. Luckily for me, he always encouraged manifestations of a free spirit.
Udo Auner; took the golden glove that so many had left on the floor and made it fit his hand. With Udo there was resolution of the matter, with the former there was conclusion about the latter. Udo has the eyes of an eagle.

54
Henrik Zetterström; the mystery of venous admixture brought us together in rewarding dialogues, and now I have joined Henrik on his crusade for the Best presentation of an oxygenation index.
Jan Hallén; with a most impressive combination of professional skill and perpetual search for knowledge he gave me a new start in Örebro. With his support nothing is impossible.
Anders Nydahl; can see around corners and opened the gates to Örebro before I observed that I had finished knocking.
Lena Lassinantti-Olowsson; without the firm determination and excellent assistance from Lena I would still be struggling to get my act together.
Majny Thorell; have a fellowship of the Ring but someone keeps it a secret. Without Majny the Ring would never have reached the Crack of Doom.
Håkan Scheer, Wilhelm Wallquist and Erland Östberg; if you want to work with the best, look no further. Why someone of these three called the police to get hold of me is beyond the reach of my current understanding.
Berhane Teclemariam; a brother in arms, always supportive, and without him, fireair in Köping is thin and void of sparkle.
Makibi Cronstrand and Christina Svedberg; working behind the scene and securing the welfare of the department, always with an ace in their sleeves.
The wonderful staff at CKF with Katarina Ringström as the catcher in the rye, all my colleagues and workmates in Köping and Västerås; especially Per Jansson, Carl-Johan Sandvik, Kamelia Kostova-Aherdan and Malin Engdah.
My wife Carin; the only, the best and most wonderful life companion, al-most always on the move, she is the light in the heart of darkness. With and for her the grass is never greener on the other side.
55
References
1 Hedenstierna G. Oxygen and anesthesia: what lung do we deliver to the post-operative ward? Acta Anaesthesiol Scand 2012; 56: 675-85.
2 Kilpatrick B, Slinger P. Lung protective strategies in anaesthesia. Br J Anaesth 2010; 105 Suppl 1: i108-16.
3 Hemmes SN, Serpa Neto A, Schultz MJ. Intraoperative ventilatory strategies to prevent postoperative pulmonary complications: a meta-analysis. Curr Opin Anaesthesiol 2013; 26: 126-33.
4 Canet J, Gallart L, Gomar C, et al. Prediction of postoperative pulmonary complications in a population-based surgical cohort. Anesthesiology 2010; 113: 1338-50.
5 Weiser TG, Regenbogen SE, Thompson KD, et al. An estimation of the global volume of surgery: a modelling strategy based on available data. Lancet 2008; 372: 139-44.
6 Severgnini P, Selmo G, Lanza C, et al. Protective mechanical ventilation during general anesthesia for open abdominal surgery improves postoperative pulmonary function. Anesthesiology 2013; 118: 1307-21.
7 Futier E, Constantin JM, Paugam-Burtz C, et al. A trial of intraoperative low-tidal-volume ventilation in abdominal surgery. N Engl J Med 2013; 369: 428-37.
8 Lundquist H, Hedenstierna G, Strandberg A, Tokics L, Brismar B. CT-assessment of dependent lung densities in man during general anaesthesia. Acta Radiol 1995; 36: 626-32.
9 Hedenstierna G, Rothen HU. Respiratory function during anesthesia: effects on gas exchange. Compr Physiol: 2012; 2: 69-96.
10 Duggan M, Kavanagh BP. Pulmonary atelectasis: a pathogenic perioperative entity. Anesthesiology 2005; 102: 838-54.
11 Tsuchida S, Engelberts D, Peltekova V, et al. Atelectasis causes alveolar injury in nonatelectatic lung regions. Am J Respir Crit Care Med 2006; 174: 279-89.
12 van Kaam AH, Lachmann RA, Herting E, et al. Reducing atelectasis attenuates bacterial growth and translocation in experimental pneumonia. Am J Respir Crit Care Med 2004; 169: 1046-53.
13 Lichtheim L. Versuche über Lungenatelektase. JB Hirschfeld, 1878.
56
14 Beecher HK. Effect of laparotomy on lung volume. Demonstration of a new type of pulmonary collapse. J Clin Invest 1933; 12: 651-8.
15 Wahba RW. Perioperative functional residual capacity. Can J Anaesth 1991; 38: 384-400.
16 Milic-Emili J, Torchio R, D'Angelo E. Closing volume: a reappraisal (1967-2007). Eur J Appl Physiol 2007; 99: 567-83.
17 Benumof JL. Mechanism of decreased blood flow to atelectatic lung. J Appl Physiol Respir Environ Exerc Physiol 1979; 46: 1047-8.
18 Dantzker DR, Wagner PD, West JB. Instability of lung units with low Va/Q ratios during O2 breathing. J Appl Physiol 1975; 38: 886-95.
19 Briscoe WA, Cree EM, Filler J, Houssay HEJ, Cournand A. Lung volume, alveolar ventilation and perfusion interrelationships in chronic pulmonary emphysema. J Appl Physiol 1960; 15: 785-95.
20 Damgaard-Pedersen K, Qvist T. Pediatric pulmonary CT-scanning. Anaesthesia-induced changes. Pediatr Radiol 1980; 9: 145-8.
21 Brismar B, Hedenstierna G, Lundquist H, Strandberg A, Svensson L, Tokics L. Pulmonary densities during anesthesia with muscular relaxation--a proposal of atelectasis. Anesthesiology 1985; 62: 422-8.
22 Rothen HU, Sporre B, Engberg G, Wegenius G, Reber A, Hedenstierna G. Prevention of atelectasis during general anaesthesia. Lancet 1995; 345: 1387-91.
23 Rothen HU, Sporre B, Engberg G, Wegenius G, Reber A, Hedenstierna G. Atelectasis and pulmonary shunting during induction of general anaesthesia--can they be avoided? Acta Anaesthesiol Scand 1996; 40: 524-9.
24 Rusca M, Proietti S, Schnyder P, et al. Prevention of atelectasis formation during induction of general anesthesia. Anesth Analg 2003; 97: 1835-9
25 Coussa M, Proietti S, Schnyder P, et al. Prevention of atelectasis formation during the induction of general anesthesia in morbidly obese patients. Anesth Analg 2004; 98: 1491-5.
26 Gander S, Frascarolo P, Suter M, Spahn DR, Magnusson L. Positive end-expiratory pressure during induction of general anesthesia increases duration of nonhypoxic apnea in morbidly obese patients. Anesth Analg 2005; 100: 580-4.
27 Herriger A, Frascarolo P, Spahn DR, Magnusson L. The effect of positive airway pressure during pre-oxygenation and induction of anaesthesia upon duration of non-hypoxic apnoea. Anaesthesia 2004; 59: 243-7.
28 Robinson JD, Lupkiewicz SM, Palenik L, Lopez LM, Ariet M. Determination of ideal body weight for drug dosage calculations. Am J Hosp Pharm 1983; 40: 1016-9.
57
29 Mentell O, Revenas B, Jonsson L. A new hybrid anaesthetic circuit for a low-flow rebreathing technique. Acta Anaesthesiol Scand 1994; 38: 840-4.
30 Rothen HU, Sporre B, Engberg G, Wegenius G, Hedenstierna G. Airway closure, atelectasis and gas exchange during general anaesthesia. Br J Anaesth 1998; 81: 681-6.
31 Willett W, Stampfer MJ. Total energy intake: implications for epidemiologic analyses. Am J Epidemiol 1986; 124: 17-27.
32 Tanoubi I, Drolet P, Donati F. Optimizing preoxygenation in adults. Can J Anaesth 2009; 56: 449-66.
33 Baraka AS, Taha SK, Aouad MT, El-Khatib MF, Kawkabani NI. Preoxygenation: comparison of maximal breathing and tidal volume breathing techniques. Anesthesiology 1999; 91: 612-6.
34 Joyce CJ, Baker AB, Kennedy RR. Gas uptake from an unventilated area of lung: computer model of absorption atelectasis. J Appl Physiol (1985) 1993; 74: 1107-16.
35 Joyce CJ, Williams AB. Kinetics of absorption atelectasis during anesthesia: a mathematical model. J Appl Physiol 1999; 86: 1116-25.
36 Reber A, Engberg G, Wegenius G, Hedenstierna G. Lung aeration. The effect of pre-oxygenation and hyperoxygenation during total intravenous anaesthesia. Anaesthesia 1996; 51: 733-7.
37 Berry CB, Myles PS. Preoxygenation in healthy volunteers: a graph of oxygen “washin” using end-tidal oxygraphy. Br J Anaesth 1994; 72: 116-8.
38 Gunnarsson L, Strandberg A, Brismar B, Tokics L, Lundquist H, Hedenstierna G. Atelectasis and gas exchange impairment during enflurane/nitrous oxide anaesthesia. Acta Anaesthesiol Scand 1989; 33: 629-37.
39 Gunnarsson L, Tokics L, Gustavsson H, Hedenstierna G. Influence of age on atelectasis formation and gas exchange impairment during general anaesthesia. Br J Anaesth 1991; 66: 423-32.
40 McNamara MJ, Hardman JG. Hypoxaemia during open-airway apnoea: a computational modelling analysis. Anaesthesia 2005; 60: 741-6.
41 Ramachandran SK, Cosnowski A, Shanks A, Turner CR. Apneic oxygenation during prolonged laryngoscopy in obese patients: a randomized, controlled trial of nasal oxygen administration. J Clin Anesth 2010; 22: 164-8.
42 Reber A, Engberg G, Sporre B, et al. Volumetric analysis of aeration in the lungs during general anaesthesia. Br J Anaesth 1996; 76: 760-6.
58
43 Rothen HU, Neumann P, Berglund JE, Valtysson J, Magnusson A, Hedenstierna G. Dynamics of re-expansion of atelectasis during general anaesthesia. Br J Anaesth 1999; 82: 551-6.
44 Rothen HU, Sporre B, Engberg G, Wegenius G, Hedenstierna G. Re-expansion of atelectasis during general anaesthesia: a computed tomography study. Br J Anaesth 1993; 71: 788-95.
45 Rothen HU, Sporre B, Engberg G, Wegenius G, Hedenstierna G. Reexpansion of atelectasis during general anaesthesia may have a prolonged effect. Acta Anaesthesiol Scand 1995; 39: 118-25.
46 Lindberg P, Gunnarsson L, Tokics L, et al. Atelectasis and lung function in the postoperative period. Acta Anaesthesiol Scand 1992; 36: 546-53
47 Benoit Z, Wicky S, Fischer JF, et al. The effect of increased FIO2 before tracheal extubation on postoperative atelectasis. Anesth Analg 2002; 95: 1777-81.
48 Maisch S, Reissmann H, Fuellekrug B, et al. Compliance and dead space fraction indicate an optimal level of positive end-expiratory pressure after recruitment in anesthetized patients. Anesth Analg 2008; 106: 175-81.
49 Bergman NA. Distribution of inspired gas during anesthesia and artificial ventilation. J Appl Physiol 1963; 18: 1085-9.
50 Leblanc P, Ruff F, Milic-Emili J. Effects of age and body position on “airway” closure in man. J Appl Physiol 1970; 28: 448-51.
51 Jones RL, Nzekwu MM. The effects of body mass index on lung volumes. Chest 2006; 130: 827-33.
52 Bergman NA. Reduction in resting end-expiratory position of the respiratory system with induction of anesthesia and neuromuscular paralysis. Anesthesiology 1982; 57: 14-7.
53 Bergman NA, Tien YK. Contribution of the closure of pulmonary units to impaired oxygenation during anesthesia. Anesthesiology 1983; 59: 395-401.
54 Hedenstierna G, McCarthy G, Bergstrom M. Airway closure during mechanical ventilation. Anesthesiology 1976; 44: 114-23.
55 Juno J, Marsh HM, Knopp TJ, Rehder K. Closing capacity in awake and anesthetized-paralyzed man. J Appl Physiol Respir Environ Exerc Physiol 1978; 44: 238-44.
56 Strandberg A, Tokics L, Brismar B, Lundquist H, Hedenstierna G. Constitutional factors promoting development of atelectasis during anaesthesia. Acta Anaesthesiol Scand 1987; 31: 21-4.
57 Kang H, Park HJ, Baek SK, Choi J, Park SJ. Effects of preoxygenation with the three minutes tidal volume breathing technique in the elderly. Korean J Anesthesiol 2010; 58: 369-73.
59
58 Machlin HA, Myles PS, Berry CB, Butler PJ, Story DA, Heath BJ. End-tidal oxygen measurement compared with patient factor assessment for determining preoxygenation time. Anaesth Intensive Care 1993; 21: 409-13.
59 McCarthy G, Elliott P, Mirakhur RK, McLoughlin C. A comparison of different pre-oxygenation techniques in the elderly. Anaesthesia 1991; 46: 824-7.
60 Lumb AB, Greenhill SJ, Simpson MP, Stewart J. Lung recruitment and positive airway pressure before extubation does not improve oxygenation in the post-anaesthesia care unit: a randomized clinical trial. Br J Anaesth 2010; 104: 643-7.
61 Gunnarsson L, Tokics L, Lundquist H, et al. Chronic obstructive pulmonary disease and anaesthesia: formation of atelectasis and gas exchange impairment. Eur Respir J 1991; 4: 1106-16.
62 Samain E, Farah E, Delefosse D, Marty J. End-tidal oxygraphy during pre-oxygenation in patients with severe diffuse emphysema. Anaesthesia 2000; 55: 841-6.
63 Pedersen T, Moller AM, Hovhannisyan K. Pulse oximetry for perioperative monitoring. Cochrane Database Syst Rev 2009; 7: CD002013.
64 Moller JT, Johannessen NW, Berg H, Espersen K, Larsen LE. Hypoxaemia during anaesthesia--an observer study. Br J Anaesth 1991; 66: 437-44.
65 Zetterstrom H. Assessment of the efficiency of pulmonary oxygenation. The choice of oxygenation index. Acta Anaesthesiol Scand 1988; 32: 579-84.
66 Zetterstrom H. A slide-rule for assessment of venous admixture. Acta Anaesthesiol Scand 1989; 33: 250-4.
67 Jensen LA, Onyskiw JE, Prasad NG. Meta-analysis of arterial oxygen saturation monitoring by pulse oximetry in adults. Heart Lung 1998; 27: 387-408.
68 Modica R, Rizzo A. Accuracy and response time of a portable pulse oximeter. The Pulsox-7 with a finger probe. Respiration 1991; 58: 155-7.
69 O'Driscoll BR, Howard LS, Davison AG. BTS guideline for emergency oxygen use in adult patients. Thorax 2008; 63 Suppl 6: vi1-68.
70 Marshall BE. Hypoxic pulmonary vasoconstriction. Acta Anaesthesiol Scand Suppl 1990; 94: 37-41.
71 Sylvester JT, Shimoda LA, Aaronson PI, Ward JP. Hypoxic pulmonary vasoconstriction. Physiol Rev 2012; 92: 367-520.
Acta Universitatis UpsaliensisDigital Comprehensive Summaries of Uppsala Dissertationsfrom the Faculty of Medicine 954
Editor: The Dean of the Faculty of Medicine
A doctoral dissertation from the Faculty of Medicine, UppsalaUniversity, is usually a summary of a number of papers. A fewcopies of the complete dissertation are kept at major Swedishresearch libraries, while the summary alone is distributedinternationally through the series Digital ComprehensiveSummaries of Uppsala Dissertations from the Faculty ofMedicine.
Distribution: publications.uu.seurn:nbn:se:uu:diva-209714
ACTAUNIVERSITATIS
UPSALIENSISUPPSALA
2013