Gender Earnings Differentials: This paper examines...
60
Gender Earnings Differentials: The European Experience Patricia Rice November 1999 The World Bank Development Research Group/ Poverty Reduction and Economic Management Network POLICY RESEARCH REPORT ON GENDER AND DEVELOPMENT Working Paper Series, No. 8 The PRR on Gender and Development Working Paper Series disseminates the findings of work in progress to encourage the exchange of ideas about the Policy Research Report. The papers carry the names of the authors and should be cited accordingly. The findings, interpretations, and conclusions are the author’s own and do not necessarily represent the view of the World Bank, its Board of Directors, or any of its member countries. Copies are available online at http: //www.worldbank.org/gender/prr. This paper examines the factors that shape earnings differentials between men and women in European economies. The analysis distinguishes the effects of gender-specific factors from those related to the underlying wage structure of an economy, focusing in particular on the role of “family friendly” social policies such as the provision of parental leave and subsidies for child-care.
Transcript of Gender Earnings Differentials: This paper examines...
Gender Earnings Differentials:The European Experience
Patricia Rice
November 1999The World BankDevelopment Research Group/Poverty Reduction and Economic Management Network
POLICY RESEARCH REPORT ONGENDER AND DEVELOPMENTWorking Paper Series, No. 8
The PRR on Gender and Development Working Paper Series disseminates the findings of work in progress to encourage theexchange of ideas about the Policy Research Report. The papers carry the names of the authors and should be cited accordingly.The findings, interpretations, and conclusions are the author’s own and do not necessarily represent the view of the World Bank, itsBoard of Directors, or any of its member countries.Copies are available online at http: //www.worldbank.org/gender/prr.
This paper examines the factorsthat shape earnings differentialsbetween men and women inEuropean economies. Theanalysis distinguishes the effectsof gender-specific factors fromthose related to the underlyingwage structure of an economy,focusing in particular on therole of “family friendly” socialpolicies such as the provision ofparental leave and subsidies forchild-care.

Gender Earnings Differentials:The European Experience
Patricia RiceDepartment of EconomicsUniversity of Southampton
Abstract
This paper is concerned with the factors that shape earnings differentials betweenmen and women in industrialised economies, and in particular, on the impact ofpolicies designed to promote equal opportunity and equal treatment of men andwomen. These issues are examined empirically for a group of Europeaneconomies: a number of European Union member states, together with Hungary, aprospective EU member. As members of the European Union, countries share acommon legislative framework relating to equal pay and equal opportunities, butin other respects, most notably in the provision of benefits and services forfamilies, the countries display considerable diversity. Given this, we are able toidentify more clearly the impact of social policies and institutions, as distinct fromdirect legislation, on earnings differentials between men and women. The effectsof such policies are expected to vary with earnings levels, and so in this study weexamine gender earnings differentials across the earnings distribution rather thanfocusing on a single point, e.g. the mean.
This paper was prepared as a background research paper for the World Bank’s forthcoming Policy Research Reporton Gender and Development. The views expressed are those of the author and do not necessarily reflect those of theWorld Bank or its member countries. The author wishes to thank Eurostat, the Statistical Office of the EuropeanCommunity, for their assistance in providing access to the European Community Household Panel data.
(Please do not quote without
the author’s permission).
I. Introduction
With the ratification of the Amsterdam Treaty in 1998, the member states of the European
Union confirmed the importance of equal opportunities in the European integration project. The
Treaty of Amsterdam specifically identifies the elimination of inequalities between men and women
as one of its fundamental aims, and an important aspect of this is equality in the labour market. 1
Within Europe, in contrast to the US, social policies to enable individuals to reconcile the demands
of family and working life have been long recognised as important in promoting gender equality.
The development of “family-friendly” social policies has gone hand-in-hand with legislation
establishing the right to equal pay and equal treatment in the workplace in many of the member
states. In this paper, we examine the impact of alternative approaches to family policy across the
member states on earnings outcomes for men and women.
The process of European integration has produced convergence in many areas of policy
that have a bearing on labour market equality for men and women. For nearly a decade, the EU
member states have constituted a single market for goods and services. The basic legislative
framework relating to equal pay and equal treatment in the workplace is common across the EU.
In the area of family policy, however, considerable differences in the nature and extent of
intervention persist across the member states. Recently, EU legislation has set minimum levels of
provision in respect of maternity and parental leave, but in many countries, national provision
predates EU requirements and is significantly more generous. Social democratic welfare states
such as Sweden and Denmark have traditionally provided extensive support to individuals to assist
them in maintaining their attachment to the workforce while raising children. By contrast, countries
3
such as the UK and Ireland have adopted a more laissez-faire approach and provided only a basic
family benefits.
In what follows, we undertake a detailed comparison of earnings differentials between men
and women across EU member states that have differed historically in their approach to the family.
To complement the analysis of the gender earnings gaps within the existing EU partnership, we
examine also conditions in the candidate economies of Eastern Europe. Hungary, the Czech
Republic, Estonia, Poland and Slovenia, are considered to be closest to fulfilling the criteria for
membership and have embarked on the complex screening exercise that precedes membership.2
Under socialism, the economies of eastern Europe provided generous levels of support in the form
benefits and child-care provision, but with the transition to a market economy, many of these
benefits have been reduced or withdrawn. A recent study finds evidence that, despite this, the
transition from socialist to market economy has seen a significant improvement in the relative
position of women in number of eastern European economies, most notably Hungary, Poland and
Slovenia (Brainerd (1997). Our purpose here is to compare the relative position of women in the
candidate economies with that of their counterparts in the established member states.
The analysis of inter-country variations in gender earnings differentials uses techniques
developed by Juhn, Pierce and Murphy (1991, 1993) to identify the role of factors that are related
specifically to gender, as distinct from effects attributable to differences in the underlying wage
structure. First used by Juhn et al to analyses changes over time in earnings differentials between
racial groups in the US, the method has since been employed in a number of studies of earnings
differentials between men and women; for example Blau and Kahn (1992,1996,1997), Brainerd
(1997). Evidently, the informational content of a cross-country comparison of this type depends
crucially on the comparability of the micro-level data. Previous studies have been plagued by
4
problems of data harmonisation, and the inconsistencies between the data series for the individual
countries raise doubts about the robustness of the findings.3 An important advantage of the present
work is that the micro-level data is taken from the European Community Household Panel, an EU
wide survey of private households. The ECHP is based on a common questionnaire and therefore
provides data to a common specification for all participating EU member states. Finding
comparable micro-level data for the nineteen-nineties for the economies of eastern Europe is far
more problematic and data limitations make it necessary to restrict the detailed analysis to
Hungary.
The paper is organised as follows. The next section reviews those aspects of social policy
in Europe that have a direct bearing on the relative position of women in the labour market.
Section III provides an overview of earnings differentials between men and women in the countries
under study, paying attention to the pattern of differentials across the earnings distribution as a
whole rather than focusing solely on sample means. The technique for decomposing earnings
differentials into their gender-specific and wage structure components is described in detail in
section IV, and the remainder of the paper is devoted to a detailed examination of these components
across the European economies.
II. Social Policies in Europe
1. Equal Rights Legislation in Europe
The principle of equal pay for equal work was enshrined in Article 119 of the Treaty of
Rome. Since 1975, this basic principle has been clarified and developed through a series of
5
directives: extending the principle of equal pay to work of equal value; guaranteeing the right to
equal treatment in the workplace; providing for equal treatment of men and women with respect to
both statutory social security and occupational social security (see Appendix, Table A1). These
together comprise the “acquis communautaire” – the body of common rights and obligations which
apply to all member states within the European Union - in the field of equal opportunities for men
and women. It is for the individual member states to determine the procedures by which these rights
may be asserted, but in all cases, they are obliged to ensure that rights based on EU law are
respected and to set aside any national measures which infringe this law. If necessary, a case may
be referred to the European Court of Justice in Luxembourg.
In most European countries, the main forum for the settlement of complaints under the
equal opportunities legislation is the court or tribunal. An important recent development is the
implementation of the European directive on burden of proof in cases of discrimination on the basis
of sex placing the onus on the defendants accused of discrimination at work to prove that the
principle of equal treatment has not been violated.4 In many countries, the role of the courts is
supplemented by other intermediary agencies that may intervene and attempt to settle disputes by
conciliation prior to litigation. In Sweden and Finland, this role is adopted by the Ombudsman; in
Italy, by the local tripartite commissions; and in the UK, by the Equal Opportunities Commission
or the Advisory, Conciliation and Arbitration Service. Increasingly, European trade unions are
active in ensuring the implementation of equality of treatment through collective bargaining
agreements, as in France and Sweden and more recently the UK.
Available evidence suggests substantial variation across member states in the level of
awareness of equality issues and in the level of litigation arising from equal opportunities
legislation. The UK and Ireland rank high in both respects, while in France, Belgium and
6
Luxembourg awareness of these issues appears to be very low, and litigation is rare.5 One
explanation may lie in differences in the history of the legislation. In the UK, legislation in the
form of the Equal Pay Act of 1970 and the Sex Discrimination Act of 1975 predates the EU
directives and was introduced to meet national demands. In many other European countries, while
general statements of the principle of equality may be written into the constitution, legislation
relating to equal pay and equal treatment was not enacted until the 1980s and largely in response to
EU directives.
Hungary, in common with other socialist countries of Eastern Europe, has a long-held
commitment in principle to the equality in the labour market for men and women, and the principle
of equal pay for equal work is embodied in the country’s constitution. As a candidate country for
EU membership, Hungary has embarked on the screening process by which its laws are examined
in relation to the “acquis communataire” with a view to the future adoption of the “acquis”. The
representation of the principle of equality in civil and labour law has been found to be uneven, and
the European Commission has expressed concerns regarding the enforcement of the equality
provisions.6 A significant difference between the transition economies of Eastern Europe and the
EU member states is in the use of the courts to enforce equality provisions. To date, only one case
relating to gender discrimination has come before a court in a central or Eastern Europe country.7
2. Family Policy.8
There is wide recognition in Europe of the importance of social policy in assisting women
to reconcile the demands of professional and family life. As stated by the Council of Social Affairs
of the EU:9
“Policies on career breaks, parental leave and part-time work, as well as flexibleworking arrangements which serve the interests of both employers and employees,
7
are of particular importance to women and men. … In order to strengthen equalopportunities, Member States and the social partners will design, implement andpromote family friendly policies, including affordable, accessible and high qualitycare services for children and other dependants, as well as parental and other leaveschemes.
Historically, there have been wide-ranging differences across the member states in both the nature
and the extent of intervention in the area of family policy. More recently, EU legislation has set
minimum levels of provision, but in many cases, national provision predate EU requirements and is
significantly more generous. Social democratic welfare states, such as Sweden and Denmark, have
traditionally offered extensive support to families through generous levels of benefits and
subsidised child-care. These countries have been characterised as “weak breadwinner states”; the
structure of the tax-benefit system reflecting a presumption that all individuals who are able to
work and not in full-time education are either in employment or seeking employment. On this
basis, tax/benefit payments are determined largely by income and do not depend on gender or
marital status. This is in marked contrast to the so-called “strong breadwinner states” that are
based on a model of the family in which the male is the primary earning, and the married female is
a dependent. Typically in these economies – Ireland and Germany are regarded as good examples -
married men receive additional benefits in respect of dependent spouse and children, and the
benefits received by women are conditional on their marital status. Such arrangements tend to
discourage the labour force participation of married women by imposing high implicit marginal tax
rates on the earnings from employment.
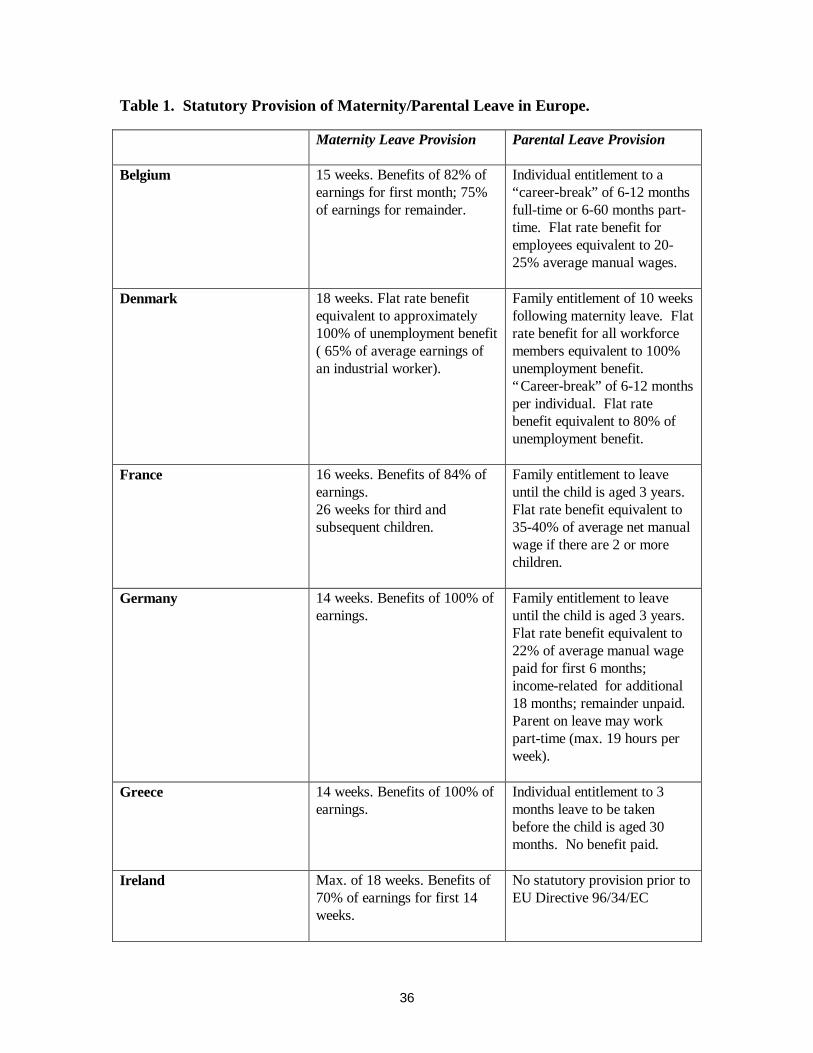
Maternity and parental leave arrangements provide a good illustration of the contrasting
approaches. The EU Maternity Leave Directive (1992) gives all women a statutory entitlement to
a continuous period of 14 weeks paid leave and the right to return to the same or equivalent job. In
general, pre-existing levels of provision in the individual member states were more generous than

8
those set out in the Directive, and its main effect has been to extend statutory entitlement to women
with marginal employment records who failed to qualify for maternity leave under national
legislation. Actual levels of provision vary considering across the EU with most countries
providing between 14 and 18 weeks paid leave and the level of benefits ranging between 65% and
100% of earnings (see Table 1). In Denmark, unlike elsewhere, the benefit rate is linked to
average industrial earnings rather than individual earnings, and hence provides greater support for
lower paid workers.
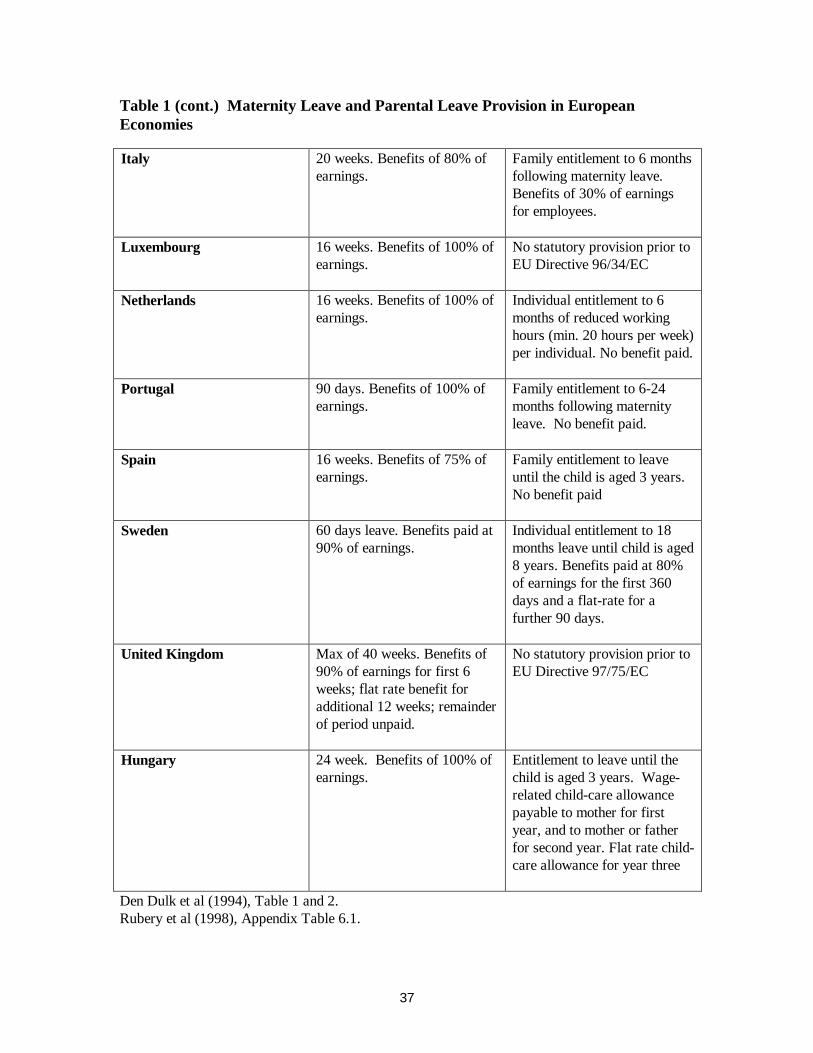
EU legislation relating to minimum requirements for parental leave has been implemented
only recently.10 This provides for up to three months of unpaid leave on the grounds of the birth or
adoption of a child for each parent, and the right of the individual to return to the same, or an
equivalent job, following leave. A number of member states have parental leave policies that
predate the EU legislation, but the length of leave offered and the benefits paid vary considerably.
The maximum period of leave available ranges from three years in France, Germany and Spain to
just three months in Greece. In general, parental leave follows on from maternity leave and runs
continuously, although some countries offer parents the option of taking leave in ‘fractions’ over an
extended period. In a number of countries, parental leave is unpaid and evidence indicates that the
provisions are rarely used.11 Where benefits are provided, they are set at a relatively low level, as
is the case in Germany, France, Italy and Belgium. Denmark and Sweden are notable exceptions.
In Sweden, each parent is entitled to a maximum of fifteen months leave with benefits equivalent to
80 percent of earnings which may be taken as full-time or part-time leave until the child is aged 8
years. The arrangements in Denmark differ in that all workers are entitled to a paid ‘career-break’
of 6-12 months which may be taken for a number of purposes including child-care. While Ireland
and Luxembourg and UK had no statutory provision prior to the adoption of EU policy, there are a
number of pre-existing private sector agreements.
9
The argument for maternity and parental leave provision is that it allows women to
maintain an attachment to the labour force and facilitates their return to employment after
childbearing. That said, the availability of long leave entitlements can be a mixed blessing for
women. If parental leave is an entitlement of the family, rather than the individual, and the levels
of benefit paid are relatively low, these arrangements tend to institutionalise an interrupted
employment pattern for married women and reinforce their role as secondary earners. For
example, in Germany, it is estimated that 95% of all registered births claim parental leave, but less
than 5% of claimants are fathers.12 Where parental leave is an individual entitlement, as in
Denmark, Sweden and the Netherlands, the percentage of eligible men taking leave is significantly
higher, although still well below the corresponding figure for women. In Sweden, for example, 40
percent of fathers took a period of parental leave in 1992 although they accounted for less than 10
percent of total leave taken.13
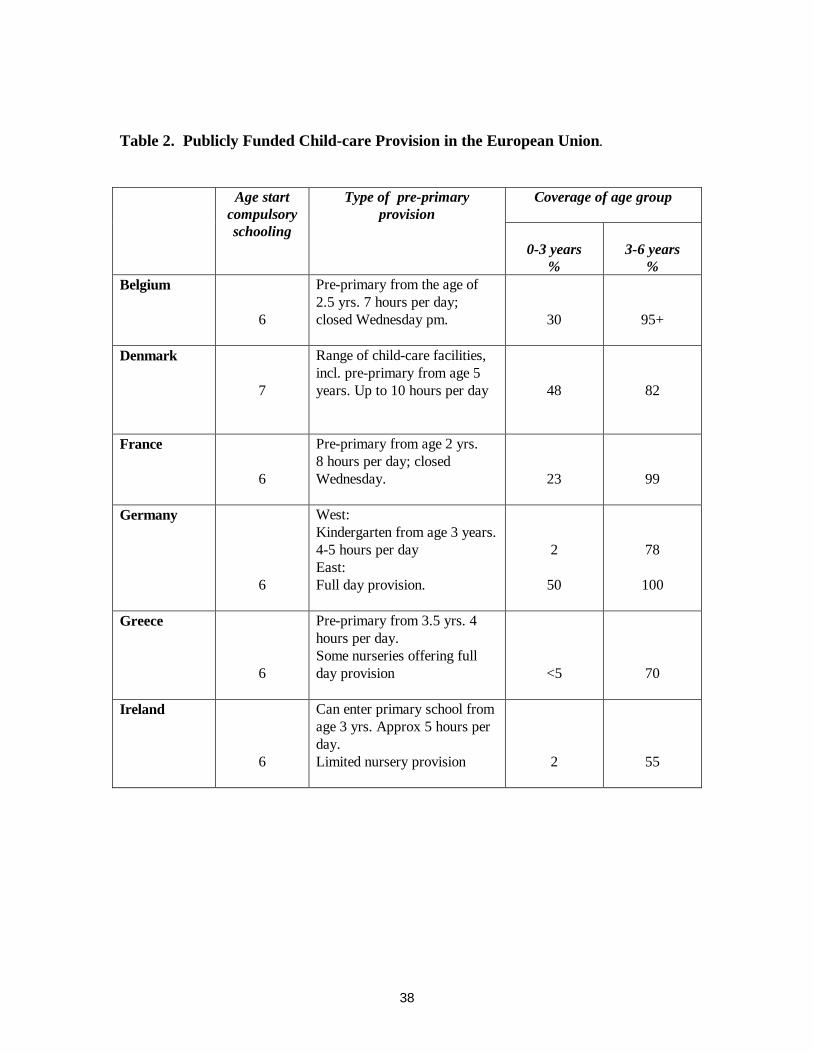
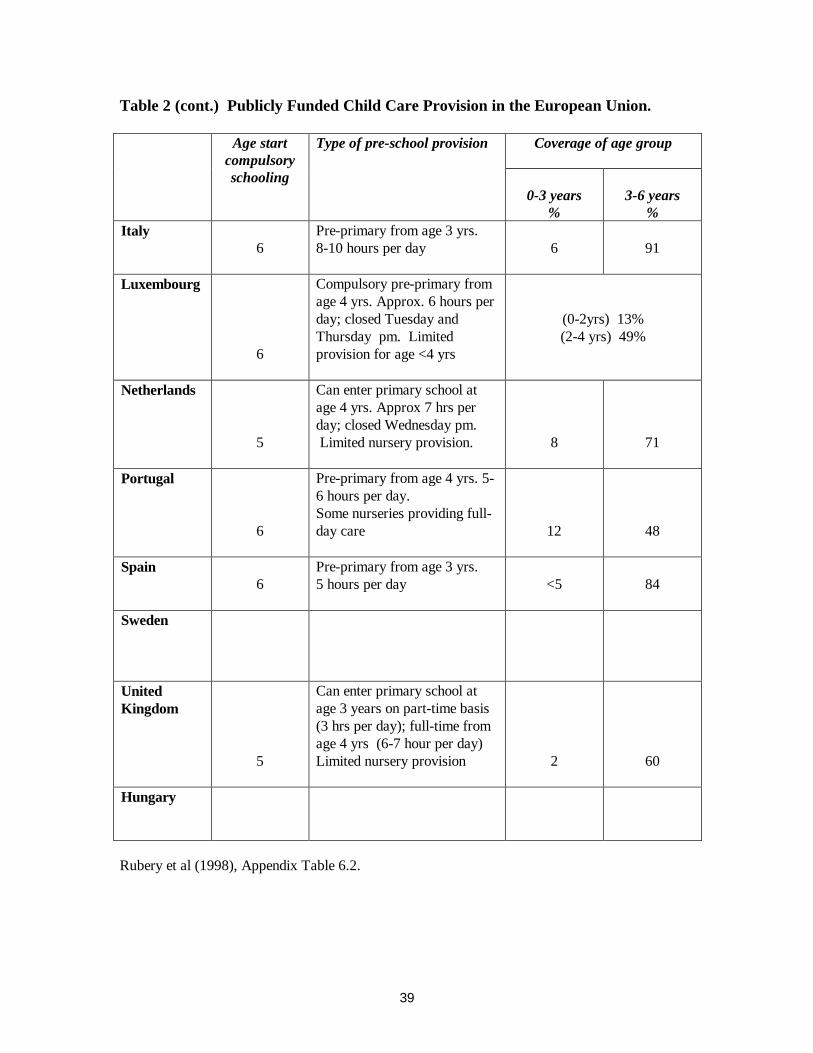
Arrangements for maternity and parental leave may serve only to postpone women’s
withdrawal from the labour market if they are not supported by the extensive provision of
affordable child-care. As Table 2 shows, few countries make significant public provision of child-
care for children aged less than three years. Only in Denmark is there extensive provision for
children in this age range. In France and Belgium, a comprehensive system of publicly provided
pre-school education is available from the age of two years. Provision for the older age group,
those aged 3 to 6 years, is more common. In the majority of member states, access to subsidised
nurseries extends to more than two-thirds of children in this age category, and elsewhere, children
may attend nursery classes within primary schools at an early age. However, the nature of the
provision is not always conducive to mothers undertaking full-time employment. In most countries
– again Denmark and Sweden are the exceptions - pre-school provision is for part-day and/or part-
10
week only, and so either working hours are restricted or publicly provided child-care must be
supplemented by private arrangements.
An alternative to the public provision of child-care is to subsidise the cost of private child-
care either through tax concessions or direct cash benefits. A number of member states – Belgium,
France, Greece, Netherlands and Spain – allow families to offset some fraction of their child-care
costs against tax.14 In the UK, child-care provided by an employer is eligible for tax relief, and the
government has recently introduced a tax credit scheme targeted at low-income families.15
Historically, the socialist economies of Eastern Europe offered families generous levels of
maternity leave and benefits, and in the case of Hungary, these have been largely maintained
through transition. Women are entitled to up to three years of maternity leave per child and
continue to receive maternity benefits and child-care allowances, although their value has been
eroded by inflation (Weil (1993)). Pre-reform, nursery schools provided subsidised child-care for
in excess of 80 percent of children aged 3 to 6 years, although, as in western Europe, provision for
children aged less than 3 years was far more limited. A significant proportion of nursery school
were attached to state enterprises, and with the closure or privatisation of the state enterprises, the
level of subsidised child-care provision has been significantly reduced and costs have risen sharply.
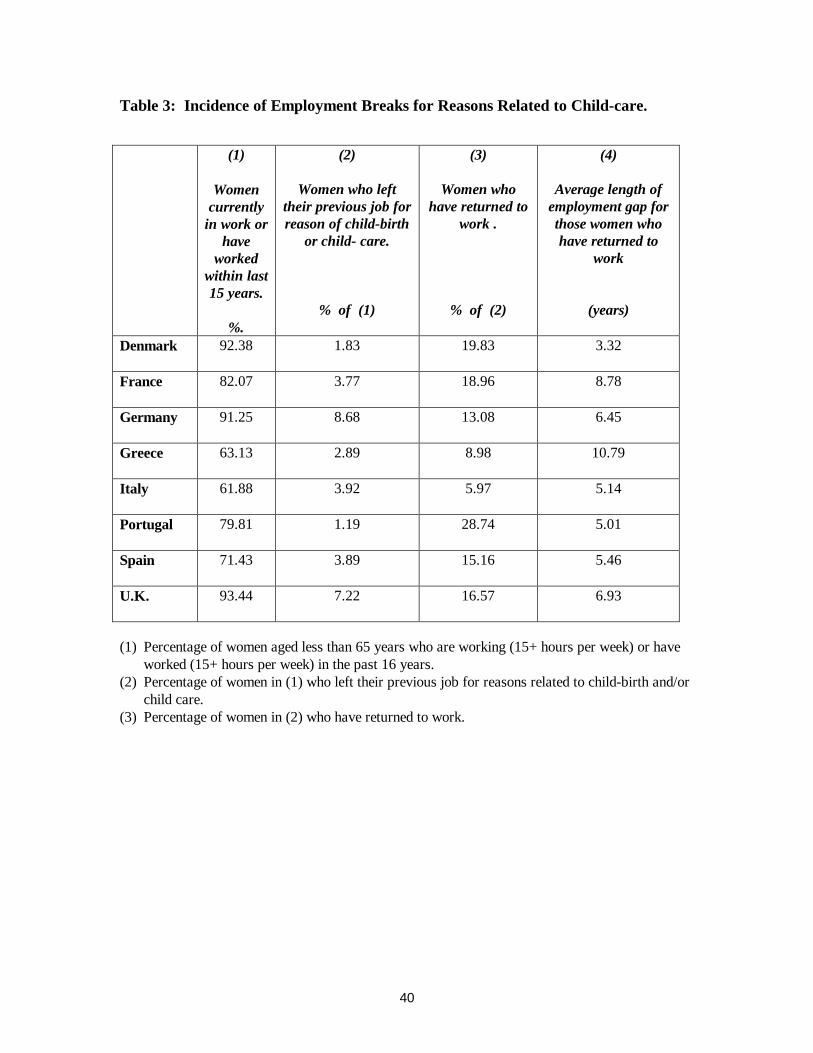
Some insight into the effectiveness of such policies in preserving women’s attachment to
the labour force may be gleaned from the ECHP sample. We consider the sample of women who
have been in paid employment during the previous fifteen years, and report the proportion who left
a previous job for reasons related to child-birth or child care in Table 3. It is instructive to
compare the findings for Denmark, Germany and the UK where the proportion of women with a
recent history of paid employment is in excess of 90 percent. In Denmark, with individual
11
entitlement to parental leave and an extensive system of child-care provision, less than 2 percent of
women left paid employment for reasons related to child-care. In Germany, where family policies
are based more on the “strong breadwinner” model the comparable figure is 8 percent, and in the
UK, it is 7 percent. Further, there is evidence that for those who left their previous job for reasons
related to child-care, the expected duration of the employment gap is significantly shorter in the
case of Denmark than for the other two countries.
III. Gender Earnings Differentials in Europe: An Overview.
The analysis of earnings differentials between men and women in the EU uses data on
earnings and employment characteristics for a sample of individuals aged between 16 and 65 years
who at the time of interview were in paid employment. The information is taken from the second
wave of the European Community Household Panel Study (ECHP), undertaken in 1995.16 The
ECHP is a longitudinal survey of individuals in private households in the EU member states, and
the second wave sampled some 60,000 households including 129,000 adults aged 16 years or older
in thirteen member states of the European Union.17 In this paper, we focus on a subset of eight EU
member states for detailed analysis - Denmark, France, Germany, Greece, Italy, Spain, Portugal
and the UK. This subset provides considerable diversity in terms of size, income per capita,
industrial composition and female participation rates (see Table A2, Appendix). Furthermore, it
allows comparison of countries with welfare states of the “strong breadwinner” type (Germany)
and those in the “weak breadwinner” mode (Denmark), together with more market-orientated
approach of economies like the UK. The Hungarian Household Panel provides broadly
comparable data to the ECHP for Hungary for 1994.18 The Hungarian Household Panel (HHP) is a
nationally representative survey of private households covering some 2600 households. The
12
definitions of key variables relating to employment and earnings are similar in the two data
sources, but the HHP contains rather less information on the individual’s employment history and
job characteristics.
The earnings measure used in the analysis is based on the individual’s reported level of
gross monthly earnings from their primary employment. In the ECHP, this measure is reported as
a continuous variable, but in the HHP, monthly earnings are reported in bands and have been
converted to a continuous variable. Together with information on their current monthly earnings,
individuals report the number of hours worked per week in their main job. By necessity our sample
is restricted to those working a minimum of fifteen hours per work in the survey period and
reporting positive current earnings from employment, and as a result the sample used in this
analysis may under-represent those in part-time employment. (Information of the sample
composition for each country is provided in Table A3).
In general, women work shorter hours on average than their male counterparts, although
the differential varies from as much as 11 hours per week in the UK, where a relatively high
proportion on women work part-time, to less than 4 hours per week in the case of Greece. It is
usual to control for differences in hours of work by considering gross earnings per hour worked.
However, this approach assumes that hourly earnings are independent of the hours worked, and
there is considerable evidence that this is not the case. Payment systems are often designed such
that the hourly wage rate offered depends on the number of hours worked – overtime premia are
the most obvious example.19 Furthermore, it is not generally the case that an individual’s choice of
hours of work in a given job is unconstrained – there may be an upper and/or lower limit on hours
of work or workers may be required to choose between a number of discrete alternatives. In all
13
such cases, the individual worker faces a non-linear budget constraint and their hourly earnings are
a function of the number of hours worked.
In what follows, the average elasticity of monthly earnings with respect to hours worked is
estimated rather than assumed to have a value of unity, and the estimate used to compute a
measure of hours-adjusted monthly earnings. This involves estimating the earnings function
(1)
Where lnRW denotes the natural log of reported monthly earnings from main employment; lnH is
the natural log of weekly hours worked in main job; PT is a dummy variable that takes the value 1
for individuals in part-time employment (less than 30 hours per week) and is zero otherwise; x is a
vector of explanatory variables including individual human capital measures such as level of
education, work experience and job tenure, together with job characteristics such as occupational
group, industry and firm size. The specification of the variables included in x is discussed in at
greater length below. For each country, the earnings function is estimated for males and females
separately. Estimation is by weighted least squares using sampling weights that are inversely
related to the probability that a particular observation is included in the sample.20 The estimates of
the parameters α1 ,α2 ,α3 (with standard errors in parentheses) are reported in Table A4 of the
Appendix. It is worth noting that, as far as full-time employees are concerned, the elasticity of
earnings with respect to hours of work is found to be significantly less than one in all cases. For
males, the estimated values tend to be of similar orders of magnitude across the member states,
although the estimates show rather more variation in the case of females. In the majority of cases,
the differences between full-time and part-time workers are not statistically significant. Where they
jjjjjjj HPTPTHRW εαααα +++++= bxln.lnln 3210
14
are – for example, Denmark, Germany and Greece – they suggest that the monthly earnings of
part-time workers are more responsive to variations in hours of work than is the case for full-time
workers.
Given estimates of the parameters α1 ,α2 ,α3, hours-adjusted monthly earnings based on a
working week of 38 hours are computed as follows:
(2)
Table 3 reports the ratio of female to male (hours-adjusted) earnings computed at a number of
points in the earnings distribution. On the basis of the values at the sample mean, Denmark,
followed by Italy and Portugal have the narrowest gender earnings differentials, and only in
Germany and the UK, does the ratio of female to male earnings fall significantly below 0.8.
However, this provides a good illustration of the drawbacks of focusing narrowly on the sample
mean, particularly where the distribution is skewed. Gender earnings ratios away from the sample
mean differ markedly, and in some countries in which the average women fares relatively well,
those at the lower end of the earnings distribution are in a markedly weaker position. In Spain, the
female to male earnings ratio increases across the deciles of the distribution, from just 72% at the
lowest decile to a figure in excess of 100 percent at the 90th decile. A similar picture emerges for
Portugal, except here the gender gap at the lowest decile of the distribution is smaller, largely as a
result of the relatively high level of the statutory minimum wage. By contrast, in Denmark,
Hungary and the UK , and to a lesser extent Greece, the ratio of female to male earnings declines
significantly from the lower to the upper earnings decile.
jjjjjjj aHPTaPTaHaRWFW )38ln(ˆ)ln(.ˆˆ)ln(ˆlnln 1321 +−−−=
15
Fuller descriptions of the relative earnings of females and males are provided by the kernel
density estimates of the distributions of adjusted earnings in each country depicted in Fig 1.21 As
expected, the female earnings distribution lies to the left of that of males in all cases. In so far as
low ability women are relatively more likely to self-select to remain out of the labour force, the
earnings distribution for females may be expected to be less dispersed and rather more positively
skewed than that of their male counterparts. This is found to be the case for Denmark, Germany,
Hungary and the UK. By contrast, in Spain and Portugal, female earnings display significantly
greater variance than male earnings, and rather less positive skewness, and this accounts for the
tendency for female to male earnings ratios to increase across the deciles of the distribution.
IV. Accounting for Gender Earnings Differentials
A priori, one can identify a number of factors that may contribute to cross country
differences in female-male earnings ratios. Countries may differ in the relative productivity
characteristics of their male and female workers - for example in country A, males and females
have similar levels of work experience, while in country B, women workers have on average a
significantly lower level of work experience than their male colleagues. Countries may differ in the
treatment of men and women with identical productivity characteristics. In country A, the wage
received by a worker with given productivity characteristics is the same irrespective of gender
while in country B, discrimination results in a woman receiving a lower wage than a man with
identical productivity. Finally, inter-country differences in gender earnings differentials may arise
as a result of differences in the underlying wage structure of the two economies, rather than from
factors related to gender per se. Suppose that the relative return to a particular productivity
characteristic, say work experience, is higher in country A than in country B, but in neither country
are the returns to work experience different for men and women. Under these circumstances, a
16
given difference in the average work experience of men and women generates a larger gender
differential in earnings in country A than in country B. There may be many reasons unrelated to
gender why the relative prices of productivity characteristics differ across countries - relative
endowments, the pattern of demand, technology. One aspect that has received particular attention
in the literature is differences across countries in the processes and institutions that determine
wages (Blau and Kahn (1996)).
This paper employs the decomposition method developed by Juhn, Murphy and Pierce
(1991,1993) to assess the relative importance of factors specifically related to gender, as distinct
from the underlying wage structure, in determining gender earnings differentials in European
economies. The earnings of male m in country k may be written as a function of the form
(3)
lnWmk denotes the natural log of earnings, xmk denotes a vector of explanatory variables for
individual m in country k ;bk denotes a vector of coefficients for country k; umk is a standardised
residual (distributed with mean zero and variance one for each country k) and σk is the residual
standard deviation for country k. The vector xmk includes observable productivity characteristics
for individual m in country k, and bk can be interpreted as a vector of prices of the productivity
characteristics in country k; umk is the unobservable component of productivity for individual m,
and σk can be thought of as the price attached to the unobservable productivity component in
country k.
In the absence of discrimination, males and females receive the same price for their
observable productivity characteristics. In what follows, it is assumed that the price received by
mkkkmkmk uW σ+= bxln

17
male workers is the same as the price that would prevail in the absence of discrimination.22 On this
basis, the earnings of female f in country k with observable productivity characteristics xfk may be
written as
(4)
ufk is female f’s unobservable productivity component on the assumption that she receives equal
treatment to males in the labour market with respect to her observable characteristics. To put
it rather differently, given her observable productivity characteristics, female f is treated
equivalently to a male with unobservable productivity of ufk. The male-female earnings differential
at a given point in the distributions (e.g sample means) is then given by
(5)
For the average male, umk=0 by construction. If we observe ∆uk>0 at the sample mean then
there are two possible explanations. Either women in employment in country k are regarded as
having lower unobservable productivity on average than their male counterparts. Or women
workers do not receive equal treatment with respect to their observable productivity characteristics.
In practise, interpretation of the residual gap ∆uk is complicated by the issue of sample
selection. In general, social norms and financial incentives are such that low ability women are
more likely to self-select to remain out of the labour force than their male counterparts so that
female workers are a positively selected group in terms of their unobservable productivity relative
to male workers. Thus, all other things being equal, sample selectivity implies ∆uk<0 at the sample
mean. The term ∆uk is affected also by measurement errors in the observable productivity
fkkkfkfk uW σ+= bxln
][][]ln[ln fkmkkkfkmkfkmkk uuWWD −+−=−≡ σbxx
kkkkfkmkk uWWD ∆+∆=−≡ σbx]ln[ln
18
characteristics that are correlated with gender. For example, if labour market experience is
measured by potential rather than actual experience, gender differences in observable productivity
characteristics tend to be underestimated, and the residual component is correspondingly
overestimated. It is important to note, however, that the prices bk used in the decomposition are
estimated from the male earnings function that is less susceptible to problems of measurement error
or sample selectivity.
Before proceeding further, it is worth comparing this decomposition method with the more
familiar approach of Oaxaca. In the latter case, separate earnings functions for males and females
are specified, and the male-female earnings differential is written as
(6)
The vector of returns received by male workers is denoted by bk as before, and bkf denotes the
vector of returns received by female workers; emk and efk are residual errors with mean of zero. By
construction, the earnings differential at the sample mean is attributed to either differences in
observable productivity characteristic or differences in the prices paid to men and women. Directly
comparing the two methods of decomposition at the sample mean.
A drawback of the Oaxaca procedure is that it requires separate estimation of the earnings function
for female workers and this is likely to be plagued by problems of sample selectivity and
measurement errors.
Returning to the decomposition of earnings differentials given in (3), a difference in D
between two countries k and j may arise from four sources:
][][][]ln[ln fkmkfkfkkkfkmkfkmkk eeWWD −+−+−=−≡ xbbbxx
fkfkkkk u xbb ][ −=∆σ
19
(a) a difference in ∆x i.e. inter-country differences in the relative productivity
characteristics of males and females;
(b) a difference in b i.e. inter-country differences in the prices of observed productivity
characteristics in the labour market;
(c) a difference in ∆u i.e. inter-country differences in the relative positions of male and
female in the residual wage distribution;
(d) a difference in σ i.e. inter-country differences in the residual standard deviation of
male wages.
(a) and (c) reflect differences between the countries in the relative behaviour or treatment of males
and females, and as such may be regarded as gender-specific. By contrast (b) and (d) are not
related specifically to aspects of gender, but arise from inter-country differences in the underlying
wage structure, that is the relative prices of skills/productivity characteristics in labour markets.
An important potential source of cross-country differences in gender earnings gaps is the
legal framework underpinning the rights to equal treatment in the labour market. The EU member
states have for some significant period of time operated within a common framework provided by
the Treaty Articles and Directives listed in Table A1. That said, the individual countries differ in
the procedures adopted to enforce the legislation and there is some evidence to suggest that
legislation may be more effective in some countries than in others. All other thing being equal,
effective legislation is expected to improve the ranking of women workers in the male residual
wage distribution i.e. reduce ∆uk. In addition, effective legislation relating to equal treatment may
reduce ∆xk by increasing the expected returns to investment in human capital for females relative to
that for males.
20
The family policies described in Section 2 impact also on the gender-specific components
by affecting household allocation of time between market and non-market activities. Here, the
effects are more ambiguous. An oft-stated objective of policies such as maternity and parental
leave is to maintain a women’s attachment to the labour force during breaks for child-bearing, and
thereby increase the probability of a relatively early return to work. At the same time, by
providing families with an alternative source of financial support, albeit at a fairly low level in
most cases, such policies may be expected to increase the probability of a woman taking an
employment break.
If the net effect of such policies to increase the expected length of time in the labour market
for women then this increases the incentives for women to invest in general human capital.
Further, if the policies raise the probability that an individual returns to the same employer
following a break for child rearing, the incentives for individuals and employers to invest in firm
specific human capital are greater. Such effects will manifest themselves in a smaller gender gap
between men and women in observable productivity characteristics such as levels of schooling,
work experience and job tenure. To be set against these considerations is the possibility that the
policies operate in such a way that the fixed costs of employing women relative to men are
increased. The higher fixed costs come about through the search and hiring costs associated with
finding replacement workers covering the period of leave – even where the mandated benefits are
met by the state.
In the above decomposition, (b) and (d) reflect inter-country differences in the structure of
wages, i.e. inter-country differences in the relative returns to skills and productivity characteristics
in the labour market. A wide range of factors may contribute to differences in the relative prices of
21
skills across economies, but an aspect that has attracted particular attention is differences in the
institutions and procedures that determine wages. In their comparative analysis of a number of
OECD countries in the 1980s, Blau and Kahn (1996) conclude that the decentralised nature of
wage-setting in the US is an important contributory factor in leading to a more unequal distribution
of earnings for both males and females. More centralised systems of wage determination tend to
compress wage differentials between skill groups and also to reduce the extent of inter-firm and
inter-industry wage variation (Rowthorn (1992)). In addition, a more centralised system may
assist in the speedy and effective implementation of equal opportunities legislation.
Overall, wage-setting in Europe is markedly more centralised than in the US. Unionisation
rates are significantly higher and the coverage of collective bargaining agreements more extensive.
Among the EU member states, Denmark and Sweden are widely regarded as having the most
centralised systems of wage-setting (see Calmfors and Driffill (1988)). Rates of unionisation
exceed 80 percent, in the case of Sweden, and 60 percent in Denmark, and single wage agreements
cover a high proportion of the labour force. Within this centralised framework, explicit efforts
have been made to compress earnings differentials by raising the relative wages of lower paid
workers. By contrast, wage-setting in the UK corresponds more closely to the US model, and wage
dispersion is significantly greater than in the Nordic economies (Rowthorn (1992), p. 509).
Unionisation rates are relatively high, but for the majority of workers within the private sector,
wages are set by single firm agreements or by management. For a transition economy like
Hungary, the transformation from socialism to market economy has led to radical changes in the
processes of wage determination. The centralised system of wage setting has been abandoned and
replaced by a system of tripartite commissions and collective bargaining. The result has been a
marked increase in the wage differentials across occupations and industries (Weil (1993)).
22
Statutory minimum wages play an important role in shaping the wage structure at the
lower end of the distribution. Information on the levels and coverage of minimum wages in the
seven member states of the European Union that had statutory minimum wages in 1997 is provided
in Table A5 of the Appendix. The impact on the overall wage structure is expected to be greatest
in Portugal and France, where the statutory minimum wage exceeded 50 percent of the average
gross earnings of male manual workers in 1996 and coverage extends to all employees aged 18
years or over. Hungary has maintained a statutory minimum wage, although its value as a
percentage of average wages has been eroded during the 1990s, from 42 percent in 1990 to 32
percent in 1994 (Brainerd (1997), Table 2).
V. Gender Differentials: Unequal Productivity v. Unequal Treatment
Implementation of the decomposition of gender earnings differentials outlined in Section IV
requires estimation of the earnings function (3) for male workers in each country. The vector of
observable productivity characteristics, xmk includes measures of the individual’s human capital. An
individual’s general education is measured in terms of the highest level attained. ISCED 0-2
denotes secondary first stage or lower, where secondary first stage corresponds to completion of
compulsory schooling in the majority of European countries. ISCED3 denotes secondary, second
stage which is broadly equivalent to two years of full-time further education following compulsory
schooling. ISCED 5-7 denotes tertiary or degree level education. In addition to the education
variable, there are a number of indicators of the individual’s work experience. These include the
individual’s length of tenure in their current job, which may be regarded as a measure of specific
job skills. A measure of an individual’s general job skills is based on their years of labour market
experience. Unfortunately, as is often the case, the available work history information is not
sufficiently detailed to allow us to determine actual years of labour market experience. Instead, we
23
consider the number of years of potential labour market experience determined as the difference
between the individual’s current age and the age at which she started her first job.23 For individuals
in the ECHP sample, there is additional information on recent gaps in labour market experience in
the form of data on the length of time spent out of employment prior to their current job. The
length of an employment gap is expected to be negatively related to earnings either because of skill
depreciation or because they convey a negative signal regarding worker quality. Unfortunately,
comparable information on employment gaps is not available in the case of Hungary.
Summary statistics for the measures of individual human capital are reported in Table 5.
In the majority of the European economies considered, the average female in paid employment is
better educated than her male counterpart; the notable exceptions being Germany, and to a lesser
extent, the UK. Against this, women tend to have less potential work experience, shorter tenure in
their current employment and longer ‘gaps’ in their recent work experience than is the case for
males. To a large degree, the lower levels of potential work experience of women relative to men,
particularly those in southern Europe, are a reflection of their lower average age. Of greater
interest are the cross-country variations in the length of current job tenure for males and females.
It is noteworthy that in countries with a long established policy of providing support for families in
the form of maternity/parental leave and subsidised child care, for example Denmark and Hungary,
levels of work experience and current job tenure are broadly comparable for men and women. This
is in sharp contrast to the UK, where the provision of benefits and services for families has been
far less extensive. Here, levels of human capital among females in paid employment are
significantly below those for males, particularly with respect to length of current job tenure.
24
In addition to measures of human capital, the vector of observable characteristics, xmk,
includes dummy variables for occupational group, industry group and firm size. It can be argued
that gender differences in these job characteristics are a reflection of discrimination rather than
productivity, and as such, should not included as explanatory variables in the earnings function.
However, their inclusion allows us to distinguish the effects of occupational/industrial segregation
on gender earnings differentials, as distinct from other forms of unequal treatment.
The earnings functions for males are estimated by weighted least squares using sampling
weights, and the parameter estimates bk used to decompose the male-female earnings gap into a
measured characteristics effect and a residual effect as in (3)
The summary statistics for this decomposition are reported in Table 6. Comparable
results obtained using a ‘reduced-form’ specification of the earnings function, which includes only
measures of individual human capital are reported in Table A8 of the Appendix. As already noted,
the HHP contains rather less information than the ECHP; in particular there is no information
relating to recent gaps in the individuals work experience, information on occupation and industrial
group is less detailed, and there is no data on firm size. To allow comparisons between Hungary
and other European economies, we report also the results obtained for Denmark based on this more
restrictive specification of the earnings function.
It is evident that gender differences in measured characteristics account for only a small
proportion of the observed differential in the earnings of men and women at the sample mean. At
most, differences in measured human capital alone, excluding job characteristics, account for
kkkkfkmkk uWWD ∆+∆=−≡ σbx]ln[ln
25
between 20 and 25 percent of the gender gap in earnings in the cases of Germany and the UK.
Elsewhere, the figure is even lower, and in Portugal, measured human capital is higher on average
for females than for males. A similar result is obtained for Hungary, but this is based on the more
restricted specification that excludes the ‘employment gap’ variable and hence is expected to
under-estimate male-female differences in measured human capital.
In general, the inclusion of information on job characteristics significantly increases the
proportion of the gender earnings gap accounted for by measured characteristics. This confirms
that relative to their human capital, females on average suffer from a ‘poorer’ (i.e. lower paying)
job distribution in terms of occupation, industry and firms size than their male counterparts.
Controlling for levels of human capital, women are less likely than men to be employed in those
occupations and industries associated with large positive rents. In this respect, an important
feature of the employment distribution is the very high concentration of female employment in the
social and public services including education, health and social work (Table A7, appendix). In
most of the European economies considered, employment in this particular set of industries attracts
a relatively low return. Also of significance in this context is the distribution of men and women
between junior non-manual occupations such as clerks, sales workers, and craft and other manual
occupations, with women heavily concentrated in the former and males in the latter (Table A6, the
appendix). The relative returns to these two categories of occupations play a significant role in
determining gender earnings differentials. For example, in Hungary, craft and related occupations
receive a high return relative to junior non-manual occupations and this contributes significantly to
the gender earnings gap here.
The final three columns of Table 6 provide summary statistics on the distribution of
residual earnings; i.e. having controlled for measured human capital and job characteristics. On the

26
basis of the computed value of her wage residual, each woman in the sample is assigned a
percentile ranking in the distribution of male wage residuals. Subject to the qualifications
discussed in Section IV, these rankings provide indicators of the extent to which women receive
unequal treatment in the sense that they are regarded as having a lower unobservable productivity
component than their male counterparts or their observable productivity characteristics are treated
as having lower value.
The median and the mean of the distribution of percentile rankings are reported in Table 6.
Conditioning on measurable characteristics, women in paid employment in Denmark are treated as
equivalent on average to a male worker at the 40th percentile of the residual wage distribution, and
half of all women in paid employment are ranked below the 34th percentile of the male distribution.
Broadly similar results are obtained for France, Greece, Hungary and Portugal. At the other
extreme, the average rank for women in Germany is just 30%, and half of all women in paid
employment are ranked at below the 20th percentile. However, in making cross-country
comparisons, the possible effects of sample selectivity should be borne in mind. As already noted
in Section IV, women in paid employment are expected to be a positively selected group with
respect to their unobservable productivity relative to male workers, and further, it is plausible that
the magnitude of this selectivity effect is inversely related to the female participation rate. Hence,
selectivity effects are expected to play a greater role in determining the relatively high residual
ranking of women in Greece, where the participation rate for women is 46 percent, than for
Denmark and Hungary where participation rates for women exceed 70 percent.
Finally, the standard deviation of the male residual wage distribution indicates the
magnitude of the wage penalty that results from this unequal treatment. The Danish residual wage
distribution is markedly less dispersed than in the other EU member states consistent with the
27
argument that its highly centralised process of wage-setting serves to compress wage differentials.
In comparison with other European countries in the sample, Hungary and Germany exhibit
relatively large degree of wage dispersion – in both cases, a consequence of the process of
economic transition in eastern Europe. Thus, while the mean percentile rankings for women in
Denmark and Hungary are roughly equivalent, women in Hungary incur a wage penalty which is
more than twice that of women in Denmark.
VI. Cross Country Differences in Gender Earnings Differentials:
Gender Specific Factors v. Wage Structure.
As discussed in section IV, the difference in the gender earnings differential between
country k and a reference country can be decomposed into four components as follows:
(7)
The first term on the RHS of (7) denotes the contribution of inter-country differences in the relative
productivity characteristics of males and females; often referred to as the “observed X’s effect”.
The second term is the “observed prices effect” and is the contribution of differences between the
countries in the relative prices of observed productivity characteristics in the labour market. The
third term, referred to in the literature as the “gap effect”, measures the impact of differences
between the countries in the relative positions of men and women in the male residual wage
distribution. Subject to the qualifications discussed above, this term may be thought of as an
indicator of differences between the two countries in the extent to which women receive “unequal
treatment”. The final term on the RHS reflects the effect of inter-country differences in the extent
kRkRkRkRkRRkRk uuuDD ∆−+∆−∆+∆−+∆−∆=− ][][][][ σσσxbbbxx
28
of residual wage inequality and may be thought of as picking up the effects of inter-country
differences in wage penalty associated with unequal treatment.
The first and third terms in the above decomposition reflect differences between the
countries in the relative behaviour or treatment of males and females, and as such may be regarded
as gender-specific. By contrast the second and fourth are not related specifically to aspects of
gender, but arise from inter-country differences in the underlying wage structure, that is the relative
returns to observable productivity characteristics in labour markets. That said, discrimination
could affect the wage structure prevailing in an economy. In particular, if discrimination leads to
job segregation with women “crowded” into particular occupations or industries then this would be
reflected in wage differentials across occupations and/or industries. The decomposition is used to
compare of gender earnings differentials across the European economies taking as the reference
country is Denmark, which has narrowest gender earnings differentials in the set. The results
obtained applying the decomposition to the sample means of the distribution are reported in Table
7
Only in a minority of cases – Germany, France and the UK - do we find that differences in
observed characteristics account for a significant proportion of the greater gender earnings gap
relative to Denmark. For Hungary and the economies of southern Europe, the observed
characteristics effect is negative; i.e. valued at Danish prices, the gender gap in observed
characteristics is smaller in these countries than in Denmark. This is a reflection in part of the
relatively high levels of education among women in paid employment in southern Europe described
in the section V. However, cross-country differences in the pattern of employment for males and
females play a role also. Danish women are placed at a disadvantage relative to male workers by
their high concentration in the junior non-manual occupations and the public and social services
29
sector. By comparison, female employment in southern Europe and more particularly Hungary is
far more dispersed.
In general, price differentials between measured productivity characteristics, both human
capital and job characteristics, are markedly narrower in Denmark than elsewhere in Europe. This
may or may not be to the relative advantage of women depending on the distribution of the
observed characteristics in the economy. In the majority of European countries in the sample, the
education levels of women in paid employment exceed those of male workers and so a higher rate
of return to education reduces the gender gap in earnings. The impact of wider occupational and
industrial wage differentials is more mixed. In some cases, wider occupational wage differentials
operate to the advantage of women, as for example, in Germany and Italy where junior non-manual
and sales occupations attract larger positive rents. Elsewhere, the pattern of occupational and
industrial wage differentials tends to favour those areas of employment where males predominate,
and this is particularly marked in the case of Hungary and Greece.
It is evident from Table 7 that among the EU member states, the main explanation for the
larger gender gap in earnings relative to Denmark lies in differences between the countries in the
residual wage distribution and in the relative position of women in this wage distribution. In each
country, the average woman is ranked lower in the residual wage distribution than is the case in
Denmark. Further, given that female participation rates in Denmark exceed those in the other EU
member states, this so-called “gap effect” is expected to be underestimated as a result of sample
selectivity. The greater degree of dispersion of residual wages in the other EU member states
means that low rank attracts a larger wage penalty than would be the case in Denmark. Taken
together, these two “residual” effects contribute significantly more to the relative magnitudes of the
30
gender earnings gap in the two countries than the effects associated with the observable
characteristics.
The situation in Hungary does differ somewhat from that in the EU member states. With
respect to gender-specific factors – observable characteristics and unobservable productivity – the
male-female differential in Hungary is estimated to be smaller than in Denmark. The major
difference between the economies is in the wage structure effects. First, price differentials for
observable productivity characteristics are considerably wider in Hungary and this tends to favour
male workers, in particular the structure of occupational wage differentials. Secondly, the variance
of the residual wage distribution is far greater in Hungary than in the EU member states, implying
that those workers regarded as having below average unobservable productivity suffer from a
relatively large wage penalty.
The discussion to date has focused on a comparison of the gender earnings gap at a single
point in the wage distribution – namely the sample mean. Is this representative of the distribution
as a whole? To address this question, we use the same decomposition technique to examine gender
earnings gaps in the tails of the distribution. More specifically, we examine the male-female
earnings differential averaging over the lower quartile of the distribution of adjusted monthly
earnings, and averaging over the upper quartile of the distribution. The results of this analysis are
reported in Table 8.
As noted earlier, there is considerable variation in the magnitude of the gender gaps across
the quartiles of the distribution, both in absolute terms and relative to Denmark. The results in
Table 8 suggest that conditions in the labour market in Denmark are markedly more favourable to
women in lower paid employment than those prevailing elsewhere in Europe. However, the picture
31
is rather different for women in the upper quartile of the earnings distribution. Among those in
higher paid employment, the gender earnings gap relative to Denmark is smaller in general, and in
a number of the southern European countries - Spain, Portugal, Italy -women fare better relative to
male workers than their counterparts in Denmark.
Decomposition of the gender earnings gaps reveals that differences across the quartiles of
the distribution stem in large part from the gender-specific effects. Among lower paid women, an
important source of inter-country differences in gender earnings differentials lies in the so-called
“gap” effects. The weak position of low paid women in the other EU member states relative to
those is Denmark is attributable in large part to their much lower ranking in the residual wage
distribution. Among higher paid employees, we find far less cross-country variation in the “gap”
effect. For those in the upper quartile of the earning distribution, differences in observable
productivity characteristics are the main factor shaping inter-country differences in the gender
earnings gap. The small gender earnings gap among higher paid employees in the southern
European economies reflects the favourable distribution of observable productivity characteristics
among women in these economies.
VI. Conclusions
Despite an EU commitment to the mainstreaming of equal opportunities in all policy areas
and increasing harmonisation of policies relating to equal opportunities and equal treatment,
considerable differences persist in the relative position of women across the economies of the EU.
In this paper, we have sought to identify the sources of these inter-country differences, and in
particular to assess the role of social policies designed to assist individuals in reconciling the
demands of family and working life. A lesson from this analysis is the importance of considering
32
the relative position of women across the earnings distribution rather than focusing solely on the
average women. As the results for Europe illustrate, the shape of the earnings distributions for
males and female tend to differ significantly and consequently the ratio of female to male earnings
varies markedly across the deciles of the distribution. As in the case of Spain and Portugal, labour
market conditions may be such that the average women fares well relative to her male counterpart,
while those in the lowest deciles of the earnings distribution may be in a considerably weaker
position.
The analysis of gender earnings differentials undertaken in this study employs
decomposition techniques to distinguish the effects of gender-specific factors from those associated
with the underlying wage structure of an economy. The aspect of the wage structure that exerts
the strongest influence on gender earnings differentials is the degree of residual wage dispersion in
an economy. The system of centralised wage bargaining in Denmark results in both narrow wage
differentials between skill groups and a low residual wage inequality. The effects are particularly
marked in comparison with the economies of Germany and Hungary where the high levels of
earnings inequality that have followed the process of transition and re-unification are an important
factor in the relatively weak position of women in these economies.
Gender-specific effects impact on the earnings differentials of men and women in two
ways; through their effect on the relative levels of observable productivity characteristics such as
schooling, job tenure and the distribution of employment, and through the relative treatment of men
and women with the same observable characteristics. For those in the lower half of the earnings
distribution, it is the latter that provide the greater component of cross-country variation in the
magnitude of the gender earnings gap. Lower paid women in Denmark fare better relative to male
workers than their counterparts elsewhere in Europe because they receive more equal treatment as
33
indicated by their higher ranking in the residual wage distribution. However, the picture appears
rather different for those in the upper tail of the earnings distribution. Here, we find relatively
small differences across the economies in the ranking of female workers in the residual wage
distribution. Among this group, differences in observable productivity characteristics play a much
greater role in determining cross-country differences in the gender earnings. Higher paid women in
the southern European economies Portugal, Italy and Spain fare considerably better relative in this
respect women in Germany, the UK and even Denmark. This is due in part to relatively high levels
of human capital, particularly general education, but of greater significance is the lower level of
occupational and industrial segregation of female employment in these countries when compared to
the economies of northern Europe.
Among the European countries in the sample, Denmark is distinguished by its long-
standing commitment to policies which enable the individual, irrespective of gender, to combine
family and work responsibilities. By allowing women to maintain a stable attachment to the work-
force while rearing their children, such policies increase the incentives for women to invest in
education and training and so improve their observable productivity characteristics. However, the
evidence presented in this study suggests that the main benefit of such policies, particularly for
lower paid women, lies in mitigating the perception of married women as having only a weak
attachment to employment which results in women being attributed with lower levels of
unobservable productivity.
References
Blau, F., and L. Kahn (1992). “The gender earnings gap: Learning from internationalcomparisons”. American Economic Review, 82 (2).
Blau, F., and L. Kahn (1996). “Wage structure and gender earnings differentials: an internationalcomparison”. Economica, 63 (Supplement).
Blau, F., and L. Kahn (1997). “Swimming upstream: Trend in the gender earnings differential inthe 1980s”. Journal of Labor Economics, 15 (1).
Blom, J.and R. Knegt (1996). “Actual use and significance of sex equality legislation in theEuropean Union” in Hessel, B., J. Schippers and J. Siegers (eds) Labour Market Inequalitybetween Men and Women. Amsterdam: Thesis Publishers.
Brainerd, E. (1997). “ Women in transition: Changes in gender wage differentials in easternEurope and the former Soviet Union”. Luxembourg Income Studies Working Paper Series,(December).
Calmfors, L and E.J.D. Driffill (1988). “ Centralisation of Wage Bargaining”. Economic Policy,6, pp. 14-61.
Commission of the European Communities (1999), “Equal Opportunities for Women and Men inthe European Union 1998”. Annual Report from the Commission, Brussels
Den Dulk, L., A. van Doorne-Huiskes and J. Schippers (1996). “Work-family policies:opportunities or men and women” in Hessel, B., J. Schippers and J. Siegers (eds) Labour MarketInequality between Men and Women. Amsterdam: Thesis Publishers.
Eurostat (1996). “The European Community Household Panel (ECHP): Volume 1 – SurveyMethodology and Implementation” Theme 3, Series E, Eurostat, OPOCE, Luxembourg.
Eurostat (1996). “The European Community Household Panel (ECHP): Volume 1 – SurveyQuestionnaires, Waves 1-3”, Theme 3, Series E, Eurostat, OPOCE, Luxembourg.
Fortin, N., and T. Lemieux (1997). “ Rank regressions, wage distributions and the gender gap”.Journal of Human Resources 33 (3).
Juhn, C., Murphy, K., and B. Pierce (1991). “Accounting for the slowdown in black-white wageconvergence”. In M.H. Kosters (ed) Workers and their Wages. Washington D.C.: AEI Press.
Juhn, C., Murphy, K., and B. Pierce (1993). “Wage inequality and the rise in the returns to skill”.Journal of Political Economy, 101.
35
Paci, P. (1999). “A bundle of joy or an expensive luxury: A comparative analysis of the economicenvironment for family formation in Western Europe”. Social Protection Discussion Paper 9903.Washington D.C.:World Bank.
Psacharopoulos, G and Z. Tzannatos (1991). “Women’s Employment and Pay in Latin America”.World Bank, Latin America and the Caribbean Technical Dept., Regional Studies Report, 10.
Rubery, J., M. Smith, C. Fagan and D. Grimshaw (1998). Women and European Employment,Routledge: London.
Rowthorn, R.E. (1992). “Centralisation, employment and wage dispersion”. Economic Journal,102, pp.506-523.
Weil, G. (1993). “Economic reform and women”. In Moghadan, V.(ed), Democratic reform andthe Position of Women in Transitional Economies, Oxford: OUP.
Zabalza, A., and J.L. Arrufat (1985). “The extent of sex discrimination in Great Britain”. InZabalza, A., and Tzannatos, Z.(eds), Women and Equal Pay, Cambridge: CUP.
36
Table 1. Statutory Provision of Maternity/Parental Leave in Europe.
Maternity Leave Provision Parental Leave Provision
Belgium 15 weeks. Benefits of 82% ofearnings for first month; 75%of earnings for remainder.
Individual entitlement to a“career-break” of 6-12 monthsfull-time or 6-60 months part-time. Flat rate benefit foremployees equivalent to 20-25% average manual wages.
Denmark 18 weeks. Flat rate benefitequivalent to approximately100% of unemployment benefit( 65% of average earnings ofan industrial worker).
Family entitlement of 10 weeksfollowing maternity leave. Flatrate benefit for all workforcemembers equivalent to 100%unemployment benefit.“Career-break” of 6-12 monthsper individual. Flat ratebenefit equivalent to 80% ofunemployment benefit.
France 16 weeks. Benefits of 84% ofearnings.26 weeks for third andsubsequent children.
Family entitlement to leaveuntil the child is aged 3 years.Flat rate benefit equivalent to35-40% of average net manualwage if there are 2 or morechildren.
Germany 14 weeks. Benefits of 100% ofearnings.
Family entitlement to leaveuntil the child is aged 3 years.Flat rate benefit equivalent to22% of average manual wagepaid for first 6 months;income-related for additional18 months; remainder unpaid.Parent on leave may workpart-time (max. 19 hours perweek).
Greece 14 weeks. Benefits of 100% ofearnings.
Individual entitlement to 3months leave to be takenbefore the child is aged 30months. No benefit paid.
Ireland Max. of 18 weeks. Benefits of70% of earnings for first 14weeks.
No statutory provision prior toEU Directive 96/34/EC
37
Table 1 (cont.) Maternity Leave and Parental Leave Provision in EuropeanEconomies
Italy 20 weeks. Benefits of 80% ofearnings.
Family entitlement to 6 monthsfollowing maternity leave.Benefits of 30% of earningsfor employees.
Luxembourg 16 weeks. Benefits of 100% ofearnings.
No statutory provision prior toEU Directive 96/34/EC
Netherlands 16 weeks. Benefits of 100% ofearnings.
Individual entitlement to 6months of reduced workinghours (min. 20 hours per week)per individual. No benefit paid.
Portugal 90 days. Benefits of 100% ofearnings.
Family entitlement to 6-24months following maternityleave. No benefit paid.
Spain 16 weeks. Benefits of 75% ofearnings.
Family entitlement to leaveuntil the child is aged 3 years.No benefit paid
Sweden 60 days leave. Benefits paid at90% of earnings.
Individual entitlement to 18months leave until child is aged8 years. Benefits paid at 80%of earnings for the first 360days and a flat-rate for afurther 90 days.
United Kingdom Max of 40 weeks. Benefits of90% of earnings for first 6weeks; flat rate benefit foradditional 12 weeks; remainderof period unpaid.
No statutory provision prior toEU Directive 97/75/EC
Hungary 24 week. Benefits of 100% ofearnings.
Entitlement to leave until thechild is aged 3 years. Wage-related child-care allowancepayable to mother for firstyear, and to mother or fatherfor second year. Flat rate child-care allowance for year three
Den Dulk et al (1994), Table 1 and 2.Rubery et al (1998), Appendix Table 6.1.
38
Table 2. Publicly Funded Child-care Provision in the European Union.
Coverage of age groupAge startcompulsoryschooling
Type of pre-primaryprovision
0-3 years%
3-6 years%
Belgium
6
Pre-primary from the age of2.5 yrs. 7 hours per day;closed Wednesday pm. 30 95+
Denmark
7
Range of child-care facilities,incl. pre-primary from age 5years. Up to 10 hours per day 48 82
France
6
Pre-primary from age 2 yrs.8 hours per day; closedWednesday. 23 99
Germany
6
West:Kindergarten from age 3 years.4-5 hours per dayEast:Full day provision.
2
50
78
100
Greece
6
Pre-primary from 3.5 yrs. 4hours per day.Some nurseries offering fullday provision <5 70
Ireland
6
Can enter primary school fromage 3 yrs. Approx 5 hours perday.Limited nursery provision 2 55
39
Table 2 (cont.) Publicly Funded Child Care Provision in the European Union.
Coverage of age groupAge startcompulsoryschooling
Type of pre-school provision
0-3 years%
3-6 years%
Italy6
Pre-primary from age 3 yrs.8-10 hours per day 6 91
Luxembourg
6
Compulsory pre-primary fromage 4 yrs. Approx. 6 hours perday; closed Tuesday andThursday pm. Limitedprovision for age <4 yrs
(0-2yrs) 13%(2-4 yrs) 49%
Netherlands
5
Can enter primary school atage 4 yrs. Approx 7 hrs perday; closed Wednesday pm. Limited nursery provision. 8 71
Portugal
6
Pre-primary from age 4 yrs. 5-6 hours per day.Some nurseries providing full-day care 12 48
Spain6
Pre-primary from age 3 yrs.5 hours per day <5 84
Sweden
UnitedKingdom
5
Can enter primary school atage 3 years on part-time basis(3 hrs per day); full-time fromage 4 yrs (6-7 hour per day)Limited nursery provision 2 60
Hungary
Rubery et al (1998), Appendix Table 6.2.
40
Table 3: Incidence of Employment Breaks for Reasons Related to Child-care.
(1)
Womencurrently
in work orhave
workedwithin last15 years.
%.
(2)
Women who lefttheir previous job forreason of child-birth
or child- care.
% of (1)
(3)
Women whohave returned to
work .
% of (2)
(4)
Average length ofemployment gap forthose women whohave returned to
work
(years)
Denmark 92.38 1.83 19.83 3.32
France 82.07 3.77 18.96 8.78
Germany 91.25 8.68 13.08 6.45
Greece 63.13 2.89 8.98 10.79
Italy 61.88 3.92 5.97 5.14
Portugal 79.81 1.19 28.74 5.01
Spain 71.43 3.89 15.16 5.46
U.K. 93.44 7.22 16.57 6.93
(1) Percentage of women aged less than 65 years who are working (15+ hours per week) or haveworked (15+ hours per week) in the past 16 years.
(2) Percentage of women in (1) who left their previous job for reasons related to child-birth and/orchild care.
(3) Percentage of women in (2) who have returned to work.
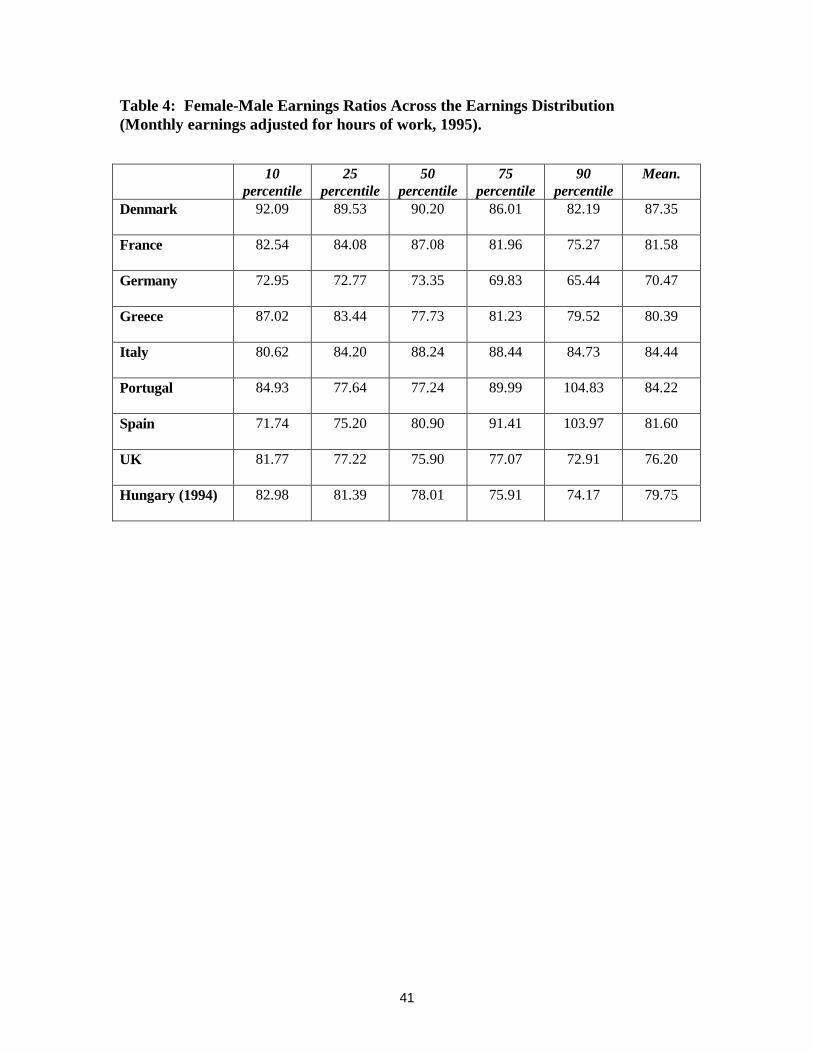
41
Table 4: Female-Male Earnings Ratios Across the Earnings Distribution(Monthly earnings adjusted for hours of work, 1995).
10percentile
25percentile
50percentile
75percentile
90percentile
Mean.
Denmark 92.09 89.53 90.20 86.01 82.19 87.35
France 82.54 84.08 87.08 81.96 75.27 81.58
Germany 72.95 72.77 73.35 69.83 65.44 70.47
Greece 87.02 83.44 77.73 81.23 79.52 80.39
Italy 80.62 84.20 88.24 88.44 84.73 84.44
Portugal 84.93 77.64 77.24 89.99 104.83 84.22
Spain 71.74 75.20 80.90 91.41 103.97 81.60
UK 81.77 77.22 75.90 77.07 72.91 76.20
Hungary (1994) 82.98 81.39 78.01 75.91 74.17 79.75
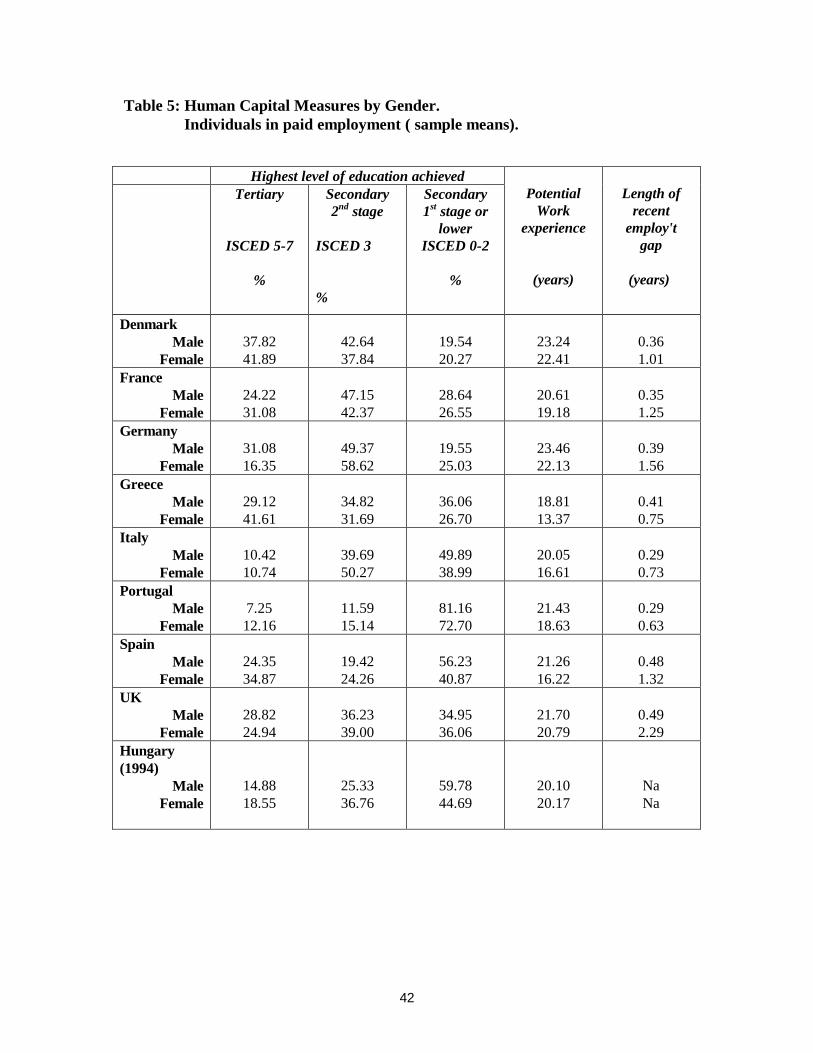
42
Table 5: Human Capital Measures by Gender. Individuals in paid employment ( sample means).
Highest level of education achievedTertiary
ISCED 5-7
%
Secondary2nd stage
ISCED 3
%
Secondary1st stage or
lowerISCED 0-2
%
PotentialWork
experience
(years)
Length ofrecent
employ'tgap
(years)
DenmarkMale
Female37.8241.89
42.6437.84
19.5420.27
23.2422.41
0.361.01
FranceMale
Female24.2231.08
47.1542.37
28.6426.55
20.6119.18
0.351.25
GermanyMale
Female31.0816.35
49.3758.62
19.5525.03
23.4622.13
0.391.56
GreeceMale
Female29.1241.61
34.8231.69
36.0626.70
18.8113.37
0.410.75
ItalyMale
Female10.4210.74
39.6950.27
49.8938.99
20.0516.61
0.290.73
PortugalMale
Female7.2512.16
11.5915.14
81.1672.70
21.4318.63
0.290.63
SpainMale
Female24.3534.87
19.4224.26
56.2340.87
21.2616.22
0.481.32
UKMale
Female28.8224.94
36.2339.00
34.9536.06
21.7020.79
0.492.29
Hungary(1994)
MaleFemale
14.8818.55
25.3336.76
59.7844.69
20.1020.17
NaNa
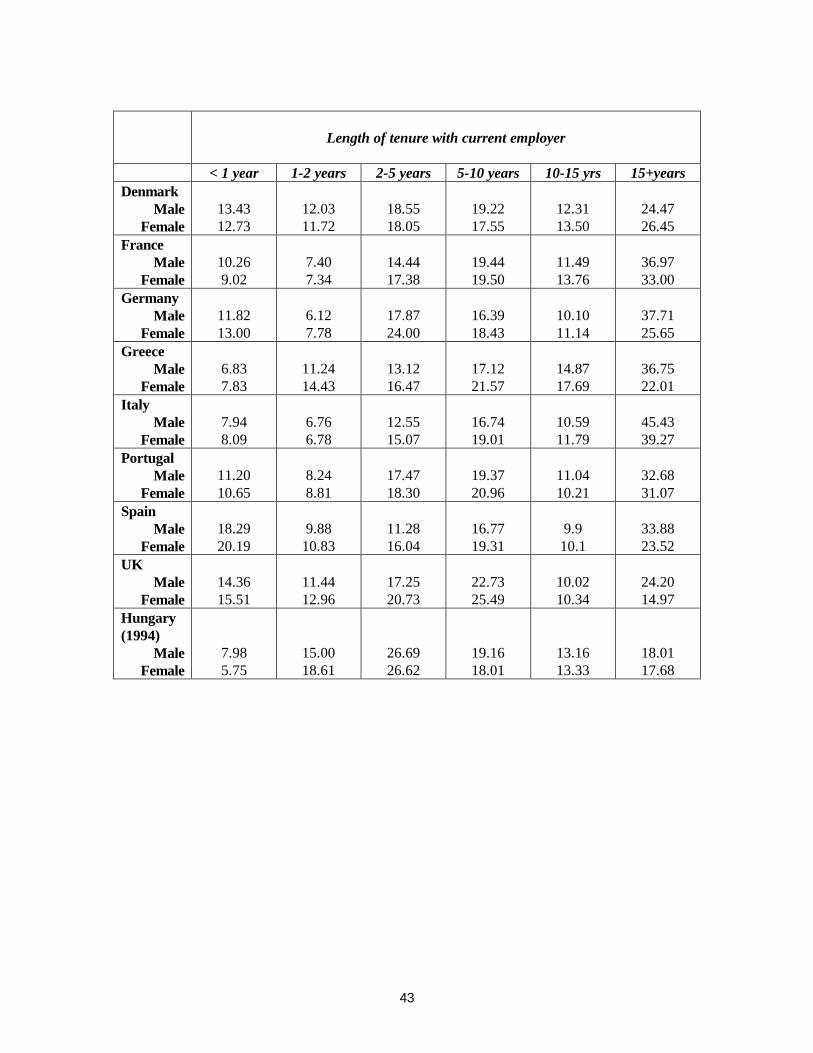
43
Length of tenure with current employer
< 1 year 1-2 years 2-5 years 5-10 years 10-15 yrs 15+yearsDenmark
MaleFemale
13.4312.73
12.0311.72
18.5518.05
19.2217.55
12.3113.50
24.4726.45
FranceMale
Female10.269.02
7.407.34
14.4417.38
19.4419.50
11.4913.76
36.9733.00
GermanyMale
Female11.8213.00
6.127.78
17.8724.00
16.3918.43
10.1011.14
37.7125.65
GreeceMale
Female6.837.83
11.2414.43
13.1216.47
17.1221.57
14.8717.69
36.7522.01
ItalyMale
Female7.948.09
6.766.78
12.5515.07
16.7419.01
10.5911.79
45.4339.27
PortugalMale
Female11.2010.65
8.248.81
17.4718.30
19.3720.96
11.0410.21
32.6831.07
SpainMale
Female18.2920.19
9.8810.83
11.2816.04
16.7719.31
9.910.1
33.8823.52
UKMale
Female14.3615.51
11.4412.96
17.2520.73
22.7325.49
10.0210.34
24.2014.97
Hungary(1994)
MaleFemale
7.985.75
15.0018.61
26.6926.62
19.1618.01
13.1613.33
18.0117.68
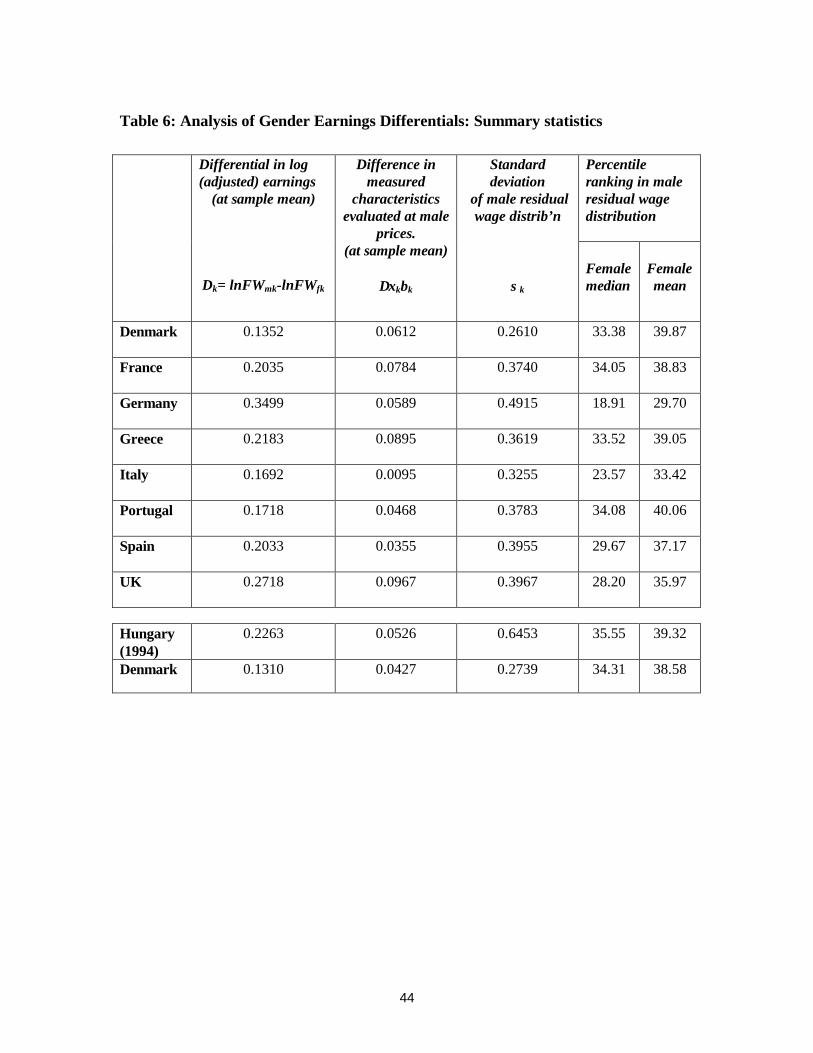
44
Table 6: Analysis of Gender Earnings Differentials: Summary statistics
Percentileranking in maleresidual wagedistribution
Differential in log(adjusted) earnings
(at sample mean)
Dk= lnFWmk-lnFWfk
Difference inmeasured
characteristicsevaluated at male
prices.(at sample mean)
∆xkbk
Standarddeviation
of male residualwage distrib’n
σk
Femalemedian
Femalemean
Denmark 0.1352 0.0612 0.2610 33.38 39.87
France 0.2035 0.0784 0.3740 34.05 38.83
Germany 0.3499 0.0589 0.4915 18.91 29.70
Greece 0.2183 0.0895 0.3619 33.52 39.05
Italy 0.1692 0.0095 0.3255 23.57 33.42
Portugal 0.1718 0.0468 0.3783 34.08 40.06
Spain 0.2033 0.0355 0.3955 29.67 37.17
UK 0.2718 0.0967 0.3967 28.20 35.97
Hungary(1994)
0.2263 0.0526 0.6453 35.55 39.32
Denmark 0.1310 0.0427 0.2739 34.31 38.58
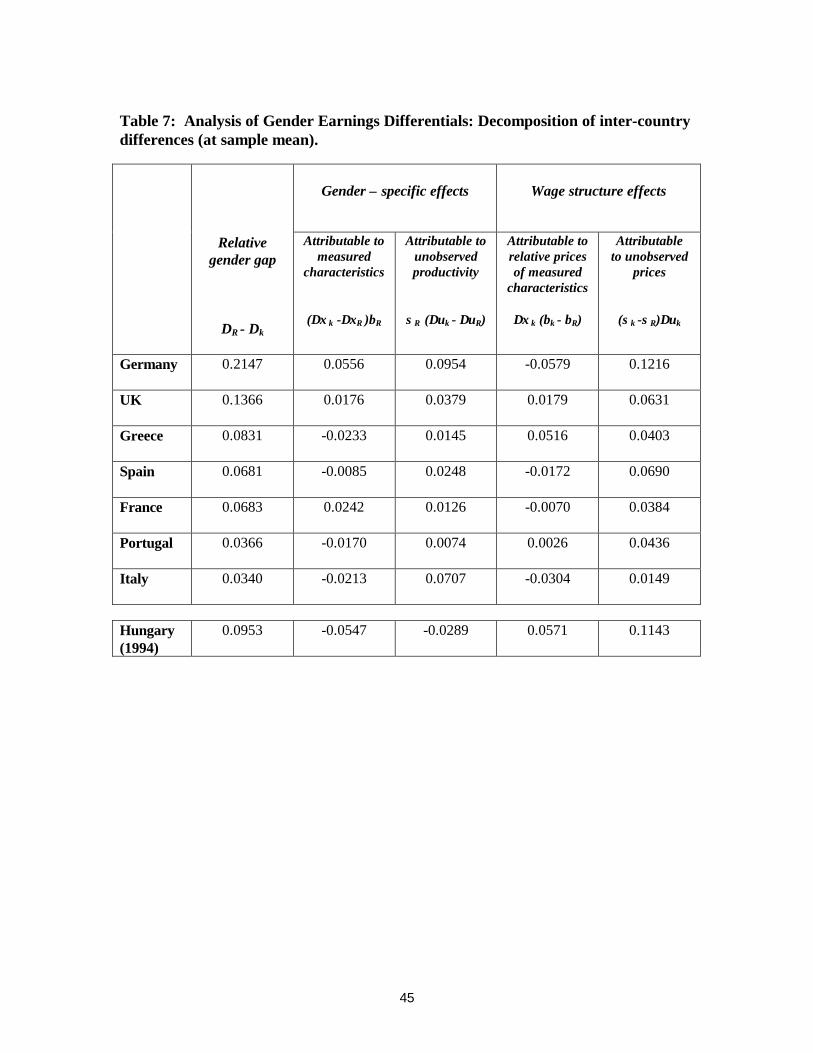
45
Table 7: Analysis of Gender Earnings Differentials: Decomposition of inter-countrydifferences (at sample mean).
Gender – specific effects Wage structure effects
Relativegender gap
DR - Dk
Attributable tomeasured
characteristics
(∆x k -∆xR )bR
Attributable tounobservedproductivity
σR (∆uk - ∆uR)
Attributable torelative pricesof measured
characteristics
∆x k (bk - bR)
Attributableto unobserved
prices
(σk -σR)∆uk
Germany 0.2147 0.0556 0.0954 -0.0579 0.1216
UK 0.1366 0.0176 0.0379 0.0179 0.0631
Greece 0.0831 -0.0233 0.0145 0.0516 0.0403
Spain 0.0681 -0.0085 0.0248 -0.0172 0.0690
France 0.0683 0.0242 0.0126 -0.0070 0.0384
Portugal 0.0366 -0.0170 0.0074 0.0026 0.0436
Italy 0.0340 -0.0213 0.0707 -0.0304 0.0149
Hungary(1994)
0.0953 -0.0547 -0.0289 0.0571 0.1143
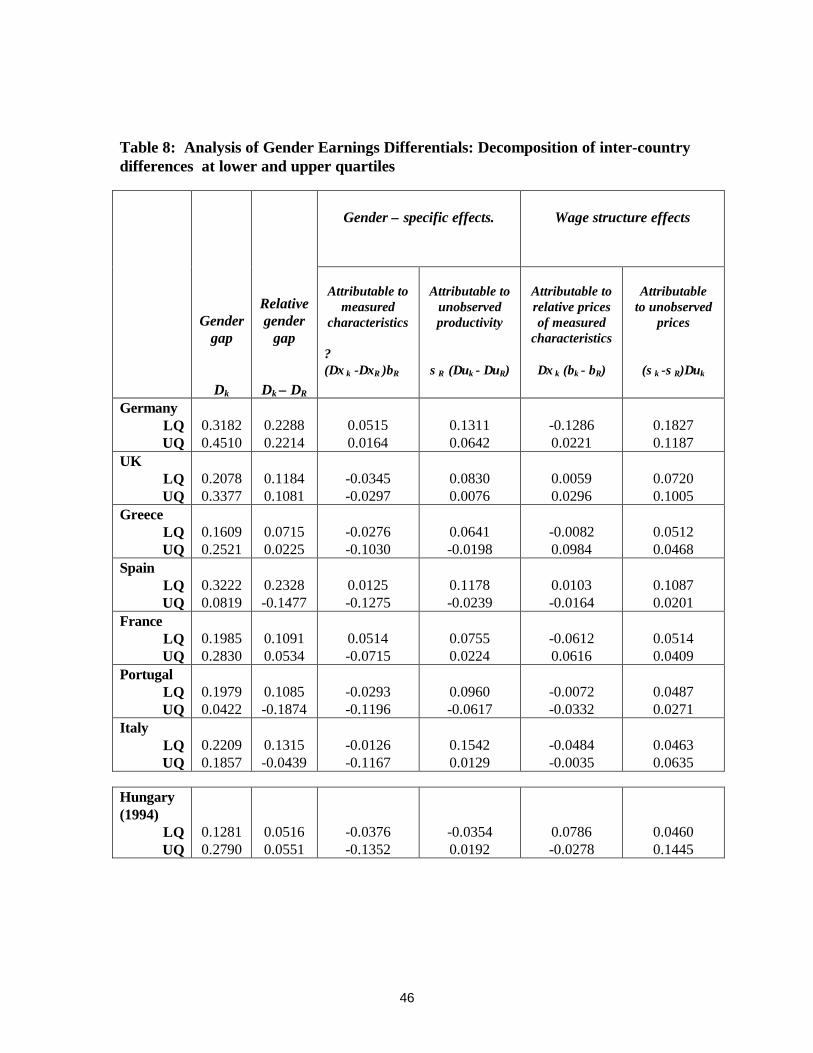
46
Table 8: Analysis of Gender Earnings Differentials: Decomposition of inter-countrydifferences at lower and upper quartiles
Gender – specific effects. Wage structure effects
Gendergap
Dk
Relativegender
gap
Dk – DR
Attributable tomeasured
characteristics
?(∆x k -∆xR )bR
Attributable tounobservedproductivity
σR (∆uk - ∆uR)
Attributable torelative pricesof measured
characteristics
∆x k (bk - bR)
Attributableto unobserved
prices
(σk -σR)∆uk
GermanyLQUQ
0.31820.4510
0.22880.2214
0.05150.0164
0.13110.0642
-0.12860.0221
0.18270.1187
UKLQUQ
0.20780.3377
0.11840.1081
-0.0345-0.0297
0.08300.0076
0.00590.0296
0.07200.1005
GreeceLQUQ
0.16090.2521
0.07150.0225
-0.0276-0.1030
0.0641-0.0198
-0.00820.0984
0.05120.0468
SpainLQUQ
0.32220.0819
0.2328-0.1477
0.0125-0.1275
0.1178-0.0239
0.0103-0.0164
0.10870.0201
FranceLQUQ
0.19850.2830
0.10910.0534
0.0514-0.0715
0.07550.0224
-0.06120.0616
0.05140.0409
PortugalLQUQ
0.19790.0422
0.1085-0.1874
-0.0293-0.1196
0.0960-0.0617
-0.0072-0.0332
0.04870.0271
ItalyLQUQ
0.22090.1857
0.1315-0.0439
-0.0126-0.1167
0.15420.0129
-0.0484-0.0035
0.04630.0635
Hungary(1994)
LQUQ
0.12810.2790
0.05160.0551
-0.0376-0.1352
-0.03540.0192
0.0786-0.0278
0.04600.1445
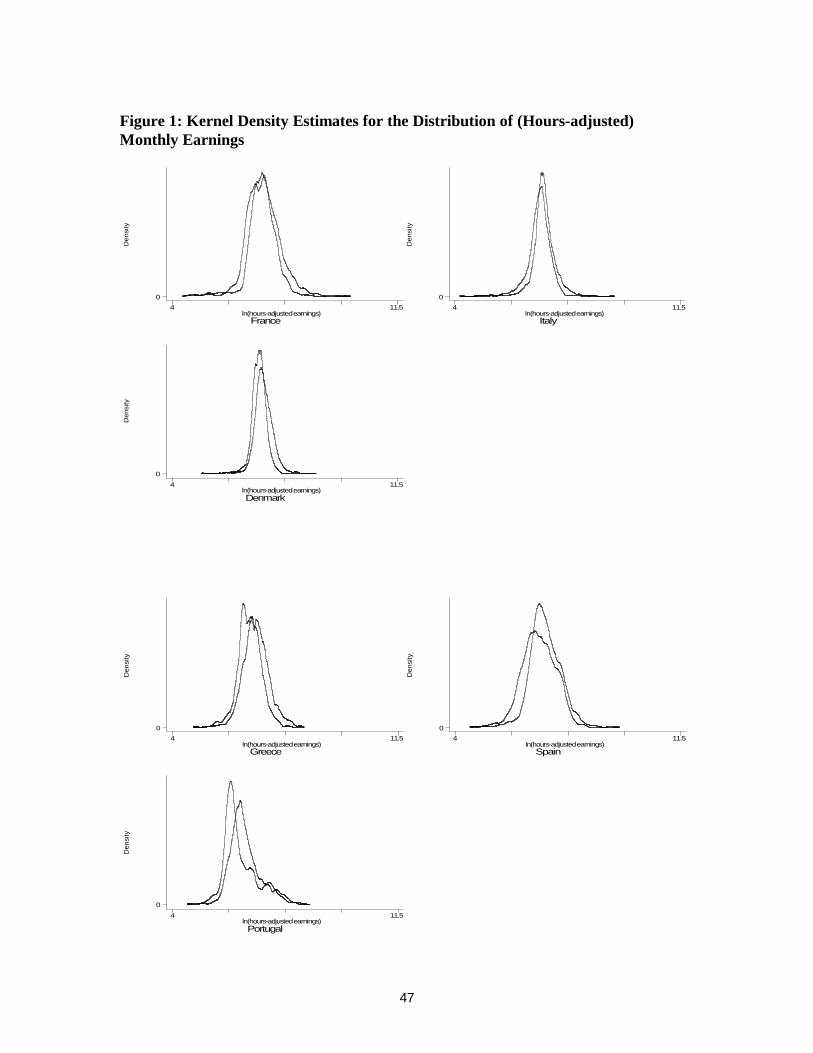
47
Figure 1: Kernel Density Estimates for the Distribution of (Hours-adjusted)Monthly Earnings
Den
sity
Franceln(hours-adjusted earnings)
4 11.50
Den
sity
Italyln(hours-adjusted earnings)
4 11.50
Den
sity
Denmarkln(hours-adjusted earnings)
4 11.5
0
Den
sity
Greeceln(hours-adjusted earnings)
4 11.50
Den
sity
Spainln(hours-adjusted earnings)
4 11.50
Den
sity
Portugalln(hours-adjusted earnings)
4 11.5
0
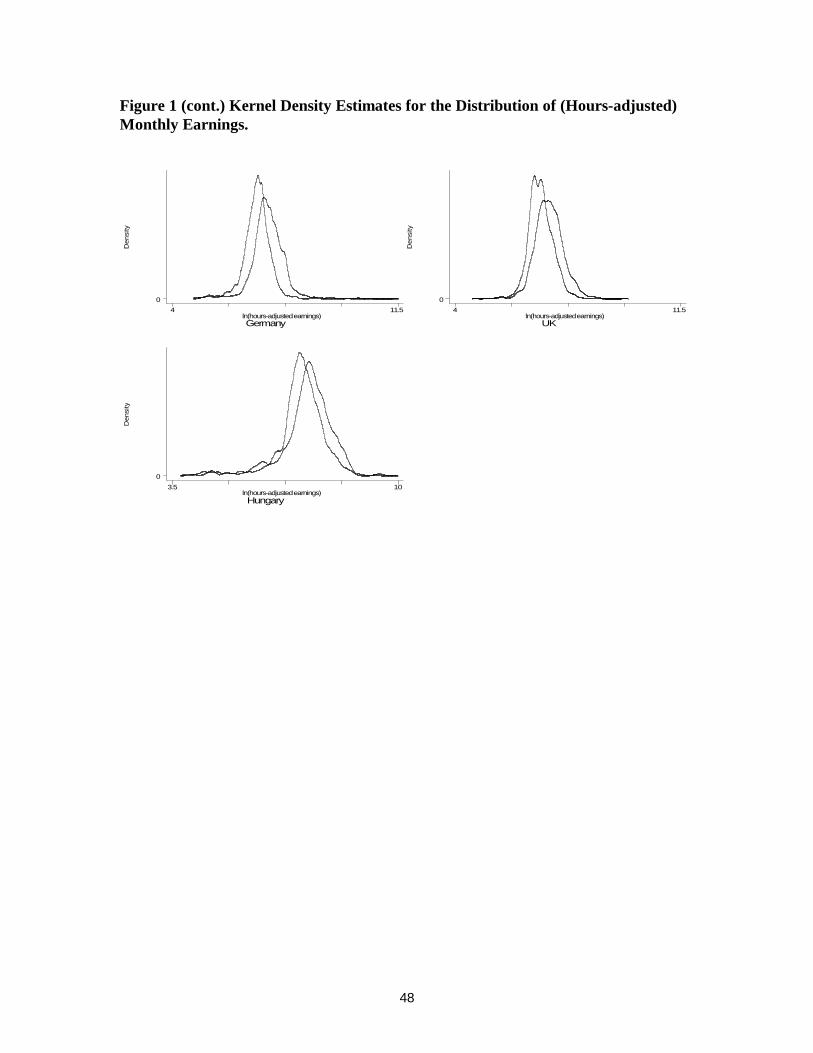
48
Figure 1 (cont.) Kernel Density Estimates for the Distribution of (Hours-adjusted)Monthly Earnings.
Den
sity
Germanyln(hours-adjusted earnings)
4 11.50
Den
sity
UKln(hours-adjusted earnings)
4 11.50
Den
sity
Hungaryln(hours-adjusted earnings)
3.5 10
0

APPENDIX
Table A1: European Union legislation relating to equal treatment for men and
women.
Article 119 of the Treaty of Rome enshrines the principle that men and women should receiveequal pay for equal work.
Directive 75/117/EECExtends the principle to “equal pay for work of equal value” supplemented by a code of conduct onmeasures to ensure the effective implementation of the principle.
Directive 76/207/EECGuarantees equal treatment with respect to access to employment, vocational training, promotionand working conditions.
Directive 79/7/EECImplementation of equal treatment with respect to social security schemes.
Directive 86/378/EECImplementation of equal treatment in occupational schemes of social security.
Directive 86/613/EECImplementation of equal treatment for men and women engaged in activities in a self-employedcapacity.
Directive 97/80/ECIn cases of discrimination on the grounds of sex, the onus is placed on the defendant accused ofdiscrimination at work to prove that the principle of equal treatment has not been violated.
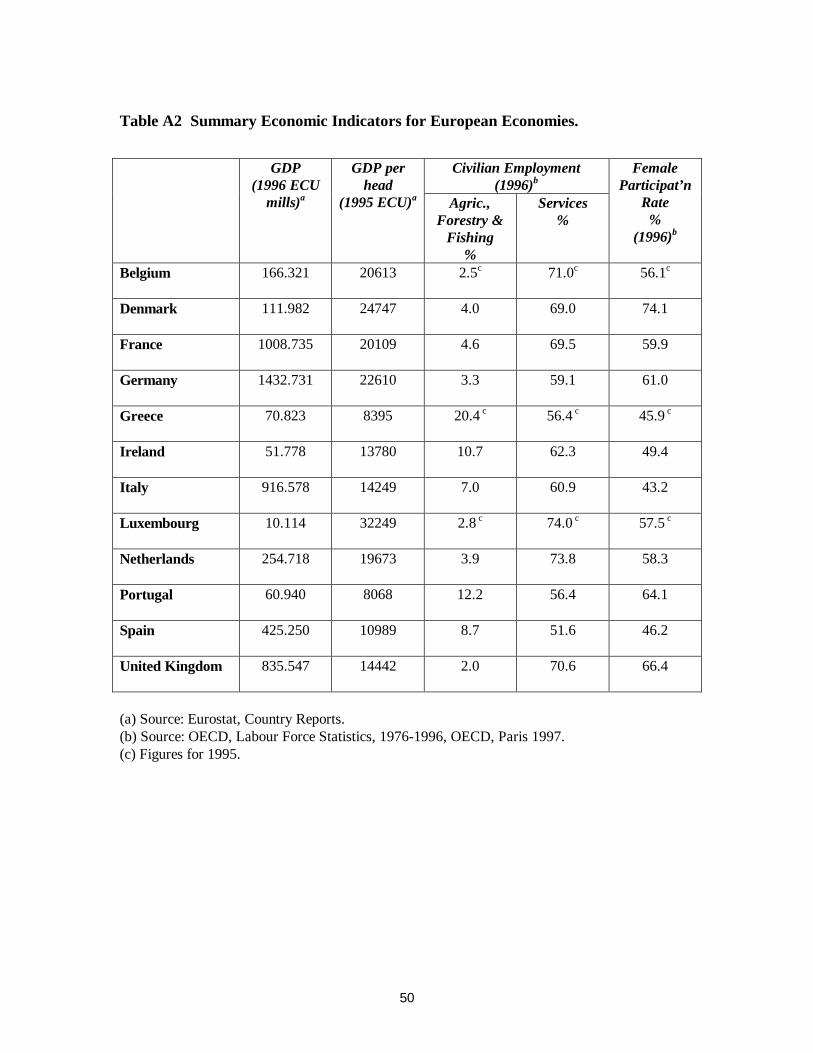
50
Table A2 Summary Economic Indicators for European Economies.
Civilian Employment(1996)b
GDP(1996 ECU
mills)a
GDP perhead
(1995 ECU)a Agric.,Forestry &
Fishing%
Services%
FemaleParticipat’n
Rate%
(1996)b
Belgium 166.321 20613 2.5c 71.0c 56.1c
Denmark 111.982 24747 4.0 69.0 74.1
France 1008.735 20109 4.6 69.5 59.9
Germany 1432.731 22610 3.3 59.1 61.0
Greece 70.823 8395 20.4 c 56.4 c 45.9 c
Ireland 51.778 13780 10.7 62.3 49.4
Italy 916.578 14249 7.0 60.9 43.2
Luxembourg 10.114 32249 2.8 c 74.0 c 57.5 c
Netherlands 254.718 19673 3.9 73.8 58.3
Portugal 60.940 8068 12.2 56.4 64.1
Spain 425.250 10989 8.7 51.6 46.2
United Kingdom 835.547 14442 2.0 70.6 66.4
(a) Source: Eurostat, Country Reports.(b) Source: OECD, Labour Force Statistics, 1976-1996, OECD, Paris 1997.(c) Figures for 1995.
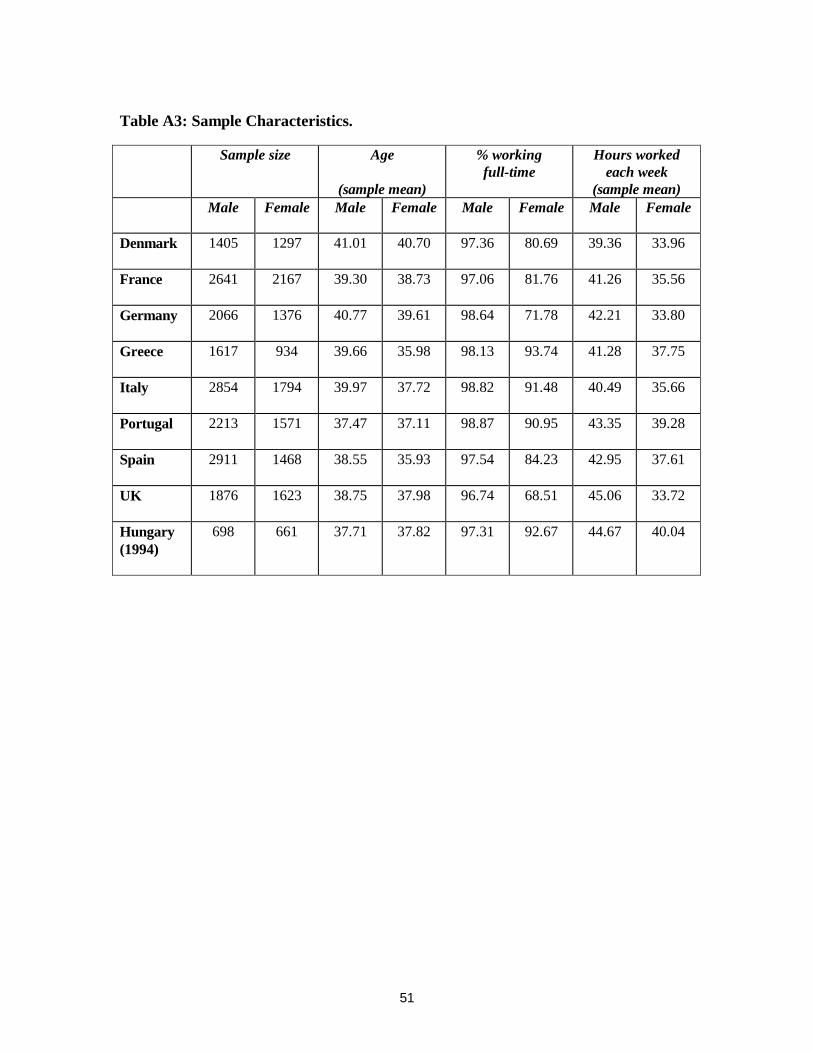
51
Table A3: Sample Characteristics.
Sample size Age
(sample mean)
% workingfull-time
Hours workedeach week
(sample mean)Male Female Male Female Male Female Male Female
Denmark 1405 1297 41.01 40.70 97.36 80.69 39.36 33.96
France 2641 2167 39.30 38.73 97.06 81.76 41.26 35.56
Germany 2066 1376 40.77 39.61 98.64 71.78 42.21 33.80
Greece 1617 934 39.66 35.98 98.13 93.74 41.28 37.75
Italy 2854 1794 39.97 37.72 98.82 91.48 40.49 35.66
Portugal 2213 1571 37.47 37.11 98.87 90.95 43.35 39.28
Spain 2911 1468 38.55 35.93 97.54 84.23 42.95 37.61
UK 1876 1623 38.75 37.98 96.74 68.51 45.06 33.72
Hungary(1994)
698 661 37.71 37.82 97.31 92.67 44.67 40.04
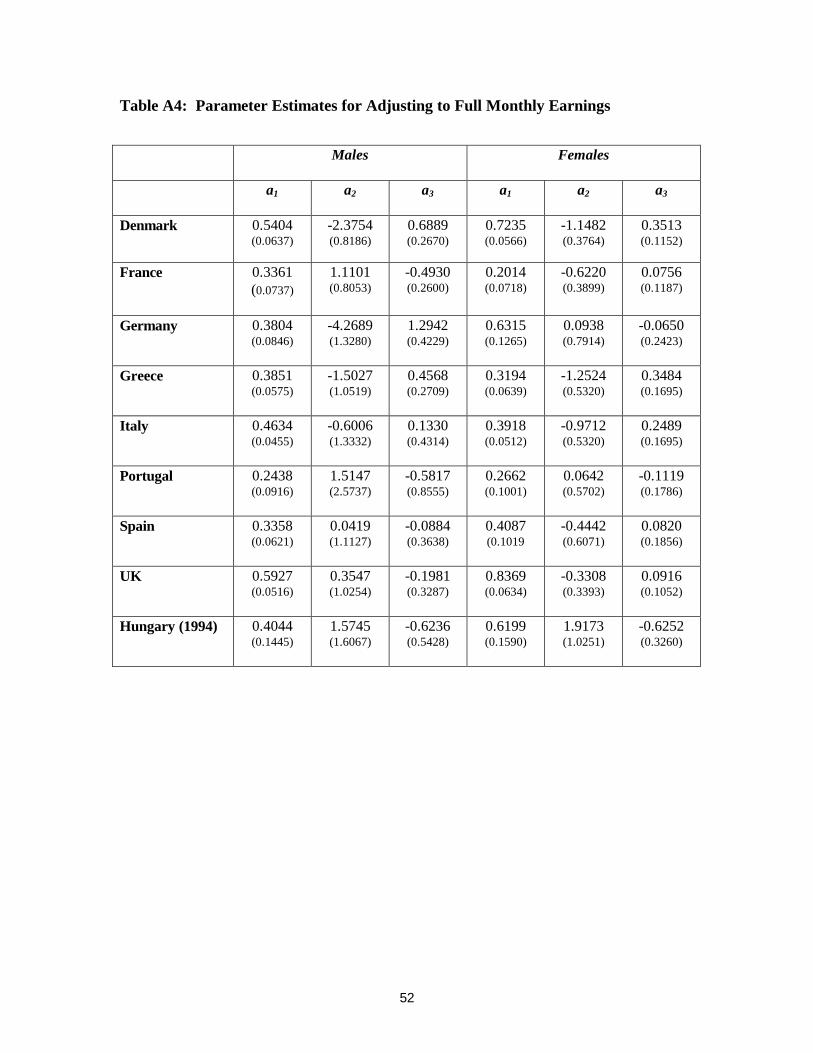
52
Table A4: Parameter Estimates for Adjusting to Full Monthly Earnings
Males Females
a1 a2 a3 a1 a2 a3
Denmark 0.5404(0.0637)
-2.3754(0.8186)
0.6889(0.2670)
0.7235(0.0566)
-1.1482(0.3764)
0.3513(0.1152)
France 0.3361(0.0737)
1.1101(0.8053)
-0.4930(0.2600)
0.2014(0.0718)
-0.6220(0.3899)
0.0756(0.1187)
Germany 0.3804(0.0846)
-4.2689(1.3280)
1.2942(0.4229)
0.6315(0.1265)
0.0938(0.7914)
-0.0650(0.2423)
Greece 0.3851(0.0575)
-1.5027(1.0519)
0.4568(0.2709)
0.3194(0.0639)
-1.2524(0.5320)
0.3484(0.1695)
Italy 0.4634(0.0455)
-0.6006(1.3332)
0.1330(0.4314)
0.3918(0.0512)
-0.9712(0.5320)
0.2489(0.1695)
Portugal 0.2438(0.0916)
1.5147(2.5737)
-0.5817(0.8555)
0.2662(0.1001)
0.0642(0.5702)
-0.1119(0.1786)
Spain 0.3358(0.0621)
0.0419(1.1127)
-0.0884(0.3638)
0.4087(0.1019
-0.4442(0.6071)
0.0820(0.1856)
UK 0.5927(0.0516)
0.3547(1.0254)
-0.1981(0.3287)
0.8369(0.0634)
-0.3308(0.3393)
0.0916(0.1052)
Hungary (1994) 0.4044(0.1445)
1.5745(1.6067)
-0.6236(0.5428)
0.6199(0.1590)
1.9173(1.0251)
-0.6252(0.3260)
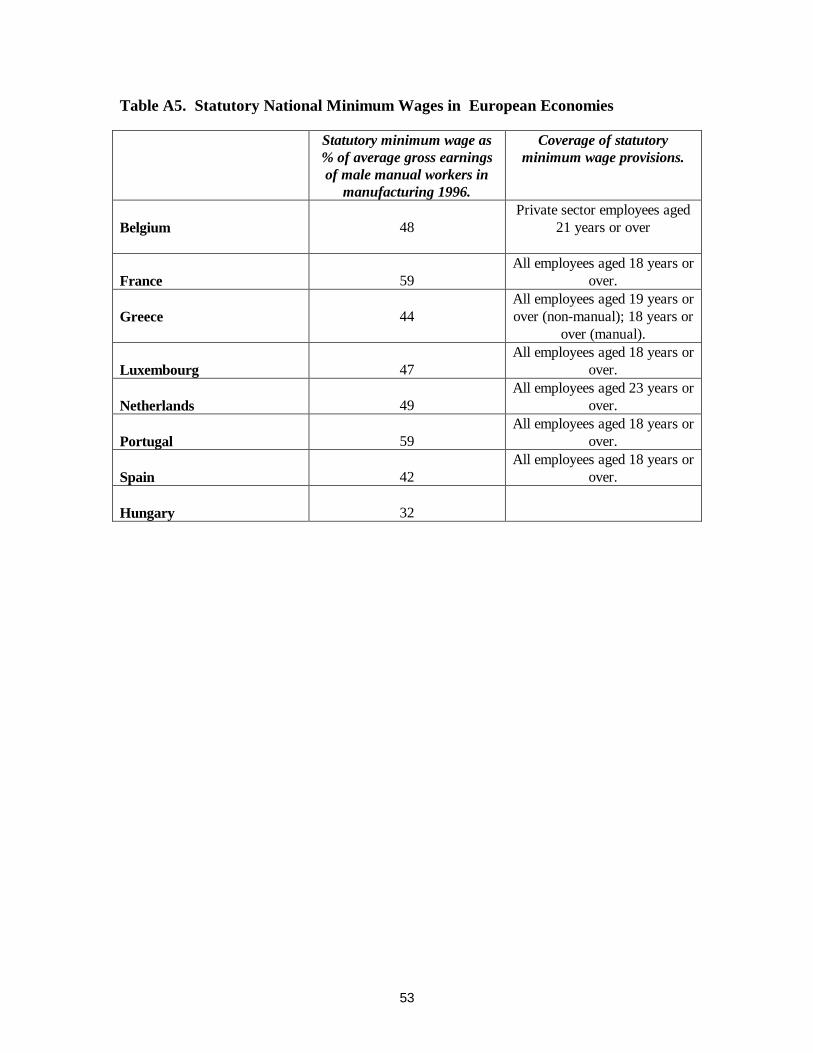
53
Table A5. Statutory National Minimum Wages in European Economies
Statutory minimum wage as% of average gross earningsof male manual workers in
manufacturing 1996.
Coverage of statutoryminimum wage provisions.
Belgium 48Private sector employees aged
21 years or over
France 59All employees aged 18 years or
over.
Greece 44All employees aged 19 years orover (non-manual); 18 years or
over (manual).
Luxembourg 47All employees aged 18 years or
over.
Netherlands 49All employees aged 23 years or
over.
Portugal 59All employees aged 18 years or
over.
Spain 42All employees aged 18 years or
over.
Hungary 32
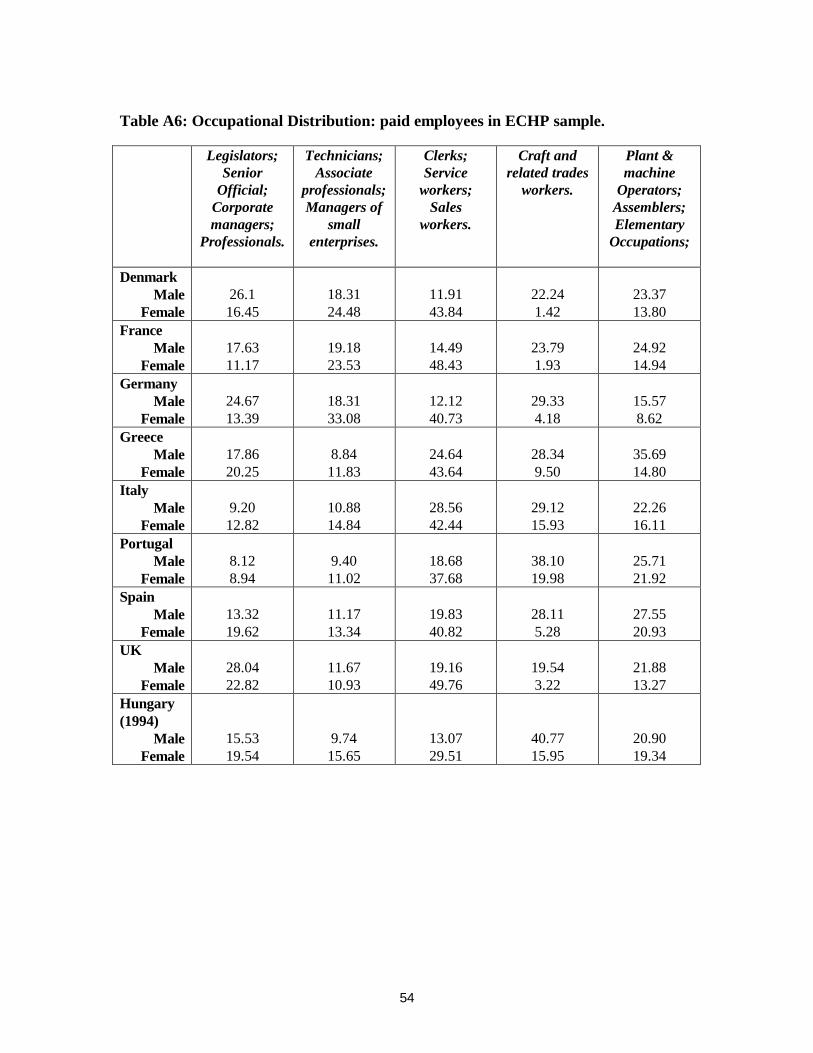
54
Table A6: Occupational Distribution: paid employees in ECHP sample.
Legislators;Senior
Official;Corporatemanagers;
Professionals.
Technicians;Associate
professionals;Managers of
smallenterprises.
Clerks;Service
workers;Sales
workers.
Craft andrelated trades
workers.
Plant &machine
Operators;Assemblers;Elementary
Occupations;
DenmarkMale
Female26.116.45
18.3124.48
11.9143.84
22.241.42
23.3713.80
FranceMale
Female17.6311.17
19.1823.53
14.4948.43
23.791.93
24.9214.94
GermanyMale
Female24.6713.39
18.3133.08
12.1240.73
29.334.18
15.578.62
GreeceMale
Female17.8620.25
8.8411.83
24.6443.64
28.349.50
35.6914.80
ItalyMale
Female9.2012.82
10.8814.84
28.5642.44
29.1215.93
22.2616.11
PortugalMale
Female8.128.94
9.4011.02
18.6837.68
38.1019.98
25.7121.92
SpainMale
Female13.3219.62
11.1713.34
19.8340.82
28.115.28
27.5520.93
UKMale
Female28.0422.82
11.6710.93
19.1649.76
19.543.22
21.8813.27
Hungary(1994)
MaleFemale
15.5319.54
9.7415.65
13.0729.51
40.7715.95
20.9019.34
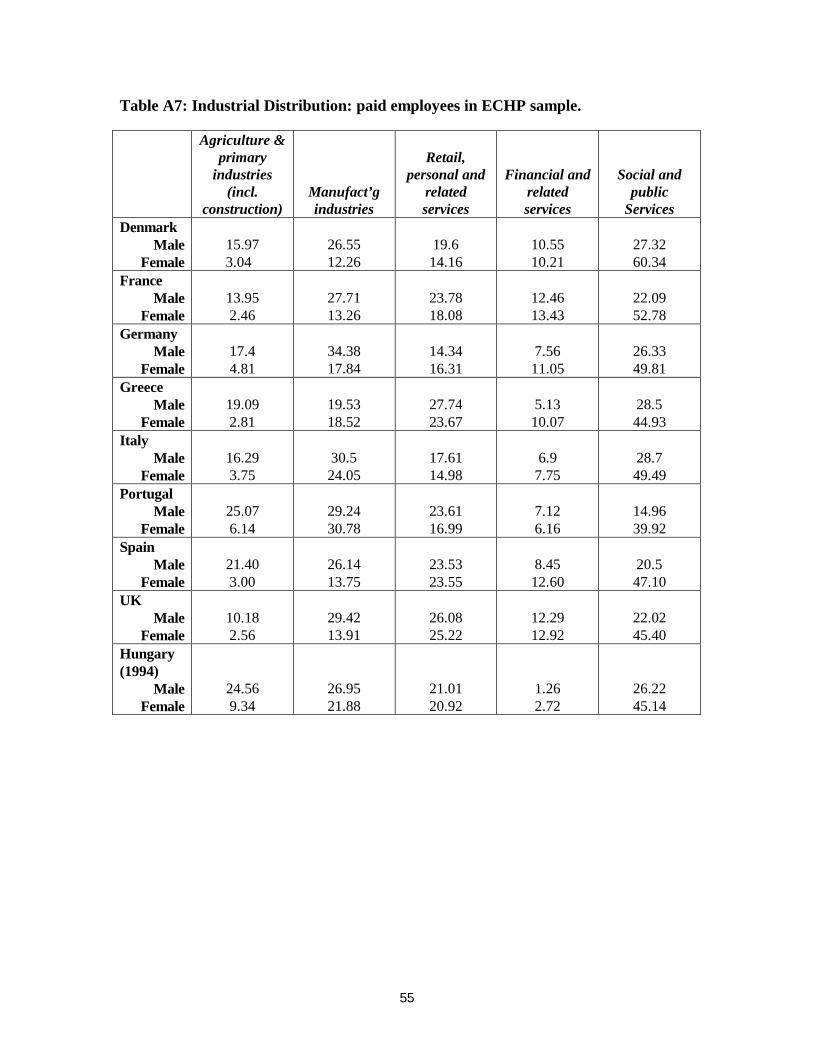
55
Table A7: Industrial Distribution: paid employees in ECHP sample.
Agriculture &primary
industries(incl.
construction)Manufact’gindustries
Retail,personal and
relatedservices
Financial andrelatedservices
Social andpublic
ServicesDenmark
MaleFemale
15.97 3.04
26.5512.26
19.614.16
10.5510.21
27.3260.34
FranceMale
Female13.952.46
27.7113.26
23.7818.08
12.4613.43
22.0952.78
GermanyMale
Female17.44.81
34.3817.84
14.3416.31
7.5611.05
26.3349.81
GreeceMale
Female19.092.81
19.5318.52
27.7423.67
5.1310.07
28.544.93
ItalyMale
Female16.293.75
30.524.05
17.6114.98
6.97.75
28.749.49
PortugalMale
Female25.076.14
29.2430.78
23.6116.99
7.126.16
14.9639.92
SpainMale
Female21.403.00
26.1413.75
23.5323.55
8.4512.60
20.547.10
UKMale
Female10.182.56
29.4213.91
26.0825.22
12.2912.92
22.0245.40
Hungary(1994)
MaleFemale
24.569.34
26.9521.88
21.0120.92
1.262.72
26.2245.14
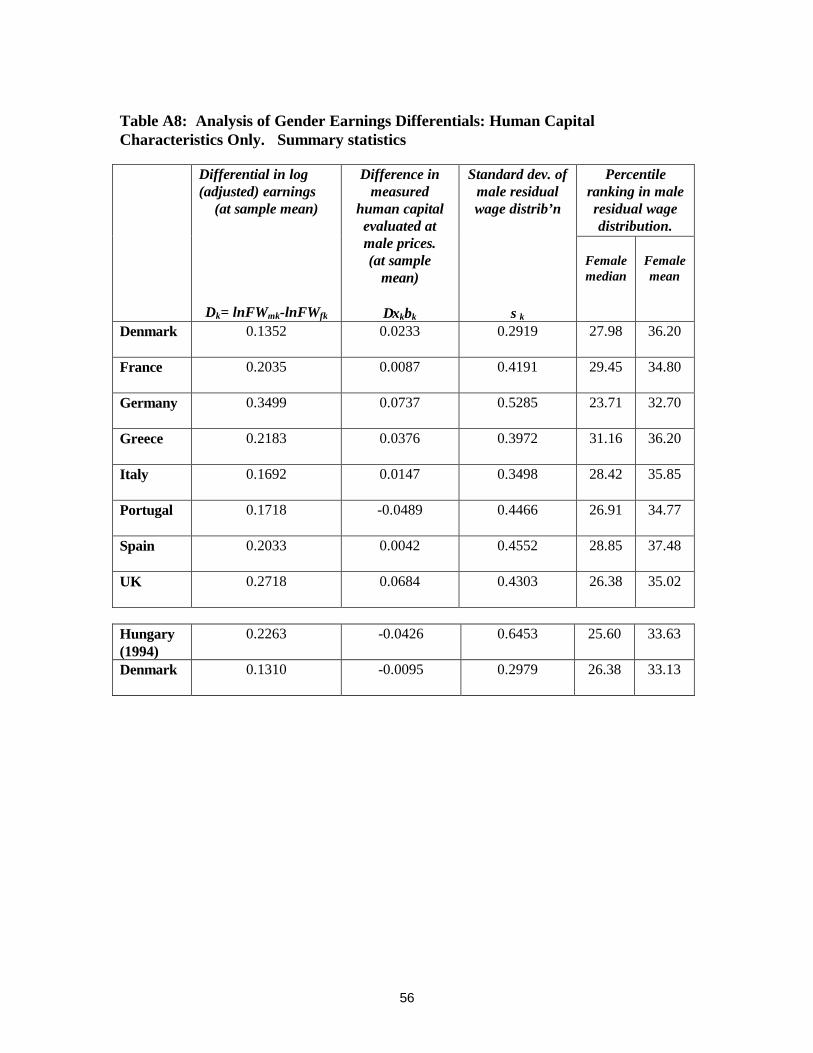
56
Table A8: Analysis of Gender Earnings Differentials: Human CapitalCharacteristics Only. Summary statistics
Percentileranking in maleresidual wagedistribution.
Differential in log(adjusted) earnings
(at sample mean)
Dk= lnFWmk-lnFWfk
Difference inmeasured
human capitalevaluated atmale prices.(at sample
mean)
∆xkbk
Standard dev. ofmale residualwage distrib’n
σk
Femalemedian
Femalemean
Denmark 0.1352 0.0233 0.2919 27.98 36.20
France 0.2035 0.0087 0.4191 29.45 34.80
Germany 0.3499 0.0737 0.5285 23.71 32.70
Greece 0.2183 0.0376 0.3972 31.16 36.20
Italy 0.1692 0.0147 0.3498 28.42 35.85
Portugal 0.1718 -0.0489 0.4466 26.91 34.77
Spain 0.2033 0.0042 0.4552 28.85 37.48
UK 0.2718 0.0684 0.4303 26.38 35.02
Hungary(1994)
0.2263 -0.0426 0.6453 25.60 33.63
Denmark 0.1310 -0.0095 0.2979 26.38 33.13
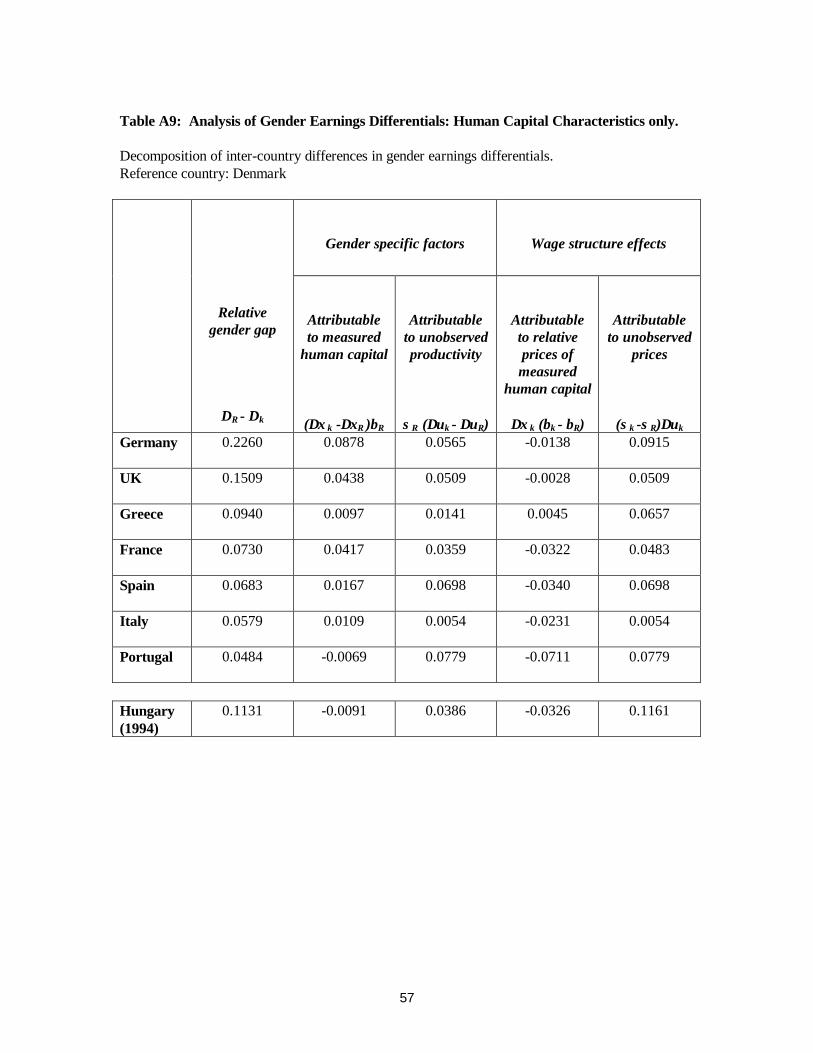
57
Table A9: Analysis of Gender Earnings Differentials: Human Capital Characteristics only.
Decomposition of inter-country differences in gender earnings differentials.Reference country: Denmark
Gender specific factors Wage structure effects
Relativegender gap
DR - Dk
Attributableto measured
human capital
(∆x k -∆xR )bR
Attributableto unobservedproductivity
σR (∆uk - ∆uR)
Attributableto relativeprices ofmeasured
human capital
∆x k (bk - bR)
Attributableto unobserved
prices
(σk -σR)∆uk
Germany 0.2260 0.0878 0.0565 -0.0138 0.0915
UK 0.1509 0.0438 0.0509 -0.0028 0.0509
Greece 0.0940 0.0097 0.0141 0.0045 0.0657
France 0.0730 0.0417 0.0359 -0.0322 0.0483
Spain 0.0683 0.0167 0.0698 -0.0340 0.0698
Italy 0.0579 0.0109 0.0054 -0.0231 0.0054
Portugal 0.0484 -0.0069 0.0779 -0.0711 0.0779
Hungary(1994)
0.1131 -0.0091 0.0386 -0.0326 0.1161
58
1 Article 2 and Article 3 of the Treaty of Amsterdam, May 1999.
2 The process by which the laws of the candidate countries are examined in relation to EU law.
3 For examples of problems of data comparability in earlier studies see Blau and Kahn (1996),Appendix.
4 Directive 97/80/EC, extended to the UK under Directive 98/52/EC.
5 Blom, J.and Knegt, R. (1996), p.12.
6 Commission of the European Communities (1999), Equal Opportunities for Women and Men inEurope – 1998.Annual Report from the Commission. European Commission, Brussels, p.28.
7 Ibid.
8 This section of the paper draws heavily on the discussion in Rubery et al (1998), ch.6.
9 Council of Social Affairs, Draft Council Resolution 16/12/98 on Employment Guidelines for1999.
10 European Directive 96/34/EC to be implemented by 3 June 1998 ( 15 December 1999 in theUK).
11 Rubery et al (1998), Table 6.5, p. 230.
12 Rubery et al 1998, p.230.
13 Rubery et al., p.281.
14 For details see Donoghue and Sutherland (1998), Table 5, p.18.
15 Working Families Tax Credit introduced in October 1999.
16 For a detailed description of the ECHP methodology and qeustionanaires, the reader is referredto “The European Community Household Panel (ECHP): Volume 1 – Survey Methodology andImplementation” and “The European Community Household Panel (ECHP): Volume 1 – SurveyQuestionnaires, Waves 1-3”, Theme 3, Series E, Eurostat, OPOCE, Luxembourg, 1996.
17 The thirteen countries are Germany, Denmark, Netherlands, Belgium, Luxembourg, France,United Kingdom, Ireland, Italy, Greece, Spain, Portugal and Austria.
18 The data used in this study are from the public use version of the PACO datafiles, including datafrom the Hungarian Household Panel study provided by TARKI(Social Research InformaticsCenter), Hungarian Central Statistical office and the Department of Sociology of the Budapest
59
University of Economics. The comparable variables in this datafile were created by the PACOproject, coordinated through the CEPS/Instead in Luxembourg.
19 UK survey data indicates that only 25% of individuals faced a payment system which offered asingle hourly wage rate for all hours they might work (Brown et al (1986))
20 Sample weights for the ECHPS and HHP samples are provided with the data and are computedto take into account the sample selection probabilities, non-response adjustment and to adjust thesample distribution with respect to certain household and individual characteristics to that of theknown population distribution. Estimation is undertaken using procedures in Stata6.
21 The kernel density estimates are computed in Stata 6 using the Epanechnikov kernel function.
22 Commission of the European Communities (1999), Equal Opportunities for Women and Men inEurope – 1998.Annual Report from the Commission. European Commission, Brussels.
23 Information on the age of starting first job is not available in the HHP and so for Hungary,potential labour market experience is computed in the conventional way as (Age- years ofeducation-6).