Gender and Migration Some Recommendations for Programmatic Policies.

DEPARTMENT OF ECONOMICS
UNIVERSITY OF MILAN - BICOCCA
WORKING PAPER SERIES
International migration and gender differentials in the home labor market:
evidence from Albania
Mariapia Mendola, Gero Carletto No. 148 –December 2008
Dipartimento di Economia Politica
Università degli Studi di Milano - Bicocca http://dipeco.economia.unimib.it
1
International migration and gender differentials in the home labor market:
evidence from Albania*
Mariapia Mendola
University of Milan Bicocca and Ld’A
Gero Carletto
the World Bank
November 2008
Abstract This paper examines the role of male-dominated international migration in shaping labor
market outcomes by gender in migrant-sending households in Albania. Using detailed
information on family migration experience from the latest Living Standards Measurement
Study (LSMS) survey, we find that male and female labor supplies respond differently to
current and past migration episodes of household members. Controlling for the potential
endogeneity of migration and for the income (remittances) effect, estimates show that having a
migrant abroad decreases female paid labor supply while increasing unpaid work. On the other
hand, women with household members with past migration experience are significantly more
likely to engage in self-employment and less likely to supply unpaid work. The same
relationships do not hold for men. These findings suggest that over time male-dominated
Albanian migration may lead to women’s empowerment in the access to income-earning
opportunities at origin.
*Authors wish to thank Carlo Azzarri, Massimiliano Bratti, Francesca Mazzolari, Barbara Petrongolo and participants to the
IMISCOE Conference in Durres for useful comments and inputs.
Mailing addresses: Mariapia Mendola, Department of Economics, University of Milan Bicocca, P.za dell’Ateneo Nuovo 1,
20126 Milan, Italy. E-mail: [email protected]. Gero Carletto, Development Research Group, The World Bank,
1818 H Street NW, Washington, DC 20433. E-mail: [email protected].

2
1. Introduction
There is a general consensus that international labor migration entails big socio-economic changes in
source communities. At the same time, there is an intimate and unexplored relationship between gender
aspects of migration, such as male-dominated migration, and economic development in countries of
origin. This paper addresses this issue by looking at the impact of international migration on labor
supply by gender in such a setting as Albania, where male-migration is an ordinary and widespread
phenomenon.
Most studies of the impact of migration on source households have overlooked that expanding
opportunities for migration will have a different effect on behavioural patterns across household
members left behind, beyond increasing the amount of income received by the family (see Chen 2006
for an exception). The economic impact of migration on non-migrant employment patterns has been
documented for a few developing economies (Funkhouser, 1992; Tiongson, 2001; Amuedo-Dorantes
and Pozo, 2006) but while much of the focus has been on the income effect of remittances, less
attention has been paid to the role of (male) migration in shifting (female) decision-making power in the
family at origin. Theoretical analysis suggests that due to imperfect monitoring on the one hand, and
increase in the household income (through remittances) on the other, male migration may lead to
women bargaining empowerment in the control and allocation of resources at origin - so that gender
differentials in labour supply may be observed (Chen 2006, Lundberg and Pollak, 1993, Haddad et al.
1997).
We consider this question by analysing differences in labor market outcomes across men and women in
Albania according to their family exposure to international migration. Over the last fifteen years this
country has experienced massive migrant outflows, mainly to Greece and Italy, driven by economic
hardships during the transition process and fostered by geographic proximity. While we have some
insights into the welfare impact of migration and remittances on average household income and
investment at origin (MacCarthy et al., 2007; Zezza et al. 2005), little is known about the effects on the
local labor market behavior by gender. There is some evidence of the labour market performance of
return migrants in Albania (De Coulon and Piracha, 2003) but an unexplored issue if whether the male-
dominated nature of Albanian international migration affects the economic performance of women left
behind.
Based on unusually detailed data on household migration status of current and former household
members from the 2005 Albania Living Standards Measurement Survey, this study provides new
empirical evidence on gender differential in the home-labor-market impact of heterogeneous family
international migration experience. Following Amuedo-Dorantes and Pozo, (2006), we further
distinguish between paid and unpaid work, in order to test whether the ‘quality’ of women’s work
varies according to the migration status of their household and at the same time, to account for the
important role played by the informal sector in (female) employment outcomes in developing
economies. Since households are likely to self-select into sending migrants abroad based in part on
3
unobserved characteristics, we use an instrumental variable strategy to estimate labour market outcomes
by gender in either paid and unpaid sector.
From a policy perspective, exploring the impact of Albania’s out-migration on employment outcomes
in the country sheds light on migrants’ contributions to household welfare and economic development
at origin. Policy implications are even more relevant if there is a linkage between male-dominated
migration and a process of gender empowerment at origin – defined as the ability of women to access to
local earning opportunities. This is so as a more efficient allocation of women’s skills in the labor
market is largely recognized to be a building block in the development process of both rich and low-
income countries, and higher female labor force participation is found to reduce poverty and improve
living standards among women and future generations. (Duflo, 2005, 2003, Thomas, 1990). By
exploring the effect of such a key factor of modernization as economic migration on women’ and men’s
labor supply, this paper also contributes to the broader literature on the impact of economic
development on gender equity and female living conditions (Munshi and Rosenzweig, 2006).
The rest of the paper is organized as follows. Section 2 sets out the analytical framework, the
background literature and the context of our investigation. Section 3 presents data and descriptive
statistics whilst Section 4 illustrates the empirical strategy. Section 5 and 6 report the results and
Section 7 concludes.
2. Background: migration and female labor supply
Migration strongly suggests the interdependence of work decisions within a family. Theoretical
research, supported by empirical evidence, has shifted its view of migration from an individual
decision-making process to a mutually interdependent decision within the family, intended to manage
uncertainty, diversify the income portfolio and alleviate liquidity constraints (Stark, 1991, Yang and
Choi 2007, Mendola 2008). Thus, migrant (both temporary and permanent) and non-migrant household
members jointly decide about migration and act collectively to allocate resources by maintaining
cooperation over distance or by eventually returning home. It is not clear, though, how this cooperation
operates within families, and whether dispatching members to other places of employment has different
effect in the time allocation of individuals at home. To what extent male and female labor supply is
affected by family migration experience? In particular, does male-dominated migration have any effect
on women’s employment status at origin?
Theoretical analysis suggests that there are different mechanisms, related to time and resource
allocation, through which labor mobility of household members can affect employment outcomes of
people left behind. Indeed, both the absence of the migrant and the flow of remittances may affect the
labor supply of family at origin. Though, much of the emphasis in this literature has been put on the role
of remittances in lifting budget constraints, raising reservation wages and, through the neoclassical
income effect, reducing employment at home. Funkhouser (1992) in Managua and Tiongson (2001) in
Manila, for example, find that remittances have a negative impact on the decision to work of individuals
4
at origin, consistently with the extensive theory and evidence on the positive impact of non-labor
earnings on individual consumption of leisure (Funkehouser 1992 finds a slightly positive impact on
self-employment though). Hanson (2005) examines the labor market impact of emigration from Mexico
and find that both men and women are less likely to participate in the labor force if their household
either has sent migrants abroad or received remittances from abroad. Amuedo-Dorantes and Pozo
(2006) instead, show that in Mexico the income effect of remittances is at work in reshaping the
allocation of male and female labor supply across different types of employment, rather than decreasing
overall labor force participation.
Nonetheless, remittances receipt is an outcome of household members’ out-migration, which entails the
re-allocation of time and resources by individuals left behind. On this side, migration has been typically
conceived as having a ‘disruptive effect’ in terms of loss of working-aged household members to be
replaced or compensated by household members left behind (Hanson, 2005; Amuedo-Dorantes and
Pozo, 2006). Yet, in a traditional society the absence of one household member may also entail a
bargaining empowerment in decision making within the household at origin, challenging traditional
gender roles, for example, and ultimately influencing the final allocation of resources.1 Sociologists
have long emphasized that male migration may leave women at origin with a greater burden of
responsibility but also with higher decision-making power and economic independence (Gulati, 1987,
De Haan, 2000). In research on household power within both industrialized and developing countries,
wage income and family influence are closely linked, thus pointing to the importance of assessing
women’s employment opportunities (e.g. Boserup 1970; Blumberg 1984 in Schultz, 1990).2
Overall, there has been a strong and growing interest in the determinants of female labor outcomes,
showing that human capital and family characteristics are important factors behind gender employment
differentials (see Pissarides et al. 2005). In particular, family membership and its obligations are very
important correlates of the level of women’s labor supply, but little is known on female labor force
response to one of the major modern obligations a family has to face, that is dispatching a household
member (frequently the husband or the son) to work abroad.
Several examples exist on the correlation between male-dominated migration and the feminisation of
agricultural labor on the one hand, or the urban poverty of female-headed households left behind on the
other (e.g. Agesa and Kim, 2001; Katz, 2003). Yet, as mentioned above, migration also affects the intra-
household division of rights and responsibilities, and gender is one of the main axes around which this
occurs. From a perspective of a time allocation model, when men are absent female stayers may have to
compensate for that and re-allocate their available time for work and for child caring (Albanesi and
Olivetti, 2006). From an intra-household bargaining framework, though, they may take over a more
1 Indeed, failure to recognize the existence of the impact of both migration and remittances on labor supply at home is retained
as non-problematic by assuming that the sum of the two opposing effects still shows the dominant impact (Amuedo-Dorantes
and Pozo, 2006). Yet, as argued in the text, the effect of migration itself is not necessarily negative and moreover, a remittance
is a necessary but insufficient condition to observe migration (measurement error). 2 We are here concerned with gender inequalities in household power – defined as the degree to which a family member can
influence important decision within the family. Obtaining a job for wage outside of the family contributes to women’s control
over the returns to their labor, hence augments their relative power in the allocation of household economic resources.

5
central role in family budgeting, by gaining control over resources and administrating them as to give
priority to maximize returns of their individual labor inputs, for example.3 In general, even if (male)
migration drain off household adults and increases income through remittances, the ultimate impact on
sending households may be channeled through a change in the bargaining process amongst individuals
left behind. Thus, the migration impact is not unambiguous a priori and, likewise, treating household
out-migration and remittance receipt as indistinguishable will deliver a blurred picture of their
behavioral effects on household members left behind.
Unlike other studies, we further account for potential heterogeneous effects of temporary and
permanent migration experience by distinguishing between migrant members currently away from past
migrants returned home (although some may be migrating again in the future). This is important in
order to account for the multifaceted nature and timing of migration, and reduce potential migration
measurement error (see Rodriguez and Tiongson, 2001). Indeed, neglecting the coexistence of different
forms of migration, such as temporary and permanent migration, for example, and the potential
correlation between them, can exaggerate or diminish the effect of having a migrant as part of the
household.4
Moreover, while analysing female labour choices, it is important to note that women in developing and
transition countries are economically active when providing unpaid work on the family farm or in a
small family-run business (Paci 2002; Hill, 1989).5 Indeed, important contributions on female work
choice have suggested that, differently from well developed labor markets, the composition of the labor
force in developing economies has to take into account the importance of both unpaid work and/or the
informal sector.6 The decision to enter the labor force as an employee is distinct from the choice to enter
as a family worker because of wage differentials, formal sector constraints in terms of working
schedules or fixed costs (e.g. commuting time or child care), and individual preferences for economic
autonomy (Hill, 1989). 7 Yet, a persistent gap in the literature on women’s employment is that informal
and unpaid work are largely undocumented and unquantified, whilst a disaggregated picture of female
3 There is an important body of literature pointing out that empowered women shift household decision away from their
husband’s preferences, chaining the choice that are made for children also (see Thomas, 1990; Behrman, 1997; Dulfo, 2003) 4We are able to distinguish permanent from temporary migrants but clearly any migration decision is not irrevocable so that a
permanent migrant may decide to return at some point in the future, while a current household member with past migration
experience may decide to migrate permanently at some time in the future. The issue is particularly thorny for current and most
recent migrants who may still be in the process of making a final decision on where to settle indefinitely. Actually, the form of
migration truly permanent in nature typically results in family migration in Albania, which means that these ‘permanent’
migrants are unlikely to be present in our sample. 5 Many works in the literature assume that women reported in self-employed or as unpaid family workers are engaged in the
‘informal’ sector of the labor market. Our data allow us to differentiate between paid self-employment and unpaid work so that
we assume that the latter only is ‘informal’ (even though we are aware that many forms of paid self-employment are also
informal, in the sense of unregistered). 6 Schultz’s seminal work (1990) emphasised the diversity in low-income countries in what women do, but since then there is
still little consensus on how female roles are changing today. Schulz made the point that economic development leads to a
change in the composition of the labor force from a high proportion of informal labor market employments to a high
proportion of formal labor market empoloyment (Tiefenthaler, 1994). 7 As pointed out by Schultz (1990), women are more likely to work in the family or informal labor market if the labor costs to
firms exceed the opportunity costs of female labor to family enterprises. Firms are at a relative disadvantage compared with
families in the employment of less experienced and less skilled labor. Edwards and Field-Hendrey (2002) focus specifically on
the site of work and show that, even in the U.S., home-based work is an attractive option for women for whom the fixed costs
of work are high.
6
work by its nature and ‘quality’ is likely to provide a more realistic employment pattern, especially in a
developing or transition economy (Paci, 2002; Lim 1996, Mehra and Gammage, 1999).8 Thus, we
account for the heterogeneity of female labor market constraints by distinguishing paid from unpaid
work. Overall, it is well known that male and female family decision-makers have different preferences,
but it is an open question how massive emigration in a traditional society affects the value of time and
the ownership of an income stream by gender.
2.1. The Albanian context
Albania is a particularly interesting setting where to study the impact of migration on domestic (formal
and informal) labor market by gender. This country has been largely affected by the passage on the
market economy at the beginning of 1990 and key changes over the process have occurred in the local
labor market. Like in many other transition economies, the country experienced a substantial decline in
labor force participation in the new labor market. Public sector employment has declined enormously
during the transition period (from more than 850,000 employees, it shrank to less than a quarter
between 1991 and 2001), but job growth in the private sector has been too slow to compensate .
According to INSTAT data, private sector employment increased by only 23,000 between 2001 and
2004, adding only 2.5% to total employment in this period (WB, 2006). Two main implications of this
situation are the migration of a lot of young men to work abroad and the large withdrawals of women
from the labor market9. The consequential under-valuation of women’s time has resulted in significant
differences in the time male and female groups allocate to paid and unpaid work (with women spending
an inefficiently high proportion of their time in household production and caring activities, while men
overspecialize in labor market activities) (Paci, 2002). While female represent at least half of the
population in Albania, they account for the 40 percent of the total labor force and face higher rates of
unemployment than men (especially of the young) (ILO, 2001).10
Driven by economic hardships and geographic proximity, Albania has developed strong migration ties
with other labor markets, in particular Greece and Italy, and remittances play a significant role in
Albanian economy (Coulon and Piracha, 2005; Carletto et al. 2007). Much of migration from Albania
shows a stable and common pattern in that it has traditionally been temporary in nature (particularly the
flow to the neighboring Greece), whether seasonal or circular. The limited empirical evidence available
seems to suggest the existence of a “migration cycle”, involving multiple migration episodes prior to
settling, very often back in the source country (Labrianidis and Hatziprokopiou, 2006).
Overall, the high incidence of the informal sector, the intensity of migration flows, the high rate of
8 From a perspective of a time allocation model, labor supply (the allocation of leisure) is an indirect measure of individual
consumption. However, the impossibility to distinguish leisure from other non-market time (e.g. home production or unpaid
labor), is a shortcoming of most studies, which therefore assume that a person’s utility is increasing in all non-market time
(including unpaid work). 9 For an in-depth analysis of the mass Albanian migration since 1990, see King, et al. (2005). 10 Between 1980 and 2004, female labor force participation in Albania has not increased much (from 39% to 42%) (see WB
GenderStats at http://devdata.worldbank.org/genderstats). This rather stable trend challenges the argument that female labor
supply in migrant households may be explained by the aggregate national shift toward more working women in the economy.

7
hidden unemployment in agriculture sector and the significant number of unemployed that are not
registered in the public employment service, makes difficult to have a real evaluation of the labor
market situation of the country over the last 17 years (see ILO Report 2001). Using detailed micro-data
collected through household questionnaires, we provide new empirical evidence on the impact of
international migration on the local male and female labor supply in Albania. If engagement in earning
activities is the result of all economic policies and social processes, it is of interest to empirically
investigate the impact of massive male-dominated migration on female employment status in both
formal and informal sector in Albania.
3. Data and descriptive analysis
The analysis in this paper is based on the 2005 Albania Living Standards Measurement Study (LSMS)
survey carried out by the Albania Institute of Statistics (INSTAT) with technical assistance from the
World Bank. Unlike other household surveys, the latter provides unusually detailed information on
migration of both current and former household members from Albania to foreign countries. Moreover,
Albania LSMS includes information on individual labor market status along with a wide range of
demographic and socio-economic characteristics at household and individual level.
A total of 3640 households were interviewed, corresponding to a nationally representative sample of
17,302 individuals, 63 percent (9,742) of which are in working age (i.e. 16-64 years old). Included in
our analysis are all working-age men and women who are not in school, in retirement and in the
military service.11 Identification of paid and unpaid workers is derived from answers to the ‘job status’
question (no. 07- mod. 4C) according to which paid employment and self-employment refer to self-
reported wage and salary work (as employee, paid worker, employer, worker on own account) either
on- or off-farm, whereas unpaid work refers to work performed outside the home (either on- or off-
farm) without a corresponding salary.12
Concerning migration, we can distinguish between ‘current’ and ‘past’ international migration
exposure, where current migrants are all those former household members no longer living in the
household and currently abroad. Conversely, past migrants are household members who self-report
their emigration episodes (for a duration of at least one month since they turned 16 years old), and they
have now returned to live in the household (although they may be migrating again in the future). We
restrict our sample to individuals left later than 1990 (even though those reporting their first migration
episode before 1990 are handful).
We distinguish between these two forms of migration experience, as there are important differences to
highlight. As past migrants are concerned, it should be noted that migration from Albania (particularly
11 We do so as to isolate the labor market effect of migration from the effect on human capital accumulation. The main sample
restriction is to include only working age population available for work and not in the position to provide ‘voluntary’ work in
their spare time from their main occupation. Yet, in order to account for the potential interaction between migration and
individual age, we also performed robustness checks using workers in different age ranges (see below). 12 Due to data limitations, we are not able to use a measure of hours of work nor to perfectly match wives and migrant
husbands or sons. We defined unemployed the working age population without a work and seeking work, or not seeking work
due to the following reasons: (a) tired/believe no work available (i.e, discouraged workers); (b) awaiting results of previous job
applications; (c) temporary absent from a permanent job (illness, bad weather etc.); and (e) waiting for rehire/job recall.

8
the flow to the neighboring Greece13
) has been traditionally temporary in nature, whether seasonal or
circular. This entails that migrants move more than once in their life cycle, especially to neighboring
countries. In our sample households, temporary migrants are mostly men returning from nearby Greece
and Italy, where agriculture or construction sectors appears to be the main forms of occupation for these
individuals. In Figure 1 we plot sample migration rates by gender, namely the incidence of self-reported
last migration episode by year of migration in 1990-2003, and the male-dominated nature of migration
waves is striking.14
Most of these sample migrants did not migrate with spouse in the last migration
episode (nor with children) (only around 15% do so) and when asked about their intention to migrate
again, almost 40 percent give a positive answer while 16 percent is uncertain- supporting the trend of
individual multiple migration episodes15
. Female migration rate is much lower relative to men, and most
of them (almost 70 percent) leave to Greece to work as domestic and related helpers (the remaining sub-
group migrate as tie-migrant or to work in agriculture).16
025000
last-tim
e m
igra
nts
1991
1992
1993
1994
1995
1996
1997
1998
1999
2000
2001
2002
2003
Year migrated
male female
Figure 1. Most recent migration episodes by year and gender
Current international migrants, on the other hand, are household members left at least since 12 months
prior the survey, whose characteristics are collected through proxy respondents within the household.
Importantly, the survey limits this group to ‘core’ household members, i.e. sons and daughters of
household head and/or his/her spouse and the spouse him/herself, if abroad (even though it is not
possible to perfectly match them). Overall, while past international migration shows a rather stable and
13 Compared to Italy, the process of obtaining legal status in Greece is more difficult for Albanian migrants, as family
reunification has been discouraged and migrant regularization has been slower (Baldwin-Edwards, 2002). In this respect, it
should not be surprising that particularly the flow to Greece has been more temporary in nature. 14 The same gender migration pattern (i.e. male domination) is evident when plotting the self-reported first episodes of
international migration. As people in Albania are likely to migrate more than once in their life course, the actual survey
questions on (the timing of) migration are: “In what year and month did you most recently migrate abroad for at least one
month?” and “In what year was the first time you ever migrated abroad, after having turned 15?”. In both cases migrants are
almost exclusively male, and the fact that the overtime trend is not changing much is even more relevant for our analysis. 15 This is consistent with the IOM and Eurobarometer evidence reported by de Coulon and Piracha (2003) that migrants from
Albania fall into the category of temporary workers (see also Papapanagos and Sanfey, 1998). Furthermore, using same
Albanian data Kilic at al. (2007) show that among migrants, most recent returnees are those more likely to migrate again,
supporting the idea of the ‘migration cylcle’. 16 Female temporary migration episodes are fewer than for men (they seem to migrate only once but for longer periods).

9
common pattern, the category of current migrants includes a more heterogeneous set of people,
including both those who will be back home soon (as temporary or return migrants) and those who will
be permanently living away from home (either with or without the rest of the household). Overall,
current migrants are younger, include a higher share of females than it is the case for temporary
migration and on average belong to relatively better off households than those with past migration
experience only.
Bearing these differences in mind, the potential impact of experiencing international migration is vast,
in terms of the financial and human capital household members may receive back, both affecting their
occupation and investment opportunities before and upon return. In particular, the current absence of
recent migrants may lead to an intra-household call for labor compensation, while past migration of
household members may entail the return of both human and physical capital to be re-allocated or
invested by household members, depending on individual intra-household bargaining power. Yet, these
effects may differ according to whether individuals have themselves worked abroad at least once in
their life, so that we further distinguish for having a direct migration experience (albeit the latter is less
biting for women)17
.
Table 1 report individual characteristics by gender and household direct and indirect migration
experience. The latter is detected in terms of the presence of any current international migrant in the
household (who left the country more than 12 months prior the survey) and past migration either of
respondent himself or of someone else in the household.
TABLE 1: Individual characteristics and migration experience by gender
Total Population Working age population a
Male Female Total Male Female Total
Individual characteristics:
Married (%) 0.62*** 0.59*** 0.61 0.68** 0.70** 0.69
Single (%) 0.36*** 0.30*** 0.33 0.31*** 0.25*** 0.28
Age – Years 32.50** 33.32** 32.92 37.98*** 36.99*** 37.46
Household size 4.9 4.91 4.9 4.8 4.76 4.78
# of children (age<15) 1.32*** 1.39*** 1.36 1.03*** 1.09*** 1.06
Years of education 8.21*** 7.62*** 7.9 9.90*** 9.35*** 9.62
Migration status b:
Current migrants in the hh (%) 0.27*** 0.30*** 0.28 0.28*** 0.33*** 0.30
Past indiv.migration (%) 0.23*** 0.03*** 0.13 0.27*** 0.03*** 0.15
Past migration of hh members (%) 0.13*** 0.28*** 0.21 0.12*** 0.32*** 0.23
* significant at 10%; ** significant at 5%; *** significant at 1%
Notes: (a) Persons aged 16 to 64 year. (b) The last 3 binary variables capturing migration experience are respectively: (i) individual has at
least one household member currently migrated abroad; (ii) individual has migrated abroad at least once; (iii) individual has never migrated
abroad but someone else in his/her household did at least once.
17 We will use ‘past individual migration’ or ‘direct migration experience’ to refer to the individual response to one’s own
migration experience, and with ‘past migration of household members’ or ‘indirect migration experience’ to refer to the
individual response to international migration of someone else in the household.

10
Figures show that 28 percent of the total sampled individuals has at least one migrant household
member currently living abroad and there is a small but significant difference between women and men
(higher in magnitude if we consider working age population only, i.e. persons aged 16 to 64 year). On
average, 13 percent of the sample has migrated abroad at least once (since turned 16 years old), the vast
majority of which are male (only 3 percent of female report having migrated abroad).18
On the contrary,
28 percent of women report having experienced international migration through someone else in the
household, whilst a halved percentage of male report having a household member migrated abroad in
the past. Both last figures are consistent with the anecdotic argument that Albanian international
migration has been widely male-dominated.
In Table 2 we present some individual demographic characteristics of the working age population of
Albania differentiated by direct or indirect migration experiences. People having current international
migrants in their family are mainly female, above 40 years old, with smaller household size (likely as a
result of migration itself), grown-up children, and lower education than the remaining sample. This is
consistent with the idea that these are parents of (educated) grown-up children who have migrated
permanently most likely with their new family.
People with individual past foreign experience, are mainly young males, married and with an average
level of education higher than those who never migrated in their adult life. Among individuals with
household members migrated abroad (at least once) in the past, most of them are female (74%),
younger than the others (around 36 years old), with bigger households and a lower level of education.
TABLE 2: Individual characteristics by international migration experience (working age pop. a)
Current migrants in the hh Past migration
No Yes None
Individual
Experience
Migration of
hh members
Female (%) 0.50*** 0.56*** 0.54*** 0.11*** 0.74***
Married (%) 0.69 0.68 0.66*** 0.79*** 0.69
Age – Years 35.95*** 40.93*** 38.11*** 37.05 35.94***
Household size b 5.00*** 4.27*** 4.58*** 4.79 5.33***
# of children (age<15) 1.24*** 0.66*** 0.99*** 1.22*** 1.15***
Years of education 9.81*** 9.17*** 9.67** 10.21*** 9.09***
* significant at 10%; ** significant at 5%; *** significant at 1%
Notes: (a) Persons aged 16 to 64 year. (b) Household members here are only those currently living at home (i.e. current
international migrants are not considered as household members).
Table 3 presents the employment rate of the working age population by gender19
, differentiating
between wage employment, paid self-employment and unpaid work. Working women appear to be
more concentrated in unpaid jobs, followed by wage- and self-employment. Differentiating by sector,
our data report women more concentrated in the unpaid agricultural sectors and paid non-agricultural
sector, followed by self-employment (very few women work as agricultural wage workers).
18 The vast majority (82%) of households with past migration experiences, have had only 1 member abroad. This suggests that
temporary migration is generally taken up by only one household member, mostly the male household head.

11
TABLE 3: Average labor outcomes by gender (% of working age pop. a)
Male Female Total
Unemployed 0.14*** 0.19*** 0.16
Wage employee (paid) 0.43*** 0.24*** 0.35
Self employed (paid) 0.23*** 0.12*** 0.18
Unpaid workers 0.21*** 0.44*** 0.31
By sector:
Employee agriculture 0.03*** 0.00*** 0.02
Employee non-agr. 0.39*** 0.24*** 0.33
Self-employed agr. 0.08*** 0.06*** 0.07
Self-employed non-agr. 0.15*** 0.06*** 0.11
Unpaid worker agr. 0.19*** 0.38*** 0.27
Unpaid worker non-agr. 0.02*** 0.06*** 0.04
* significant at 10%; ** significant at 5%; *** significant at 1%
Notes: (a) Persons aged 16 to 64 year.
Table 4 present labor force participation rates - in both paid-formal and unpaid-informal jobs - and
migration experience by gender20. Overall, the gender employment gap, defined as the difference in the
employment rate between men and women, is around 29% if we consider paid work only, and around
6% if we take into account unpaid work as well. When we consider people having experienced
migration, though, the gender gap significantly decreases, mostly because of an increase in the female
employment rate. If persons have one current international migrant in their family, the gender gap is
28%, whilst if they experienced migration either directly or through another household member the
gender employment gap is respectively 22% and 16%. In case of past migration of others, though,
employment rates decrease both for males and females, suggesting that those who stay behind are either
more likely or more willing to withdraw from the labor market (men relatively more than women).
Moreover, the paid plus unpaid employment rate decreases in all cases but for return migrants: women
upon return are significantly less engaged in unpaid work and more in paid employment (this sub-group
is very small, though).
TABLE 4: Employment rate and gender gap by migration experience (% of working age pop.) a
Total Men Women Gender Gapb
All
Paid employment rate 0.53 0.65 0.36 0.29***
Unpaid employment rate 0.31 0.21 0.44 -0.23***
Current migrants in the hh
Paid employment rate 0.47 0.60 0.32 0.28***
Unpaid employment rate 0.37 0.24 0.50 -0.26***
Past indiv.migration
Paid employment rate 0.67 0.68 0.46 0.22***
Unpaid employment rate 0.18 0.17 0.23 -0.06***
Past migration of hh members
Paid employment rate 0.35 0.47 0.31 0.16***
Unpaid employment rate 0.49 0.39 0.53 -0.14 ***
* significant at 10%; ** significant at 5%; *** significant at 1%
Notes: (a) Persons aged 16 to 64 years. (b) The difference in the employment rate between men and women.
19 The whole analysis has been conducted also considering as working age females the sub-sample of women with age between
16 and 59. Results do not change significantly. 20
12
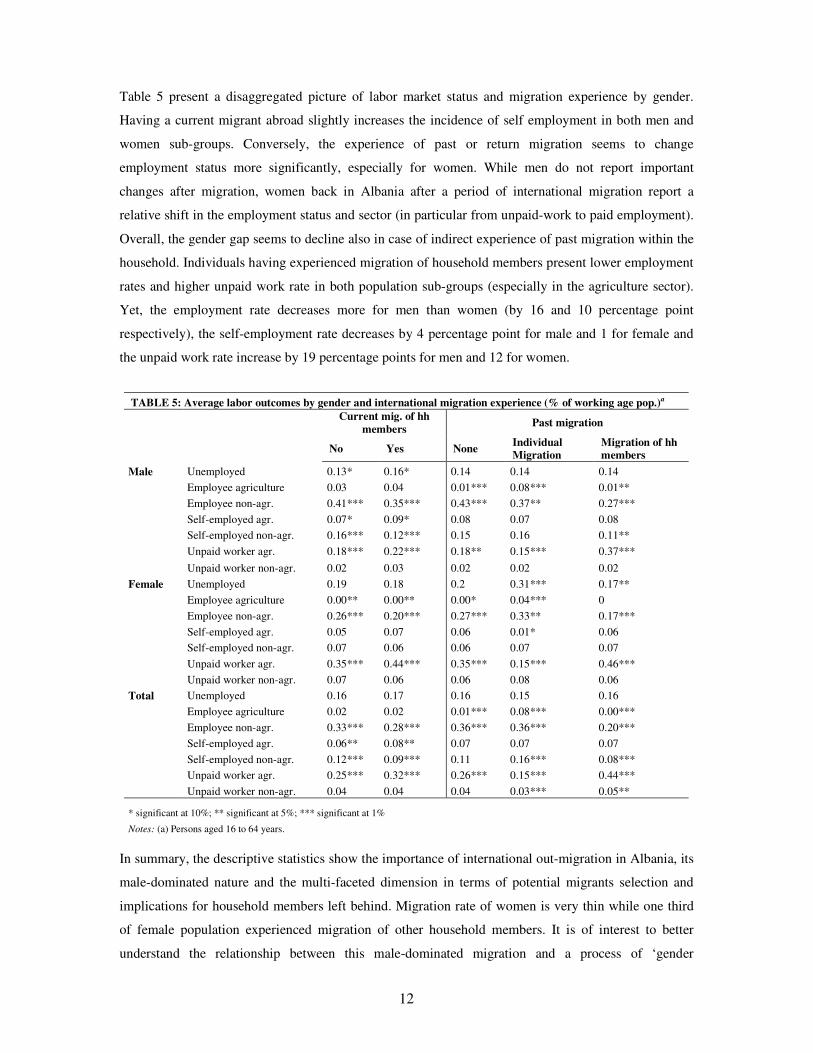
Table 5 present a disaggregated picture of labor market status and migration experience by gender.
Having a current migrant abroad slightly increases the incidence of self employment in both men and
women sub-groups. Conversely, the experience of past or return migration seems to change
employment status more significantly, especially for women. While men do not report important
changes after migration, women back in Albania after a period of international migration report a
relative shift in the employment status and sector (in particular from unpaid-work to paid employment).
Overall, the gender gap seems to decline also in case of indirect experience of past migration within the
household. Individuals having experienced migration of household members present lower employment
rates and higher unpaid work rate in both population sub-groups (especially in the agriculture sector).
Yet, the employment rate decreases more for men than women (by 16 and 10 percentage point
respectively), the self-employment rate decreases by 4 percentage point for male and 1 for female and
the unpaid work rate increase by 19 percentage points for men and 12 for women.
TABLE 5: Average labor outcomes by gender and international migration experience (% of working age pop.)a
Current mig. of hh
members Past migration
No Yes None Individual
Migration
Migration of hh
members
Male Unemployed 0.13* 0.16* 0.14 0.14 0.14
Employee agriculture 0.03 0.04 0.01*** 0.08*** 0.01**
Employee non-agr. 0.41*** 0.35*** 0.43*** 0.37** 0.27***
Self-employed agr. 0.07* 0.09* 0.08 0.07 0.08
Self-employed non-agr. 0.16*** 0.12*** 0.15 0.16 0.11**
Unpaid worker agr. 0.18*** 0.22*** 0.18** 0.15*** 0.37***
Unpaid worker non-agr. 0.02 0.03 0.02 0.02 0.02
Female Unemployed 0.19 0.18 0.2 0.31*** 0.17**
Employee agriculture 0.00** 0.00** 0.00* 0.04*** 0
Employee non-agr. 0.26*** 0.20*** 0.27*** 0.33** 0.17***
Self-employed agr. 0.05 0.07 0.06 0.01* 0.06
Self-employed non-agr. 0.07 0.06 0.06 0.07 0.07
Unpaid worker agr. 0.35*** 0.44*** 0.35*** 0.15*** 0.46***
Unpaid worker non-agr. 0.07 0.06 0.06 0.08 0.06
Total Unemployed 0.16 0.17 0.16 0.15 0.16
Employee agriculture 0.02 0.02 0.01*** 0.08*** 0.00***
Employee non-agr. 0.33*** 0.28*** 0.36*** 0.36*** 0.20***
Self-employed agr. 0.06** 0.08** 0.07 0.07 0.07
Self-employed non-agr. 0.12*** 0.09*** 0.11 0.16*** 0.08***
Unpaid worker agr. 0.25*** 0.32*** 0.26*** 0.15*** 0.44***
Unpaid worker non-agr. 0.04 0.04 0.04 0.03*** 0.05**
* significant at 10%; ** significant at 5%; *** significant at 1%
Notes: (a) Persons aged 16 to 64 years.
In summary, the descriptive statistics show the importance of international out-migration in Albania, its
male-dominated nature and the multi-faceted dimension in terms of potential migrants selection and
implications for household members left behind. Migration rate of women is very thin while one third
of female population experienced migration of other household members. It is of interest to better
understand the relationship between this male-dominated migration and a process of ‘gender
13
empowerment’ - through the access to local labor earnings - in Albania. From key descriptive findings,
indirect migration experiences seem to lead to a narrowing of the gender employment gap, mostly due
to an increase in labor supply of women with family migration experience. Yet, it should be noted that
different migration categories are not mutually exclusive at household level and a multivariate analysis
taking into account the concurrent effect of the latter and further variables on the individual labor
market behavior is required.
4. Empirical strategy
The theory on labor supply indicates that workers’ leisure-work preferences may not be separable from
labor supply of other family members. International migration affects the labour supply of non-migrants
in two main ways: the absence of the migrant and the flow of remittances. Both features of migration
may entail either a greater independence in the management of the household economy at home (e.g.
bargaining empowerment in decision-making) or a greater reliance on migrants’ outcomes (e.g.
consumption of leisure and remittances as non-labor income).
In order to test the migration- home-labor-market linkages, we model participation in the labour force
by gender and predict the employment outcome according to migration experience and remittances. To
do so we use a discrete occupational choice model based on the extensive theoretical literature on labor
market behavioural models (see Moffitt, 1999; Killinsworth and Heckman 1986 for a review).
According to these models, family member decisions about leisure times and labor supply are affected
by other members’ behaviour through cross-substitutions and income effects. While the latter is
expected to have a negative effect on labor supply (particularly for women; see Altonji and Blank,
1999), the signs of the former are unknown depending on both individual bargaining power and
whether household members’ work are complements or substitutes.21
Hence, it is not clear a priori
whether (male-dominated) migration impact in terms of female labor force participation will result in an
increase or reduction of the gender employment gap (see also Pissarides et al. 2005 on female labor
literature).
We model labor outcomes of working age population as a function of the household migration status
migration J
iM , a set of individual characteristics iX , a range of household and wealth related
variables iW (including non-labor income), and a set of regional level characteristics iY :
iiii
J
i
JS
i YWXMP εβββββ +′+′+′++= 32210* (1)
21 In a unitary household model, with the family as one decision making unit (e.g. the household head), signs of cross-
substitution effects are unknown, while the magnitudes are symmetric. In the bargaining model of family behaviour, that treat
the decision of individual family members in game-theoretic terms, both signs and magnitudes are unknown, depending on the
individual bargaining power. Within the family experiencing migration, for example, differences in the distribution by
recipient (husband, wife etc) of exogenous income may lead to differences in their bargaining strengths and, hence, their
behaviour so that each individual family members exogenous income appears as separated argument in each demand equation
(for leisure times and consumption). The empirical difficulty is having exact measures of certain variables that play a key role
in bargaining models. Here we do not have exogenous income flows that are under the control of particular family members-
14
where *iP is an unobserved (latent) variable that represents the propensity that women and men
participate in the labor force. Observed is the categorical labor outcome variable, S
iP , that is positive if
*iP > 0 and indicates whether the ith person is wage employed (s=1), paid self-employed (s=2) or an
unpaid worker (s=3) (zero otherwise).
Our coefficients of interest are the effects of household migration status J
iM on the labor force
participation by gender, where the Jth alternative indicates the different individual migration exposure,
i.e. whether the person has a household member currently abroad (J=1), whether it used to have a
household migrant member in the past (J=2), and whether she/he has direct foreign labor experience
(J=3). i
ε is the random variable of the estimated equation.
Different methods can be used to estimate the labor choice equation above but causal interpretation of
cross-sectional migration effects will be problematic if our empirical model is affected by endogeneity
concerns. An immediate claim is that migration is a selective process and unobservable characteristics
(at individual and household level) shape the choice of engaging in different forms migration. Indeed,
the selection bias comes from the fact that households might have an ‘implicit’ propensity for migration
based on different reasons, some of which are not observed, and which may be associated with the
likelihood of women to work. Moreover, regional level characteristics related to labor access and social
services may influence both the decision to migrate and to participate in the labor market, including
gender differences in the latter. It is not clear a priori how endogeneity concerns might affect the
estimates. On the one hand, better-off, more able or ‘liberal’ men may be more likely to migrate but
also more likely to encourage female household members to enter into the formal labor market; in this
case our estimates would be biased upward. On the other hand, households with migrants may already
be close to their optimal utility level which would decrease their incentive to increase labor supply (in
this case our estimates would be biased toward zero). Thus, we address the potential endogenity bias by
using an instrumental variable (IV) strategy to estimate the labor choice model in either paid or unpaid
work..
The equation that describes migration behaviour is given as
ii
J
i
J
i
J
i
JJi
J uZYWXM +++++='
4
'
3
'
2
'
10 γγγγγ (2)
where J
iM are binary endogenous variables equal to 1 if the ith individual belongs to the J
th migration
alternative as described above (zero otherwise). Migration status depends on the same set of personal,
household and regional level characteristics included in the labor force participation equation, and on a
set of exogenous variables iZ that are included in the migration equation only as instrumental variables.
but we have migration as a source of expanding opportunities and explore if there are gender effect in the individual
15
Given the simultaneity of time allocation decisions in concomitant occupational opportunities, we
estimate the system of equations (1)-(2) above through a 3SLS estimator, which produces consistent
estimates and account for correlation structure in the disturbances across labor choice equations. We
estimate a system of linear probability models as the latter are generally more tractable for assessing
causation with limited-dependent outcome variable and dummy endogenous regressors (Angrist,
2001)22.
5. Baseline models and results
We start by examining the differences in labor market outcomes across individuals according to their
exposure to international migration. We model the labour supply decision in reduced form as in
equation (1) and estimate employment outcomes as a function of individual, household and regional
characteristics. The hypothesis under test is whether international migration experience has a different
effect (if any) on male and female labor market outcomes at origin, controlling for the income effect.
According to an extensive literature, individual’s characteristics, such as education and age, shape the
decision to participate in labor markets by reflecting the potential market wage of the individual such
that, ceteris paribus, older, more educated workers are expected to obtain higher wages, and therefore
to be more likely of participating in paid employment (Pencavel, 1986). Family attributes, such as
number of dependents and their age structure, affect participation differently, depending on gender and
marital status of the individuals. Although family characteristics may not directly affect potential
market wages, they influence the decision to stay home by increasing or decreasing the individual
reservation wage.
The behavior of men and women are known to differ with respect to forms of participation in family
life and responsibilities for child care. While there is no such a theory explaining female labor supply, a
substantial literature documents that in a “traditional society,” married women participate less in paid
employment whilst they undertake more all household production.23
Major factors influencing a
woman’s choices to work, then, are marriage, the family (the number and ages of children), partner’s
position and income, along with her own educational level and occupation characteristics (e.g.
Heckman, 1974; Pencavel, 1986). In our labor choice specification, the number of children in the
household is disaggregated into four groups and gender (children younger than 4, children 5-10, male
children 11-14, female children 11-14) in order to reflect different child care costs and opportunity costs
of participating in the labor force. Thus, if family membership and its obligations are very important
correlates of the level of labor supply among women, it is of interest to investigate the effects on labor
market behaviour of one of the major obligations a family has to face, that is dispatching a household
member to work abroad.
behavioural responses. 22 Heckman and MaCurdy (1985) show that in case of simultaneous linear probability models, IV procedure produces
consistent estimates. 23 This has bee also called ‘intra-household specialization’ (e.g. Hanson, 2005), assuming that women have a comparative
advantage in home production, but here cultural norms and institutions (e.g. related to gender relations) play an important role.
16
We first focus on the pooled sample of working age males and females (i.e. 16-64 years old) and
estimate a system of linear probability models, where individual labor market outcomes s correspond to
the alternative status of paid-employment, self-employment, unpaid work and unemployment (the latter
as reference outcome). The variable of interest in our reduced form regression (1) is the household
migration status as captured by three migration categoriesJ
iM , i.e. current international migrants in the
household, past migration of household members and past individual migration, together with the same
variables interacted with a female dummy.
Results of linear models are reported in Table 6 and standard errors are adjusted for correlation across
equations. For comparison purposes, we also estimate the labor participation function through a
multinomial probabilistic model (marginal effects are reported in Table A.1 in the Appendix).
Table 6 about here
Columns 1-3 report results of the baseline regression which includes migration and gender related
variables only. Our first explanatory variable is whether the person is female: as expected, the
coefficients on that variable show how much being a female decreases the probability of working in the
remunerative labor market while increasing the likelihood of being an unpaid worker. Coefficients of
current and past migration variables, though, are different in sign and significance across gender,
suggesting that for women living in Albania international migration exposure has a significant effect on
labor market participation and outcomes. While having international migrant household members
currently abroad is negatively associated to the male probability of having a paid job, it is positively
correlated with the likelihood that women work as self-employed or as unpaid worker in either a farm
or non-farm activity. Also past migration experience through family members have a significant
positive effect on female self-employment, while the effect is significantly negative on male paid work
supply.
We then amend our baseline regression model with a range of individual, household and regional
characteristics in order to control for both supply and demand-side factors affecting individual labor
force participation. In particular, along with standard demographic characteristics, we include a set of
household assets variables, such as land and car ownership, water and phone fix inside dwelling, as to
proxy for the wealth position of the household. Moreover we include a range of regional characteristics,
i.e. the 2002 national unemployment rate at district level, whether the community has a police station
and garbage collection service, and regional dummies24, in order to control for the local economic
setting and labor demand. Columns 4-6 report the results of the regression model further augmented
with a range of interaction variables between family structure and being female, as a proxy of time
availability and work proclivity. Some of these controls result to be very significant both for male and
24 All forms of migration are equally represented in all Albanian regions included in the regression model (slightly less in
mountain urban regions only).

17
female labor market participation while the significance level of the gender gap decreases with respect
to all labor outcomes. Overall, results are consistent with those of other studies of labor force
participation. We find that variables customarily used to explain labor force participation are important
in determining the odds of labor force participation in each of the four labor force states considered
here. As expected, female labor supply and household migration decisions are significantly affected by
working time constraints related to the household structure, in particular with respect to children
presence which may constitute a constraint on economic choices of the household. Proxies for the wage
offers (age, education, number of children, and area of living), and variables for home productivity and
tastes (marital status; presence of children, disabled family members) are, for the most part,
significantly related to the likelihood of labor force participation.25 As our variables of interest are
concerned, household migration status still has a different effect on women relative to men. Current
migrants decrease the likelihood of male self-employment, while the opposite holds for women. Also
past migration experience of household members is positively associated with female self-employment
while being negatively correlated with female unpaid work. It is worth noting that having direct foreign
experience is negatively related to male wage employment, whilst it decreases unpaid work supply for
both men and women.26
In order to distinguish the ‘behavioral’ effect of migration from the income (remittance) effect, we
further include per capita non-labor earnings (both cash and in-kind) as explanatory variables of labor
market outcomes. Results in columns 7-9 show that most of unearned international income flows are
negatively associated with formal labor market participation in that they are likely to increase the
reservation wage. We distinguish between remittances received by core family members currently
away, remittances received in the previous 12 months by former migrants either abroad or in Albania,
and other non-labor income (e.g. rents, pensions, dividends etc.). Even though these flows are likely to
be highly endogenous to the labor participation choice, it is worth noting that migration variables are
robust to the introduction of these additional controls, while the pure gender effect decreases further.
This is to say that household migration status has a significant behavioral impact on non-migrants’ labor
market outcomes irrespective of, and beyond, the inflow of remittances or other income effects. This is
not surprising, as remittances received in cash or in kind are fungible, plus do not account for the
money and skills brought back home by returning Albanians, for a season or for good. Thus,
considering remittances only may disguise the purposive behavioral impact of migration across
household members in terms of benefits and obligations for all of them.
25 The model is also estimated excluding the number of children under six in order to account for the potential simultaneity
bias due to fertility to labor force decisions jointly determined (Rosenzweig and Wolpin, 1980). Further checks has been done
with respect to other potential endogenous variables (such as those related to the household wealth position) but results are
consistent with those reported. 26 Yet, as we discussed above, the incidence of female past migration is very low in Albania (around 3% in our nationally
representative sample), but excluding this control from the model does not change the results.

18
Focusing on our variables of interest using separate linear equations of labor market behavior for males
and females, Table 7 reports the effect of household members’ migration experience on their labor
market outcomes, controlling for the full set of individual, households and regional characteristics as
above (for robustness check, marginal effects of multinomial logit models as in specifications (10)-(15)
are reported in Table A.2 in the Appendix). Colums (1)-(9) includes alternative migration variables
separately and coefficient estimates show the importance of potential measurement error when
estimating the migration effect. Having any (current or past) migration experience in the household
seem to have a negative effect on female wage employment and male paid self-employment, while
having a positive effect on overall unpaid work supply. Yet, disentangling different forms of family
migration experience delivers asymmetric results (col. (4)-(9)). Accounting for the coexistence of
current and past migration episodes of household members, results in columns (10)-(12) show
asymmetric effects on male and female labor market behavior, which are robust to the inclusion of
remittances (columns (13)-(15)).27
While household migration exposure shows a (weak) positive effect
on the likelihood of female self-employment, negative effects on male paid occupations may be
explained by the fact that men may be waiting for the next migration episode while being back home.
Yet, it could be also argued that unobserved characteristics make men remaining in Albania less likely
to work for a wage or in self-employment, where this effect may operate for women as well. Given
these concerns, results are potentially contaminated by unobserved household characteristics that may
be correlated with both household migration behavior and labor supply. We tackle this issue in the next
section.
Table 7 about here
5.1. Female labor market behaviour by sector
In order to offer further insights on gender employment disparities, we also estimated separate
coefficients for the determinants of labor market behavior for males and females, where the dependent
variable is disaggregated by sectoral characteristics of occupations (see table A-3 in the Appendix). It is
often observed that low female participation rates goes in tandem with female participation in low-
paying occupations (such as agricultural or informal jobs). Thus, we set the dependent variable as to
distinguish the following sectors: wage employment in both agricultural and non-agricultural sector28;
self employment in agriculture (paid); self employment in non-farm sector (paid); unpaid work on farm;
unpaid work in non-agricultural sector. Unemployment is the reference outcome. Overall, results are
consistent in showing that the household migration status has a gender specific effect on labor market
participation, even though there is no clear evidence of a sectoral shift in male and female employment
outcomes. Having a current household migrant member appears to decrease male labor supply across
27 We have explored migration-female labor force participation for different age groups and for married women (with children)
only, and findings do not show significant patterns for sub-groups with the respect to the whole population. 28 This is so as female agricultural paid-employees is a nearly nil set.
19
sectors, while the effect is not significant for women. On the other hand, indirect past migration
experience of household members positively affects female paid self-employment participation both on-
and off-farm, at 10% and 1% significance level respectively. The same pattern does not hold for men.
Yet, past migration of household members significantly increase unpaid agricultural work for both sub-
groups. On the other hand, as found above, having direct international migration experience is
negatively associated with the probability to participate in the labor market (this effect is more
significant for male, though). As already mentioned, this is explained by the (self) selection of women
out of migration and by the temporary or circular nature of male migration. Results are robust to the
non-labor and remittance effects.
6. The labor market impact of migration: IV results
We are ultimately interested in examining the impact of having a migrant household member on the
relative and absolute female labor force participation in concomitant occupation opportunities (i.e.
wage-employment, paid self-employment and unpaid work). Although we have checked the robustness
of our results to the introduction of a number of control variables, if our empirical model is affected by
endogeneity of the household migration status, as we discussed above, the simple way to estimate the
migration-labor relations through a multivariate analysis will be unlikely to provide a consistent
estimate of the impact of migration on female labour market participation. In order to address the ‘true’
relationship between different migration exposure and employment outcomes by gender, we estimate
the system of equations (1)-(2) above through an IV strategy and a 3SLS estimator. The key to such
approach is a well-behaved instrumental variable. For this purpose we use a set of the following
instruments, related to some features of the context we study: (i) a binary variable equal to 1 if the head
of household or his/her spouse had any family friends or relatives living abroad in 1990; (ii) a binary
variable equal to 1 if there is more than one male in the extended family (i.e. all household members,
including those currently abroad); (iii) the percentage of households with members abroad in
municipality of residence in 1995. The latter is a standard proxy for migration networks within each
municipality that influence the opportunity to migrate by reducing potential hazard and costs, both at
home and in migration destinations (Massey et al., 1993; Massey and Espinosa, 1997)29. We use
migration intensity 10 years prior the year of the survey in order to minimise potential contemporaneous
correlation between the latter variable and employment outcomes.30 Thus, as long as we control for
district-level unemployment rate and regional fixed effects, we assume that previous migrant networks
do not affect current labor market outcomes directly (exclusion restriction), unless via the migration
behaviour of household members (first stage). Similarly, by employing the measure of contact with
29 A number of recent papers have used a measure of the migrant network to instrument for migration. Migrant networks
constitute an information channel in that living close to other people having migration experience may educate potential
migrants about the conditions in specific migration destinations (i.e. information costs decrease) and lead to a better settlement
of chain-migrants at destination (Massey 1998; Orrenious, 1999). Similarly, they serve to relax credit constraints (Genicot and
Sensky, 2004) and can increase the economic returns to migration (Mushi, 2003). 30 The choice of a 10 year ‘migration network’ is arbitrary but our results are robust to using migration network at different
points in time.
20
people abroad in the 1990, which marks the end of people’s mobility controls31
, we capture the presence
of migration networks within the family, that are assumed to directly influence the migrant status of
households (first stage) while being orthogonal to the labor market behaviour in Albania (exclusion
restriction)32. Finally, based on a feature of migration that is peculiar to the patriarchal Albanian
context, we argue that a discontinuity in the family gender composition may be particularly significant
in relaxing some gender specific constraints to migration, without directly affecting individual
employment outcomes. Indeed, if there is only one man in the household (11 percent of the case in our
sample), he will be less likely to leave the household and migrate abroad, as women left behind may
hardly substitute his male-specific obligations within the household economy33
. Thus, the presence of
more than one man in the household may affect the migration decision of household members (first
stage), without being relevant for the labour market behaviour of the rest of the household (exclusion
restriction).34 Results are reported in Table 8 and first stage migration regressions are reported in Table
9. The very high values of the F-statistics for the excluded instruments at the end of the Table suggest
that instruments are strong.
Table 8 and 9 about here
Results from the IV regression show that past international migration of household members
significantly increase the probability of women to enter in paid self-employment (at 1% significance
level) and decrease their propensity to work in unpaid occupations. The same effect does not hold for
male labor market behaviour. The effect of household migrants currently abroad, though, significantly
decreases the likelihood of female self-employment (at 10% significance level) while increases female
unpaid labor supply at 1% significance level. This may be due to the early stage of the migration
process that requires more effort at home to replace people recently left. Still we do not find evidence of
such effects for male labor force population. Results reported in Table 9 are robust to alternative
specifications and sensitivity checks of specific instrument selections.35
In particular we estimate the
31 During the communist government (1944-1990), migration had come to a virtual halt, with migration officially prohibited
and emigrants and family members left behind ostracized or severely punished. With the fall of the government, the end of the
controls on internal and external migration and the unraveling of the centrally planned economy unleashed a demographic shift
at an unprecedented pace, as individuals and entire households started migrating to the cities or leaving the country altogether
(Carletto et al, 2004; King and Vullnetari, 2003). 32 It should be recalled that the framework of the survey is such that past migration experience of household members occurred
since 1990 and is self-reported by current members of the core households. On the contrary, past migration experience
occurred before 1990 refers to friends and relatives out of the core household (in other words the two variables do not overlap). 33 Just as women are assigned different roles in the society, they tend to have different roles from men within the family.
Women in Albania (especially in rural or remote areas where mentalities and traditions are more conservative) are still
dependent on men for many different activities such as credit access, house maintenance, agricultural work (due to relatively
little use of mechanization), personal security concerns (see Common Country Assessment Albania, 2002). 34 Indeed, in our sample the presence of only one male is irrelevant to female labor supply: female participation rate is not
statistically significant according to the presence of more than one male in the household. Also, controlling for appropriate
demographic characteristics, the number of males exercise no influence on (gender differentials in) labor supply. Yet, male-
specific obligations make Albanian households with a single male much less likely to undertake migration. 35 Other instruments used, without no significant difference in results, are the presence of more than one male in the household
excluding members currently away, two separate dummies whether head or spouse had any relative or friend abroad in 1990.
We present results excluding potentially endogenous variables of non-labor income (e.g. remittances) but including them
deliver similar results.
21
labor market impact of any form of household migration status by using both an exact or overidentified
estimation strategy. Results are consistent with the positive effect of any migration episodes on female
paid self-employment, while no effect is found on male labor supply.
We interpret our findings on gender-differentials as suggestive evidence that family international
migration exposure (and the accompanying return flow of remittances and ultimately migrants)
may lead women to get access to labor market opportunities and earn a positive income. These
findings are in contrast with previous evidence pointing at emigration and remittances as a
deterrent of female labor supply. We argue that, given the higher incidence of temporary or circular
migration patterns especially across neighboring countries, disentangling different alternative
migration status and various forms of female economic activity offer further insights into the
direction and magnitude of migration effects.
However, migration behavioral impact on female household members left behind may be at work
thorough further effects, such as a change in human capital accumulation or fertility choices. Even
though we do not tackle these mechanisms directly, we rule out confounding factors by carrying out a
sensitivity analysis of our results. Table 10 presents IV estimates for a set of sub-samples defined by
observable individual attributes correlated with female labor supply, i.e. by age profile, education and
family structure.
Table 10 about here
As shown in Panel A, labor market outcomes of working age older women (i.e. more than 33 years old)
are robust to previous average results. They are more precisely estimated than it is the case for youth, as
they are less likely to be confounded by the human capital bias (i.e. as a result of household migration,
young women may stay longer in school, that is out of the labor force). Panel B shows that results differ
when splitting the whole sample by education, though. Household migration status changes labor
market outcomes of less educated women, but has a small and statistically insignificant effect on those
with a secondary education degree or higher. This finding suggests that migration empowerment
implications for female members left behind are higher for less educated women, as we would expect
provided the strong positive correlation between human capital and female (paid) employment
outcomes. Finally, Panel C shows that our results are more precisely estimated in the sub-group of
women without young children (less than 4 years old), even though the signs of migration effects are
stable also for the other sub-sample. This finding is also consistent with the large evidence on women’s
work choices constrained by children presence (in the absence of child care services).
Overall our evidence is consistent with the literature showing that more disadvantaged groups (such as
women with respect to men, on average, or less educated adult women compared to young or skilled
ones) are especially responsive to new market opportunities made available by ‘economic globalization’
and the opening of the borders (Mushi and Rosenzweig, 2006; Luke and Munshi, 2007).

22
7. Conclusions
This paper examines the role of male-dominated international migration in shaping labor market
outcomes by gender in migrant-sending households at origin. Using detailed information on family
migration experience from the latest Albanian LSMS, we find that there is a different pattern in the
occupational distribution of female and male work force back home. Unlike earlier studies, we
distinguish the ‘disruptive’ effect of household members’ departure from the income effect of two
forms of family migration experience, and investigate their impact on paid and unpaid labor market
status of household members left behind. Estimates show that male and female labor supplies respond
differently to current and past migration episodes, and the migration effects are robust to the income
(remittance) effect. Accounting for the endogeneity of migration behavior by using an IV estimation
strategy, we find that having household members currently living abroad decreases the probability of
women to engage in paid employment and increase their unpaid work supply. On the contrary, having
household members migrated abroad in the past significantly increases female labor supply in self-
employment while decreasing unpaid work supply. We do not find evidence of the same pattern for the
male labor force population. Moreover, by accounting for key factors (related to age, education and
child caring) that exert a great influence on female labor supply, we find that more disadvantaged
Albanian women (e.g. less educated) with male-dominated household migration experience are more
likely to shift their occupational choices and gain access to remunerative employment.
Our findings support the argument that in a traditional society like Albania migration of household
members may be a source of both income and bargaining power among members of the family at
origin. The gender-biased patterns observed in Albania seem to suggest that, over time, male-dominated
migration influences women’s employment status and income-earning capacity, thereby potentially
enhancing their role as agents of change in the society. This evidence contributes in shedding light on
one of the most contentious impact of migration on economic development at origin, by impinging on
the gender differentials in the international and local labor market behaviour.

23
TABLES
Table 6. Labor market outcomes (pooled linear model): Coefficient estimates
(1) (2) (3) (4) (5) (6) (7) (8) (9)
Baseline model Model with controls Model with controls& remittances
Unpaid Unpaid Unpaid
Wage
Empl.
Paid
Self-empl. work
Wage
Empl.
Paid
Self-empl. work
Wage
Empl.
Paid
Self-empl. work
Female -0.164*** -0.123*** 0.210*** -0.055 -0.022 0.027 -0.051 -0.022 0.03
(10.13) (9.12) (13.12) (1.35) (0.60) (0.73) (1.25) (0.59) (0.80)
Current hh migrants -0.032* -0.031** 0.030* 0.014 -0.052*** -0.009 0.038* -0.047** -0.015
(1.82) (2.10) (1.71) (0.86) (3.56) (0.58) (1.67) (2.36) (0.73)
Past hh migrants -0.160*** -0.050** 0.201*** -0.039* -0.031 0.096*** -0.039* -0.032 0.096***
(6.65) (2.50) (8.48) (1.72) (1.53) (4.60) (1.69) (1.60) (4.57)
Past indiv. migration 0.014 0.007 -0.026 0.029* -0.012 -0.056*** 0.029* -0.012 -0.057***
(0.88) (0.48) (1.57) (1.87) (0.86) (3.97) (1.90) (0.90) (4.02)
Current hh migrants*fem. -0.037 0.035 0.044* -0.032 0.044** 0.027 -0.031 0.045** 0.026
(1.45) (1.63) (1.74) (1.37) (2.07) (1.24) (1.32) (2.12) (1.18)
Past hh migrants*fem. 0.064** 0.068*** -0.091*** 0.007 0.055** -0.055** 0.006 0.055** -0.055**
(2.14) (2.72) (3.08) (0.25) (2.21) (2.15) (0.23) (2.20) (2.15)
Past indiv. migration*fem. 0.114** -0.054 -0.202*** 0.038 -0.02 -0.123*** 0.034 -0.017 -0.117***
(2.08) (1.18) (3.74) (0.77) (0.46) (2.70) (0.68) (0.38) (2.58)
Married 0.051** 0.058*** -0.078*** 0.052** 0.058*** -0.080***
(2.26) (2.89) (3.76) (2.31) (2.90) (3.84)
Married*fem. -0.082*** -0.122*** 0.158*** -0.085*** -0.121*** 0.158***
(3.21) (5.38) (6.74) (3.32) (5.34) (6.75)
Age 0.015*** 0.016*** 0.001 0.015*** 0.016*** 0.001
(4.40) (5.34) (0.20) (4.38) (5.26) (0.19)
Age squared -0.000*** -0.000*** 0 -0.000*** -0.000*** 0
(4.16) (4.37) (0.35) (4.15) (4.28) (0.37)
N. of adults in hh -0.008* -0.003 -0.005 -0.008* -0.002 -0.004
(1.70) (0.60) (1.27) (1.80) (0.50) (0.98)
N. of children 0-4 -0.004 0.01 -0.002 -0.005 0.011 0
(0.36) (1.01) (0.23) (0.47) (1.09) (0.01)
N. of children 5-10 -0.015 -0.005 0.020** -0.015 -0.005 0.020**
(1.53) (0.60) (2.25) (1.55) (0.56) (2.23)
N. of male children 11-14 0.018 -0.033** -0.006 0.017 -0.033** -0.005
(1.17) (2.45) (0.45) (1.12) (2.40) (0.36)
N. of female children 11-14 0.040*** -0.064*** -0.014 0.041*** -0.064*** -0.012
(2.72) (4.90) (1.00) (2.78) (4.86) (0.87)
N. of adults in hh*fem. 0.003 -0.007 0.012* 0.003 -0.007 0.011*
(0.47) (1.17) (1.84) (0.45) (1.19) (1.77)
N. of children 0-4*fem. -0.026 -0.023 -0.027* -0.026 -0.024 -0.028*
(1.56) (1.56) (1.76) (1.58) (1.61) (1.83)
N. of children 5-10*fem. -0.016 0.017 0.008 -0.016 0.017 0.007
(1.13) (1.35) (0.59) (1.10) (1.36) (0.54)
N. of male children 11-14*fem. -0.044** 0.036* 0.024 -0.044* 0.036* 0.023
(1.96) (1.82) (1.17) (1.96) (1.80) (1.10) N. of fem. children
11-14*fem. -0.065*** 0.058*** 0.007 -0.066*** 0.059*** 0.007
(3.02) (3.01) (0.38) (3.06) (3.06) (0.37)
Education (years) 0.033*** -0.008*** -0.014*** 0.033*** -0.008*** -0.014***
(16.68) (4.29) (7.93) (16.75) (4.29) (7.92)
Chronic ill in hh -0.006 -0.003 0.023** -0.005 -0.004 0.022**
(0.55) (0.34) (2.40) (0.48) (0.42) (2.34)
Asset position:
Car ownership -0.115*** 0.123*** 0.002 -0.113*** 0.125*** 0.004
(7.56) (9.07) (0.11) (7.45) (9.24) (0.28)
Water inside dwellling 0.035*** 0.061*** -0.115*** 0.035*** 0.063*** -0.113***
(2.68) (5.28) (9.62) (2.67) (5.40) (9.37)
House fixed phone line 0.074*** -0.019 -0.007 0.074*** -0.019 -0.005
(4.72) (1.39) (0.46) (4.70) (1.35) (0.35)
Land owned (ha.) -0.087*** 0 0.202*** -0.090*** -0.003 0.202***
(5.96) (0.01) (14.96) (6.13) (0.26) (14.89)
Land owned sq. (ha.) 0.012*** 0.002 -0.030*** 0.013*** 0.002 -0.030***
(3.47) (0.55) (9.06) (3.63) (0.77) (9.06)
Regional controls:
District unempl. rate 2002 -0.003*** -0.002** 0.002** -0.003*** -0.001** 0.002**
(4.15) (2.30) (2.33) (3.90) (2.02) (2.29)

24
Community has garbage collection 0.081*** 0.00 -0.113*** 0.078*** 0.003 -0.111***
(4.31) (0.00) (6.53) (4.13) (0.15) (6.37)
Community has police
station -0.025 0.028* 0.01 -0.022 0.029* 0.009
(1.49) (1.83) (0.64) (1.31) (1.89) (0.57)
Tirana 0.178*** -0.173*** -0.072** 0.181*** -0.183*** -0.080***
(5.79) (6.33) (2.55) (5.85) (6.63) (2.82)
Coast urban region 0.105*** -0.112*** -0.055** 0.106*** -0.121*** -0.065**
(3.47) (4.13) (1.98) (3.47) (4.42) (2.32)
Coast rural region 0.043* 0.015 -0.079*** 0.043* 0.01 -0.085***
(1.91) (0.75) (3.84) (1.91) (0.53) (4.16)
Central urban region 0.031 -0.120*** -0.062** 0.031 -0.130*** -0.071**
(0.99) (4.35) (2.16) (0.99) (4.67) (2.47)
Central rural region 0.060*** -0.113*** 0.110*** 0.063*** -0.118*** 0.104***
(3.16) (6.63) (6.24) (3.29) (6.86) (5.87)
Mountain urban region 0.057 -0.150*** -0.086** 0.056 -0.161*** -0.097**
(1.26) (3.70) (2.05) (1.22) (3.95) (2.30)
Remittances and non-lab income:
Remitt. from current int.nal -0.004 -0.001 0.001
migr. (log, pc) (1.59) (0.38) (0.34)
Rem/gifts from relatives -0.004* -0.002 0.003
abroad -last 12 months (log, pc) (1.84) (1.13) (1.52)
Rem/gifts from relatives in -0.004 0.005** -0.001
Albania -last 12 months (log, pc) (1.64) (2.02) (0.58)
Other non-lab income (log, pc) 0.00 -0.004* -0.007***
(0.11) (1.90) (3.75)
Constant 0.430*** 0.234*** 0.202*** -0.244*** 0.007 0.396*** -0.240*** 0.012 0.399***
(40.24) (26.38) (19.19) (3.85) (0.12) (6.79) (3.78) (0.22) (6.83)
Observations 6592 6592 6592
Absolute value of z statistics in brackets
* significant at 10%; ** significant at 5%; *** significant at 1%

25
Table 7. Labor market outcomes by gender (linear model): Coefficient estimates
(1) (2) (3) (4) (5) (6) (7) (8) (9) (10) (11) (12) (13) (14) (15)
Wage
Empl.
Paid
Self-empl.
Unpaid
work
Wage
Empl.
Paid
Self-empl.
Unpaid
work
Wage
Empl.
Paid
Self-empl.
Unpaid
work
Wage
Empl.
Paid
Self-empl.
Unpaid
work
Wage
Empl.
Paid
Self-empl.
Unpaid
work
FEMALE
Any hh migr -0.028** 0.014 0.031**
(2.12) (1.18) (2.09)
Current hh migr -0.019 -0.001 0.003 -0.02 0.00 0.005 0.019 0.014 0.023
(1.25) (0.08) (0.18) (1.36) (0.03) (0.33) (0.78) (0.58) (0.82)
Past hh migr. -0.023* 0.027** 0.034** -0.02 0.025* 0.026* -0.019 0.023* 0.024
(1.69) (2.10) (2.21) (1.47) (1.96) (1.67) (1.39) (1.82) (1.58)
Past indiv. migr 0.073* -0.032 -0.164*** 0.065* -0.03 -0.155***
(1.88) (0.87) (3.78) (1.68) (0.83) (3.57)
Observations 2852 2852 2852 2852 2852
R-sq 0.35 0.16 0.44 0.35 0.17 0.44 0.34 0.17 0.44 0.35 0.17 0.45 0.35 0.17 0.45
Indiv., hh and
regional controls yes yes yes yes yes yes Yes yes yes yes yes yes yes yes yes
Remittances no no no no no no No no no no no no yes yes yes
MALE
Any hh migr -0.001 -0.055*** 0.035**
(0.07) (3.59) (2.44)
Current hh migr. 0.018 -0.063*** -0.007 0.016 -0.062*** -0.001 0.029 -0.062** 0.00
(0.95) (3.86) (0.44) (0.84) (3.84) (0.06) (0.96) (2.38) (0.01)
Past hh migr. -0.043* -0.031 0.123*** -0.038 -0.036 0.109*** -0.038 -0.037* 0.109***
(1.73) (1.43) (6.07) (1.49) (1.60) (5.28) (1.49) (1.66) (5.28)
Past indiv. migr. 0.017 -0.009 -0.048*** 0.017 -0.01 -0.047***
(0.95) (0.59) (3.39) (0.98) (0.64) (3.38)
Observations 3740 3740 3740 3740 3740
R-sq 0.15 0.18 0.22 0.15 0.18 0.22 0.15 0.18 0.23 0.15 0.18 0.23 0.15 0.19 0.23
Indiv., hh and
regional controls yes yes yes yes yes yes yes yes yes yes yes yes yes yes yes
Remittances no no no no no no no no no no no no yes yes yes
Notes: Absolute value of z statistics in brackets. * significant at 10%; ** significant at 5%; *** significant at 1%
Controls are included as in Table 6.
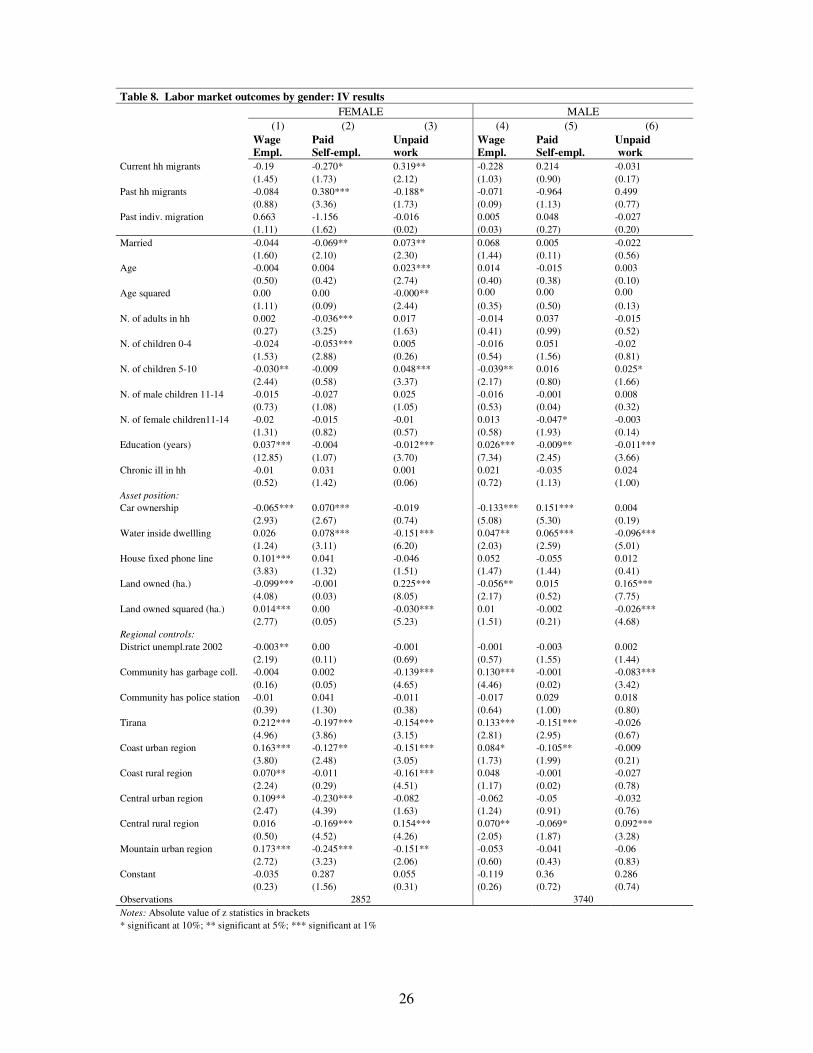
26
Table 8. Labor market outcomes by gender: IV results
FEMALE MALE
(1) (2) (3) (4) (5) (6)
Wage
Empl.
Paid
Self-empl.
Unpaid
work
Wage
Empl.
Paid
Self-empl.
Unpaid
work
Current hh migrants -0.19 -0.270* 0.319** -0.228 0.214 -0.031
(1.45) (1.73) (2.12) (1.03) (0.90) (0.17)
Past hh migrants -0.084 0.380*** -0.188* -0.071 -0.964 0.499
(0.88) (3.36) (1.73) (0.09) (1.13) (0.77)
Past indiv. migration 0.663 -1.156 -0.016 0.005 0.048 -0.027
(1.11) (1.62) (0.02) (0.03) (0.27) (0.20)
Married -0.044 -0.069** 0.073** 0.068 0.005 -0.022
(1.60) (2.10) (2.30) (1.44) (0.11) (0.56)
Age -0.004 0.004 0.023*** 0.014 -0.015 0.003
(0.50) (0.42) (2.74) (0.40) (0.38) (0.10)
Age squared 0.00 0.00 -0.000** 0.00 0.00 0.00
(1.11) (0.09) (2.44) (0.35) (0.50) (0.13)
N. of adults in hh 0.002 -0.036*** 0.017 -0.014 0.037 -0.015
(0.27) (3.25) (1.63) (0.41) (0.99) (0.52)
N. of children 0-4 -0.024 -0.053*** 0.005 -0.016 0.051 -0.02
(1.53) (2.88) (0.26) (0.54) (1.56) (0.81)
N. of children 5-10 -0.030** -0.009 0.048*** -0.039** 0.016 0.025*
(2.44) (0.58) (3.37) (2.17) (0.80) (1.66)
N. of male children 11-14 -0.015 -0.027 0.025 -0.016 -0.001 0.008
(0.73) (1.08) (1.05) (0.53) (0.04) (0.32)
N. of female children11-14 -0.02 -0.015 -0.01 0.013 -0.047* -0.003
(1.31) (0.82) (0.57) (0.58) (1.93) (0.14)
Education (years) 0.037*** -0.004 -0.012*** 0.026*** -0.009** -0.011***
(12.85) (1.07) (3.70) (7.34) (2.45) (3.66)
Chronic ill in hh -0.01 0.031 0.001 0.021 -0.035 0.024
(0.52) (1.42) (0.06) (0.72) (1.13) (1.00)
Asset position:
Car ownership -0.065*** 0.070*** -0.019 -0.133*** 0.151*** 0.004
(2.93) (2.67) (0.74) (5.08) (5.30) (0.19)
Water inside dwellling 0.026 0.078*** -0.151*** 0.047** 0.065*** -0.096***
(1.24) (3.11) (6.20) (2.03) (2.59) (5.01)
House fixed phone line 0.101*** 0.041 -0.046 0.052 -0.055 0.012
(3.83) (1.32) (1.51) (1.47) (1.44) (0.41)
Land owned (ha.) -0.099*** -0.001 0.225*** -0.056** 0.015 0.165***
(4.08) (0.03) (8.05) (2.17) (0.52) (7.75)
Land owned squared (ha.) 0.014*** 0.00 -0.030*** 0.01 -0.002 -0.026***
(2.77) (0.05) (5.23) (1.51) (0.21) (4.68)
Regional controls:
District unempl.rate 2002 -0.003** 0.00 -0.001 -0.001 -0.003 0.002
(2.19) (0.11) (0.69) (0.57) (1.55) (1.44)
Community has garbage coll. -0.004 0.002 -0.139*** 0.130*** -0.001 -0.083***
(0.16) (0.05) (4.65) (4.46) (0.02) (3.42)
Community has police station -0.01 0.041 -0.011 -0.017 0.029 0.018
(0.39) (1.30) (0.38) (0.64) (1.00) (0.80)
Tirana 0.212*** -0.197*** -0.154*** 0.133*** -0.151*** -0.026
(4.96) (3.86) (3.15) (2.81) (2.95) (0.67)
Coast urban region 0.163*** -0.127** -0.151*** 0.084* -0.105** -0.009
(3.80) (2.48) (3.05) (1.73) (1.99) (0.21)
Coast rural region 0.070** -0.011 -0.161*** 0.048 -0.001 -0.027
(2.24) (0.29) (4.51) (1.17) (0.02) (0.78)
Central urban region 0.109** -0.230*** -0.082 -0.062 -0.05 -0.032
(2.47) (4.39) (1.63) (1.24) (0.91) (0.76)
Central rural region 0.016 -0.169*** 0.154*** 0.070** -0.069* 0.092***
(0.50) (4.52) (4.26) (2.05) (1.87) (3.28)
Mountain urban region 0.173*** -0.245*** -0.151** -0.053 -0.041 -0.06
(2.72) (3.23) (2.06) (0.60) (0.43) (0.83)
Constant -0.035 0.287 0.055 -0.119 0.36 0.286
(0.23) (1.56) (0.31) (0.26) (0.72) (0.74)
Observations 2852 3740
Notes: Absolute value of z statistics in brackets
* significant at 10%; ** significant at 5%; *** significant at 1%

27
Table 9: Migration equations- IV-method: First Stages Regressions
FEMALE MALE
Current
hh migr.
Past hh
migr.
Past indiv.
migr.
Current
hh migr.
Past hh
migr.
Past indiv.
migr.
Married -0.042 0.138*** 0.024** -0.034 -0.024 0.132***
(1.56) (4.72) (2.27) (1.23) (1.16) (4.43)
Age -0.041*** 0.002 0 -0.021*** -0.039*** 0.047***
(7.71) (0.42) (0.14) (4.72) (11.62) (9.61)
Age squared 0.001*** 0 0 0.000*** 0.001*** -0.001***
(8.40) (1.17) (0.59) (6.21) (13.40) (12.23)
N. of adults in hh -0.023*** 0.051*** -0.004* -0.015*** 0.039*** -0.015***
(3.91) (8.09) (1.96) (3.14) (11.13) (3.03)
N. of children 0-4 -0.040*** 0.075*** 0.002 -0.023** 0.035*** 0.028**
(2.88) (5.01) (0.40) (2.07) (4.29) (2.34)
N. of children 5-10 -0.067*** -0.014 -0.002 -0.051*** 0.002 -0.039***
(5.89) (1.12) (0.48) (5.07) (0.24) (3.61)
N. of male children 11-14 -0.102*** -0.01 -0.011 -0.107*** 0.003 -0.026
(5.63) (0.50) (1.55) (6.99) (0.24) (1.59)
N. of female children 11-14 -0.043** -0.032* -0.004 -0.070*** -0.006 -0.045***
(2.55) (1.77) (0.60) (4.84) (0.57) (2.89)
Education (years) -0.005* -0.001 0.001 -0.009*** 0 -0.003
(1.64) (0.17) (0.80) (3.59) (0.15) (0.99)
Chronic ill in hh 0.065*** -0.015 0.009 0.066*** -0.014 0.02
(3.99) (0.83) (1.36) (4.79) (1.37) (1.38)
Asset position:
Car ownership 0.035 0.048* 0.009 0.044** 0 0.034*
(1.43) (1.86) (0.98) (2.25) (0.02) (1.65)
Water inside dwelling 0.019 0.058** 0.020** 0.028* 0.025** 0.066***
(0.91) (2.56) (2.54) (1.69) (2.05) (3.69)
House fixed phone line 0.053** -0.079*** 0.007 0.003 -0.031** 0.019
(2.12) (2.94) (0.70) (0.14) (2.04) (0.89)
Land owned (ha.) 0.069*** 0.068*** 0.022** 0.059*** 0.023 0.080***
(3.05) (2.80) (2.47) (3.08) (1.63) (3.88)
Land owned squared (ha.) -0.008 -0.017*** -0.002 0.001 -0.007** -0.018***
(1.38) (2.80) (0.73) (0.16) (2.14) (3.63)
Regional controls:
District unemployment rate 2002 0.006*** -0.001 -0.001 0.005*** 0.00 -0.003***
(5.03) (0.79) (1.31) (4.65) (0.20) (2.72)
Community has garbage collection -0.044 -0.006 0.015 0 -0.011 -0.037
(1.50) (0.18) (1.29) (0.01) (0.60) (1.41)
Community has police station 0.051* -0.011 0.012 0.037* 0.003 0.009
(1.87) (0.38) (1.14) (1.66) (0.21) (0.40)
Tirana -0.064 -0.137*** -0.005 -0.04 -0.018 -0.132***
(1.30) (2.59) (0.29) (1.00) (0.61) (3.10)
Coast urban region 0.037 -0.086* 0.009 0.063 -0.006 -0.033
(0.76) (1.66) (0.47) (1.58) (0.21) (0.76)
Coast rural region 0.036 -0.071* -0.014 0.017 -0.029 -0.013
(1.00) (1.85) (1.03) (0.58) (1.33) (0.40)
Central urban region -0.125** -0.055 -0.009 -0.067 0.004 -0.049
(2.55) (1.05) (0.46) (1.64) (0.12) (1.12)
Central rural region -0.088*** -0.001 0.022* -0.052** 0.012 0.012
(2.81) (0.04) (1.85) (2.07) (0.67) (0.45)
Mountain urban region -0.105 -0.068 -0.016 -0.068 0.048 -0.085
(1.44) (0.87) (0.59) (1.15) (1.09) (1.35)
Instruments:
More than 1 man in the hh 0.201*** 0.031 -0.014 0.166*** 0.018 -0.015
(7.20) (1.04) (1.29) (5.92) (0.86) (0.51)
Migration density at municipality level in 1995 0.423*** 1.400*** 0.069 0.329*** 0.285*** 1.298***
(3.48) (10.71) (1.46) (3.16) (3.69) (11.64)
Family/friends living abroad in 1990 0.01 -0.006 0.044*** 0.011 -0.023 0.081***
(0.31) (0.18) (3.58) (0.44) (1.17) (2.90)
Constant 0.847*** -0.009 0.023 0.441*** 0.550*** -0.379***
(8.95) (0.09) (0.63) (5.10) (8.59) (4.09)
Observations 2823 3698
F-test (3, 2848)
First-stage 18.89 78.66 9.16 15.02 9.98 12.59
P-value 0.0000 0.0000 0.0000 0.0000 0.0000 0.0000
Notes: Absolute value of z statistics in brackets
* significant at 10%; ** significant at 5%; *** significant at 1%

28
Table 10. Female labor market outcomes by age, education and family structure: IV results
PANEL A
Wage Empl. Paid Self- empl. Unpaid work Wage Empl. Paid Self- empl. Unpaid work
Sample Age 16-32 Age 33-64
Current hh migrants -0.297 0.045 0.196 -0.117 -0.543** 0.318*
(1.58) (0.23) (0.85) (0.62) (2.39) (1.73)
Past hh migrants 0.124 0.133 -0.227 -0.196 0.448*** -0.095
(0.71) (0.75) (1.05) (1.64) (3.10) (0.81)
Obs. 1172 1651
PANEL B
Wage Empl. Paid Self- empl. Unpaid work Wage Empl. Paid Self- empl. Unpaid work
Sample Primary education or lower Secondary education or higher
Current hh migrants -0.268 -0.26 0.501* -1.253 0.512 0.575
(0.48) (0.76) (0.22) (0.53) (0.58) (0.50)
Past hh migrants 0.122 0.312*** -0.345*** -2.489 1.635 0.992
(1.63) (3.29) (2.76) (0.61) (0.58) (0.57)
Obs. 1553 1251
PANEL C
Wage Empl. Paid Self- empl. Unpaid work Wage Empl. Paid Self- empl. Unpaid work
Sample Young children (0-4) No young children (0-4)
Current hh migrants -0.005 -2.446 4.074 -0.163 -0.254** 0.206*
(0.24) (0.20) (0.18) (0.41) (0.84) (0.99)
Past hh migrants -0.254 2.76 -4.321 -0.108 0.246*** 0.082
(0.08) (0.17) (0.19) (1.23) (2.79) (0.86)
Obs. 626 2197
Notes: Absolute value of z statistics in brackets. * significant at 10%; ** significant at 5%; *** significant at 1%.
All specifications include controls and instruments as in Table 8 and 9.

29
APPENDIX
Table A.1. Labor market outcomes (pooled multinomial logit model): Marginal effects
(1’) (2’) (3’) (4’) (5’) (6’) (7’) (8’) (9’)
Baseline model Model with controls Model with controls& remittances
Wage
Empl.
Paid
Self-empl.
Unpaid
work
Wage
Empl.
Paid
Self-empl.
Unpaid
work
Wage
Empl.
Paid
Self-empl.
Unpaid
work
Female -0.156*** -0.133*** 0.217*** -0.061 -0.090* 0.088 -0.053 -0.088 0.086
(0.016) (0.014) (0.017) (0.064) (0.053) (0.056) (0.065) (0.054) (0.056)
Current hh migrants -0.036** -0.030** 0.033 0.024 -0.073*** -0.009 0.057* -0.059** -0.028
(0.017) (0.013) (0.020) (0.022) (0.016) (0.021) (0.032) (0.023) (0.029)
Past hh migrants -0.156*** -0.055*** 0.217*** -0.057* -0.041* 0.118*** -0.055* -0.042* 0.115***
(0.021) (0.017) (0.027) (0.031) (0.025) (0.031) (0.032) (0.025) (0.031)
Past indiv. migration 0.017 0.009 -0.035* 0.028 -0.016 -0.071*** 0.030 -0.016 -0.075***
(0.017) (0.013) (0.019) (0.020) (0.016) (0.018) (0.020) (0.016) (0.018)
Current hh migrants*fem. -0.057** 0.052* 0.035 -0.073** 0.105*** 0.012 -0.076** 0.106*** 0.013
(0.027) (0.027) (0.028) (0.034) (0.036) (0.031) (0.034) (0.037) (0.031)
Past hh migrants*fem. 0.023 0.103*** -0.102*** -0.018 0.113*** -0.074** -0.021 0.114*** -0.073**
(0.036) (0.035) (0.026) (0.043) (0.043) (0.029) (0.043) (0.043) (0.029)
Past indiv. migration*fem. 0.135** -0.083** -0.156*** 0.136* -0.085 -0.141*** 0.130* -0.084 -0.132***
(0.063) (0.042) (0.042) (0.075) (0.058) (0.038) (0.075) (0.059) (0.041)
Married 0.067** 0.049* -0.090*** 0.069** 0.048* -0.092***
(0.031) (0.026) (0.032) (0.031) (0.026) (0.032)
Married*fem. -0.104*** -0.130*** 0.203*** -0.111*** -0.129*** 0.208***
(0.038) (0.030) (0.037) (0.038) (0.030) (0.037)
Age 0.017*** 0.026*** -0.009** 0.017*** 0.026*** -0.009**
(0.005) (0.004) (0.004) (0.005) (0.005) (0.004)
Age squared -0.000*** -0.000*** 0.000** -0.000*** -0.000*** 0.000**
(0.000) (0.000) (0.000) (0.000) (0.000) (0.000)
N. of adults in hh -0.005 -0.006 -0.004 -0.006 -0.005 -0.002
(0.006) (0.005) (0.006) (0.006) (0.005) (0.006)
N. of children 0-4 -0.015 0.016 -0.002 -0.016 0.017 0.001
(0.015) (0.011) (0.015) (0.015) (0.012) (0.015)
N. of children 5-10 -0.030** -0.013 0.050*** -0.031** -0.012 0.052***
(0.013) (0.010) (0.013) (0.013) (0.011) (0.013)
N. of male children 11-14 0.022 -0.045*** 0.007 0.023 -0.044** 0.010
(0.020) (0.017) (0.019) (0.020) (0.017) (0.019)
N. of female children 11-14 0.044** -0.087*** -0.009 0.044** -0.087*** -0.004
(0.019) (0.017) (0.019) (0.019) (0.017) (0.019)
N. of adults in hh*fem. -0.006 -0.001 0.012 -0.006 -0.002 0.011
(0.011) (0.009) (0.009) (0.012) (0.009) (0.009)
N. of children 0-4*fem. -0.023 -0.026 -0.019 -0.024 -0.027 -0.019
(0.027) (0.022) (0.022) (0.027) (0.022) (0.022)
N. of children 5-10*fem. -0.043* 0.056*** -0.013 -0.042* 0.056*** -0.016
(0.022) (0.017) (0.018) (0.023) (0.018) (0.018)
-0.075** 0.074*** 0.010 -0.074** 0.073** 0.008 N. of male children 11-14*fem. (0.036) (0.028) (0.028) (0.036) (0.028) (0.028)
-0.095*** 0.093*** 0.012 -0.095*** 0.094*** 0.011 N. of fem. children
11-14*fem. (0.034) (0.028) (0.027) (0.034) (0.028) (0.027)
Education (years) 0.043*** -0.009*** -0.021*** 0.044*** -0.009*** -0.022***
(0.003) (0.002) (0.003) (0.003) (0.002) (0.003)
Chronic ill in hh -0.011 -0.012 0.037*** -0.010 -0.014 0.034**
(0.015) (0.012) (0.013) (0.015) (0.012) (0.013)
Asset position:
Car ownership -0.130*** 0.156*** -0.003 -0.130*** 0.162*** -0.002
(0.018) (0.020) (0.021) (0.018) (0.021) (0.022)
Water inside dwellling 0.056*** 0.073*** -0.133*** 0.056*** 0.074*** -0.130***
(0.018) (0.015) (0.015) (0.018) (0.015) (0.016)
House fixed phone line 0.078*** -0.007 -0.060** 0.078*** -0.007 -0.058**
(0.022) (0.018) (0.025) (0.023) (0.018) (0.025)
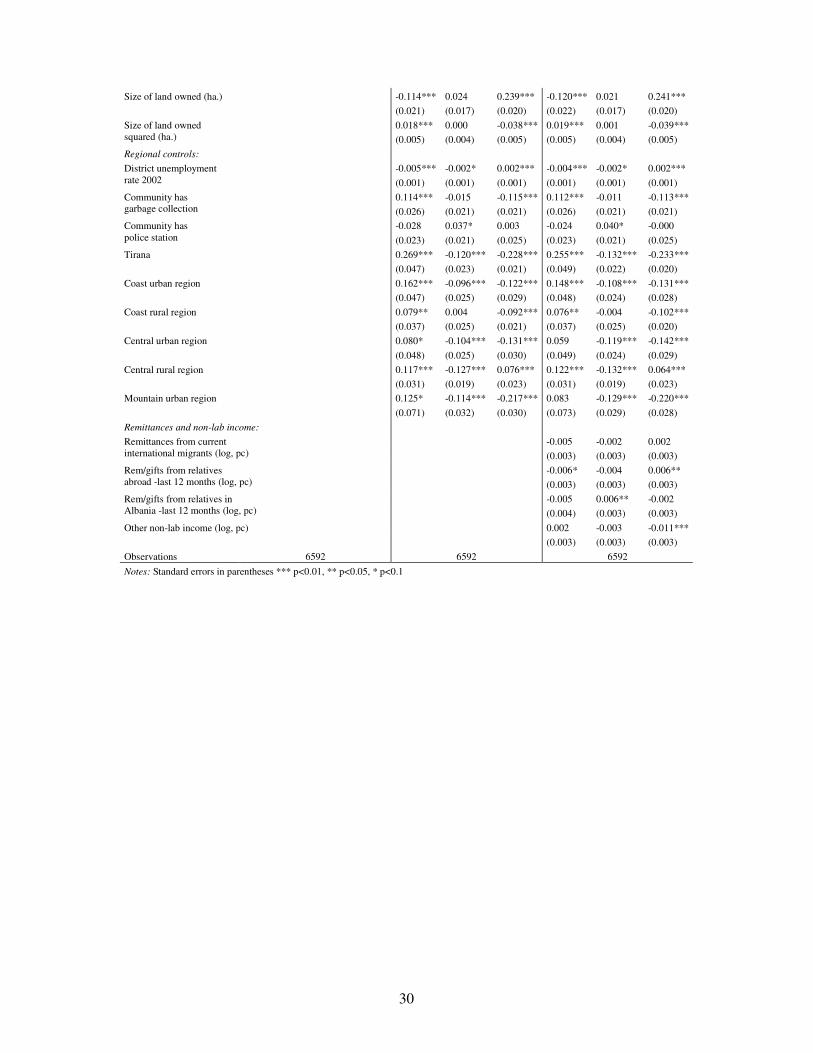
30
Size of land owned (ha.) -0.114*** 0.024 0.239*** -0.120*** 0.021 0.241***
(0.021) (0.017) (0.020) (0.022) (0.017) (0.020)
0.018*** 0.000 -0.038*** 0.019*** 0.001 -0.039*** Size of land owned
squared (ha.) (0.005) (0.004) (0.005) (0.005) (0.004) (0.005)
Regional controls:
-0.005*** -0.002* 0.002*** -0.004*** -0.002* 0.002*** District unemployment
rate 2002 (0.001) (0.001) (0.001) (0.001) (0.001) (0.001)
0.114*** -0.015 -0.115*** 0.112*** -0.011 -0.113*** Community has garbage collection (0.026) (0.021) (0.021) (0.026) (0.021) (0.021)
-0.028 0.037* 0.003 -0.024 0.040* -0.000 Community has
police station (0.023) (0.021) (0.025) (0.023) (0.021) (0.025)
Tirana 0.269*** -0.120*** -0.228*** 0.255*** -0.132*** -0.233***
(0.047) (0.023) (0.021) (0.049) (0.022) (0.020)
Coast urban region 0.162*** -0.096*** -0.122*** 0.148*** -0.108*** -0.131***
(0.047) (0.025) (0.029) (0.048) (0.024) (0.028)
Coast rural region 0.079** 0.004 -0.092*** 0.076** -0.004 -0.102***
(0.037) (0.025) (0.021) (0.037) (0.025) (0.020)
Central urban region 0.080* -0.104*** -0.131*** 0.059 -0.119*** -0.142***
(0.048) (0.025) (0.030) (0.049) (0.024) (0.029)
Central rural region 0.117*** -0.127*** 0.076*** 0.122*** -0.132*** 0.064***
(0.031) (0.019) (0.023) (0.031) (0.019) (0.023)
Mountain urban region 0.125* -0.114*** -0.217*** 0.083 -0.129*** -0.220***
(0.071) (0.032) (0.030) (0.073) (0.029) (0.028)
Remittances and non-lab income:
-0.005 -0.002 0.002 Remittances from current
international migrants (log, pc) (0.003) (0.003) (0.003)
-0.006* -0.004 0.006** Rem/gifts from relatives
abroad -last 12 months (log, pc) (0.003) (0.003) (0.003)
-0.005 0.006** -0.002 Rem/gifts from relatives in
Albania -last 12 months (log, pc) (0.004) (0.003) (0.003)
Other non-lab income (log, pc) 0.002 -0.003 -0.011***
(0.003) (0.003) (0.003)
Observations 6592 6592 6592
Notes: Standard errors in parentheses *** p<0.01, ** p<0.05, * p<0.1

31
Table A-2. Labor market outcomes by gender (multinomial logit model): Marginal effects
FEMALE MALE
(10’) (11’) (12’) (13’) (14’) (15’) (10’) (11’) (12’) (13’) (14’) (15’)
Model with controls Model with controls& remittances Model with controls Model with controls& remittances
Wage
Empl.
Paid
Self-empl.
Unpaid
work
Wage
Empl.
Paid
Self-empl.
Unpaid
work
Wage
Empl.
Paid
Self-empl.
Unpaid
work
Wage
Empl.
Paid
Self-empl.
Unpaid
work
Current hh migrants -0.009 -0.002 0.010 -0.034 0.015 0.041 0.024 -0.076*** 0.002 0.034 -0.067** 0.002
(0.021) (0.020) (0.031) (0.036) (0.033) (0.053) (0.023) (0.018) (0.014) (0.037) (0.029) (0.024)
Past hh migrants -0.033* 0.032* 0.058** -0.034* 0.032* 0.058** -0.042 -0.030 0.079*** -0.041 -0.032 0.080***
(0.019) (0.019) (0.028) (0.019) (0.019) (0.028) (0.034) (0.028) (0.024) (0.034) (0.028) (0.024)
Past indiv. migration 0.145** -0.037 -0.334*** 0.130** -0.036 -0.324*** 0.016 -0.016 -0.043*** 0.016 -0.016 -0.044***
(0.067) (0.053) (0.054) (0.066) (0.054) (0.057) (0.021) (0.018) (0.012) (0.021) (0.018) (0.012)
Married -0.045 -0.069** 0.102** -0.057* -0.068** 0.108** 0.081** 0.024 -0.029 0.083** 0.022 -0.028
(0.032) (0.034) (0.045) (0.033) (0.034) (0.045) (0.039) (0.034) (0.025) (0.039) (0.034) (0.025)
Age 0.005 0.023*** 0.005 0.005 0.023*** 0.004 0.013* 0.025*** -0.013*** 0.012* 0.025*** -0.013***
(0.007) (0.006) (0.009) (0.007) (0.006) (0.009) (0.007) (0.006) (0.004) (0.007) (0.006) (0.004)
Age squared -0.000 -0.000*** 0.000 -0.000 -0.000*** 0.000 -0.000** -0.000*** 0.000*** -0.000** -0.000*** 0.000***
(0.000) (0.000) (0.000) (0.000) (0.000) (0.000) (0.000) (0.000) (0.000) (0.000) (0.000) (0.000)
N. of adults in hh 0.003 -0.010 -0.001 0.002 -0.011 0.001 -0.012* -0.003 0.001 -0.013* -0.002 0.002
(0.007) (0.007) (0.010) (0.007) (0.007) (0.010) (0.007) (0.006) (0.004) (0.007) (0.006) (0.004)
N. of children 0-4 -0.010 -0.017 -0.045* -0.012 -0.017 -0.040 -0.030* 0.022* -0.003 -0.032** 0.024* -0.003
(0.016) (0.016) (0.024) (0.017) (0.016) (0.025) (0.016) (0.013) (0.009) (0.016) (0.013) (0.009)
N. of children 5-10 -0.032** 0.009 0.049*** -0.031** 0.008 0.049*** -0.031** -0.001 0.030*** -0.030** 0.001 0.030***
(0.013) (0.012) (0.018) (0.013) (0.012) (0.019) (0.014) (0.011) (0.008) (0.014) (0.012) (0.008)
N. of male children 11-14 -0.006 0.001 0.008 -0.005 0.000 0.011 0.017 -0.041** 0.010 0.018 -0.040** 0.011
(0.020) (0.018) (0.028) (0.020) (0.018) (0.028) (0.022) (0.019) (0.012) (0.022) (0.019) (0.012)
N. of fem. children 11-14 -0.012 -0.015 -0.014 -0.012 -0.014 -0.008 0.047** -0.089*** 0.001 0.046** -0.090*** 0.005
(0.019) (0.017) (0.027) (0.019) (0.018) (0.027) (0.021) (0.019) (0.012) (0.021) (0.019) (0.012)
Education (years) 0.041*** 0.001 -0.029*** 0.042*** 0.001 -0.031*** 0.035*** -0.016*** -0.012*** 0.035*** -0.016*** -0.013***
(0.004) (0.004) (0.006) (0.004) (0.004) (0.006) (0.004) (0.003) (0.002) (0.004) (0.003) (0.002)
Chronic ill in hh -0.022 -0.012 0.051* -0.020 -0.013 0.046* 0.001 -0.007 0.024** 0.000 -0.009 0.024**
(0.018) (0.017) (0.027) (0.018) (0.018) (0.027) (0.019) (0.016) (0.012) (0.019) (0.016) (0.012)
Car ownership -0.057*** 0.085*** -0.022 -0.056*** 0.094*** -0.023 -0.170*** 0.196*** 0.004 -0.171*** 0.198*** 0.007
(0.020) (0.029) (0.041) (0.021) (0.030) (0.042) (0.025) (0.026) (0.019) (0.026) (0.026) (0.019)
Water inside dwelling 0.056** 0.097*** -0.211*** 0.057** 0.098*** -0.207*** 0.040* 0.047** -0.068*** 0.039* 0.048** -0.068***
(0.023) (0.021) (0.030) (0.024) (0.021) (0.030) (0.023) (0.020) (0.014) (0.023) (0.020) (0.014)
House fixed phone line 0.045* 0.006 -0.045 0.046* 0.008 -0.043 0.070** -0.017 -0.047** 0.071** -0.017 -0.046*
(0.026) (0.028) (0.049) (0.027) (0.028) (0.050) (0.028) (0.023) (0.024) (0.028) (0.023) (0.024)
Hh size of land owned (ha.) -0.170*** -0.018 0.377*** -0.177*** -0.020 0.390*** -0.064** 0.050** 0.140*** -0.071** 0.047** 0.137***
(0.026) (0.025) (0.037) (0.027) (0.026) (0.037) (0.028) (0.022) (0.018) (0.028) (0.023) (0.018)

32
0.021*** -0.000 -0.045*** 0.022*** 0.000 -0.047*** 0.011* 0.001 -0.027*** 0.013** 0.001 -0.027*** Hh size of land owned
squared (ha.) (0.006) (0.007) (0.009) (0.006) (0.007) (0.009) (0.007) (0.005) (0.005) (0.007) (0.005) (0.005)
District unemployment rate 2002 -0.007*** -0.002 0.004** -0.007*** -0.001 0.004** -0.002 -0.002 0.001* -0.002 -0.001 0.002*
(0.001) (0.001) (0.002) (0.001) (0.001) (0.002) (0.001) (0.001) (0.001) (0.001) (0.001) (0.001)
Community has garbage collection 0.056* -0.024 -0.179*** 0.051 -0.024 -0.175*** 0.154*** 0.001 -0.056*** 0.158*** 0.008 -0.055***
(0.033) (0.029) (0.040) (0.033) (0.029) (0.041) (0.034) (0.029) (0.019) (0.034) (0.029) (0.019)
Community has police station -0.013 0.019 -0.000 -0.008 0.025 -0.010 -0.035 0.046* 0.010 -0.032 0.047* 0.009
(0.025) (0.029) (0.046) (0.026) (0.030) (0.047) (0.030) (0.027) (0.024) (0.030) (0.027) (0.024)
Tirana 0.281*** -0.118*** -0.369*** 0.278*** -0.127*** -0.394*** 0.180*** -0.127*** -0.149*** 0.157** -0.142*** -0.150***
(0.098) (0.023) (0.057) (0.099) (0.022) (0.053) (0.058) (0.033) (0.017) (0.062) (0.031) (0.017)
Coast urban 0.223** -0.109*** -0.264*** 0.207** -0.118*** -0.289*** 0.071 -0.091** -0.061** 0.048 -0.106*** -0.067***
(0.091) (0.024) (0.063) (0.091) (0.023) (0.060) (0.058) (0.036) (0.027) (0.061) (0.035) (0.026)
Coast rural 0.118* -0.025 -0.247*** 0.109 -0.039 -0.278*** 0.057 0.011 -0.030 0.055 0.005 -0.036*
(0.068) (0.030) (0.047) (0.067) (0.029) (0.046) (0.042) (0.035) (0.019) (0.043) (0.034) (0.018)
Central urban 0.186** -0.138*** -0.234*** 0.171** -0.148*** -0.265*** -0.050 -0.084** -0.103*** -0.087 -0.106*** -0.109***
(0.087) (0.022) (0.069) (0.087) (0.021) (0.066) (0.064) (0.040) (0.023) (0.066) (0.038) (0.022)
Central rural 0.087* -0.163*** 0.098** 0.095* -0.170*** 0.068 0.127*** -0.102*** 0.042** 0.128*** -0.107*** 0.038*
(0.051) (0.024) (0.048) (0.052) (0.024) (0.049) (0.036) (0.027) (0.019) (0.036) (0.027) (0.019)
Mountain rural 0.275** -0.128*** -0.400*** 0.230* -0.137*** -0.415*** -0.064 -0.109** -0.132*** -0.120 -0.132*** -0.134***
(0.130) (0.023) (0.075) (0.129) (0.020) (0.066) (0.092) (0.050) (0.021) (0.093) (0.045) (0.019)
-0.006* -0.003 0.006 -0.002 -0.001 0.000 Rem. from current international
migrants (log, pc) (0.004) (0.003) (0.006) (0.004) (0.004) (0.003)
-0.004 -0.009** 0.017*** -0.007* -0.000 -0.000 Rem/gifts from relatives abroad –
last 12 months (log, pc) (0.004) (0.004) (0.006) (0.004) (0.003) (0.003)
-0.013*** 0.004 0.005 0.001 0.007* -0.005 Rem/gifts from relatives in Albania-
last 12 months (log, pc) (0.004) (0.004) (0.007) (0.005) (0.004) (0.003)
Other non-lab income (log, pc) 0.005 -0.001 -0.023*** 0.001 -0.003 -0.005*
(0.004) (0.004) (0.006) (0.004) (0.003) (0.003)
Observations 2852 2852 3740 3740
Notes: Standard errors in parentheses *** p<0.01, ** p<0.05, * p<0.1

33
Table A-3. Labor market outcomes by sector and gender (multinomial logit): coefficient estimates
(1) (2) (3) (4) (5) (6) (7) (8) (9) (10)
Wage empl.
(agr. & non-agr.)
Paid
Self-emp agr.
Paid
Self-emp non-agr.
Unpaid
work agr.
Unpaid work
non-agr.
Wage empl.
(agr. & non-agr.)
Paid
Self-emp agr.
Paid
Self-emp non-agr.
Unpaid
work agr.
Unpaid work
non-agr.
FEMALE
Current hh migrants -0.066 -0.03 -0.052 0.033 -0.152 0.252 -0.304 0.433 0.004 -1.047*
(0.39) (0.13) (0.22) (0.20) (0.68) (0.90) (0.70) (1.21) (0.01) (1.91)
Past hh migrants 0.12 0.377* 0.618*** 0.517*** 0.068 0.115 0.373* 0.621*** 0.502*** 0.123
(0.75) (1.70) (3.00) (3.38) (0.33) (0.72) (1.66) (2.99) (3.22) (0.59)
Past indiv. migration -0.185 -1.474* -0.925 -2.465*** -0.917 -0.243 -1.344 -0.992 -2.363*** -0.835
(0.53) (1.69) (1.50) (5.21) (1.64) (0.70) (1.54) (1.60) (4.93) (1.48)
Observations 2852 2852
Indiv., hh and
regional controls yes yes yes yes yes yes yes yes yes yes
Remittances no no no no no yes yes yes yes yes
MALE
Current hh migrants -0.328** -0.942*** -0.650*** -0.429*** -0.314 -0.166 -1.033*** -0.369 -0.294 -0.645
(2.47) (4.44) (3.90) (2.66) (1.10) (0.77) (2.88) (1.38) (1.06) (1.05)
Past hh migrants -0.005 0.028 -0.097 0.708*** -0.265 0.004 -0.019 -0.089 0.703*** -0.219
(0.03) (0.09) (0.39) (3.39) (0.67) (0.02) (0.06) (0.36) (3.33) (0.56)
Past indiv. migration -0.318** -0.568*** -0.355** -0.798*** -0.219 -0.332** -0.599*** -0.362** -0.833*** -0.182
(2.46) (2.90) (2.30) (5.01) (0.78) (2.55) (3.02) (2.34) (5.19) (0.65)
Observations 3740 3740
Indiv., hh and
regional controls yes yes yes yes yes yes yes yes yes yes
Remittances no no no no no yes yes yes yes yes
34
References
Agesa, R. U. and Sunwoong K. (2001), “Rural to Urban Migration as a Household Decision: Evidence
from Kenya”, Review of Development Economics, 5 (1), February: 60-75.
Albanesi, S. and Olivetti, C. (2006), "Home Production, Market Production, and the Gender Wage Gap:
Incentives and Expectations", NBER WP 12212 May 2006.
Altonji, Joseph G. and Rebecca Blank. 1999. “Race and Gender in the Labor Market.” In David Card
and Orley Ashenfelter, eds., Handbook of Labor Economics, Volume 3c, Amsterdam: North-Holland.
Amuedo-Dorantes, C. and Pozo, S. (2006) “Migration, Remittances, and Male and Female Employment
Patterns”, American Economic Review Papers and Proceedings, Vol. 96 (2).
Behrman, Jere R. (1997) “Intrahousehold Distribution and the Family”, in: Mark R. Rosenzweig and
Oded Stark (eds), Handbook of Population and Family Economics, Amsterdam: Elsevier, p. 125-187.
Black, R., R. King and R. Tiemoko (2003): “Migration, Return and Small Enterprise Development In
Ghana: A Route Of Poverty?” Brighton UK: Working Paper No.9, Sussex Centre For Migration
Research.
Blumberg, R.L. (1984) A general theory of gender stratification, Sociological Theory, pp. 23-101.
Boserup, E. (1970) Women’s role in Economic Development, London: Geroge Allen and Uwin, 1970.
Carletto, C., Davis, B., Stampini, M. & Zezza, A. (2007) “A Country On The Move: International
Migration In Post Communist Albania”, International Migration Review, forthcoming.
Chen, J. (2006) “Migration and Imperfect Monitoring: Implications for Intra-household Allocation,”
American. Economic Review: Papers and Proceedings, May 2006
Co C.Y., Gang I.M., Yun M.S. (2000) “Returns to Returning”, Journal of Population Economics
13:57–80.
Coulon, A and Piracha, M. 2005. "Self-selection and the performance of return migrants: the source
country perspective," Journal of Population Economics, vol. 18(4), pages 779-807
Cox Edwards, A., and M. Ureta (2003): “International Migration, Remittances and Schooling: Evidence
From El Salvador”, Journal Of Development Economics 72(2): 429-461.18
De Haan, A., 2000, “Migrants, Livelihoods, and Rigths: The relevance of Migration in Development
Policies”, Social Development Department Working Paper, 4, DFID.
Dulfo, E. (2003), “Grandmothers and Granddaughters: Old Age Pension and Intra-household
Allocation in South Africa,” World Bank Economic Review 17(1): 1-25, 2003.
Duflo, E. Udry, C. (2003) “Intrahousehold Resource Allocation in Cote d’Ivoire: Social Norms,
Separate Accounts and Consumption Choices”, BREAD Working Paper No. 016.
Dulfo, E. (2005), “Gender Equality in Development,” BREAD Policy Paper No. 001.
Durand, J., W. Kandel, E.A. Parrado, And D.S. Massey (1996): “International Migration and
Development In Mexican Communities”, Demography, 33(2): 249-264.
Dustmann, C., and O. Kirchkamp (2001): “The Optimal Migration Duration And Activity Choice After

35
Re-Migration”, IZA Discussion Paper, No. 266.
Fernández. R., Fogli, A. and Olivetti, C. (2004) “Mothers and Sons: Preference Formation and Female
Labor Force Dynamics" Quarterly Journal of Economics 119, no. 4: 1249-1299.
Funkhouser, Edward. “Migration from Nicaragua: Some Recent Evidence.” World Development, 1992,
20(8), pp. 1209–18.
Germenji, E. and Swinnen, J. (2005): “Human Capital, Market Imperfections, Poverty And Migration:
Evidence From Albania”, Licos Discussion Papers, No. 175.
Gulati, L., 1987, “Coping with Male Migration”, Economic and Political Weekly, 22(44) WS41-WS46.
Haddad, L., Hoddinot, J., and Alderman, H., 1997. Intra-household Resource Allocation in Developing
Countries. International Food Policy Research Institute, Washington, DC.
Hanson, G.(2005) "Emigration, Remittances, and Labor Force Participation in Mexico," Integration and
Trade Journal, 27(2007): 73-103.
Heckman, J. (1974), ‘Shadow Prices, Market Wages and Labor Supply’, Econometrica, Vol 42, pp.
679-94.
Heckman, J.J. (1980): “Sample Selection Bias As A Specification Error With An Application To The
Estimation of Labor Supply Functions”, In J.P. Smith (Ed.), Female Labor Supply Theory And
Estimation, Princeton University Press, Princeton.
Heckman, J.J., “What has been learned about labor supply in the past twenty years?”, American
Economic Review, 83, 116-121, 1993.
Hill, M.A. (1989): “Female Labour Supply In Japan: Implications Of The Informal Sector for Labor
Force Participation and Hours Of Work”. The Journal Of Human Resources, 24(1): 143-161.
Huffman, W.E. and M.D. Lange (1989): “Off-Farm Work Decisions of Husbands and Wives: Joint
Decision Making”. Review of Economics and Statistics, 471-480.
ILO (2001a) Key Indicators of the Labour Market 2001-2002, International Labour Office, Geneva.
Katz, E. (2003) “The changing role of women in the rural economies of Latin America” in CUREMIS
II, http://www.fao.org/documents/show_cdr.asp?url_file=/DOCREP/006/Y4940E/Y4940E00.HTM
Kilic, T., Carletto, C., Davis, B. and Zezza, A., “Investing Back Home: Return Migration and Business
Ownership in Albania”. World Bank Policy Research Working Paper No. 4366.
Killingsworth, M.R and J.J. Heckman. (1986): “Female Labor Supply: A Survey”, In O. Ashenfelter
And R. Layard (Eds.) Handbook of Labor Economics, Volume 1, Elsevier Science.
King, R. and Vullnetari, J. (2003) “Migration and Development in Albania.” Development Research
Centre on Migration, Globalization and Poverty, Sussex Centre for Migration Research, WP C5, UK.
King, R., Mai, N. and Schwandner-Sievers, S., eds. (2005) The New Albanian Migration. Brighton:
Sussex Academic Press.
Kodderitzsch, S. (1999): “Reforms In Albanian Agriculture. Assessing A Sector In Transition”, World
Bank Technical Paper, No. 431, Washington, Dc.
Labrianidis, L., and Hatziprokopiou, P. (2006) “The Albanian Migration Cycle: Migrants Tend to
36
Return to Their Country of Origin After All.” In The New Albanian Migration, ed. R. King, N. Mai and
S. Schwandner-Sievers. Brighton, UK: Sussex Academic Press.
Lim, L.L. (1996), More and Better Jobs for Women, ILO, Geneva.
Lucas, R.E.B. (1987): “Emigration To South Africa’s Mines”, The American Economic Review, 77(3):
313-330.
Lundberg and Pollak, “Separate Spheres Bargaining and the Marriage Market,” Journal of Political
Economy, 1993.
McCarthy, N. Carletto, G. Davis, B., and Maltsoglou, I. (2007) “Assessing the Impact of Massive Out-
Migration on Agriculture.” ESA Working Paper No. 06-14.
Mehra, R. and Gammage, S. (1999) “Trends, Countertrends, and Gaps in Women’s Employment”,
World Development, Vol.27, No3, pp533-550.
Mendola, M. (2008) “Migration and Technological Change in Rural Households: Complements or
Substitutes?”, Journal of Development Economics, 85 (1-2) 150–175.
Moffitt, R.A. (1999): “New Developments In Econometric Methods For Labor Market Analysis”, In O.
Ashenfelter And D. Card (Eds.) Handbook of Labor Economics, Volume 3, Elsevier Science.
Munshi, K. and Rosenzweig, M. (2006). “Traditional Institutions Meet the Modern World: Caste,
Gender, and Schooling Choice in a Globalizing Economy” American Economic Review 96(4):1225-
1252.
Mwabu, G. and R.E. Evenson. (1997): “A Model of Occupational Choice Applied To Rural Kenya”,
African Development Review, 9(2): 1-14.
Paci, P. (2002). "Gender in Transition", Departmental Working Paper 24617. World Bank: Washington,
D.C.
Papapanagos H. and Sanfey, 1998). "Intention to Emigrate in Transition Countries: the Case of
Albania", Journal of Population Economics, 14(3), pp. 491-504, 2001.
Pencavel, J. (1986): “Labor Supply of Men: A Survey”, In O. Ashenfelter And R. Layard (Eds.)
Handbook of Labor Economics, Volume 1, Elsevier Science.
Pissarides, C., Garibaldi, P., Olivetti, C., Petrongolo, B. and Wasmer, E. (2005) "Women in the Labour
Force: How Well is Europe Doing?" in European Women at Work, T. Boeri, D. Del Boca, and C.
Pissarides eds, Oxford University Press.
Rodriguez, E. R. and Tiongson, E. R. (2001) “Temporary Migration Overseas and Household Labor
Supply: Evidence from Urban Philippines.” International Migration Review, 35(3), pp. 709–25.
Schultz, T. P. (1990) "Women's Changing Participation in the Labor Force: A World Perspective,"
Economic Development and Cultural Change, vol. 38(3), pages 457-88, April.
Soopramanien, D. and G. Johnes. (2001): “A New Look at Gender Effects in Participation and
Occupation Choice”, In Labour. Review Of Labour Economics And International Relations, 15(3): 415-
443.
Stark, O. (1991): The Migration of Labor. Cambridge: Basil Blackwell.
Stark, O. and J.E. Taylor (1989): “Relative Deprivation and International Migration”, Demography,
37
26(1): 1-14.
Thomas, D. (1990), “Intra-household resource allocation: an inferential approach,” Journal of Human
Resources 25: 635-664.
Tiefenthaler, J. (1994): “A Multisector Model of Female Labor Force Participation: Empirical Evidence
From Cebu Island, Philippines”, Economic Development and Cultural Change, 42(4): 719-742.
Verme, P. (2000): “The Choice Of The Working Sector In Transition. Income and Non-Income
Determinants Of Participation In Kazakhstan”, Economics Of Transition, 8(3): 691-673.
Woodruff, C., and Zenteno, R. (2001): “Remittances and Microenterprises in Mexico”, University Of
California At San Diego Working Paper.
World Bank Staff (2003): “Albania Poverty Assessment”. WB Report No. 26213-Al, Washington,Dc.
World Bank Staff (2006): “Albania Labor Market Assessment”. WB Report No. 34597-Al,
Washington,Dc.
Yang, D. and Choi, H. (2007) “Are Remittances Insurance? Evidence from Rainfall Shocks in the
Philippines”, World Bank Economic Review, Vol. 21 (2), pp. 219-248.
Zezza, A., Carletto, G. and Davis, B. (2005). "Moving Away from Poverty: A spatial analysis of
poverty and migration in Albania," Working Papers 05-02, FAO – ESA.