Gender Diversity in Senior Positions and Firm Performance ... · WP/16/50. Gender Diversity in...
29
WP/16/50 Gender Diversity in Senior Positions and Firm Performance: Evidence from Europe by Lone Christiansen, Huidan Lin, Joana Pereira, Petia Topalova, and Rima Turk IMF Working Papers describe research in progress by the author(s) and are published to elicit comments and to encourage debate. The views expressed in IMF Working Papers are those of the author(s) and do not necessarily represent the views of the IMF, its Executive Board, or IMF management.
Transcript of Gender Diversity in Senior Positions and Firm Performance ... · WP/16/50. Gender Diversity in...
WP/16/50
Gender Diversity in Senior Positions and Firm Performance: Evidence from Europe
by Lone Christiansen, Huidan Lin, Joana Pereira, Petia Topalova, and Rima Turk
IMF Working Papers describe research in progress by the author(s) and are published
to elicit comments and to encourage debate. The views expressed in IMF Working
Papers are those of the author(s) and do not necessarily represent the views of the IMF, its
Executive Board, or IMF management.
© 2016 International Monetary Fund WP/16/50
IMF Working Paper
European Department
Gender Diversity in Senior Positions and Firm Performance: Evidence from Europe
Prepared by Lone Christiansen, Huidan Lin, Joana Pereira,
Petia Topalova and Rima Turk*
Authorized for distribution by Petya Koeva Brooks
March 2016
Abstract
This paper examines the link between gender diversity in senior corporate positions and
financial performance of 2 million companies in Europe. We document a positive
association between corporate return on assets and the share of women in senior positions
and establish two potential channels through which gender diversity may affect firm
performance. The positive correlation is more pronounced in, first, sectors where women
form a larger share of the labor force (such as the services sector) and, second, where
complementarities in skills and critical thinking are in high demand (such as high-tech and
knowledge-intensive sectors).
JEL Classification Numbers: J16, J78, G3, M5
Keywords: Gender diversity, senior management, firm performance
Author’s E-Mail Address: : [email protected], [email protected], [email protected],
[email protected], [email protected]
----------------------
*Prepared under the guidance of Petya Koeva Brooks. We would like to thank participants at seminars at the IMF and the Swedish Ministry
of Finance for constructive comments. Morgan Maneely and Katherine Cincotta provided excellent assistance for research and document
preparation. Any remaining errors are our own.
IMF Working Papers describe research in progress by the author(s) and are published to
elicit comments and to encourage debate. The views expressed in IMF Working Papers are
those of the author(s) and do not necessarily represent the views of the IMF, its Executive Board,
or IMF management.
3
Contents Page
Abstract .....................................................................................................................................2
I. Introduction ..........................................................................................................................4
II. Related Literature...............................................................................................................7
III. Data and Measurement .....................................................................................................9
IV. Stylized Facts: Prevalence of Women in Senior Positions ...........................................10
V. Empirical Strategy ............................................................................................................12
VI. Results ...............................................................................................................................14 A. Establishing correlations: Gender diversity and firm financial performance .....................14
B. Main findings: Uncovering channels ..................................................................................15
C. Robustness ...........................................................................................................................16
VII. Conclusion ......................................................................................................................18
Tables
1. Prevalence of Women in Senior Positions ...........................................................................19
2. Share of Women in Senior Positions and Firm Financial Performance ..............................20 3. Share of Women in Senior Positions and Firm Financial Performance: Sectoral
Differences ...............................................................................................................................20 4. Female Intensity and Knowledge Intensity..........................................................................21
5. Female Intensity and Knowledge Intensity: A Horse Race .................................................21 6. Nonlinearities .......................................................................................................................22
7. Robustness: Role of Female Intensity..................................................................................23 8. Robustness: Role of Knowledge Intensity ...........................................................................23
Figure
1. Women in Senior Positions ..................................................................................................12
Appendix Tables
A1. Overview of the Literature on the Impact of Women on Boards ......................................27 A2. Sectoral Female Intensity ..................................................................................................28 A3. High-Tech and Knowledge-Intensive Sectors ..................................................................29
References ...............................................................................................................................24
4
I. INTRODUCTION
With millions of women joining the labor force in Europe over the past three decades, it is
striking that only few senior positions in the top corporate firms are held by women. In
contrast to relatively moderate gender gaps in the European prime-age workforce in 2014,
women occupied on average only 19 percent of corporate board seats and 14 percent of
senior executive positions in the top 600 largest companies in Europe. Even more striking is
that only 4 percent of the chief executive officers of these companies were female.1
These gender disparities at the top of the corporate ladder have prompted several European
countries to institute quotas for women on boards of publicly listed companies. Since
Norway passed a law in 2003 mandating 40 percent representation of both men and women
on the board of publicly listed companies, sixteen European countries have legislated similar
reforms. Most recently, Germany passed a law requiring publicly listed companies to have 30
percent of supervisory seats occupied by women as of 2016. Even where no legal
requirements are in place, boards are under increasing pressure to appoint female directors.
The European Commission (EC) has called on publicly listed companies to voluntarily
commit to increasing the presence of women on boards to 30 percent by 2015 and 40 percent
by 2020 among non-executive directors by actively recruiting qualified women to replace
outgoing male members (European Commission, 2012).2
Gender diversity in senior positions could improve financial performance of firms through a
number of channels.3 Greater representation of women could bring in heterogeneity in values,
beliefs, and attitudes, which would broaden the range of perspectives in the decision making
process (OECD, 2012) and stimulate critical thinking and creativity (Lee and Farh, 2004).
Given well-documented differences in preferences and behavior along gender lines,
important complementarities may also arise between the managerial style of men and
women.4 Furthermore, with the rise of women in the labor force, increasing their
1 Computed using data from the European Commission (http://ec.europa.eu/justice/gender-equality/gender-
decision-making/database/business-finance/executives-non-executives/index_en.htm). The sample covers the
largest publicly listed companies in each country. A maximum of 50 companies, members of the primary blue-
chip index in each country, are included. Data on board members cover all members of the highest decision-
making body in each company, which is typically either the supervisory board or the board of directors. Data on
executives cover senior executives in the two highest decision-making bodies in each company. These are
typically the supervisory board and the management board (in case of a two-tier governance system) and the
board of directors and executive/management committee (in a unitary system).
2 The EC’s proposal applies to companies listed on the stock exchange in the EU member states but excludes all
listed small- and medium-sized firms, affecting about 5,000 companies of the total 7,500 listed firms. It also
keeps open the possibility to exclude firms with a strong gender imbalance in the workforce, measured at less
than 10 percent of the under-represented gender.
3 Increasing diversity could also undermine performance if it is associated with greater misunderstandings,
communication problems, personal conflicts, or negative reactions from stakeholders (Akerlof and Kranton,
2000; Becker, 1957; Choi, 2007; Kremer, 1993; Lazear, 1999).
4 See Croson and Gneezy (2009) for a review of the literature on gender differences in preferences and other
factors that might affect managerial style. McKinsey (2009) argue that certain leadership behaviors were seen
(continued…)
5
representation in senior positions would mitigate gender differences between managers and
subordinates, which could enhance workers’ productivity (Giuliano and others, 2006). Some
have even argued that female managers could be better positioned to serve consumer markets
that are dominated by women (CED, 2012; CAHRS, 2011).
Nevertheless, existing evidence on the impact of gender diversity in the boardroom on firm
performance is inconclusive.5 Influential work by McKinsey (2007) and Catalyst (2007)
documented a strong positive association between the representation of women on the boards
of Fortune 500 companies and corporate performance. Other studies have also linked more
women in senior management and in the board room to better financial outcomes and
governance of listed firms.6 However, later studies that plausibly identify the causal impact
of raising the share of women in corporate boards on firm performance have challenged this
evidence (see, for example, Ahern and Dittmar, 2012 and Appendix Table A1).
Common to all studies is an important limitation: data availability typically constrains the
analysis to publicly listed companies in individual countries.7 The resulting small sample size
makes it hard to detect a statistically significant effect of gender diversity, particularly if its
magnitude is small. Further, little is known about how women fare in senior management
positions in the broader corporate sector and how their presence—both in management and
in the board room—shapes the financial performance of firms. This shortcoming is relevant
in Europe, where small- and medium-sized enterprises often comprise a large share of overall
output and employment.
In this paper, we present new evidence on the prevalence of women in managerial and board
positions and their role in shaping firms’ financial performance in a large sample of non-
financial companies. Contrary to existing studies, which typically focus on a small sample of
listed firms in a particular country, we analyze more than 2 million listed and non-listed firms
with at least two people in the senior management team or in the corporate board across 34
European countries.
Compared to evidence from Europe’s largest listed firms, women working in the broader
corporate sector have made somewhat greater strides in senior positions. On average, almost
a quarter of senior management and board positions in our sample were held by women in
2013. That said, whereas cross-country variation is large, there is still a sizable gap between
more often in women than men, namely people-development, setting expectations and rewards, providing role
models, and participative decision-making.
5 See Rhode and Packel (2014) for a survey of the literature on the gender composition of boards and financial
performance and Appendix Table A1.
6 See, for example, Adler (2001); Carter and others (2003); and Khan and Vieito (2013) for evidence from the
U.S.
7 Studies that use the introduction of quotas for women on corporate boards as an exogenous source of variation
to gender diversity understandably focus only on publicly listed companies, for which the legal requirement is
binding (Matsa and Miller, 2012; Bertrand and others, 2014).
6
the gender composition of the work force and the gender composition of senior positions in
almost all countries.
Our analysis reveals that firms with a larger share of women in senior positions have
significantly higher return on assets (ROAs), even within narrowly defined industries.8
Replacing one man by a woman in senior management or on the corporate board is
associated with 8–13 basis points higher ROAs. As causal interpretation of this correlation is
difficult, we use a simple difference-in-difference strategy to shed light on the underlying
mechanisms behind the better financial outcomes. We find strong evidence for two specific
channels at work:
First, the positive association between gender equality in senior positions and firm
performance is significantly stronger in sectors that employ more women in the labor
force. Specifically, for a firm in an industry in the top quartile in terms of female
intensity, having one more woman on the board or in senior management, while keeping
the size of the board unchanged, is associated with about 20 basis points higher ROAs. In
contrast, a firm in an industry with relatively few women in its labor force would not see
a positive change in its profitability.
Second, knowledge intensive and high-technology sectors—which demand higher
creativity and critical thinking that diversity in general may bring—seem to benefit
significantly more from a higher share of women in senior management. In these sectors,
an additional woman on the board or in senior management is associated with about 30
basis points higher ROAs.
8 For the purposes of this paper we refer to ‘increased gender diversity’ and ‘greater female representation’
interchangeably as an increase in female representation from current levels will lead to increased gender
diversity.
7
The findings suggest that boosting gender diversity in senior positions could have a sizable
impact on the financial performance of firms in Europe, especially in certain sectors. To that
end, leveling the playing field by strengthening policies to facilitate women’s full-time
attachment to the labor force—such as removing fiscal disincentives and providing services
complementary to women’s market work—could help build the pipeline of women for senior
corporate positions, with important macroeconomic implications.
The remainder of this paper is organized as follows. In Section II, we briefly review related
literature. Section III describes the data used in the analysis and measurement of key
variables, and Section IV lays out the key stylized facts about women’s representation in
senior positions across countries. Section V discusses our empirical strategy, while Section
VI presents the main findings and their robustness. Section VII concludes.
II. RELATED LITERATURE
The large literature on the consequences of gender diversity has not led to clear conclusions.
Existing studies have examined both the reduced-form relationship between board
composition—typically of large, publicly listed firms—and (i) firm financial performance,
and (ii) the actions that more diverse boards take (Appendix Table A1).9 However, it
remains unclear whether gender diversity has a meaningful impact on firm performance and
board actions. In a comprehensive review of the literature, Rhode and Packel (2014)
conclude that there is no evidence of a robust and consistent relation between the gender
composition of boards and financial performance, although a company’s public image is
enhanced by promoting equal opportunity and greater inclusion.
A common empirical strategy in the literature is to estimate the correlation between the
gender composition of boards and firms’ financial performance (measured in both accounting
and market value terms). Some studies in this vein find a strong positive relationship among
Fortune 500 companies (McKinsey, 2007; Catalyst, 2007), among U.S. firms (Dezso and
Ross, 2012; Khan and Vieito, 2013), or among public firms in a cross-country sample
(Terjesen and others, 2015). On the other hand, studies focusing on other individual countries
do not find such association (Du Reitz and Henrekson, 2000, for Swedish firms and Lam and
others, 2013, for Chinese firms).
A key challenge in the literature is how to interpret the associations it uncovers. The board
composition of the firm is jointly determined with firm performance. Therefore, while it is
likely that greater presence of women improves firm performance, the causality could also go
the other way—better performing firms are simply able to attract more women or afford to
bring more women on their boards.
9 There are some notable exceptions that employ large datasets. For example, Castaglione and others (2014)
examine the link between firm productivity and gender diversity using a dataset of 58,410 Italian manufacturing
firms. Huang and Kisgen (2013) also assess gender differences in making executive financial and investment
decisions in a sample of 1,866 U.S. firms.
8
To overcome this shortcoming, some studies have exploited the exogenous increase in
women in the boardroom, resulting from legislation of gender quotas for corporate boards of
directors, as in France, Norway, and Spain. Matsa and Miller (2009) investigate the effect of
introducing gender board quotas in Norway, where the female share of corporate directorship
more than doubled from 18 to 40 percent within three years. They find that introducing
quotas reduced short-term profitability for firms that had no female board membership
beforehand, owing to increased labor costs from fewer layoffs and higher relative
employment. Ahern and Dittmar (2012) similarly cast doubt on the positive effects of gender
diversity on corporate boards in response to the legislative changes in Norway, as listed firms
experienced a decline in their stock price at announcement, and their market value also
declined in subsequent years. However, Campbell and Vera (2010), who examine the effect
of legislative changes in Spain, conclude that positive discrimination in favor of female board
appointments and the gender equality act make economic sense. Stock markets react
positively to the appointment of female board managers and a positive association with firm
value is recorded over a sustained period.
Other studies tackle omitted variables and reverse causality problems using alternative
identification strategies. Smith and others (2005) use the average length of education of the
spouses of other CEOs as an instrument to assess the direction of causality between female
top executives and firm performance, as CEOs with well-educated spouses may have a more
positive view on the competence of female CEOs. Adams and Ferreira (2009) propose that
gender diversity only increases value when additional board monitoring enhances firm value,
examining its differential impact in firms with different levels of shareholder rights. They
find that the average effect of gender mix on the board on financial performance of 9,000 U.S.
firms is negative, and that the beneficial effects only materialize for firms with weak
shareholder rights. They thereby question whether gender quotas can increase shareholder
value for well-governed firms. Another study by Huang and Kisgen (2013) uses a difference-
in-differences empirical framework on a hand-collected data set of executive transitions in
the U.S. to show how gender differences in executive financial and investment decision
making affect firm financial outcomes. In turn, they document evidence of overconfidence by
male executives relative to female executives. Finally, Flabbi and others (2014) use matched
employer-employee panel data from about 850 Italian manufacturing firms, allowing them to
control for firm and employee fixed effects, to examine the effect of the gender of the
executive on firm productivity, and the wage distribution of female workers.
This paper contributes to the literature in two ways. Instead of focusing exclusively on
publicly listed companies as most other studies do, it covers firms of all sizes across 34
European countries. It is, to our knowledge, the first study to examine the association
between the presence of women in senior positions and corporate performance in such a rich
cross-country sample. The very large sample size allows us to more precisely estimate
existing trends in the data, within narrowly defined country-industry groups. In addition, this
paper is one of the first studies to highlight the sectoral differences that exist between the
observed correlation in female representation in senior positions and financial performance.
While unable to precisely identify the causal effect of gender diversity on performance due to
the cross-sectional nature of our data, we shed light on the mechanisms through which
greater female presence at the top could help firms’ performance.
9
III. DATA AND MEASUREMENT
The data are primarily from the European subset of the Orbis database, compiled by Bureau
van Dijk Electronic Publishing (BvD). The database provides firm-level data for many
countries worldwide from administrative data collected by local Chambers of Commerce and
then relayed to BvD.
The Orbis database has financial accounting information from detailed harmonized balance
sheets, income statements, and profit and loss accounts of firms. The key distinguishing
feature of the Orbis database is the extraordinary broad coverage of the corporate sector.
Roughly 99 percent of companies in the database are private, compared to other databases,
such as Worldscope or Dealscan, which contain information only on large listed companies
(Gopinath and others, 2015).
Our analysis relies on a sample of firms that report basic financial data for 2013 (namely,
total assets and various measures of profits), industrial affiliation,10 and information on the
composition of senior management and the board of the company. The raw dataset, extracted
in July 2015, contains the unconsolidated financial statements of 4.4 million firms across 34
European countries. We focus on firms that report having at least two members in senior
management/board, abstracting from the large number of sole proprietorships.
The reason for this sample selection is twofold. First, we are interested in examining the role
of gender diversity in senior positions, rather than documenting differences in male versus
female entrepreneurs. Economic theory provides some clear channels through which gender
diversity in senior positions may benefit firms, which do not extend to single-manager firms.
Second, there is a large variation in the prevalence of “one-manager” firms across European
countries, from close to 80 percent of firms in Romania, to one percent of firms in Finland.
By focusing on firms where the board/senior management comprises at least two people, we
can ensure a more homogeneous sample across countries.
To measure female representation, we calculate the share of total members of senior
management or the company board who are women.11 Following the corporate finance
literature, our preferred indicator of firm financial performance is return on assets, which we
measure in three different ways: net income over total assets; profits before taxes over total
assets; and earnings before interest and taxes (EBIT) over total assets.12 To avoid distortions
from extreme outliers, the top and bottom five percent of values of our firm performance
10
We use the primary industrial affiliation report by the firm to classify companies into industries.
11 For the purposes of this study, we do not distinguish between the seniority of the positions held. Accounting
for the number of positions that the various members of the board/senior management hold does not change our
findings.
12 Given their focus on publicly listed firms, previous studies have examined the effect of gender diversity on
firm value and Tobin’s q.
10
variables are excluded.13 Data cleaning, missing variables, and selection of firms with at least
two members in management/board reduce the sample to about 2 million firms.
It is important to note the significant differences in the rate of attrition of firms due to
missing data across countries. For example, a very small share of firms in Austria,
Netherlands, Germany, and the United Kingdom (5–11 percent) report profits. Firms in
Ukraine, on the other hand, often do not report the gender of their board members. Our main
findings are robust to the exclusion of any one country from the analysis.
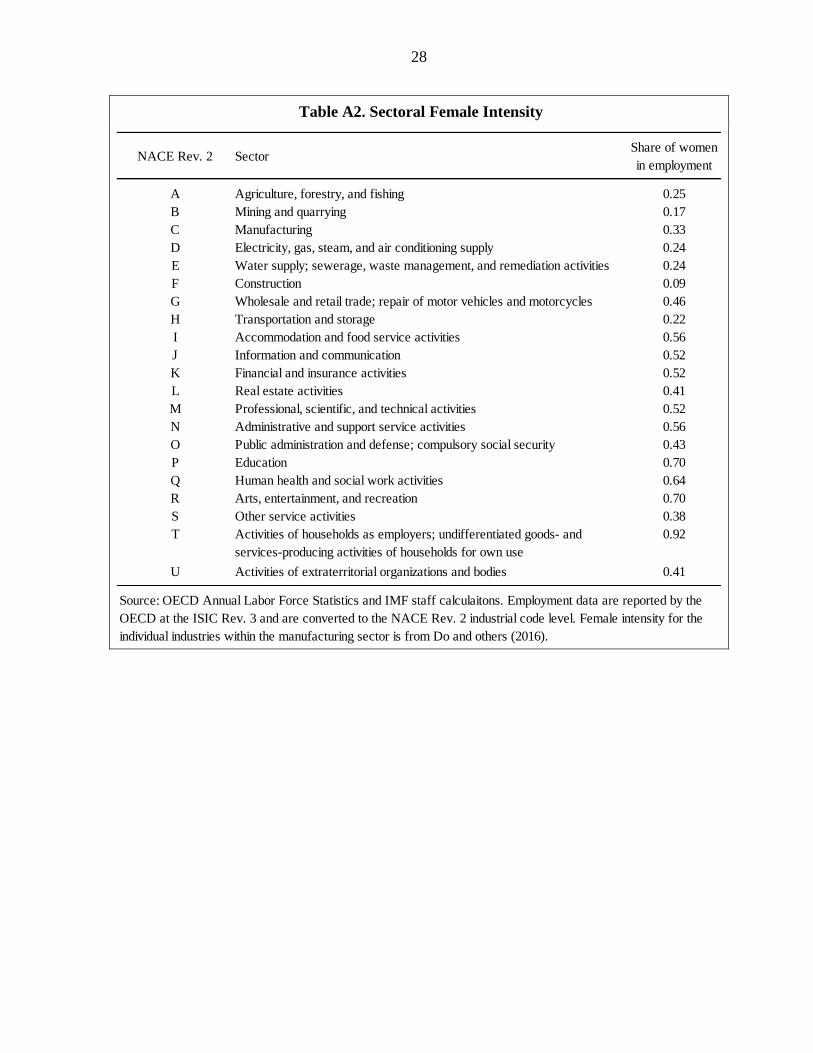
We complement the Orbis dataset with a measure of the female intensity in various sectors.
We rely on Do and others (2016), who calculate the share of female workers in total
employment across 61 distinct ISIC Rev. 3 manufacturing sectors using UNIDO Industrial
Statistics Database averaged over all countries and years for which such data are available.
We use OECD annual labor force employment statistics to construct female intensity of the
remaining non-manufacturing sectors (Appendix Table A2).
Finally, we use Eurostat’s taxonomy of high- and medium-technology manufacturing sectors
and knowledge intensive services at the NACE 3-digit level (Appendix Table A3). Eurostat
classifies manufacturing industries according to their technology intensity (based on the ratio
of R&D expenditures to value added) and services according to their degree of knowledge
intensity (based on the share of people with tertiary education in the activity).
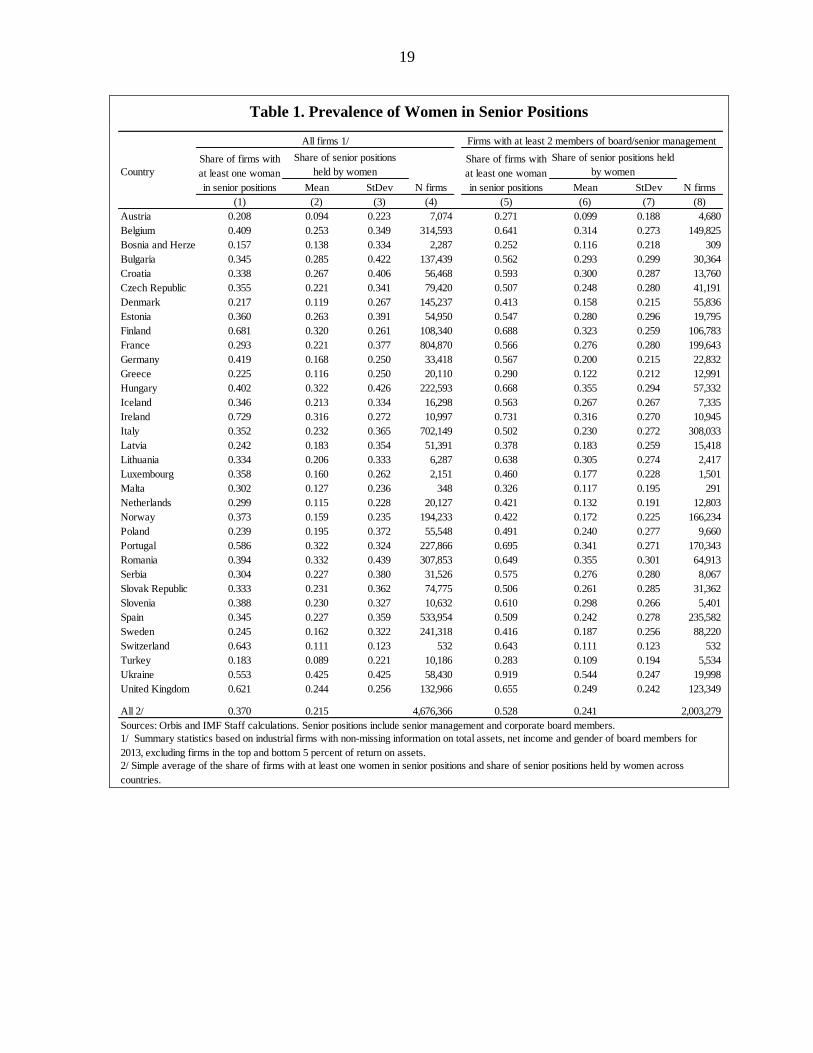
IV. STYLIZED FACTS: PREVALENCE OF WOMEN IN SENIOR POSITIONS
Serving in senior management and/or being a corporate board member in a European firm
remains predominantly a male phenomenon. Table 1 presents the average prevalence of
women in managerial positions across European countries in 2013. It lists values both for the
full set of firms (columns 1–4) and for the sample used in our study (columns 5–8)—that is,
companies that have at least two members on their board of directors. Indeed, even though
women accounted for 46 percent of the labor force in Europe in 2013, less than a quarter of
senior positions were held by women. Nonetheless, this representation in senior positions in
the broader corporate sector is larger than in top European publicly listed firms. According to
Eurostat, in 2015, the share of female executives and female board members was,
respectively, 14 and 19 percent in the 620 largest listed companies—substantially less than
what we find in the Orbis data.
There are wide differences across countries in representation of women in managerial
positions and corporate boards. For example, in the Austrian firms in our sample, less than 10
percent of the managerial positions are held by women. In Ukraine, on the other hand,
women hold 40–50 percent of such positions.
Various hypotheses have been offered for the underrepresentation of women in leadership
positions in the corporate world as well as in politics: from demand-side constraints, such as
preexisting social norms and gender stereotypes that create a glass ceiling for women, to
13
Our results are robust to excluding firms in the top and bottom 1 and 2 percentiles with respect to the return
on assets, and to winsorizing, rather than dropping, extreme values.
11
supply-side explanations, such as women’s shorter work hours. Preexisting social norms and
gender stereotypes may serve to bias bosses and shareholders against appointing women as
managers and leaders (Huddy and Terkildsen, 1993; Eagly and Karau, 2002). Lack of
exposure to female leaders, in turn, may perpetuate biased perceptions of women’s
effectiveness in leadership roles (Beaman and others, 2009). Women themselves might not
believe in their ability to lead, since they rarely see other women succeed in such positions
(Beaman and others, 2012). They may also leave high-power career tracks to have children
(Bertrand and others, 2010).
While pinning down the exact causes for the underrepresentation of women in senior
positions is beyond the scope of this paper, two stylized facts emerge from our European
sample of firms.
The overall female labor force participation rate is not a good predictor of the
representation of women in senior positions in the broader corporate sector (Figure 1).
For example, whereas Nordic countries stand out in terms of female labor force
participation, they are on par with other advanced European economies in terms of
female presence in senior positions.
However, there is a very strong positive association between the incidence of full-time
employment among working women and the share of women in senior corporate
positions. Countries with higher prevalence of part-time work have substantially lower
share of women in senior management and the board room, lending some support to the
supply-side explanations for the existing gender gaps in senior levels.
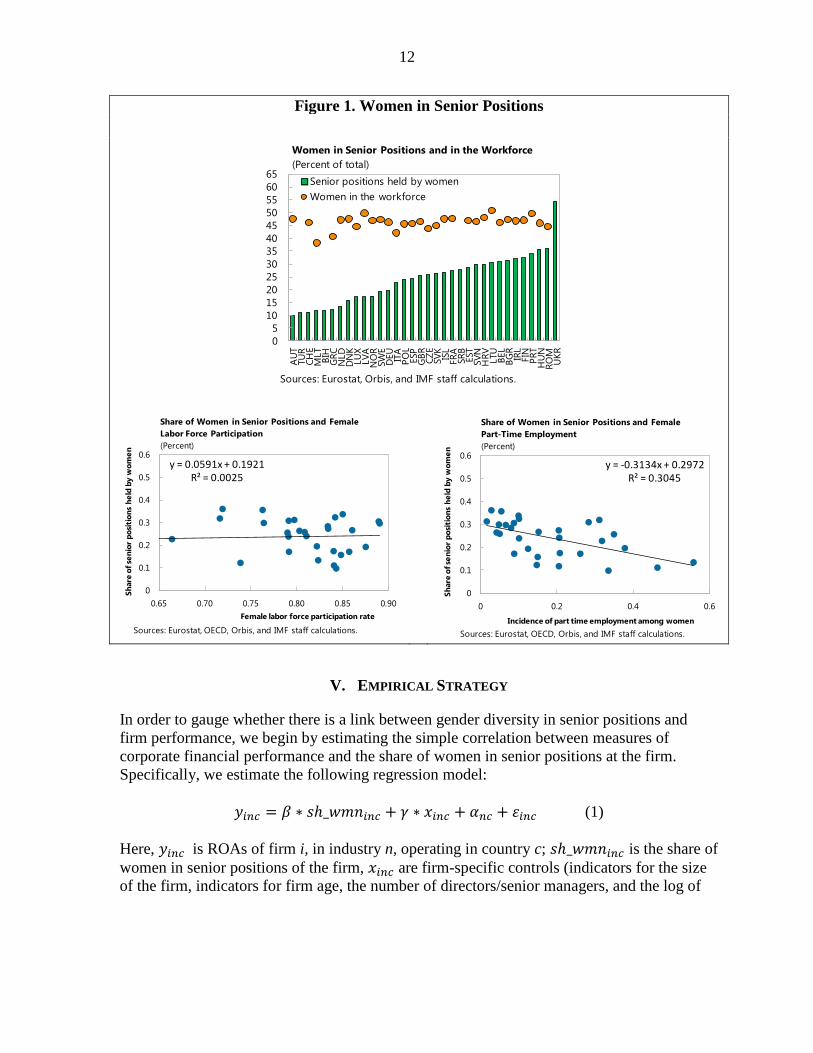
12
Figure 1. Women in Senior Positions
V. EMPIRICAL STRATEGY
In order to gauge whether there is a link between gender diversity in senior positions and
firm performance, we begin by estimating the simple correlation between measures of
corporate financial performance and the share of women in senior positions at the firm.
Specifically, we estimate the following regression model:
(1)
Here, is ROAs of firm i, in industry n, operating in country c; is the share of
women in senior positions of the firm, are firm-specific controls (indicators for the size
of the firm, indicators for firm age, the number of directors/senior managers, and the log of
0
5
10
15
20
25
30
35
40
45
50
55
60
65
AU
TTU
RC
HE
MLT
BIH
GR
CN
LD
DN
KLU
XLV
AN
OR
SW
ED
EU
ITA
PO
LESP
GB
RC
ZE
SV
KIS
LFR
ASR
BEST
SV
NH
RV
LTU
BEL
BG
RIR
LFIN
PR
TH
UN
RO
MU
KR
Senior positions held by women
Women in the workforce
Women in Senior Positions and in the Workforce
(Percent of total)
Sources: Eurostat, Orbis, and IMF staff calculations.
y = 0.0591x + 0.1921R² = 0.0025
0
0.1
0.2
0.3
0.4
0.5
0.6
0.65 0.70 0.75 0.80 0.85 0.90
Sh
are
of
sen
ior
po
siti
on
s h
eld
by w
om
en
Female labor force participation rate
Share of Women in Senior Positions and Female
Labor Force Participation
(Percent)
Sources: Eurostat, OECD, Orbis, and IMF staff calculations.
y = -0.3134x + 0.2972R² = 0.3045
0
0.1
0.2
0.3
0.4
0.5
0.6
0 0.2 0.4 0.6
Sh
are
of
sen
ior
po
siti
on
s h
eld
by w
om
en
Incidence of part time employment among women
Share of Women in Senior Positions and Female
Part-Time Employment
(Percent)
Sources: Eurostat, OECD, Orbis, and IMF staff calculations.
13
tangible assets).14 The regressions include , a full set of roughly 16,000 country-industry
fixed effects, which control for all time-invariant differences of firm performance across
industry-country pairs. Standard errors, are clustered at the industry level.15
Though these very granular fixed effects absorb a significant amount of heterogeneity, a
causal interpretation of the coefficient of interest, is still difficult. The Orbis database does
not provide information on changes in the board or management team over time, which
precludes us from examining how an increase in the prevalence of women correlates with
changes in firm performance. In the cross section, the share of women in management may
be correlated with numerous unobserved characteristics of the firm, which affect its financial
performance. Further, in equilibrium, board composition is jointly determined with firm
performance, making it difficult to distinguish whether greater presence of women improves
firm performance or better performing firms are simply able to attract more women.
To shed light on the potential causal effect of greater female participation in senior positions,
we therefore examine the mechanisms behind the simple correlation. Inspired by the Rajan
and Zingales (1998) approach, we use a simple difference-in-difference strategy. Our
identifying assumption is as follows: if women in senior positions can help improve firm
performance, their impact must be stronger in two different types of industries:
Industries with relative more female labor. The assumption that certain industries employ
primarily women, while others employ primarily men, is standard in theories of gender
and the labor market16 and has been well documented in the data (Do and others, 2016).
Abstracting from the reasons underlying the greater representation of women in certain
sectors, it is reasonable to expect that these sectors may benefit more from gender
diversity in senior positions. Women in leadership positions may be more likely to
support family-friendly changes in corporate policies17 or serve as role models for other
women, thereby raising the productivity of female workers. Women managers may also
be better able to match female workers to tasks in the firms, evidence of which was
recently provided by Flabbi and others (2014) in a sample of Italian firms. Women’s
14
For the remainder of the paper, we use industry and sector interchangeably.
15 Since clustering at the country-industry level results in smaller standard errors, we present the more
conservative clustering at the industry level.
16 See, for example, Galor and Weil (1996); Black and Juhn (2000); Qian (2008); Black and Spitz-Oener
(2010); Rendall (2010), Pitt and others (2012); Alesina and others (2013), Do and others (2016).
17 Empirical evidence on this channel is mixed. For example, Duflo and Chattopadhyay (2004) and Beaman and
others (2009) find that female leaders were more likely to invest in public goods demanded by women.
Bertrand and others (2014) do not find evidence that the rise in women in the boardroom of publicly listed
companies as a consequence of Norway’s quota had significant impacts on the labor market outcomes of other
women.
14
leadership style may also be more effective in female-dominated or female-oriented
settings (Eagly and others, 1995).18
Industries with greater demand for creativity and critical thinking. A sizable literature
has argued that the benefits of workforce diversity depend on sectoral characteristics.19
Garnero and others (2014) provide empirical evidence on the heterogeneous effects of
workforce diversity across sectors in Belgium. Extending the arguments of this literature
to diversity in senior positions, it follows that sectors characterized by complex tasks and
innovative output stand to benefit more from greater diversity—including along gender
lines—to the extent that it increases the set of ideas and potential solutions.
Thus, we estimate the following specification:
(2)
Here, SECn denotes either (i) the female intensity of the sector to which the firm belongs and
(ii) an indicator for whether the sector is a high-technology or knowledge-intensive sector.
The coefficient of interest in this specification is , which captures the extent to which
women in senior positions lead to better financial outcomes in more female-intensive sectors
or in more knowledge-intensive sectors.
VI. RESULTS
A. Establishing correlations: Gender diversity and firm financial performance
Table 2 reports the results from estimating equation (1) for the full set of European firms
with at least two members in senior positions for our three measures of financial performance
(net income, profit before taxes, and EBIT over total assets). Columns (1)–(3) focus on the
sample of firms with at least two people on the senior management/corporate board team. In
columns (4)–(9), we examine the effect for firms with at least 3 or 4 reported senior
positions.
Across all measures and in all samples, higher share of women in the decision-making team
is associated with better financial performance. The estimated coefficients of our gender
diversity measures are positive and significant. The orders of magnitude are best seen in the
lower part of the table, which shows the average ROAs in the sample, the average size of the
senior team, and the average share of women in it (from which one can compute the expected
boost to ROA if a woman were to replace a man in the senior team). The estimated boost to
profitability is relatively small but highly statistically significant. Exchanging just one male
18
Introducing the concept of identity in a model of economic behavior, Akerlof and Kranton (2000) argue that
the utility of a person joining a group (e.g. a firm) increases with the proportion of group members of the same
social category. This would suggest that the benefits of gender diversity would rise with the share of women in
the workforce.
19 Prat (2002) and Jehn and others (1999) examine the role of sectoral characteristics, such as the complexity of
tasks, in shaping optimal labor diversity.
15
member of the senior management team/board for a female member would be associated
with 8–13 basis points higher ROA, or about a 3–8 percent increase in profitability.
Alternatively, bringing gender balance in the senior team, without increasing its size, would
be associated with 7-11 basis points higher ROA.
This pattern is surprisingly robust across firms with varying size of the board/senior
management. The estimated coefficient on the share of women in senior positions is larger
for companies with larger boards. However, the marginal effect of adding one more woman
to the board remains roughly similar across the different samples.
B. Main findings: Uncovering channels
We now examine the potential channels underlying this positive correlation by exploring
heterogeneity across sectors. As mentioned, if gender diversity in senior positions has a
causal effect on firm financial performance, this effect should be stronger in (i) industries
that employ significantly more women in the labor force; and (ii) industries with greater
demand for high creativity and critical thinking.
Indeed, the role of women in senior positions in shaping corporate financial outcomes varies
across different sectors. Table 3 estimates equation (1) for four broad economic sectors:
services, manufacturing, trade, and construction. The positive association between the share
of women and return on assets is significantly stronger for firms in the services sector
(columns 1–3). In this sector, an additional woman in senior positions is associated with a 21
basis points increase in ROA (based on profits). In manufacturing, an additional woman in
senior positions is associated with a 12 basis points increase in ROA, significantly less than
in the services sector. Finally, in the trade and construction sectors, we find no statistically
significant difference in the financial performance of firms based on the share of women in
senior positions.
Table 4, columns (1)–(3), examine the hypothesis that gender diversity would raise firm
performance to a greater extent in sectors where women are more prevalent in the labor
force. By estimating equation (2), we find strong evidence in support of this hypothesis. The
estimated coefficient on the interaction between female intensity in a sector and the share of
women in senior positions is positive and highly statistically significant. For a firm operating
in a sector with female intensity at the 75th
percentile of the distribution (where women
comprise about 52 percent of the workforce), the expected boost to ROA if a man were to be
replaced by a woman in the senior team is estimated to be about 14-18 basis points. In a
sector at the 25th
percentile of the distribution of female intensity (where women comprise
just under a quarter of the labor force), the boost to ROA would be only 0-4 basis points.
These results are very similar to the findings of Flabbi and others (2014), who document a
strong positive effect of the interaction between having a female CEO and the share of
female workers in the firm on firm’s output per worker and TFP in a panel of manufacturing
companies in Italy.
In Table 4, columns (4)–(6), we examine more rigorously the hypothesis that the
technological characteristics of sectors would also shape the impact of gender diversity in
senior positions. We estimate equation (2) with an indicator for high-tech and knowledge-
16
intensive sectors. Indeed, there is strong evidence that representation of women in senior
positions improves financial performance more so among firms in such sectors. An
additional woman in a senior position is associated with a 34–40 higher ROA in a high-
techmanufacturing sector or a knowledge-intensive services industry; while in the remaining
sectors the boost to the ROA is only 0–4 basis points and not statistically distinguishable
from zero.
In Table 5, we run a horse-race between the two competing hypotheses. That is, is it the
prevalence of women in the labor force or the technological characteristics of the sector that
best describes the main channel through which gender diversity in senior positions may
impact firm performance? In equilibrium, it is difficult to distinguish empirically between the
two hypotheses as sectors that benefit from gender diversity because of their technological
characteristics already have a higher prevalence of women in the labor force (Garnero and
Rycx, 2014). Table 5 shows that when both hypotheses are accounted for in the regression,
the female intensity of the sector becomes statistically insignificant, suggesting that it may be
the nature of technology rather than the gender composition of the workforce that matters.
However, due to the challenges outlined above, this result should be interpreted as suggestive
at most.
The positive association between firm performance and the share of women in senior
positions raises the question: should women hold all senior positions in the corporate world?
In Table 6, we examine this question by including the squared term of the share of women in
senior positions to establish whether there are diminishing returns to the prevalence of
women in senior positions. We find that this is indeed the case—the peak optimal share of
women in senior position is about 60 percent. The square of the share of women in senior
positions has a negative and statistically significant coefficient, both for the main result and
when interacted with a sector’s female intensity or, alternatively, its knowledge-intensity.
C. Robustness
Our findings are robust to various empirical modifications. Results are robust to the treatment
of outliers, they are not driven by firms in a particular country, and they are robust to using
alternative measures of firms’ performance. Table 7 presents some of the robustness checks
when considering the interaction with female intensity, while Table 8 presents these checks
when focusing on the high-tech- / knowledge-intensity of sectors.
Outliers
In our baseline, we exclude the top and bottom five percent of values of firm performance
variables to avoid distortions that might be introduced by extreme values. In Tables 7 and 8,
we present several modifications to this approach. In column (2), we winsorize the top and
bottom five percent of values. In column (3), we exclude the top and bottom two percent of
values, and in column (4), we winsorize at the 2nd
and 98th
percentile of the distribution of
ROA. Across all of these treatments of outliers, the estimated point estimate on the
interaction between the share of women in senior positions and female intensity/knowledge
intensity of sectors remains quite similar in magnitude and statistically significant.
17
Country sample
We examine whether the findings are driven by a particular country. We estimate equation
(2) 34 times, each time dropping one country at time. In columns (5) and (6), we report the
minimum and maximum coefficients we obtain on the interaction between the share of
women in senior positions and the female-/knowledge-intensity of the sector. The estimated
coefficients fall within a very narrow range.
Alternative time period
Greater representation of women may boost firm profitability but at the expense of greater
volatility of profits (if, for example, women are less risk averse as managers than men). By
focusing only on one year of financial data, we are unable to shed much light on this
potential channel. However, as an exercise we examine whether we find a similar correlation
between gender diversity in the senior team (measured in 2013) and firms’ ROAs in 2012,
2011 and 2010 under the assumption that changes in management are infrequent enough in
our large sample so as to minimize the measurement error that results from the mismatch in
years. As illustrated in Tables 7 and 8, column 7, our main findings are very similar if 2012
financial data are used.20
Alternative measure of firm performance
So far the analysis has followed closely the corporate finance literature and focused on the
financial performance of firms as the outcome of interest. However, while data availability is
rather uneven across countries in the Orbis database, it is also possible to construct a measure
of firms’ labor productivity. To maximize the sample of firms, we build the ratio of the total
output to the number of employees/total labor cost.21 Using this alternative measure of firm
performance, we again find a positive and statistically significant coefficient on the
interaction between gender diversity in senior positions and the female-/knowledge-intensity
of a sector (column 8 in Tables 7 and 8).
However, it is important to note that the point estimate of the main effect of gender diversity
is negative.22 While this may appear at odds with the findings on financial performance, it
may simply reflect the different choices made by female managers. For example, using the
introduction of gender quotas in Norway, Matsa and Miller (2013) find that firms affected by
20
Results with financial data from 2010 and 2011, available from the authors upon request, are qualitatively
very similar.
21 Ideally such a measure would be based on the value added rather than total output of firms to account for
differential use of intermediate inputs. However, in a number of European countries, information on value
added is not available. Moreover, firms in some countries are more likely to report number of workers, while in
others, they are more likely to report the wage bill. We construct labor productivity using either the number of
workers or the wage bill for all firms in a country, depending on variable coverage.
22 Flabbi and others (2014) document a similar negative main effect of having a female CEO on firm labor
productivity and TFP in Italian manufacturing firms.
18
the quota undertake fewer workforce reductions than comparison firms, increasing relative
labor costs and employment levels. Similarly, during the Great Recession, Matsa and Miller
(2014) discover that female-led private firms in the United States were significantly less
likely to downsize their workforce. As such, our findings are consistent with the existing
evidence associating female business leadership with increased labor hoarding. However, we
also document that this management style does not come at the expense of lower
profitability.
VII. CONCLUSION
This paper presents new evidence on the link between gender diversity in senior positions
and firm performance in Europe. Using a sample of more than 2 million companies across 34
European countries in 2013, we find a strong positive association between the share of
women in senior positions and firms’ ROAs. Substituting one male for one female person in
senior management or on the corporate board is associated with between 8 and 13 basis
points higher ROAs.
Using a difference-in-difference strategy, we explore the potential channels underlying this
positive correlation. In line with existing theoretical and empirical studies, we find a positive
association between gender diversity in senior positions and financial performance in two
types of sectors: (i) sectors that employ significantly more women in the labor force; and (ii)
industries with greater demand for the higher creativity and critical thinking that diversity in
general may bring, namely high-tech and knowledge intensive sectors. These findings are
robust to various alternative specifications.
Our findings suggest that increased female representation in senior positions could play an
important role in boosting Europe’s potential output. To the extent that higher involvement
by women in senior positions improves firm profitability, it may also help support corporate
investment and productivity, mitigating the slowdown in potential growth. To that end,
leveling the playing field through policies to facilitate women’s full-time attachment to the
labor force (see Christiansen and others, 2016) could help build the pipeline of women for
senior corporate positions, with important macroeconomic implications.
19
Table 1. Prevalence of Women in Senior Positions
Country
Mean StDev Mean StDev
(1) (2) (3) (4) (5) (6) (7) (8)
Austria 0.208 0.094 0.223 7,074 0.271 0.099 0.188 4,680
Belgium 0.409 0.253 0.349 314,593 0.641 0.314 0.273 149,825
Bosnia and Herzegovina 0.157 0.138 0.334 2,287 0.252 0.116 0.218 309
Bulgaria 0.345 0.285 0.422 137,439 0.562 0.293 0.299 30,364
Croatia 0.338 0.267 0.406 56,468 0.593 0.300 0.287 13,760
Czech Republic 0.355 0.221 0.341 79,420 0.507 0.248 0.280 41,191
Denmark 0.217 0.119 0.267 145,237 0.413 0.158 0.215 55,836
Estonia 0.360 0.263 0.391 54,950 0.547 0.280 0.296 19,795
Finland 0.681 0.320 0.261 108,340 0.688 0.323 0.259 106,783
France 0.293 0.221 0.377 804,870 0.566 0.276 0.280 199,643
Germany 0.419 0.168 0.250 33,418 0.567 0.200 0.215 22,832
Greece 0.225 0.116 0.250 20,110 0.290 0.122 0.212 12,991
Hungary 0.402 0.322 0.426 222,593 0.668 0.355 0.294 57,332
Iceland 0.346 0.213 0.334 16,298 0.563 0.267 0.267 7,335
Ireland 0.729 0.316 0.272 10,997 0.731 0.316 0.270 10,945
Italy 0.352 0.232 0.365 702,149 0.502 0.230 0.272 308,033
Latvia 0.242 0.183 0.354 51,391 0.378 0.183 0.259 15,418
Lithuania 0.334 0.206 0.333 6,287 0.638 0.305 0.274 2,417
Luxembourg 0.358 0.160 0.262 2,151 0.460 0.177 0.228 1,501
Malta 0.302 0.127 0.236 348 0.326 0.117 0.195 291
Netherlands 0.299 0.115 0.228 20,127 0.421 0.132 0.191 12,803
Norway 0.373 0.159 0.235 194,233 0.422 0.172 0.225 166,234
Poland 0.239 0.195 0.372 55,548 0.491 0.240 0.277 9,660
Portugal 0.586 0.322 0.324 227,866 0.695 0.341 0.271 170,343
Romania 0.394 0.332 0.439 307,853 0.649 0.355 0.301 64,913
Serbia 0.304 0.227 0.380 31,526 0.575 0.276 0.280 8,067
Slovak Republic 0.333 0.231 0.362 74,775 0.506 0.261 0.285 31,362
Slovenia 0.388 0.230 0.327 10,632 0.610 0.298 0.266 5,401
Spain 0.345 0.227 0.359 533,954 0.509 0.242 0.278 235,582
Sweden 0.245 0.162 0.322 241,318 0.416 0.187 0.256 88,220
Switzerland 0.643 0.111 0.123 532 0.643 0.111 0.123 532
Turkey 0.183 0.089 0.221 10,186 0.283 0.109 0.194 5,534
Ukraine 0.553 0.425 0.425 58,430 0.919 0.544 0.247 19,998
United Kingdom 0.621 0.244 0.256 132,966 0.655 0.249 0.242 123,349
All 2/ 0.370 0.215 4,676,366 0.528 0.241 2,003,279
Sources: Orbis and IMF Staff calculations. Senior positions include senior management and corporate board members.
1/ Summary statistics based on industrial firms with non-missing information on total assets, net income and gender of board members for
2013, excluding firms in the top and bottom 5 percent of return on assets.
2/ Simple average of the share of firms with at least one women in senior positions and share of senior positions held by women across
countries.
Share of firms with
at least one woman
in senior positions N firms
Share of senior positions
held by women
All firms 1/ Firms with at least 2 members of board/senior management
Share of firms with
at least one woman
in senior positions
Share of senior positions held
by women
N firms
Table 2. Share of Women in Senior Positions and Firm Financial Performance
Table 3. Share of Women in Senior Positions and Firm Financial Performance: Sectoral Differences
Sample 1/
ROA based on Net income Profit BT EBIT Net income Profit BT EBIT Net income Profit BT EBIT
(1) (2) (3) (4) (5) (6) (7) (8) (9)
Share of women 0.0041 *** 0.0044 *** 0.0028 *** 0.0082 *** 0.0089 *** 0.0061 *** 0.0116 *** 0.0133 *** 0.0103 ***
in senior positions (0.0009) (0.0011) (0.0010) (0.0010) (0.0011) (0.0012) (0.0012) (0.0014) (0.0013)
Observations 2,003,279 2,000,422 1,992,658 928,133 927,227 925,399 494,870 494,794 493,866
Mean dep. variable 0.016 0.027 0.032 0.015 0.026 0.031 0.016 0.026 0.030
Mean share of women 0.26 0.26 0.26 0.23 0.23 0.24 0.23 0.23 0.23
Mean N senior positions 3.29 3.29 3.29 4.78 4.79 4.79 6.35 6.36 6.35
Increase in ROA (basis points) 12 13 8 17 19 13 19 20 16
Increase in ROA (percent) 7.9 5.0 2.6 11.3 7.2 4.1 12.2 7.9 5.3
1/ Sample includes all firms with at least two, three or four members in senior positions in columns (1)-(3), (4)-(6) and (7)-(9) respectively.
At least 2 people At least 3 people At least 4 people
Note: All regressions include country-industry fixed effects, indicators for firm size, firm age, and control for the log of firm's fixed assets and number of senior positions. Robust standard errors are
clustered at the industry level.
Sample
ROA based on Net income Profit BT EBIT Net income Profit BT EBIT Net income Profit BT EBIT Net income Profit BT EBIT
(1) (2) (3) (4) (5) (6) (7) (8) (9) (7) (8) (9)
Share of women 0.0070 *** 0.0074 *** 0.0062 *** 0.0044 *** 0.0044 *** 0.0036 *** 0.0016 0.0013 0.0010 0.0018 0.0023 -0.0020
in senior positions (0.0017) (0.0020) (0.0018) (0.0012) (0.0014) (0.0014) (0.0010) (0.0010) (0.0011) (0.0018) (0.0020) (0.0015)
Observations 777,462 775,053 771,695 265,520 265,537 264,561 420,615 420,415 418,360 444,105 443,690 442,817
Mean dep. variable (ROA) 0.020 0.033 0.034 0.016 0.028 0.037 0.010 0.021 0.029 0.014 0.024 0.030
Mean share of women 0.28 0.28 0.28 0.23 0.23 0.23 0.28 0.28 0.28 0.23 0.23 0.23
Mean N senior positions 3.50 3.51 3.50 3.56 3.56 3.56 2.97 2.97 2.97 2.97 2.97 2.97
Increase in ROA (basis points) 20 21 18 12 12 10 5 4 3 6 8 -7
Increase in ROA (percent) 9.9 6.4 5.2 7.5 4.4 2.7 5.4 2.2 1.2 4.3 3.3 -2.2
Trade ConstructionManufacturingServices
Note: All regressions include country-industry fixed effects, indicators for firm size, firm age, and control for the log of firm's fixed assets and number of senior positions. Robust standard errors are clustered at the
industry level.
20
21
Table 4. Female Intensity and Knowledge Intensity
Table 5. Female Intensity and Knowledge Intensity: A Horse Race
ROA based on Net income Profit BT EBIT Net income Profit BT EBIT
(1) (2) (3) (4) (5) (6)
Share of women -0.0026 -0.0028 -0.0052 *** 0.0013 0.0011 -0.00041
in senior positions (0.0024) (0.0026) (0.0022) (0.0009) (0.0011) (0.0009)
Share of women * Female intensity 0.0163 *** 0.0174 *** 0.0192 ***
(0.0057) (0.0065) (0.0055)
Share of women * 0.0102 *** 0.0119 *** 0.0115 ***
High tech/knowledge intensity (0.0019) (0.0023) (0.0021)
Observations 2,003,279 2,000,422 1,992,658 2,003,279 2,000,422 1,992,658
Note: All regressions include country-industry fixed effects, indicators for firm size, firm age, and control for the log of firm's fixed assets
and number of senior positions. Robust standard errors are clustered at the industry level.
ROA based on Net income Profit BT EBIT
(1) (2) (3)
Share of women in senior positions -0.00048 -0.00024 -0.0028
(0.0024) (0.0026) (0.0022)
Share of women * Female intensity 0.0049 0.0037 0.0064
(0.0062) (0.0068) (0.0057)
Share of women * High tech/knowledge intensity 0.0094 *** 0.0113 *** 0.0105 ***
(0.0021) (0.0026) (0.0023)
Observations 2,003,279 2,000,422 1,992,658
Note: All regressions include country-industry fixed effects, indicators for firm size, firm age, and
control for the log of firm's fixed assets and number of senior positions. Robust standard errors are
clustered at the industry level.
Table 6. Nonlinearities
Net income Profit BT EBIT Net income Profit BT EBIT Net income Profit BT EBIT
(1) (2) (3) (4) (5) (6) (7) (8) (9)
Share of Women in Senior Positions 0.0081 *** 0.0094 *** 0.0066 *** -0.0038 -0.0048 -0.006 0.004 *** 0.0045 *** 0.0023
(0.0019) (0.0022) (0.0022) (0.0043) (0.0049) (0.0045) (0.0017) (0.0019) (0.0019)
Share of Women in Senior Positions ^ 2 -0.0056 *** -0.007 *** -0.0054 *** 0.00092 0.0021 0.00036 -0.0039 ** -0.0048 *** -0.0038 *
(0.0018) (0.0021) (0.0021) (0.0047) (0.0055) (0.0053) (0.0017) (0.0019) (0.0020)
Share of Women * Female Intensity 0.0308 *** 0.0365 *** 0.0329 ***
(0.0106) (0.0122) (0.0110)
Share of Women ^ 2* Female Intensity -0.0183 * -0.0244 ** -0.0171
(0.0106) (0.0124) (0.0118)
Share of Women * Knowledge Intensity 0.0157 *** 0.0189 *** 0.0169 ***
(0.0037) (0.0044) (0.0042)
Share of Women ^ 2* Knowledge Intensity -0.0075 ** -0.0095 ** -0.0072 *
(0.0038) (0.0043) (0.0042)
Observations 2,003,279 2,000,422 1,992,658 2,003,279 2,000,422 1,992,658 2,003,279 2,000,422 1,992,658
Note: All regressions include country-industry fixed effects, indicators for firm size, firm age, and control for the log of firm's fixed assets and number of senior positions. Robust standard errors are clustered
at the industry level.
22
Table 7. Robustness: Role of Female Intensity
Table 8. Robustness: Role of Knowledge Intensity
Min Max
(1) (2) (3) (4) (5) (6) (7) (8)
Share of women -0.0026 -0.0025 -0.0026 -0.0030 -0.0004 -0.0035 -0.0045 -0.1713 ***
in senior positions (0.0024) (0.0033) (0.0024) (0.0042) (0.0024) (0.0023) (0.0023) (0.0234)
Share of women * Female Intensity 0.0163 *** 0.0261 *** 0.0163 *** 0.0371 *** 0.0130 ** 0.0198 *** 0.0180 *** 0.1979 ***
(0.0057) (0.0086) (0.0057) (0.0120) (0.0060) (0.0057) (0.0054) (0.0561)
Observations 2,003,279 2,110,620 2,002,970 2,110,620 1,803,636 1,767,697 1,893,589 1,279,949
Note: All regressions include country-industry fixed effects, indicators for firm size, firm age, and control for the log of firm's fixed assets and number of senior positions. ROA
based on net income. Robust standard errors are clustered at the industry level.
Labor
productivity
Country SelectionWinsorize at
top and
bottom 2nd
prcntl
Drop Top
and Bottom
2nd prcntl
Winsorize
at top and
bottom 5th
prcntlBaseline
2012
Financial
data
Min Max
(1) (2) (3) (4) (5) (6) (7) (8)
Share of women 0.0013 0.0027 ** 0.0012 0.0040 ** 0.0023 *** 0.0014 0.0002 -0.1089 ***
in senior positions (0.0009) (0.0014) (0.0014) (0.0020) (0.0009) (0.0010) (0.0009) (0.0122)
Share of women * Knowledge Intensity 0.0102 *** 0.0202 *** 0.0196 *** 0.0297 *** 0.0093 *** 0.0115 *** 0.0097 *** 0.0695 ***
(0.0019) (0.0032) (0.0029) (0.0047) (0.0018) (0.0020) (0.0018) (0.0238)
Observations 2,003,279 2,110,620 2,078,719 2,110,620 1,832,936 1,767,697 1,893,589 1,279,949
Note: All regressions include country-industry fixed effects, indicators for firm size, firm age, and control for the log of firm's fixed assets and number of senior positions. Robust
standard errors are clustered at the industry level.
Baseline
Winsorize
at top and
bottom 5th
prcntl
Drop Top
and Bottom
2nd prcntl
Winsorize at
top and
bottom 2nd
prcntl
Country Selection
Labor
productivity
2012
Financial
data
23
24
References
Adams, R., and D. Ferreira, 2009, “Women in the Boardroom and Their Impact on
Governance and Performance,” Journal of Financial Economics, Vol. 94, pp. 291–
309.
Adler, R. 2001, “Women and Profits,” Harvard Business Review, Vol. 79, No. 10, p. 30,
November.
Ahern, K. and A. Dittman, 2012, “The Changing of the Boards: The Impact on Firm
Valuation of Mandated Board Representation,” Quarterly Journal of Economics, Vol.
129 No. 1, pp. 137–197.
Akerlof, G. and R. E. Kranton, 2000, “Economics and Identity,” The Quarterly Journal of
Economics, Vol. 115 No. 3, pp 715–753.
Alesina, A., P. Giuliano, and N. Nunn, 2013, “On the Origins of Gender Roles: Women and
the Plough,” Quarterly Journal of Economics, Vol. 128 No. 2, pp. 469–530.
Black, S. and C. Juhn, 2000, “The Rise of Female Professionals: Women’s Response to
Rising Skill Demand,” American Economic Review, Vol. 90, pp. 450–455.
Black, S. and A. Spitz-Oener, 2010, “Explaining Women's Success: Technological Change
and the Skill Content of Women's Work,” The Review of Economics and Statistics,
Vol. 92 No. 1, pp. 187–194.
Boyd, C. L., L. Epstein, and A. D. Martin, 2010, “Untangling the Causal Effects of Sex on
Judging,” American Journal of Political Science, Vol. 54 No. 2, pp. 389–411.
Campbell, K. and A.V. Vera, 2010, “Female Board Appointments and Firm Valuation: Short
and Long-term Effects,” Journal of Management & Governance, Vol. 14 No. 1, pp
37–59.
Carter, D., B. Simkins and W. Simpson, 2003, “Corporate Governance, Board Diversity, and
Firm Value,” Financial Review, Vol. 38, pp. 33–53.
Castaglione, C., D. Infante and J. Smirnova, 2014, “Do Female Managers Affect
Productivity? Evidence from Italian Manufacturing Firms” unpublished manuscript.
Chattopadhyay, R. and E. Duflo, 2004, “Women as Policy Makers: Evidence from a
Randomized Policy Experiment in India,” Econometrica, Vol. 72 No. 5, pp. 1409–
1443.
Christiansen, L., H. Lin, J. Pereira, P. Topalova, and R. Turk, [2016], “Individual Choice or
Policies? Drivers of Female Employment in Europe,” IMF Working Paper,
forthcoming.
Croson, R. and U. Gneezy, 2009, “Gender Differences in Preferences,” Journal of Economic
Literature, Vol. 47 No. 2, pp. 448–474.
25
Dezso, C. L., and D. G. Ross, 2012, “Does Female Representation in Top Management
Improve Firm Performance? A Panel Data Investigation,” Strategic Management
Journal, Vol. 33, pp. 1072–1089.
Do, Q., A. A. Levchenko, and C. Raddatz, 2016, “Comparative Advantage, International
Trade, and Fertility,” Journal of Development Economics, Vol. 119, pp. 48–66,
March.
Du Rietz, A., M. Henrekson, 2000, “Testing the Female Underperformance Hypothesis,”
Small Business Economics, Vol. 14 No. 1, pp. 1–10.
Eagly, A. H., and S. J. Karau, 2002, “Role Congruity Theory of Prejudice Toward Female
Leaders,” Psychological Review, Vol. 109, No. 3, pp. 573–98.
Eagly, A. H., S. J. Karau, and M. G. Makhijani, 1995, “Gender and the Effectiveness of
Leaders: A Meta-analysis,” Psychological Bulletin, Vol. 117, pp. 125–145.
European Commission, 2012, “Women in Economic Decision-Making in the EU: Progress
Report,” A Europe 2020 initiative (Luxembourg).
Farrell, K., and P. Hersch, 2005, “Additions to Corporate Boards: the Effect of Gender,”
Journal of Corporate Finance, Vol. 11 No. 1–2, pp. 85–106.
Flabbi, Luca, Mario Macis, Andrea Moro and Fabiano Schivardi, 2014, “Do Female
Executives Make a Difference? The Impact of Female Leadership on Gender Gaps
and Firm Performance,” CEPR Discussion Paper No. 10228.
Galor, O. and D. Weil, 1996, “The Gender Gap, Fertility, and Growth,” American Economic
Review, Vol. 86 No. 3, pp. 374–387.
Garnero, A., S. Kampelmann, and F. Rycx, 2014, “The Heterogeneous Effects of Workforce
Diversity on Productivity, Wages, and Profits,” Industrial Relations: A Journal of
Economy and Society, Vol. 53 No. 3, pp. 430–477.
Huang, J. and D. Kisgen, 2013, “Gender and Corporate Finance: Are Male Executives
Overconfident Relative to Female executives?” Journal of Financial Economics, Vol.
108 No. 3, pp. 822–839.
Huddy, L. and N. Terkildsen, 1993, “Gender Stereotypes and the Perception of Male and
Female Candidates,” American Journal of Political Science, Vol. 37, No. 1, pp. 119–
147, February.
Kang, E., D. K. Ding, and C. Charoenwong, 2010, “Investor Reaction to Women Directors,”
Journal of Business Research, Vol. 63, pp. 888–894.
Khan, W.A., and J.P. Vieito, 2013, “CEO Gender and Firm Performance,” Journal of
Economics and Business, Vol. 67, pp. 55–66.
26
Lam, K., P. McGuinness, and V. Joao Paulo, 2013, “CEO Gender, Executive Compensation
and Firm Performance in Chinese-listed Enterprises,” Pacific-Basin Finance Journal,
Vol. 21, pp. 1136–1159.
Matsa, D. A., and A. R. Miller, 2013, "A Female Style in Corporate Leadership? Evidence
from Quotas," American Economic Journal: Applied Economics, Vol. 5 No. 3,
pp. 136–69.
_________, 2014, "Workforce Reductions at Women-Owned Businesses in the United
States," Industrial and Labor Relations Review, Vol. 67 No. 2, pp. 422–52.
McGorman, L., 2013, “Crossing Over to a Male-Dominated Sector: The Effects of Exposure,
Role Models, and Information on Ugandan Female Entrepreneurs’ Industry Choices,”
Outstanding SYPA Award Winners 2013 (Cambridge, Massachussets: John F.
Kennedy School of Government).
McKinsey, 2007, “Women Matter: Gender Diversity, A Corporate Performance Driver,”
McKinsey & Company.
McKinsey, 2009, “Women Matter 3: Women Leaders, a Competitive Edge in and After the
Crisis. Results of a Global Survey of Almost 800 Business Leaders,” McKinsey &
Company.
Pitt, M. M., M. R. Rosenzweig, and M. N. Hassan, 2012, “Human Capital Investment and the
Gender Division of Labor in a Brawn-Based Economy,” American Economic Review,
Vol. 102, No. 7, pp. 3531–3560, December.
Rajan, R. G. and L. Zingales, 1998, “Financial Dependence and Growth,” American
Economic Review, Vol. 88, pp. 559–586.
Rendall, M., 2010, “Brain versus Brawn: The Realization of Women’s Comparative
Advantage,” Institute for Empirical Research in Economics, University of Zurich,
Working Paper Series, Working Paper No. 491, September.
Rhode, D., and A. Packel, 2014, “Diversity on Corporate Boards: How Much Difference
Does Difference Make?” Delaware Journal of Corporate Law, Vol. 39, pp. 377–426.
Smith, N., V. Smith, and M. Verner, 2005, “Do Women in Top Management affect Firm
Performance? A Panel study of 2500 Danish Firms,” Discussion Paper August (Bonn:
Institute for the Study of Labor).
Schwartz-Ziv, M., 2013, “Does the Gender of the Directors Matter?” Working Paper No. 8,
Edmond J. Safra Center for Ethics Working Paper Series, Harvard.
Terjesen, S., B. Couto, and P. M. Francisco, 2015, “Does the Presence of Independent and
Female Directors Impact Firm Performance? A Multi-Country Study of Board
Diversity,” Journal of Management & Governance, DOI:10.1007/s10997-014-9307-
8, pp. 1–37.
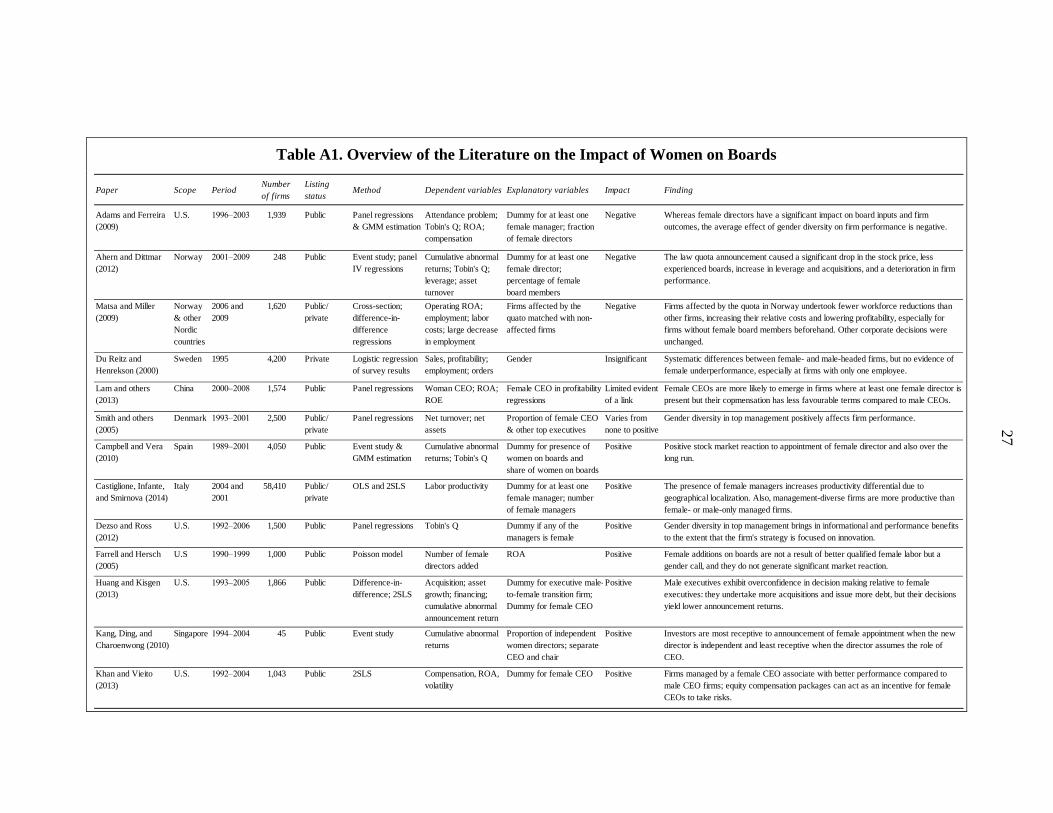
Table A1. Overview of the Literature on the Impact of Women on Boards
Paper Scope PeriodNumber
of firms
Listing
statusMethod Dependent variables Explanatory variables Impact Finding
Adams and Ferreira
(2009)
U.S. 1996–2003 1,939 Public Panel regressions
& GMM estimation
Attendance problem;
Tobin's Q; ROA;
compensation
Dummy for at least one
female manager; fraction
of female directors
Negative Whereas female directors have a significant impact on board inputs and firm
outcomes, the average effect of gender diversity on firm performance is negative.
Ahern and Dittmar
(2012)
Norway 2001–2009 248 Public Event study; panel
IV regressions
Cumulative abnormal
returns; Tobin's Q;
leverage; asset
turnover
Dummy for at least one
female director;
percentage of female
board members
Negative The law quota announcement caused a significant drop in the stock price, less
experienced boards, increase in leverage and acquisitions, and a deterioration in firm
performance.
Matsa and Miller
(2009)
Norway
& other
Nordic
countries
2006 and
2009
1,620 Public/
private
Cross-section;
difference-in-
difference
regressions
Operating ROA;
employment; labor
costs; large decrease
in employment
Firms affected by the
quato matched with non-
affected firms
Negative Firms affected by the quota in Norway undertook fewer workforce reductions than
other firms, increasing their relative costs and lowering profitability, especially for
firms without female board members beforehand. Other corporate decisions were
unchanged.
Du Reitz and
Henrekson (2000)
Sweden 1995 4,200 Private Logistic regression
of survey results
Sales, profitability;
employment; orders
Gender Insignificant Systematic differences between female- and male-headed firms, but no evidence of
female underperformance, especially at firms with only one employee.
Lam and others
(2013)
China 2000–2008 1,574 Public Panel regressions Woman CEO; ROA;
ROE
Female CEO in profitability
regressions
Limited evident
of a link
Female CEOs are more likely to emerge in firms where at least one female director is
present but their copmensation has less favourable terms compared to male CEOs.
Smith and others
(2005)
Denmark 1993–2001 2,500 Public/
private
Panel regressions Net turnover; net
assets
Proportion of female CEO
& other top executives
Varies from
none to positive
Gender diversity in top management positively affects firm performance.
Campbell and Vera
(2010)
Spain 1989–2001 4,050 Public Event study &
GMM estimation
Cumulative abnormal
returns; Tobin's Q
Dummy for presence of
women on boards and
share of women on boards
Positive Positive stock market reaction to appointment of female director and also over the
long run.
Castiglione, Infante,
and Smirnova (2014)
Italy 2004 and
2001
58,410 Public/
private
OLS and 2SLS Labor productivity Dummy for at least one
female manager; number
of female managers
Positive The presence of female managers increases productivity differential due to
geographical localization. Also, management-diverse firms are more productive than
female- or male-only managed firms.
Dezso and Ross
(2012)
U.S. 1992–2006 1,500 Public Panel regressions Tobin's Q Dummy if any of the
managers is female
Positive Gender diversity in top management brings in informational and performance benefits
to the extent that the firm's strategy is focused on innovation.
Farrell and Hersch
(2005)
U.S 1990–1999 1,000 Public Poisson model Number of female
directors added
ROA Positive Female additions on boards are not a result of better qualified female labor but a
gender call, and they do not generate significant market reaction.
Huang and Kisgen
(2013)
U.S. 1993–2005 1,866 Public Difference-in-
difference; 2SLS
Acquisition; asset
growth; financing;
cumulative abnormal
announcement return
Dummy for executive male-
to-female transition firm;
Dummy for female CEO
Positive Male executives exhibit overconfidence in decision making relative to female
executives: they undertake more acquisitions and issue more debt, but their decisions
yield lower announcement returns.
Kang, Ding, and
Charoenwong (2010)
Singapore 1994–2004 45 Public Event study Cumulative abnormal
returns
Proportion of independent
women directors; separate
CEO and chair
Positive Investors are most receptive to announcement of female appointment when the new
director is independent and least receptive when the director assumes the role of
CEO.
Khan and Vieito
(2013)
U.S. 1992–2004 1,043 Public 2SLS Compensation, ROA,
volatility
Dummy for female CEO Positive Firms managed by a female CEO associate with better performance compared to
male CEO firms; equity compensation packages can act as an incentive for female
CEOs to take risks.
27
28
Table A2. Sectoral Female Intensity
NACE Rev. 2 SectorShare of women
in employment
A Agriculture, forestry, and fishing 0.25
B Mining and quarrying 0.17
C Manufacturing 0.33
D Electricity, gas, steam, and air conditioning supply 0.24
E Water supply; sewerage, waste management, and remediation activities 0.24
F Construction 0.09
G Wholesale and retail trade; repair of motor vehicles and motorcycles 0.46
H Transportation and storage 0.22
I Accommodation and food service activities 0.56
J Information and communication 0.52
K Financial and insurance activities 0.52
L Real estate activities 0.41
M Professional, scientific, and technical activities 0.52
N Administrative and support service activities 0.56
O Public administration and defense; compulsory social security 0.43
P Education 0.70
Q Human health and social work activities 0.64
R Arts, entertainment, and recreation 0.70
S Other service activities 0.38
T Activities of households as employers; undifferentiated goods- and
services-producing activities of households for own use
0.92
U Activities of extraterritorial organizations and bodies 0.41
Source: OECD Annual Labor Force Statistics and IMF staff calculaitons. Employment data are reported by the
OECD at the ISIC Rev. 3 and are converted to the NACE Rev. 2 industrial code level. Female intensity for the
individual industries within the manufacturing sector is from Do and others (2016).
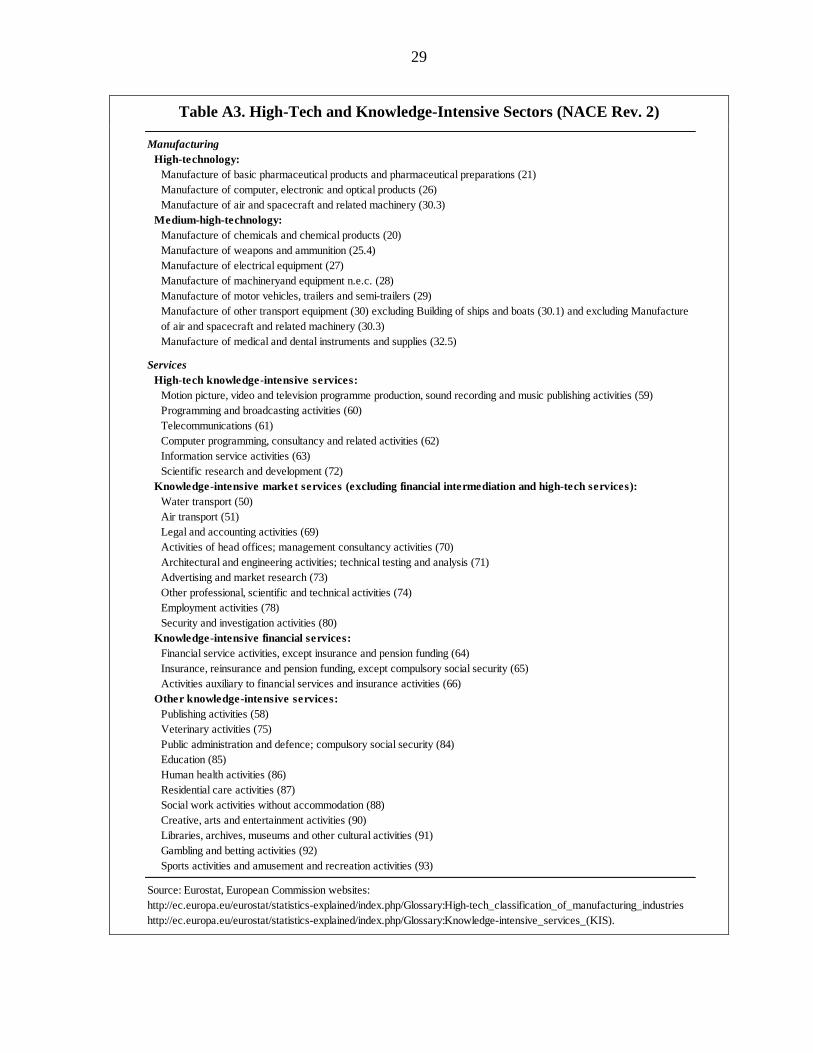
29
Table A3. High-Tech and Knowledge-Intensive Sectors (NACE Rev. 2)
Manufacturing
High-technology:
Manufacture of basic pharmaceutical products and pharmaceutical preparations (21)
Manufacture of computer, electronic and optical products (26)
Manufacture of air and spacecraft and related machinery (30.3)
Medium-high-technology:
Manufacture of chemicals and chemical products (20)
Manufacture of weapons and ammunition (25.4)
Manufacture of electrical equipment (27)
Manufacture of machineryand equipment n.e.c. (28)
Manufacture of motor vehicles, trailers and semi-trailers (29)
Manufacture of other transport equipment (30) excluding Building of ships and boats (30.1) and excluding Manufacture
of air and spacecraft and related machinery (30.3)
Manufacture of medical and dental instruments and supplies (32.5)
Services
High-tech knowledge-intensive services:
Motion picture, video and television programme production, sound recording and music publishing activities (59)
Programming and broadcasting activities (60)
Telecommunications (61)
Computer programming, consultancy and related activities (62)
Information service activities (63)
Scientific research and development (72)
Knowledge-intensive market services (excluding financial intermediation and high-tech services):
Water transport (50)
Air transport (51)
Legal and accounting activities (69)
Activities of head offices; management consultancy activities (70)
Architectural and engineering activities; technical testing and analysis (71)
Advertising and market research (73)
Other professional, scientific and technical activities (74)
Employment activities (78)
Security and investigation activities (80)
Knowledge-intensive financial services:
Financial service activities, except insurance and pension funding (64)
Insurance, reinsurance and pension funding, except compulsory social security (65)
Activities auxiliary to financial services and insurance activities (66)
Other knowledge-intensive services:
Publishing activities (58)
Veterinary activities (75)
Public administration and defence; compulsory social security (84)
Education (85)
Human health activities (86)
Residential care activities (87)
Social work activities without accommodation (88)
Creative, arts and entertainment activities (90)
Libraries, archives, museums and other cultural activities (91)
Gambling and betting activities (92)
Sports activities and amusement and recreation activities (93)
Source: Eurostat, European Commission websites:
http://ec.europa.eu/eurostat/statistics-explained/index.php/Glossary:High-tech_classification_of_manufacturing_industries
http://ec.europa.eu/eurostat/statistics-explained/index.php/Glossary:Knowledge-intensive_services_(KIS).