Gender and size diversity in Top Management Team: … Gomes... · 1 1. Introduction Top Management...
71
Dissertation Master’s in International Business Gender and size diversity in Top Management Team: Evidence from Portugal Joana Gomes Pedro Leiria, September 2016
-
Upload
truongngoc -
Category
Documents
-
view
212 -
download
0
Transcript of Gender and size diversity in Top Management Team: … Gomes... · 1 1. Introduction Top Management...

Dissertation
Master’s in International Business
Gender and size diversity in Top Management Team:
Evidence from Portugal
Joana Gomes Pedro
Leiria, September 2016

This page was intetionally left blank

Dissertation
Master’s in International Business
Gender and size diversity in Top Management Team:
Evidence from Portugal
Joana Gomes Pedro
This dissertation was developed under the supervision of Doctor Tânia Marques, professor at the School of Technology and Management of the Polytechnic Institute of Leiria.
Leiria, September 2016

ii
This page was intetionally left blank

iii
Resumo
Nos últimos anos a equipa de gestão de topo das empresas (TMT – Top Management
Team) tem sido bastante estudada e abordada por vários investigadores (Campbell &
Mínguez-Vera, 2008; Erhardt et al., 2003; Haleblian & Finkelstein, 1993; Amason &
Spienza; 1997). Desta forma, este tema tem sofrido uma grande evolução assim como
progressivamente se tem diversificado. Combinado com a Upper Echelons Theory é
estabelecida uma nova dimensão da diversidade da equipa de gestão de topo que aborda,
por exemplo, a diversidade de género e a dimensão da equipa de gestão de topo. Já existem
vários países que têm criado leis e requisitos normativos de modo a aumentar a presença de
mulheres no meio empresarial como é o caso da Noruega, Espanha, França, Holanda e
Itália. No entanto, o género feminino está longe da igualdade em termos de
representatividade (Torchia et al., 2011), mas é notável a evolução de ano para ano.
Também é percetível que a dimensão das equipas de gestão de topo também tem
aumentado, o que pode proporcionar vantagens para a empresa (Heleblian & Finkelstein,
1993). No decorrer deste trabalho é estudada a relação do género feminino e do tamanho
da equipa de gestão de topo com a rentabilidade (ROA – Return On Assets) das 41
empresas portuguesas cotadas na bolsa da Euronext Lisbon, entre 2011 - 2015.
Inicialmente, é aplicado o teste de Spearman para verificar as correlações entre as variáveis
em estudo. É também elaborada uma regressão linear que relaciona o número de mulheres
(variável independente) com o ROA (variável dependente). O teste de Mann-Whitney tem
como objetivo verificar o comportamento do ROA entre empresas sem mulheres nos TMT
e as empresas com mulheres no TMT. Após a análise, os resultados demostram que existe
uma relação positiva entre o número de mulheres com o ROA. Assim como, as empresas
que têem mulheres nos TMT têm melhor performance quando comparado com empresas
sem mulheres na equipa de gestão de topo. Relativamente à dimensão da equipa esta
também influencia positivamente a rentabilidade económica, de uma forma significativa.
Palavras-chave: equipa de gestão de topo; género; dimensão da equipa de
gestão de topo; rentabilidade, ROA.

iv
This page was intetionally left blank

v
Abstract
In recent years the Top Management Team (TMT) in the companies has been
extensively studied and discussed by many researchers (Campbell & Mínguez-Vera, 2008;
Erhardt et al, 2003; Haleblian & Finkelstein, 1993; Amason & Spienza, 1997). Thus, this
theme has undergone a major evolution as well as it has been diversified progressively.
Combined with the Upper Echelons Theory, it was established a new dimension of
diversity of the Top Management Team that addresses, for example, the diversity of gender
and the size of the team. There are several countries that have established laws and
regulatory requirements in order to increase the presence of women in the business
environment such as Norway, Spain, France, Holland and Italy. However, the female
gender is far from equal in terms of representativeness (Torchia et al., 2011), but there are
noteworthy developments yearly. It is also noticeable that the size of Top Management
Teams has also increased, which can provide advantages for the company (Heleblian &
Finkelstein, 1993). In the course of this dissertation it was studied the female gender ratio
and the size of the Top Management Team with the profitability (ROA – Return On
Assets) of 41 Portuguese companies listed on the Euronext Lisbon between 2011 - 2015.
Initially, the Spearman test was applied in order to verify the correlations between the
variables in study. It was created a linear regression that relates the number of women
(independent variable) and ROA (dependent variable). The Mann-Whitney test was used to
verify the ROA behaviour between companies with no women in TMT and companies
with women in TMT. After analysis, the results demonstrated that there was a positive
relationship between the number of women with ROA. Also companies that have women
in TMT have better performance compared to companies with no women in the Top
Management Team. As far as the size of the team is concerned, it positively influences the
economic profitability, in a meaningful way.
Keywords: Top Management Team; gender; size of TMT; profitability, ROA

vi
This page was intetionally left blank

vii
List of figures
Figure 1 – Example of sample of SABI .................................................................. 17
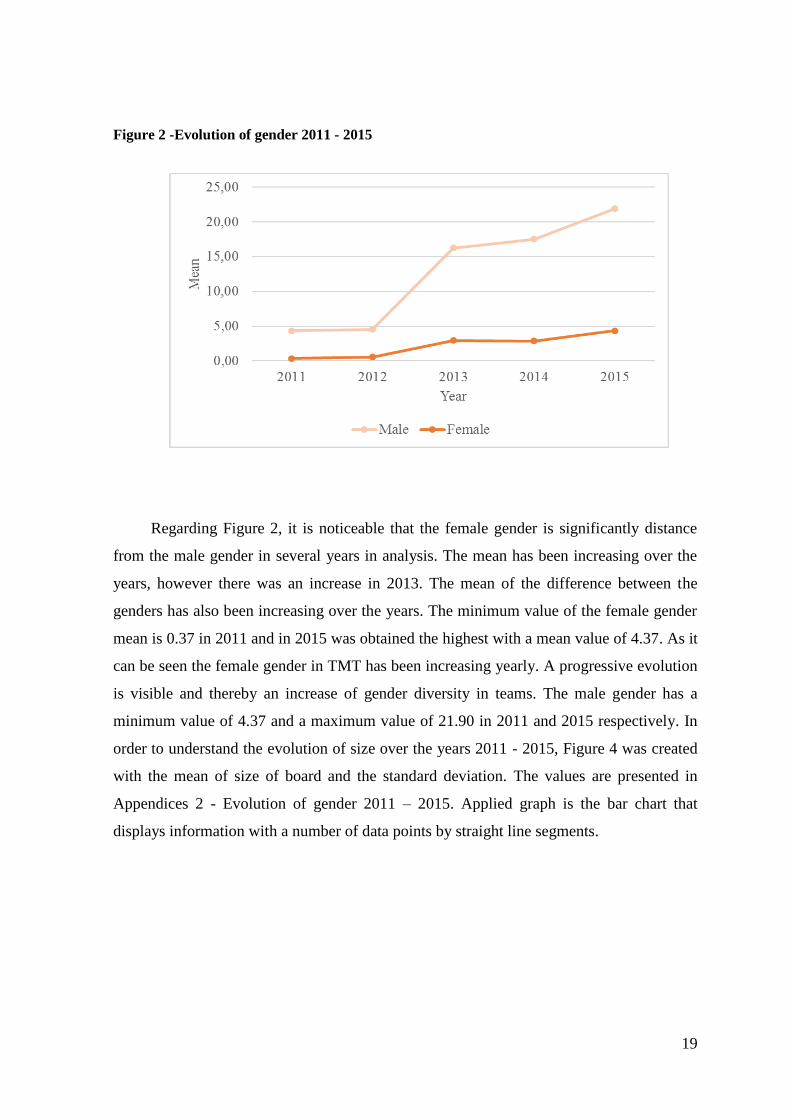
Figure 2 -Evolution of gender 2011 - 2015 ............................................................. 19
Figure 3 - Board size evolution 2011 – 2015 .......................................................... 20
Figure 4 - Variation of gender in TMT 2011 - 2015 .............................................. 21
Figure 5 - Variation of size board in TMT 2011 – 2015 ....................................... 21
Figure 6 – Linear Regression .................................................................................. 28

viii
This page was intetionally left blank

ix
List of tables
Table 1 - Women in TMT: European landscape ..................................................... 8
Table 2 - Average proportion of female directors in boards by country (2014,
%) .......................................................................................................................................... 9
Table 3 - Composition of boards of directors sample ........................................... 18
Table 4 - Comprehensive information of sample in analysis ............................... 22
Table 5 - Kolmogorov-Smirnov .............................................................................. 25
Table 6 - Correlations of Spearman - gender ........................................................ 26
Table 7 – Coefficients of Linear Regression .......................................................... 27
Table 8 – Model Summary and Parameter Estimates .......................................... 27
Table 9 - Women in TMT Versus No Women in TMT ........................................ 29
Table 10 - Correlations of Spearman – size of the team ....................................... 30

x
This page was intetionally left blank

xi
List of acronyms
BSI – Board Service Involvement
CEO – Chief Executive Officer
MR – Mean Rank
ROA – Return On Assets
ROAA – Return On Average Assets
SABI - Sistema de Análise de Balanços Ibéricos
TMT – Top Management Team
U.S. – United States

xii
This page was intetionally left blank

xiii
Table of Contents
RESUMO III
ABSTRACT V
LIST OF FIGURES VII
LIST OF TABLES IX
LIST OF ACRONYMS XI
TABLE OF CONTENTS XIII
1. INTRODUCTION 1
2. LITERATURE REVIEW 4
2.1. Top Management Team (TMT) 4
2.1.1. Gender 7
2.1.2. Size board 10
2.2. TMT gender diversity versus firm performance 11
2.3. TMT Size versus firm performance 14
3. DATA AND METHODOLOGY 17
3.1. Dataset 17
3.2. Variables Description 23
3.3. Methodology 24
4. RESULTS 25

xiv
4.1. The Kolmogorov-Smirnov test 25
4.2. Spearman correlation and linear regression - gender 26
4.3. Mann-Whitney test - gender 29
4.4. Spearman correlation – size of the team 30
5. DISCUSSION 31
6. MAIN CONCLUSIONS 33
REFERENCES 34
APPENDICES 49


1
1. Introduction
Top Management Team (TMT) has been studied by several researchers (e.g.
Campbell & Mínguez-Vera, 2008; Erhardt et al., 2003; Haleblian & Finkelstein, 1993;
Amason & Spienza; 1997). Hambrick and Mason (1984) have studied the senior
management features of a particular organization, the upper echelons, that can influence
the decisions and practices adopted by an organization. Hambrick and Mason (1984) in the
upper echelon theory have shown that top manager’s characteristics influence the decisions
and the actions adopted and implemented by the managers. There are two characteristics
that are well discussed in the recent TMT literature: diversity and size of TMT (Daily &
Cooper, 1997; Birley & Stockley, 2000). The trend has led women into occupying top
careers; however, the vast majority of the meeting rooms are still made by male directors
(Torchia et al., 2011). Researchers and country leaders are increasingly concerned with this
topic, which leads countries and politicians to establish laws and regulatory requirements
in order to increase the presence of women on the boards of listed companies (Alvarado,
Fuentes & Laffarga, 2015). There are countries in the European community, including
Norway, Spain, France, Holland, and Italy that have legislation requiring that 40% of a
company's directors are women (Rose, 2007; Adams & Ferreira, 2009). Campbell and
Mínguez-Vera (2008) showed that diversity gender has a positive relationship with
economic performance, concluding that the gender composition of the management team
can affect the quality of the company's financial performance. Economic performance is
analysed through Tobin’s Q (Q). This measurement is defined as the sum of the market
value stock and the value of debt divided by the value of total assets. Campbell and
Mínguez-Vera (2008) demonstrated that the presence of women has a positive effect on the
company's value and that the opposite causal relationship is not significant. They also
claim that greater gender diversity can generate financial advantages. Alvarado, Fuentes
and Laffarga (2015) also demonstrated the positive relationship of the female gender with
firm performance (Tobin’s Q (Q)). Cable & Gimeno Nieto (2012) state that the diversity of
gender in management, doesn’t come only from an ethical point of view. This area
provides clear benefits for improved cooperative governance.
Nielsen and Nielsen (2012) studied the relationship between Top Management Team
diversity and firm performance, focusing, on TMT tenure and nationality of TMT.

2
Alvarado Fuentes and Laffarga (2015) studied the board gender diversity in Spain.
Researchers concluded that, with a sample of 125 companies listed on the Madrid stock
exchange, increasing the number of women in Top Management Teams is positively
related to improved business performance, i.e., economic gains. It has reinforced the idea
that the diversity of gender in the TMT must be increased, mandatory laws being a key
factor in doing so. Based on the literature, it is noticeable that the presence of the female
gender in higher positions clearly affects their economic and organizational performance
(Krishnan & Park, 2005; Ren & Wang, 2011).
There are also studies that relate the board size and its influence in the firm
performance (Knockaert, Bjornali & Erikson, 2015). Knockaert, Bjornali and Erikson
(2015) with a sample of 117 high-tech Norwegian companies showed that diversity in the
TMT affects positively the Board Service Involvement (BSI). Haleblian and Finkelstein
(1993) showed in their study of 47 organizations taken from the Ward's Directory of
50,000 Largest U.S. Corporations, that companies with larger Top Management Teams
had better performance (return on assets, return on sales and return on equity), rather than
the companies with smaller TMT which had worse performance levels. Hellman and Puri
(2002), claim that the larger the team, the more resources available which are oriented
towards growth and business development. However, Amason and Spienza (1997) showed
in their study of 48 Top Management Teams from U.S., that the size and openness of TMT
were positively related to cognitive conflict. The size of the team was also associated with
higher affective conflicts, when teams had high levels of reciprocity, greater openness led
to less affective conflict. The cognitive conflict is task oriented arising from differences on
perspective. Regarding the emotional conflict that is oriented to individuals due to personal
dissatisfaction.
Progress has been significant but the difference between the gender male and female
is still visible. In Portugal, there are few or no studies on the diversity of TMT and its
influence on profitability, with greater focus on gender diversity and the size of the team in
order to understand the relationship of these variables with financial performance. In this
article we analyse two characteristics of TMT and their relationship with the performance
of the Portuguese listed companies. In the present investigation it was analysed the way
that the number of women in TMT interact with the company performance, in order to
understand if the ratio is positive or negative, i.e., understand as one variable increases the
other increases/decreases. It was also analysed the size of the team with the firm

3
performance, in order to understand the interaction on variables, such as the gender. The
data was correlated in order to understand how the variables under study interact, for that
Spearman test was applied. Thereafter, a linear regression was created relating the number
of women in Top Management Team (independent variable) with their performance - ROA
(dependent variable). Mann-Whitney test was also applied where the main objective is to
verify the ROA behaviour between companies with women in TMT and companies
without women in TMT. After the analysis of the data some results are presented. Results
show that there is a significantly positive relationship between the presence of women and
the economic performance of the company (ROA). Results also show that companies that
have women in their Top Management Teams have better performance compared to
companies with no women in Top Management Teams. Also, the size of the team
positively influences the economic profitability.
The main objective of this article is to provide evidence concerning the relationship
between the attributes of TMT boards, specifically the relationship between female gender
and also the size of the board with the financial performance. In this study we used 41
Portuguese companies that are listed on the Euronext Lisbon Stock Exchange in the period
2011-2015.
This study follows the following structure. Initially, it is reviewed the literature on
the topic. The literature review is divided in three sections: dealing with the Top
Management Team in a more theoretical perspective; then it is presented the TMT gender
diversity versus firm performance literature, which relates these two themes, and after that,
it is reviewed the TMT board size versus performance firm literature. The second chapter
is dedicated to the data and methodology, which presents the dataset, variables and the
methodology used to test the hypotheses proposed. After the data and methodology, the
results are presented followed by the analysis and discussion. Finally, some limitations and
future research avenues are presented.

4
2. Literature Review
Top Management Team (TMT) is considered to be one of the most important
resource for business (Yuan-qiong, Wen & Yun, 2009). “In the last several decades, we
have witnessed a huge evolution around this issue with several studies appearing”
(Erhardt et al. 2003; Campbell & Mínguez-Vera, 2008; Alvarado, Fuentes, Laffarga, 2015;
Haleblian & Finkelstein, 1993; Amason & Spienza; 1997). However, the performance
implications of Top Management Team diversity are not well defined (Park & Lee, 2008;
Nielsen & Nielsen, 2012). Like other concepts, the relationship between Top Management
Team (TMT) diversity and firm performance is widely discussed (e.g. Cannella, Park, &
Lee; 2008; Carpenter; 2002; Boond & Hendriks, 2009; Dwyer, Richard, & Chadwick;
2003).
2.1. Top Management Team (TMT)
According to the study of Pegels, Song and Yang (2000, pp. 916), TMT is defined
as “consisting of those executives above the vice president level (sometimes secretary,
controller and treasurer depending on the firm’s structure), as well as any other officers
who served as directors of the company, e.g., senior vice president, vice chairman, CEO,
and any other officers who were on the board of directors”. The main roles of TMT are
guiding corporate strategy and elaborate it by making decisions about which projects one
should bet, the directions that their strategies should take and how they should allocate
resources available in different projects. Collins and Clark (2003) state that TMT is an
important subset between of those employees, because TMT has contact with employees,
and internal and external people (e.g. clients, providers).
Hambrick (1987), states that except for some extreme cases, management is a shared
effort. There are many choices to be made and issues to be considered for one person and
also management involves delegation and team collaboration. Hambrick (1987) shows that
communication skills, vision and other key features that exist within the teams are essential
for its proper functioning and consequently for successful business strategies. There are
several human factors such as interpersonal dynamics, skills, among others, affecting

5
businesses. Managers who want to improve the performance of their organizations will
work to improve their TMT (Hambrick, 1987).
Hambrick and Mason (1984) dedicated their research efforts to investigate the upper
echelons and the attributes of top managers. Hambrick and Mason (1984) showed that
organizational outcomes (performance and strategic) are predicted by characteristics of top
managers. Upper echelon characteristics are composed by: Psychological – cognitive base
and values; and Observable: age, functional tracks, other career experiences, education,
socioeconomic roots, financial position and group characteristics. Top managers’
characteristics influence the decisions and the actions that the managers make and adopt.
(Hambrick & Mason, 1984). In a more recent study, Hambrick (2007) updated the upper
echelon theory and reports that the central point of the upper echelon theory is associated
with values, experiences and personalities of top managers team. Thus, such characteristics
greatly influence their interpretations of the situations which they face along the business
route as well as it affects their choices. Several studies used and applied the upper echelon
theory (Ting, Azizan & Kweh, 2015; Olson, Parayitam & Twigg, 2006; Heyden, et al.,
2013; Monga, 2016).
There are authors who similarly argue that the impact of the diversity of TMT on
their performance is neither positive nor negative. Cannella, Park and Lee (2008)
conducted a study of 207 USA companies, representing 11 industries examining the
background diversity of TMT and firm performance. Researchers verify the increase on the
effects of TMT functional diversity, on its performance in which the enterprise becomes
more positive in terms of the ratio of TMT members with offices at the same location.
Buyl et al. (2011) used 33 Dutch and Belgian information and technology companies in
order to understand the moderating role of three sets of CEO characteristics and the
relationship between functional diversity TMT and company performance. After the
analysis of the study, the results show that the CEO and TMT characteristics interact in
achieving the potential benefits of functional TMT specialization. This type of effect is
related to the specific relevance attributes which varies in the different layers of context
(Cannella, Park & Lee, 2008). There are studies that reinforce the idea that the CEO with
international experience creates value for their companies and themselves through their
control of a valuable resource (Carpenter, Sanders, & Gregersen, 2001).
Variety in teams or even in groups is frequently described as a positive force leading
to effective functioning of the team (Awino, Ogutu, & Muchemi, 2011). In order to get a

6
better group performance, diversity is closely linked to a broader range of ideas, creativity
and even innovation (Awino, Ogutu, & Muchemi, 2011; Jackson, May & Whitney, 1995,
1995; Cox, 1993). Research suggests that diversity can have effects and consequences both
positive and negative at the same time. Milliken and Martins (1996) demonstrate in the
article that diversity in organizational groups composition affects the company results. It
can be through the: emotional impact, cognitive aspect, communication and symbolic
processes. The emotional consequences of diversity were found to have negative effects on
affective outcomes, i.e., there are negative affective outcomes of diversity in observable
attributes which appear to decrease. The cognitive consequences of diversity are unclear if
the positive effects on cognitive outcomes of diversity group of observable attributes are
due to the differences in these attributes alone or are due to the diversity in the underlying
attributes. Symbolic consequences of diversity can affect the quality of task performance
and affective reactions of the members. Diversity can have important effects on
organizational results due to the composition of some organizational groups that have a
symbolic meaning for both internal and external stakeholders. The consequences of
oriented diversity of communication: the more diverse the groups, the more they seem to
communicate in a more formal way. Perhaps, less frequently with each other in lower
group members. However, they can communicate more often with those who are outside
the group. That is, the effect is positive if it is a cognitive one. However, it is negative if
the consequences are emotional (Milliken & Martins, 1996).
There are different ways to study the area of diversity of the Top Management
Teams. The study of Jackson et al. (1995) states that the diversity of teams is based on
differences in age, gender, education, firm tenure and technical / functional background.
However, studies on cross-functional teams are defined as deliberate differences in
demographic diversity and technical expertise (Ancona & Caldwell, 1992). This
dissertation focuses on the diversity of gender and on the size of the management team.
Based on the theoretical arguments derived from the Upper Echelons Theory, which argues
that managers’ demographic characteristics (e.g. gender) need to be considered due to their
influence on the organizations’ performance. It is suggested that gender diversity in the
Top Management Teams of Portuguese firms will be positively related to economic
performance (Ruiz-Jiménez & Fuentes-Fuentes, 2016).

7
2.1.1. Gender
The importance of gender diversity in management comes not only from an ethical
point of view, but also from an increasing number of studies which claim that this theme
provides clear gains / benefits, obtaining a better corporate governance (Cabo, Gimeno &
Nieto, 2012).
The diversity, as stated before, can be explained and respectively differentiated in
two categories:
Observable. The population level is based on what is visible, that is, race,
gender and education level;
No observable. It refers to not visible attributes, that is, knowledge, skills,
individual profiles and capabilities. (Milliken & Martins, 1996; Pelled 1996)
The study of Rosenzweig (1998) states that much of the research on the diversity
addresses population subjects and mid gender diversity. The focus on gender diversity is
mainly explained by their gender imbalances that commonly occur in the context of the
organizations in which almost the entire geographical area and, also to society and laws.
This research becomes even more important, since increasingly female gender begins to
have more strength in the labour market fighting intensely for gender equality. Table 1
characterizes the European landscape regarding the involvement of women in senior
positions in the business sector.

8
Table 1 - Women in TMT: European landscape
Country
% of women directors represented on the board
% of board with no women directors on the board
Austria 10 20
Belgium 15 15
Denmark 17 10
Finland 27 0
France 25 3
Germany 16 7
Italy 11 20
Netherlands 19 4
Norway 39 0
Poland 8 40
Portugal 8 30
Spain 13 24
Sweden 27 0
Switzerland 14 15
United Kingdom 18 6
European average 17 12 Source: Heidrick & Struggles (2014), Spencer Stuart (2014)
According to Table 1, regarding the percentage of women directors one may
highlight the case of Norway with 39%, then Finland reaching 27% similar do Sweden.
The lowest values have been reached by Poland and Portugal with 8% of women directors
represented on the board. Concerning the percentage of no women directors on the board
Poland reaches 40%, followed by Portugal with 30%. On the other hand, Norway and
Sweden have no company with no women directors on the board. The values that are in the
table can be explained by their historical past, laws, political and sociological contexts and
other facts (Alvarado, Fuentes & Laffarga, 2015). The study of Unite, Sullivan and Shi
(2015) is dedicated to the gender composition and diversity trends among TMT, and they
have used data on about 250 PSE-listed firms. They also present some data on the average
proportion of women directors on boards by country (Table 2).
9
Source: Unite, Sullivan & Shi (2015)
Table 2 shows that Portugal has a place in the table background compared to some
non-European countries, and it is the country with a lowest percentage (7.9%) when
compared to the European countries. On top of the Table 2 it can be observed that Norway,
Finland and France have interesting values of average proportion of female on TMT. On
the bottom of the table, with the worst value, it is Japan, immediately followed by
Portugal. Smith, Smith and Verner (2005) study the relationship between women in senior
positions and on boards of directors in a sample of 2500 largest Danish. Investigators argue
that the proportion of women reaching top positions is still very low in most countries,
although it has increased in, for example, the US and in some European countries. They
also show that women in the TMT have significant effect on firm performance measured
Table 2 - Average proportion of female directors in boards by country (2014, %)

10
by the alternative measures performance. Jurkus, Park and Woodard (2011) investigate
gender diversity among top company managers. The study finds that companies with a
higher percentage of female employees have lower costs, but that the negative relationship
is not robust when considering the endogeneity of diversity.
2.1.2. Size board
Members of TMT are considered important players in management and their
characteristics are frequently studied in the field of TMT (Chaganti et al., 2016).
Size board is also considered as one of the resources for early stage companies
especially high-tech, affecting the competitive advantage (Knockaert, Bjornali & Erikson,
2015). From the theoretical point of view, the size of TMT can be a measurable indicator
of organizational resources to make strategic choices (Varner & Palmer, 2007). The team
size is an essential team characteristic (Jaw & Lin, 2009). However, Top Management
Team size has been little studied and analysed on the effects of team size by researchers.
The larger the team, the more human resources are available, as well as the absolute
level of human capital, which leads to particularly targeted and companies focused on
growth (Hellmann & Puri, 2002; Hambrick e D'Aveni, 1992). With a larger team, more
information can be handled and carried to be focused on the problems, resulting in
potentially better decisions (Cummings et al., 1974; Haleblian & Finkelstein, 1993). The
higher the human capital levels, the further the development they can provide, becoming a
greater ability available to solve problems extemporaneously and to adapt naturally to
changes in the external environment (Ucbasaran et al., 2003; Wright et al., 2007).
Cummings et al. (1974) state that the larger the size of TMT, the more resources are
needed to solve problems as well as the development of capabilities and resources. It is
useful to explain the high quality decisions of large-scale team, so that mistakes and risks
are avoided. A larger TMT has more advantages compared with a small-scale TMT. Jaw &
Lin (2009), state that a larger TMT has more physical and interrelation resources which is
good in situations of ambiguity and uncontrollable factors from multinational markets. The
larger size of board can also cause more advantages in terms of legitimacy (Foo, 2010).
Cooper and Bruno (1977) and Song et al. (2008) state that higher teams of TMT contribute
to solve problems more effectively and the company performance improves compared to

11
smaller TMT's. Chaganti et al. (2016) state that the board size may affect the decision of
the public. The resources of a large TMT can also conduct the company to better decisions
and position the company for long-term success.
2.2. TMT gender diversity versus firm
performance
Increasingly there is more diversity in Top Management Teams (Carpeter, 2002;
Wiersema & Bantel, 1992). This diversity is set to a diverse mix of attributes,
characteristics and skills that individual team members bring to it (Van der Walt & Ingley,
2003). As in the study of Smith, Smith and Verner (2005) in order to measure gender
diversity in top management, there is a number of alternative measures of gender diversity
in TMT. The most restrictive definition includes only the proportion of women among the
top CEO (Smith, Smith & Verner, 2005).
Typically, there are two types of arguments to increase the presence of women in
TMT: ethical or financial component (Campbell & Mínguez-Vera, 2007). In this way,
companies should consider a larger representation of women not as a means to an end, but
as a desirable end in itself (Brammer et al., 2007). The diversity of gender and business
performance has been investigated in recent times. Studies are attempting to test the
relationship between these two variables. Carter et al. (2010), led some investigators to
connect diversity with economic results and they did not find a significant relationship
between sex of the Top Management Team with the financial performance of a sample of
large US companies.
Older studies as the Robinson and Dechant (1997) study, based on intuitive
reasoning, demonstrate that companies that have women and men in TMT mobilize the
company different skills, experiences and knowledge, i.e., having a greater diversity
promotes a better accepting of the marketplace. This indicates that heterogeneous groups
produce higher quality in the decision. Williams and O'Reilly (1998) and Earley and
Mosakowski (2000) show that members of homogeneous groups tend to communicate
more recurrently as they are more likely to share the opinions, i.e., they argue that gender
diversity can reduce firm performance. The component of creativity and innovation is also
influenced by gender diversity.

12
In a more recent study, Tyson (2003) finds that gender diversity provides a better
company performance, and this is mainly due to the existence of different points of view.
There are studies that support and demonstrate two different foundations when compared
to the females in the TMT or top position and firm performance. Campbell & Mínguez-
Vera (2007), claim that diversity increases creativity and innovation as these features are
not randomly distributed in the population, but tend to vary (e.g. gender). The gender
composition of the board can affect the quality of this monitoring role and thus the
financial firm performance. They used 68 companies and 408 observations, from
companies listed on the Madrid market in the following period 1995-2000. In order to
measure firm performance researchers used Tobin Q, which is defined by the sum of the
market value of the shares and the book value of debt divided by book value of total assets.
Researchers (Campbell & Mínguez-Vera, 2007) show that the presence of one or more
women on the board has an irrelevant effect on firm value. Nevertheless, it is understood
that the ratio of women to men on the board and the diversity indices have a positive effect
on the value of the firm, and the indices of the company does not affect the ratio of women
to men on the board and the diversity indices.
Cable, Gimeno and Nieto (2012) analyse a sample of 612 European banks,
representing 20 European countries over the sample period (1998–2004) where the main
focus is gender diversity of corporate board seats of the European Union. In order to test
the hypothesis, it was used Standard Deviation of the Return On Average Assets (ROAA).
The study showed that the proportion of women on the board is low risk. The researchers
argue that there may be some statistical discrimination behind this relationship, or aversion
to real risk. They also show that larger teams have a higher proportion of women on their
boards. In addition to that, the banks that have a growth orientation are more likely to
include women on its board.
Alvarado Fuentes and Laffarga (2015) analyse the relationship between gender plate
diversity and economic results in Spain, with a sample of 125 non-financial companies
listed on the Madrid Stock Exchange in the period 2005-2009. Tobin Q use the measure of
the financial performance of each firm. Researchers studied the case and suggested that
there was a positive relationship between the diversity of gender and economic results
(assets) in the companies, this means that having more women in leadership positions
increases business performance. Accordingly, the study suggests that companies should
13
have a vision of economic efficiency, thus incorporating a greater percentage of women in
leadership positions.
Many previous investigations, showed that the increase of women in TMT brings
economic gains to the firm, i.e., there is a positive relation between diversity and firm
performance (Erhardt et al., 2003; Bonn et al., 2004; Carter et al., 2003). However, there
are studies that show that the relationship between the number of women in top
management of companies and the company performance is negative, i.e., the more women
with worse top features influence the performance of the company (Carter et al., 2010)
(Adams & Ferreira, 2009). There are also studies that claim that there is no significant link
between the firm performance and females in the top management (Rose, 2007).
Thus, researchers have been demonstrating that the number of women in top
management is closely related to firm performance, i.e., the higher number of women in
this position the better business results (Alvarado, Fuentes & Laffarga, 2015; Campbelll &
Mínguez-Vera, 2008; Erhardt et al., 2003). There are some characteristics that differ
between the genders. One example is the risk aversion. Women are more risk averse
compared to man (Post & Byron, 2015) (Croson & Gneezy, 2009). The social preferences
of women are more specific, and it is also stated that women are more averse to
competition compared to men (Croson & Gneezy, 2009). Researchers have focused on the
effects on the reputation of the social and ethical business which benefits all, where it is
visible a favourable reputation. That is, the more diverse the environment, the more this
will affect the company's profitability in a positive way (Kang, Cheng & Gray, 2007).
Therefore, it is expected that the higher the number of women in the companies’ boards,
the higher the profitability will be.
Based on the previous research and theoretical arguments, the following hypothesis
are presented:
Hypothesis 1: The higher the presence of women in the TMT, significantly higher
the ROA will be.
In order to understand the variation between the performance (ROA) in Top
Management Teams with women and Top Management Teams without women it is
proposed a new hypothesis.

14
Hypothesis 2: The distribution of ROA will be significantly different in companies
with women in their TMT and in companies without women in their TMT.
2.3. TMT Size versus firm performance
There are several studies showing that a larger TMT size contributes to solving
problems more effectively, when compared to companies with smaller teams. The studies
of Cooper and Bruno (1997) and Eisenhardt and Schoonhoven (1990) show that the teams
in companies that own high technology have associated the company growth to its size.
There are quite a few studies that address the Top Management Team size (Chaganti
et al., 2016). In previous studies the team size is typically used as a control variable
(Wiersema & Bantel, 1992; Sessa, Julin, & Peyronnin, 1991; Bantel & Jackson, 1989).
Wiersema & Bantel (1992) analysed the relationship between the demographics of the Top
Management Team and strategic change, for this study it was used a sample of Fortune 500
companies. As control variables they used firm performance, size of TMT, and industry
structure. Sessa, Julin, and Peyronnin (1991) used as a sample 93 TMT to test hypotheses
regarding interpersonal context for recruitment, promotion, and the turnover patterns,
interpersonal context with a several control variables (e.g. organization size). Bantel and
Jackson (1989) used a sample of 199 banks in order to verify the relationship between the
social composition of management teams and top innovation adoption. The effects of bank
size, location (operating status), and the size of the staff, who were used as control
variables demonstrated that the relationship remain significant when the size of the
organization, team size, and location were controlled.
Other studies (Haleblian & Finkelstein, 1993; Amason & Spienza; 1997) used the
size of the board as an independent variable. Older studies (e.g. Steiner, 1972) showed that
the productivity of the group is consisting mainly by productivity with the exception of
losses arising from defective processes. Steiner’s study also shows that the group size
affects the gains and process losses conflicts. Investigators have shown that the size of the
teams is related to the group's performance and with characteristic / capacity of member
(Hambrick & D'Aveni, 1992; Hoffman, 1979). Haleblian and Finkelstein (1993) state that
the size of board has a positively effect in the firm performance. Researches (Haleblian &
Finkelstein, 1993) analyse the effects of top management dimension as performance of

15
companies in different environments. To check the veracity of hypothesis it was used a
sample of 47 organizations and ROA was used to measure the company performance.
Researchers have shown that companies with higher size on board, have a better
performance. They also proved that the association between the size of the team and CEO
domain and company performance is significant in an environment that allows top high
discretion managers to make strategic choices, but is not significant in a low discretion
environment. Amason and Spienza (1997) showed that the expansion TMT size, increased
the conflict, which lead to a negative impact on the performance of the company.
Investigators (Amason & Spienza, 1997) showed that a study of 48 TMT, the size of board
and openness were positively related to cognitive conflict. The size of the team was also
associated with higher affective conflicts, when teams had high levels of reciprocity,
greater openness led to less affective conflicts.
A more recent study, Yuan-qiong, Wen and Yun (2009) proves that the team size has
a negative impact on firm performance. To obtain the results companies in the Shenzhen or
Shanghai Stock Exchange were used. The results presented that at high ambient
uncertainty, there was an inverse relationship and kind form of U between the size of TMT
and company performance and, in the low environmental uncertainty, there is a U form
between the variable (Yuan-qiong, Wen & Yun, 2009). Chaganti et al. (2016) used a
sample of firms in the software industry, and showed that one of the main influences of the
Top Management Team is the size of team.
The study of Song et al. (2008) and, Cooper and Bruno (1977) found out that the
company performance is influenced positively by the size of the Top Management Team.
These conditions are met and are explained by Hambrick and D'Aveni (1992), who claims
that a larger size of TMT means more resources available for the company, which gives
more information and provides more problems / solutions, that leads to further reflection
and consideration of several hypotheses that help in the decision making. (Haleblian &
Finkelstein, 1993)
The teams that have more members can improve problem-solving skills by
increasing the volume of information that can be acquired and also rejected, increasing the
number of people who will analyse and demonstrate other views and criticism. One can
correct errors in the link information and analysis, so the number of potential solution
strategies increases, and the increase prospects applied on a problem (Shaw, 1981; Shull et

16
al., 1970; Harrison, 1975). Increased capacity and resources may help explain the higher
quality decisions, and further intensity results.
The advantages of large groups are huge, as mentioned above. However, there are
also other points that are not so positive when size is considered. On account of their scale
there may be more problems of communication and coordination. On the other hand, teams
where there are fewer members tend to be more cohesive and the individuals are more
satisfied (Shaw & Harkey, 1976; Shaw, 1981). The quality of the decision in small teams
tend to be not as good when compared to larger companies.
Teams with more members have more features and capabilities in solving activities
in group. (Jaw & Lin, 2009; Chaganti et al., 2016; Jackson, 1992). The resources of a large
TMT may allow the company to make better decisions, in order to position the company in
a more long-term success. (Chaganti et al, 2016) Thus, one can conclude that the higher
number of TMT members, the greater the processing of information, which aids in the
decision-making, when comparing with shorter teams with more intensity performance.
Based on the previous arguments, it is suggested that the size board of TMT is
positively related to performance. Thus, the following hypothesis are proposed:
Hypothesis 3: The higher the size of the TMT, the significantly higher the ROA
will be.

17
3. Data and Methodology
3.1. Dataset
Previous investigations (e.g. Campbell & Mínguez-Vera, 2008; Nielsen & Nielsen,
2013; Alvarado, Fuentes & Laffarga, 2015) used listed firms for their samples. Campbell
and Mínguez-Vera (2008) used 408 observations from 68 non-financial firms listed on the
continuous market in Madrid, for the period of 1995 - 2000. Nielsen and Nielsen (2013)
used 146 Swiss listed firms representing 32 industries, for the period of 2001 - 2008.
Reguera-Alavarado, Fuentes and Laffarga (2015) used 497 observations from 125 non-
financial firms listed in the Madrid Stock Exchange General Index for the period of 2005 -
2009. This study addopted a similar sample procedure and a sample of portuguese listed
firms in Euronext Lisbon was used. Euronext is the pan-European financial center. This
center plays an essential role in the center of the capital and financial markets in Europe
(Euronext, 2016). A total of 205 observations of 41 portuguese listed Euronext Lisbon
companies were used, for the five-year period: 2011 – 2015, as can observe in Appendices
1 – Companies of Sample. The sample used in this study was taken from the database
SABI – “Sistema de Análise de Balanços Ibéricos”. To obtain data for the five years’
sample, several filters were adopted, obtaining a final total of 41 Portuguese listed sample,
for 2011 – 2015, the last available year in the dataset. Figure 1 shows the filters presented
above in SABI database. Thus, below are presented the input filters:
Country: Portugal
Status of the company: active;
Listed firms: Euronext Lisbon.
Note Source: SABI, 19th April 2016
Figure 1 – Example of sample of SABI

18
Data on TMT gender, size composition and return on assets (ROA) of each company
were collected from SABI. In order to obtain the final sample several procedures were
addopted and applied. Firstly, only companies that were present in the 5 years of the
analysis in the study were considered, i.e., companies that were four years or less were
eliminated from the sample. Secondly, companies that did not have all the data were
eliminated, that is, companies with missing data. Thus, after the application of these two
procedures the final sample was composed of 41 companies that were listed on the
Portuguese Stock Exchange for the 2011 – 2015 period leading to a total of 205
observations. In order to better characterize this sample, some descriptive statistics of the
final sample are presented in Table 3.
Table 3 - Composition of boards of directors sample
Year
2011 % 2012 % 2013 % 2014 % 2015 % Total
Men Directors (n) 179 92.27% 186 88.57% 666 84.52% 718 85.89% 898 83.46% 2647
Women Directors (n) 15 7.73% 24 11.43% 122 15.48% 118 14.11% 178 16,54% 457
Total of Team Directors (n) 194 - 210 - 788 - 836 - 1076 - 3104
Table 3 shows that the percentage of women directors’ increases over time analysis,
with a slightly exception in 2013 / 2014. Even though the total number of women serving
on corporate boards remains small. It is obvious that the female gender remains under
represented in the Top Management Teams, similar to previous studies (Joecks et al., 2013;
Alvarado, Fuentes & Laffarga, 2015). The results show that there is still a minimal
presence of women on boards. However, it is visible a progress over time. In 2011 the
presence of women reaches 7.73%, and in 2015 it is perceptible a significant development,
the percentage increased to more than a double, reaching 16.54%. Compared with the rules
of European countries that aspire to a representation of 40% women in the Top
Management Team, it is evident that there is still a long way to go.
In order to understand the evolution of gender in this sample, over the years 2011 -
2015, Figure 2 shows the evolution of the female and male gender, in terms of mean
values.
19
Figure 2 -Evolution of gender 2011 - 2015
Regarding Figure 2, it is noticeable that the female gender is significantly distance
from the male gender in several years in analysis. The mean has been increasing over the
years, however there was an increase in 2013. The mean of the difference between the
genders has also been increasing over the years. The minimum value of the female gender
mean is 0.37 in 2011 and in 2015 was obtained the highest with a mean value of 4.37. As it
can be seen the female gender in TMT has been increasing yearly. A progressive evolution
is visible and thereby an increase of gender diversity in teams. The male gender has a
minimum value of 4.37 and a maximum value of 21.90 in 2011 and 2015 respectively. In
order to understand the evolution of size over the years 2011 - 2015, Figure 4 was created
with the mean of size of board and the standard deviation. The values are presented in
Appendices 2 - Evolution of gender 2011 – 2015. Applied graph is the bar chart that
displays information with a number of data points by straight line segments.

20
Figure 3 - Board size evolution 2011 – 2015
According to Figure 3, it is visible the evolution from 2011 to 2015. The minimum
was recorded in 2011 with a value of 4.73 (Sd = 1.58) and the maximum was reached in
2015 with the value of 26.24 (Sd = 15.64). The standard deviation is also higher than in
2015, which means that there is higher variation or "dispersion" in relation to the average.
Analysing 2013 to 2014 the increase in the number of TMT was not very high, although in
2014 it appeared that companies were more homogeneous in terms of number of
employees in upper frame, as the standard deviation is lower. The values are presented in
Appendices 3 - Evolution of board size 2011 – 2015.
In order to understand the variation in women in TMT and the size of the board, a
graph was created, which shows changes over the five years in the study. First column
shows the variation that was given between 2012 and 2011, the second column shows 2013
- 2012, the third column shows 2014 to 2013 and the last column refers to 2015 - 2014.

21
Despite the difference in intervals between Figure 4 and Figure 5, which is shown in
the change in kind and dimension of the Top Management Team, it is visible a peak in the
year 2013 – 2014, which is far from the rest of the year when compared later in 2014 –
2013, where there was a decrease. In 2015 - 2014 it is clear that there is a significant
increase. As the number of women in TMT increases, the increase the size of the board
TMT also exits as it is shown by the figures.
In Table 4 it is represent the mean, standard deviation, maximum and minimum of
men, women, size of team and ROA.
Figure 5 - Variation of size board in TMT
2011 – 2015
Figure 4 - Variation of gender in TMT
2011 - 2015

22
Table 4 - Comprehensive information of sample in analysis
Year Men Women Size of team ROA
2011 Mean 4.37 0.37 4.73 0.11
Std. Deviation 1.58 0.70 1.58 12.49
Minimum 0 0 1 -48.29
Maximum 7 3 8 36.03
2012 Mean 4.54 0.59 5.12 -.64
Std. Deviation 1.33 0.74 1.27 10.82
Minimum 1 0 1 -30.84
Maximum 8 3 9 35.32
2013 Mean 16.24 2.98 19.22 5.87
Std. Deviation 7.55 1.92 8.12 26.19
Minimum 5 0 6 -30.61
Maximum 36 7 38 159.95
2014 Mean 17.51 2.88 20.39 0.92
Std. Deviation 6.10 1.86 6.32 11.99
Minimum 8 0 10 -56.20
Maximum 34 6 38 23.26
2015 Mean 21.90 4.34 26.24 4.47
Std. Deviation 13.41 3.38 15.64 11.27
Minimum 6 0 9 -27.64
Maximum 68 15 78 36.73
Total Mean 12.91 2.23 15.14 2.14
Std. Deviation 10.30 2.49 12.05 15.74
Minimum 0 0 1 -56.20
Maximum 68 15 78 159.95
Regarding Table 4, the increase is visible on all variables from 2011 to 2012, with
the exception of ROA. In 2013 there was a more significant increase in all variables.
Regarding 2014, the variable of the number of men and the size incresead. However,
women and ROA suffered a slight decrease. In 2015 all variables, i.e., men, women, size of
team and ROA increased.

23
3.2. Variables Description
Following the previous literature, performance is measured through an accounting
measure (Haleblian & Finkelstein, 1993; Nielsen & Nielsen, 2013; Hambrick, 2007;
Cannella et al., 2008). The dependent variable is the financial performance measured
through ROA. ROA is obtained by the percentage of how profitable the assets of a
company are in generating revenue. The dependent variable, ROA, is operationalized at the
end of each calendar year. The composition of the Top Management Team is checked at
the beginning of each year. However, if there are some changes, those changes are realized
at the end of the year. That is, there is no time spacing like in the study of Hambrick (2007)
and Nielsen and Nielsen (2013).
Women (female gender) are also considered as variable which is designated by the
number of women belonging to the TMT as well as the Size of the Team, which is related
to the number of elements that the Top Management Team has in its composition.
As applied in other studies (e.g. Alvarado, Fuentes & Laffarga, 2015; Nielsen &
Nielsen, 2012; Campbell & Minguez-Vera, 2008), it is calculated a new measure of gender
diversity that consider both the number of categories of gender (women and men) and the
uniformity of distribution of members of the Top Management Team between them. In this
sense, and based on the concept of diversity Blau variable is created. In order to compare
the number of women in TMT with the total number of directors on the board, Blau index
is applied (Blau, 1977). This index is measured by the following formula
. In this formula representes the percentage of board members in each
category (i.e.: gender). To analyse gender diversity Blau values varies between 0 and 0.5.
The 0.5 is considered in cases where the board has an equal number of women and men.

24
3.3. Methodology
The study analyses the relationship between gender diversity and size of the Top
Management Team with financial performance. The first goal is to understand whether the
parametric tests can be used based on the normality analysis. The parametric tests are used
when a normal distribution exists (Maroco, 2007). Normality is analysed through the
Kolmogorov-Smirnov test to see if the variables follow a normal distribution.
In order to understand the correlation of variables two types of correlation could be
used: Pearson or Spearmen. The Pearson correlation measures the strength of the linear
relationship between normally distributed variables. Due to the absence of normality, it
must be applied the Spearman correlation.
Subsequently, a linear regression is created in order to study the behaviour of two
assembly quantitative variables. The regression equation is to estimate the conditional
(expected value) y of a variable, given the values of some other variable x. In order to
create the linear regression, it was also created a new variable called NewROA, where all
values of ROA have been added a constant of 60. The added constant (+60) is to ensure
that all ROA are positive and for technical purpose. When established the linear regression
model compound, it was considered as dependent variable NewROA (ROA +60) and, as an
independent variable Women (number of women in TMT).
To study the presence of women, two groups were created: companies that have
women (with women) and companies that do not have women in top positions (without
women). In order to test if the distribution of ROA is similar in companies with women in
TMT and without women TMT, i.e., understand the behaviour of the firm performance of
companies with women and without women, it is applied a non-parametric Mann-Whitney
test that compares the means of two independent samples (gender: female or male)
(Maroco, 2010). T-Test is a parametric test and the alternative to the T-Test, a non-
parametric test, Mann-Whitney is used due to the lack of normality in our data. This test
compares the centre location of two samples, the differences between the corresponding
two populations, which is based on the order of observations and the local differences
comments. (Pestana & Gageiro. 2005; Maroco, 2010).
All the analyses were performed using the latest SPSS version.

25
4. Results
4.1. The Kolmogorov-Smirnov test
In order to test both hypotheses that relate the female gender with the performance
and the size of the board and the firm performance, only companies that are present in the
five years’ period were considered, from 2011 to 2015. Thus, the final sample includes 41
companies and 205 observations. The sample and data were prepared in order to eliminate
all the missing values and to have the same companies throught the 5 years’ period. Thus,
all companies will have equal weight in the final sample for all subjects / observations. The
Kolmogorov-Smirnov test is used to verify if the variables follow a normal distribution.
(Maroco, 2008)
Table 5 - Kolmogorov-Smirnov
Variables Skewness Kurtosis Kolmogorov-Smirnov
Statistic p
ROA 4.60 50.37 0.194 0
Women 1.67 4.23 0.207 0
Size 1.87 5.89 0.146 0
Blau 0 -1.36 0.201 0
ROA (With Women) -0.70 3.91 0.194 0
ROA (Without Women) 5.49 54.16 0.219 0
After applying the Komolgorov-Smirnov test it is clear that the distribution is not
normal because the p-value of the several variables is bellow to 0.05 (p < 0.05), which
leads to apply the Spearman correlation due to the lack of normality. The skewness and
kurtosis coefficients also show that the quality of distribution is not normal because they
are not close to 0. According to Maroco (2008) when the absolute values of these two
coefficients are greater than 1, it can be assumed that the data distribution in question is not
the normal type.

26
4.2. Spearman correlation and linear
regression - gender
In order to understand the correlation between ROA and the number of women on
TMT, and also between ROA and the size of the TMT board, and ROA with Blau the
Spearman correlation analysis was performed.
Table 6 - Correlations of Spearman - gender
Women Blau
ROA rho 0.191** 0.099
p 0.006 0.157
Note: ** - The correlation is significant at the 0.01 level (2-tailed)
Table 6 shows that the correlation between ROA and the presence of women on the
TMT in Portuguese companies. The relation between ROA and Women is positive
(rhoWomen = 0.191) and significant at the 0.01 level. Therefore, the higher the number of
women in TMT, the more tendency there is for ROA to be. As purposed in the H1, the
higher the number of women in TMT, the more tendency exists for the ROA to be higher.
Based on this, Hypothesis 1 has been corroborated.
Comparatively, the relation between ROA and Blau index is positive (rhoBlau =
0.099), but it is not significant. In the sampling point of view and, regarding the
relationship of Blau index with ROA, these two variables have a positive relationship,
which means that the higher the performance increases, the higher the Blau index.
A linear regression model was also performed, after eliminating the extreme cases
based on the minimum and maximum descriptives. It was created a new variable called
NewROA, where to all values of ROA have been added a constant 60. The added constant
(+60) is to ensure that all ROA are positive and to be able to perform the technical
procedure in the SPSS. The linear regression is an equation to estimate the conditional
(expected value) y of a variable, given the values of some other variable x. Table 7 presents
the coefficients of the linear regression. To perform the linear regression, it was considered
the dependent variable, ROA (NewROA).

27
Table 7 – Coefficients of Linear Regression
No standardized coefficients Standard Coefficients
t p B Standard Error Beta
Women 1.007 0.008 1.061 125.834 0.000
(Constant) 58.876 1.564 37.656 0.000
In the linear regression it was used the compound model, with ROA without extreme
cases where the minimum was -56.20 and the maximum value was +159.95. Results show
that the model is significant (sig. = 0.000). Results show that gender diversity (female
gender) is significantly positively associated with performance (ROA). Table 8 presents
the model summary and parameter estimates. The dependent variable is the NewROA and
the independent variable is Women. Figure 6 is also included for a better visualization of
the performed regression.
Table 8 – Model Summary and Parameter Estimates
Equation
Model Summary Parameter Estimates
R Square Z df1 df2 Sig. Constant b1
Compound 0.003 0.700 1 202 0.404 58.876 1.007

28
Figure 6 – Linear Regression
In the Figure 6 it is visible the linear regression. Based on Table 8, the final model
assumes the following equation:
ln(y) = ln(b0) + [(ln(b1) × t]
That it is, for this case:
ln(NewROA) = ln(58.876) + [ln(1.007) × Women]

29
4.3. Mann-Whitney test - gender
The non-parametric Mann-Whitney test compares the centre location of two samples,
as a way of detecting the differences between two corresponding populations, based on the
order of observations and differences in local observations. Once these variables do not
follow a normal distribution, the Mann-Whitney test was used instead of the T-test
(Maroco, 2010). The main objective is to determine whether the companies that have
women on their TMT, have higher performance than those who do not have women in
their TMT. In order to test the Hypothesis 2, which purpose that the distribution of ROA is
different in companies with women in TMT and without women in TMT, Table 9 is
presented.
Table 9 - Women in TMT Versus No Women in TMT
With women in TMT Without women in TMT Test
Mean Rank Mean Rank U p
ROA 108.85 89.50 3596 0.032*
* - Significant at the 0.05 level (2-tailed)
Results show that, according to Table 9, there are significant differences in ROA
between companies that have women and companies that do not have women on their
TMT. Results show that the mean rank of ROA with women in TMT has a higher value
(MR = 108.85), compared to ROA without women in TMT (MR = 89.50) that has a lower
value. One can infer that the ROA is higher in companies that have women in their TMT.
Test U has a value of 3596 and it is significant at the 0.05 level (p = 0.032 < 0.05). Thus,
hypothesis 2 is corroborated.

30
4.4. Spearman correlation – size of the team
Table 10 - Correlations of Spearman – size of the team
Size of Team
ROA rho 0.195**
p 0.005
Note: ** - The correlation is significant at the 0.01 level (2-tailed)
According to the correlation between the size of the board and ROA, results show a
positive (rhoSize of Team = 0.195) and significant correlation at the 0.01 level. Thus, the larger
the size of TMT, the greater is the tendency to ROA to be higher. Hypothesis 3, suggests
that the higher the size of Top Management Team, the higher tendency to ROA to reach
higher value. Hypothesis 3 has been corroborated.

31
5. Discussion
This study brings some new inputs concerning gender diversity in TMT and its
relationship with the firm performance, as well as TMT board size with economic
performance. In this study, 41 listed companies (205 observations) obtained from the
Euronext Lisbon for the 2011 – 2015 years’ period were used.
Concerning Hypothesis 1, which propose that the higher the number of women in
TMT, the more tendency there is for the ROA to be higher, the Spearman correlation and
regression was used in order to analyse the veracity of the hypothesis. The relation
between the number of women and ROA is positive and significant (p < 0.01). As one
variable increases, the other variable will also increase. This means that the increase of the
number of women in higher positions, the tendency for ROA to be higher increases as
well. Based on this, Hypothesis 1 has been corroborated. As far as the Blau index is
concerned, it is positive however the correlation is not significant. In the sampling point of
view, there are no statistically significant relationship between the Blau index and
performance, which means that when the value of Blau index of the company increases,
the firm performance also increases. As previous studies (Campbell & Minguez-Vera,
2008 Erhardt et al., 2003; Tyson, 2003) state the relationship is positive between the
number of women in TMT with positive economic overall result. The results show that
having more women in top positions increases the performance of the company. After
analysing relation between the variables, linear regression that comes with the variable
Women (independent) and NewROA (dependent) is applied, resulting in the following
equation; ln (NewROA) = ln (58,876) + [ln (1.007) × Women]. Results show that gender
diversity (female gender) is significant and positively associated with performance (ROA).
Through the Mann-Whitney test it is analysed the cross-cutting effects, making a
comparison between companies with women and companies that have no women in a
given year in relation to its average measures of profitability. The Mann-Whitney test
shows that there are significant (p < 0.05) differences in ROA between companies that
have women and companies that do not have women. The mean rank of ROA with women
have a higher value comparing with ROA without women. ROA is higher in companies
that have women in their TMT. Thus, hypothesis 2 is corroborated.

32
Regarding Hypothesis 3, it suggests that the higher the size of the Top Management
Team, the higher is the ROA tendency to have higher values. Results showed that there is a
positive and statistically significant correlation (p < 0.01) between size and performance.
As one variable increases, the other variable will also increase. Which means that the
larger the size of team, the greater is the tendency for the ROA to be higher. That is, the
company performance is greater when greater is the size of the team. As previous
investigations Ucbasaran et al., (2003) and Wright et al., (2007) demonstrated that the
higher are the levels of human capital certain developments can provide greater ability to
solve problems extemporaneously and to adapt naturally to changes in the external
environment. Chaganti et al. (2016) state that the resources of a large TMT may allow the
company to make better decisions, in order to position the company in a more long-term
success and reach better performance. The larger the size of TMT, the greater is the
tendency to ROA to be higher. Based on this, Hypothesis 3 has been corroborated.
33
6. Main Conclusions
This dissertation contributes to the literature showing that there is a positive and
significant correlation between ROA and the presence of women on the TMT of
Portuguese companies listed in Euronext Lisbon. Thus, the higher is the number of women
in TMT, the greater is the tendency to ROA to be higher, which allows to infer that, the
higher the number of women in higher positions, the greater economic performance will
be. Results show that gender diversity (female gender) is significantly positively associated
with performance (ROA). Results also show that ROA is higher in companies that have
women on their Top Management Teams. It is also concluded that increasing the size of
the TMT will have direct relationship with better economic results.
In conclusion, it is suggested that the most efficient companies on the economic
perspective should incorporate more women, i.e., increase the number of women on the
TMT. As well as the increase the board size of TMT to become a more efficient economic
enterprise. Regarding the incorporation of more women in teams, it will provide greater
ethical commitments, social visibility and attraction of human talent companies (Alvarado
Fuentes & Laffarga, 2015). And that somehow this presence influences positively the
economy of the company.
This research contributes to the literature of the diversity of characteristics of TMT
with financial performance. The article contributes mainly to the diversity of gender and
economic performance as well as the size of TMT board and corporate performance on the
Portuguese case.
Some limitations may be pointed out. The first limitation has to do with the sample
size. Another limitation is that the study applies only to the Portuguese case, but it is also a
strength since there were no other studies on this topic using a Portuguese sample.
In further research it would be interesting to include other variables of TMT
diversity. It would be interesting to study other characteristics related to the
characterization of the top management team (e.g. TMT nationality, TMT tenure, TMT
age, TMT education) and relate it to the economic performance of the company (e.g.
ROA).

34
References
Adams, R. B., & Ferreira, D. (2009). Women in the boardroom and their impact on
governance and performance. Journal of Financial Economics, 94(2), 291-309.
Amason, A. C., & Sapienza, H. J. (1997). The effects of top management team size and
interaction norms on cognitive and affective conflict. Journal of Management, 23(4), 495-
516.
Ancona, D. G., & Caldwell, D. F. (1992). Demography and design: Predictors of new
product team performance. Organization Science, 3(3), 321-341.
Ararat, M., Aksu, M., & Tansel Cetin, A. (2015). How board diversity affects firm
performance in emerging markets: Evidence on channels in controlled firms. Corporate
Governance: An International Review, 23(2), 83-103.
Awino, Z. B., Ogutu, M., & Muchemi, A. W. (2011). Diversity in the top management
teams and effects on corporate performance.
Bantel, K. A., & Jackson, S. E. (1989). Top management and innovations in banking:
Does the composition of the top team make a difference?. Strategic Management Journal,
10(S1), 107-124.
Birley, S., & Stockley, S. (2000). Entrepreneurial teams and venture growth. In D.L.
Sexton and H. Landström (Eds.), The Blackwell Book of Entrepreneurship, Oxford, U.K.
Blackwell Publishers, 287–307.

35
Blau, P. M. (1977). Inequality and heterogeneity: A primitive theory of social structure
(Vol. 7). New York: Free Press.
Boone, C., & Hendriks, W. (2009). Top management team diversity and firm
performance: Moderators of functional-background and locus-of-control diversity.
Management Science, 55(2), 165-180.
Brammer, S., Millington, A., & Pavelin, S. (2007). Gender and ethnic diversity among
UK corporate boards. Corporate Governance: An International Review, 15(2), 393-403.
Burt, R. S. (1982). Towards a structural theory of action. New York: Academic Press.
Buyl, T., Boone, C., Hendriks, W., & Matthyssens, P. (2011). Top management team
functional diversity and firm performance: The moderating role of CEO characteristics.
Journal of Management Studies, 48(1), 151-177.
De Cabo, R. M., Gimeno, R., & Nieto, M. J. (2012). Gender diversity on European
banks’ boards of directors. Journal of Business Ethics, 109(2), 145-162.
Campbell, K., & Mínguez-Vera, A. (2008). Gender diversity in the boardroom and firm
financial performance. Journal of Business Ethics, 83(3), 435-451.
Cannella, A. A., Park, J. H., & Lee, H. U. (2008). Top management team functional
background diversity and firm performance: Examining the roles of team member
colocation and environmental uncertainty. Academy of Management Journal, 51(4), 768-
784.

36
Carlsson, G., & Karlsson, K. (1970). Age, cohorts and the generation of generations.
American Sociological Review, 710-718.
Carpenter, M. A. (2002). The implications of strategy and social context for the
relationship between top management team heterogeneity and firm performance. Strategic
Management Journal, 23(3), 275-284.
Carpenter, M. A., Geletkanycz, M. A., & Sanders, W. G. (2004). Upper echelons
research revisited: Antecedents, elements, and consequences of top management team
composition. Journal of Management, 30(6), 749-778.
Carpenter, M. A., Sanders, W. G., & Gregersen, H. B. (2001). Bundling human capital
with organizational context: The impact of international assignment experience on
multinational firm performance and CEO pay. Academy of Management Journal, 44(3),
493-511.
Carter, D. A., D'Souza, F., Simkins, B. J., & Simpson, W. G. (2010). The gender and
ethnic diversity of US boards and board committees and firm financial performance.
Corporate Governance: An International Review, 18(5), 396-414.
Castrogiovanni, G. J. (1991). Environmental Munihcence; A Theoretical Assessment.
Academy of Management Review, 16(3), 542-565.
Chaganti, R. S., Zimmerman M. A., Kumaraswamy A., Maggitti P., & Arkles J. B.
(2016). TMT Characteristics, Time-to-IPO and Firm Performance. Journal of Management
& Public Policy, 7(2), 37-56.
Chen, H., Zeng, S., Lin, H., & Ma, H. (2015). Munificence, Dynamism, and Complexity:
How Industry Context Drives Corporate Sustainability. Business Strategy and the
Environment.

37
Child, J. (1974). Managerial and organizational factors associated with company
performance part I. Journal of Management Studies, 11(3), 175-189.
Chown, S. M. (1960). A factor-analysis of the Wesley Rigidity Inventory. Journal of
Abnormal and Social Psychology, 61, 491 – 494;
Collins, C. J., & Clark, K. D. (2003). Strategic human resource practices, top
management team social networks, and firm performance: The role of human resource
practices in creating organizational competitive advantage. Academy of Management
Journal, 46(6), 740-751.
Cooper, A.C. & Bruno, A. (1977). Success among high-technology firms. Business
Horizons, 20, 16-22.
Cooper A. C., & Daily C. M. (1997) Entrepreneurial teams D. Sexton, R. Smilor (Eds.),
Entrepreneurship 2000, Upstart Publishing, Chicago, Ill, 127–149
Cox, T. (1994). Cultural diversity in organizations: Theory, research and practice.
Berrett-Koehler Publishers.
Croson, R., & Gneezy, U. (2009). Gender differences in preferences. Journal of
Economic Literature, 47(2), 448-474.
Crossland, C., & Hambrick, D. C. (2011). Differences in managerial discretion across
countries: how nation‐level institutions affect the degree to which CEOs matter. Strategic
Management Journal, 32(8), 797-819.

38
Cummings, L. L., Huber, G. P., & Arendt, E. (1974). Effects of size and spatial
arrangements on group decision making. Academy of Management Journal, 17(3), 460-
475.
De Andres, P., Azofra, V., & Lopez, F. (2005). Corporate boards in OECD countries:
Size, composition, functioning and effectiveness. Corporate Governance: An International
Review, 13(2), 197-210.
Dess, G. G., & Beard, D. W. (1984). Dimensions of organizational task environments.
Administrative Science Quarterly, 52-73.
Díaz-Fernández, M. C., González-Rodríguez, M. R., & Simonetti, B. (2015). Top
management team’s intellectual capital and firm performance. European Management
Journal, 33(5), 322-331.
Dezsö, C. L., & Ross, D. G. (2012). Does female representation in top management
improve firm performance? A panel data investigation. Strategic Management Journal,
33(9), 1072-1089.
Dwyer, S., Richard, O. C., & Chadwick, K. (2003). Gender diversity in management and
firm performance: the influence of growth orientation and organizational culture. Journal
of Business Research, 56(12), 1009-1019.
Earley, P. C. & Mosakowski. E. (2000). Creating Hybrid Team Cultures: An Empirical
Test of Transnational Team Functioning. Academy of Management Journal, 43, 26–49.
Eisenhardt, K. M., & Schoonhoven, C. B. (1990). Organizational growth: Linking
founding team, strategy, environment, and growth among US semiconductor ventures,
1978-1988. Administrative Science Quarterly, 504-529.

39
Erhardt, N. L., Werbel, J. D., & Shrader, C. B. (2003). Board of director diversity and
firm financial performance. Corporate governance: An international review, 11(2), 102-
111.
Euronext (2016) Euronext. Available in: https://www.euronext.com
Finkelstein, S., Hambrick, D. C., & Cannella, A. A. (2009). Strategic leadership: Theory
and research on executives, top management teams, and boards. Oxford University Press,
USA.
Foo, M. D. (2010). Member experience, use of external assistance and evaluation of
business ideas. Journal of Small Business Management, 48(1), 32-43.
Granovetter, M. S. (1973). The strength of weak ties. American Journal of Sociology,
1360-1380.
Hayes, A. F. (2013). Introduction to mediation, moderation, and conditional process
analysis: A regression-based approach. Guilford Press.
Haleblian, J., & Finkelstein, S. (1993). Top management team size, CEO dominance, and
firm performance: The moderating roles of environmental turbulence and discretion.
Academy of Management Journal, 36(4), 844-863.
Hambrick, D. C. (1987). The top management team: key to strategic success. California
Management Review, 30(1), 88-108.
Hambrick, D. C. (2007). Upper Echelons Theory: An update. Academy of management
review, 32(2), 334-343.

40
Hambrick, D. C., & D'Aveni, R. A. (1992). Top team deterioration as part of the
downward spiral of large corporate bankruptcies. Management Science, 38(10), 1445-
1466.
Hambrick, D. C., Davison, S. C., Snell, S. A., & Snow, C. C. (1998). When groups
consist of multiple nationalities: Towards a new understanding of the implications.
Organization Studies, 19(2), 181-205.
Hambrick, D. C., & Mason, P. A. (1984). Upper echelons: The organization as a
reflection of its top managers. Academy of Management Review, 9(2), 193-206.
Harrison, E. F. (1975). The managerial decision-making process. Boston: Houghton
Mifflin.
Hart, P., & Mellors, J. (1970). Management youth and company growth: a correlation?.
Management Decision, 4(1), 50-53.
Heidrick, & Struggles (2014), Towards dynamic governance 2014. European Corporate
Governance Report.
Hellmann, T., & Puri, M. (2002). Venture capital and the professionalization of start‐up
firms: Empirical evidence. The Journal of Finance, 57(1), 169-197.
Heyden, M. L., Van Doorn, S., Reimer, M., Van Den Bosch, F. A., & Volberda, H. W.
(2013). Perceived environmental dynamism, relative competitive performance, and top
management team heterogeneity: examining correlates of upper echelons’ advice-seeking.
Organization Studies, 34(9), 1327-1356.

41
Hill, G. W. (1982). Group versus individual performance: Are N+ 1 heads better than
one?. Psychological Bulletin, 91(3), 517.
Hoffman, L. R., & Maier, N. R. (1961). Quality and acceptance of problem solutions by
members of homogeneous and heterogeneous groups. The Journal of Abnormal and Social
Psychology, 62(2), 401.
Hofstede G. (1980). Culture’s Consequences: International Differences in Work-related
Values, Sage: Beverly Hills, CA.
Hofstede, G., Hofstede, G. J., & Minkov, M. (1991). Cultures and organizations:
Software of the mind (Vol. 2). London: McGraw-Hill.
Jackson, S. E. (1992). Consequences of group composition for the interpersonal
dynamics of strategic issue processing. Advances in Strategic Management, 8(3), 345-382.
Jackson, S. E., May, K. E., & Whitney, K. (1995). Understanding the dynamics of
diversity in decision-making teams. Team Effectiveness and Decision Making in
Organizations, 204, 261.
Jackson, S. E., Brett, J. F., Sessa, V. I., Cooper, D. M., Julin, J. A., & Peyronnin, K.
(1991). Some differences make a difference: Individual dissimilarity and group
heterogeneity as correlates of recruitment, promotions, and turnover. Journal of Applied
Psychology, 76(5), 675.
Jaw, Y. L., & Lin, W. T. (2009). Corporate elite characteristics and firm's
internationalization: CEO-level and TMT-level roles. The International Journal of Human
Resource Management, 20(1), 220-233.

42
Joecks, J., Pull, K., & Vetter, K. (2013). Gender Diversity in the Boardroom and Firm
Performance: What exactly constitutes a ‘‘critical mass?’’. Journal of Business Ethics,
118(1), 61–72.
Jurkus, A. F., Park, J. C., & Woodard, L. S. (2011). Women in top management and
agency costs. Journal of Business Research, 64(2), 180-186.
Kaczmarek, S., & Ruigrok, W. (2013). In at the deep end of firm internationalization.
Management International Review, 53(4), 513-534.
Kang, H., Cheng, M., & Gray, S. J. (2007). Corporate governance and board
composition: Diversity and independence of Australian boards. Corporate Governance: An
International Review, 15(2), 194-207.
Keats, B. W., & Hitt, M. A. (1988). A causal model of linkages among environmental
dimensions, macro organizational characteristics, and performance. Academy of
Management Journal, 31(3), 570-598.
Knockaert, M., Bjornali, E. S., & Erikson, T. (2015). Joining forces: Top management
team and board chair characteristics as antecedents of board service involvement. Journal
of Business Venturing, 30(3), 420-435.
Krishnan, H. A., & Park, D. (2005). A few good women—on top management teams.
Journal of Business Research, 58(12), 1712-1720.
Kroll, M., Walters, B. A., & Le, S. A. (2007). The impact of board composition and top
management team ownership structure on post-IPO performance in young entrepreneurial
firms. Academy of Management Journal, 50(5), 1198-1216.
43
Maroco, J. (2007). Análise Estatística – Com Utilização do Spss, 3ª edição. Lisboa:
Edições Sílabo.
Martins, L. L., Milliken, F. J., Wiesenfeld, B. M., & Salgado, S. R. (2003). Racioethnic
Diversity and Group Members’ Experiences The Role Of The Racioethnic Diversity Of
The Organizational Context. Group & Organization Management, 28(1), 75-106.
Michel, J. G., & Hambrick, D. C. (1992). Diversification posture and top management
team characteristics. Academy of Management Journal, 35(1), 9-37.
Milliken, F. J., & Martins, L. L. (1996). Searching for common threads: Understanding
the multiple effects of diversity in organizational groups. Academy of Management Review,
21(2), 402-433.
Monga, M. Meaning of integrity from the echelons perspective. Journal of
Developing Areas, 50, 333-340.
Nielsen, B. B., & Nielsen, S. (2013). Top management team nationality diversity and
firm performance: A multilevel study. Strategic Management Journal, 34(3), 373-382.
Nishii, L. H., Gotte, A., & Raver, J. L. (2007). Upper echelon theory revisited: The
relationship between upper echelon diversity, the adoption of diversity practices, and
organizational performance.
Olson, B. J., Parayitam, S., & Twigg, N. W. (2006). Mediating role of strategic choice
between top management team diversity and firm performance: Upper Echelons Theory
revisited. Journal of Business and Management, 12(2), 111.

44
Palmer, T. M., & Varner, I. I. (2007). A comparison of the international diversity on top
management teams of multinational firms based in the United States, Europe, and Asia:
Status and implications. Singapore Management Review, 29(1), 1.
Pegels, C. C., Song, Y. I., & Yang, B. (2000). Management heterogeneity, competitive
interaction groups, and firm performance. Strategic Management Journal, 21(9), 911-923.
Pestana, M.H. and Gageiro, J.N. 2005. Análise de Dados para Ciências Sociais – A
complementaridade do SPSS, 4ª edição, Lisboa: Edições Sílabo.
Post, C., & Byron, K. (2015). Women on boards and firm financial performance: A
meta-analysis. Academy of Management Journal, 58(5), 1546-1571.
Qu, W. G., Pinsoneault, A., & Oh, W. (2011). Influence of industry characteristics on
information technology outsourcing. Journal of Management Information Systems, 27(4),
99-128.
Ren, T., & Wang, Z. (2011). Female participation in TMT and firm performance:
evidence from Chinese private enterprises. Nankai Business Review International, 2(2),
140-157.
Reguera-Alvarado, N., Fuentes, P., & Laffarga, J. (2015). Does board gender diversity
influence financial performance? Evidence from Spain. Journal of Business Ethics, 1-14.
Robinson, G., & Dechant, K. (1997). Building a business case for diversity. The
Academy of Management Executive, 11(3), 21-31.
Rose, C. (2007). Does female board representation influence firm performance? The
Danish evidence. Corporate Governance: An international review, 15(2), 404-413.

45
Rosenzweig, P. (1998). Managing the new global workforce: Fostering diversity, forging
consistency. European Management Journal, 16(6), 644-652.
Ruiz-Jiménez, J. M., & del Mar Fuentes-Fuentes, M. (2016). Management capabilities,
innovation, and gender diversity in the top management team: An empirical analysis in
technology-based SMEs. BRQ Business Research Quarterly, 19(2), 107-121.
Shaw, M. E. (1981) Group dynamics: The psychology of small group behaviour (3) New
York: McGraw-Hill.
Shaw, M. E., & Harkey, B. (1976). Some effects of congruency of member
characteristics and group structure upon group behavior. Journal of Personality and Social
Psychology, 34(3), 412.
Shull, F. A., Delbecq, A. L., & Cummings, L. L. (1970) Organizational decision making.
New York: McGraw-Hill, p.31.
Spencer Stuart (2014) Board index 2013. Available in: www.spencerstuart.com
Song, M., Podoynitsyna, K., Van Der Bij, H., & Halman, J. I. (2008). Success factors in
new ventures: A meta‐analysis. Journal of Product Innovation Management, 25(1), 7-27.
Smith, N., Smith, V., & Verner, M. (2006). Do women in top management affect firm
performance? A panel study of 2,500 Danish firms. International Journal of productivity
and Performance management, 55(7), 569-593.
Steiner, I. D. (1972). Group process and productivity. New York: Academic Press.

46
Ting, I. W. K., Azizan, N. A. B., & Kweh, Q. L. (2015). Upper Echelon Theory
Revisited: The Relationship between CEO Personal Characteristics and Financial Leverage
Decision. Procedia-Social and Behavioral Sciences, 195, 686-694.
Torchia, M., Calabro`, A., & Huse, M. (2011). Women directors on Corporate Boards:
From tokenism to critical mass. Journal of Business Ethics, 102(2), 299–317.
Tyson, L. (2003). The Tyson report on the recruitment and development of non-executive
directors. London Business School, London, June.
Ucbasaran, D., Lockett, A., Wright, M., & Westhead, P. (2003). Entrepreneurial founder
teams: Factors associated with member entry and exit. Entrepreneurship Theory and
Practice, 28(2), 107-128.
Unite, A. A., Sullivan, M. J., & Shi, A. A. (2015). Women on Top: Diversity in Gender
and Education Profiles of Top Management and Board of Directors of Philippine Publicly
Traded Firms.
Valsan, R. Gender Diversity in the Boards of Directors: A Corporate Governance
Perspective.
Yuan-qiong H., Wen Y., Yun C. (2009). An Empirical Research of the Relationship
between Top Management Team Size and Firm Performance in China's Uncertain
Environment. Academic Journal, 31(2), 53-59.
Walt, N., & Ingley, C. (2003). Board dynamics and the influence of professional
background, gender and ethnic diversity of directors. Corporate Governance: An
International Review, 11(3), 218-234.

47
Watson, W. E., Kumar, K., & Michaelsen, L. K. (1993). Cultural diversity's impact on
interaction process and performance: Comparing homogeneous and diverse task groups.
Academy of Management Journal, 36(3), 590-602.
Wiersema, M. F., & Bantel, K. A. (1992). Top management team demography and
corporate strategic change. Academy of Management Journal, 35(1), 91-121.
Williams, K., & O’Reilly, C. (1998). Forty Years of Diversity Research: A Review, in B.
M. Staw and L. L. Cummings (eds.), Research in Organizational Behavior (JAI Press,
Greenwich, CT), pp. 77–140.
Wright, M., Hmieleski, K. M., Siegel, D. S., & Ensley, M. D. (2007). The role of human
capital in technological entrepreneurship. Entrepreneurship Theory and Practice, 31(6),
791-806.

48
This page was intetionally left blank

49
Appendices
Appendices 1 – Companies of Sample
Number Name of Company (Sample)
1 EDP - ENERGIAS DE PORTUGAL, S.A.
2 GALP ENERGIA, SGPS, S.A.
3 JERÓNIMO MARTINS - SGPS, S.A.
4 SONAE - S.G.P.S., S.A.
5 MOTA - ENGIL, SGPS, S.A.
6 SEMAPA - SOCIEDADE DE INVESTIMENTO E GESTÃO, SGPS, S.A.
7 SONAE INDÚSTRIA, SGPS, S.A.
8 THE NAVIGATOR COMPANY, S.A.
9 INAPA - INVESTIMENTOS, PARTICIPAÇÕES E GESTÃO, S.A.
10 SAG GEST - SOLUÇÕES AUTOMÓVEL GLOBAIS, SGPS, S.A.
11 SONAECOM - S.G.P.S., S.A.
12 NOS, SGPS, S.A.
13 REN - REDES ENERGÉTICAS NACIONAIS, SGPS, S.A.
14 MARTIFER - S.G.P.S., S.A.
15 ALTRI, SGPS, S.A.
16 TOYOTA CAETANO PORTUGAL, S.A.
17 CORTICEIRA AMORIM, SGPS, S.A.
18 SUMOL + COMPAL, S.A.
19 IMPRESA - SOCIEDADE GESTORA DE PARTICIPAÇÕES SOCIAIS, S.A.
20 ESTORIL-SOL, SGPS, S.A.
21 GRUPO MÉDIA CAPITAL - SGPS, S.A.
22 NOVABASE - SOCIEDADE GESTORA DE PARTICIPAÇÕES SOCIAIS,
S.A.
23 IBERSOL - SGPS, S.A.
24 COFINA - SGPS, S.A.
25 GLINTT - GLOBAL INTELLIGENT TECHNOLOGIES, S.A.
26 CONDURIL - ENGENHARIA, S.A.
27 REDITUS - SOCIEDADE GESTORA DE PARTICIPAÇÕES SOCIAIS, S.A.
28 F.RAMADA - INVESTIMENTOS, SGPS, S.A.
29 VAA - VISTA ALEGRE ATLANTIS, SGPS, S.A.
30 SPORT LISBOA E BENFICA - FUTEBOL, SAD
31 OLIVEIRA & IRMÃO, S.A.

50
32 FUTEBOL CLUBE DO PORTO, FUTEBOL, SAD
33 SPORTING CLUBE DE PORTUGAL - FUTEBOL, SAD
34 LISGRÁFICA - IMPRESSÃO E ARTES GRÁFICAS, S.A.
35 COPAM - COMPANHIA PORTUGUESA DE AMIDOS, S.A.
36 COMPTA - EQUIPAMENTOS E SERVIÇOS DE INFORMÁTICA, S.A.
37 CIPAN - COMPANHIA INDUSTRIAL PRODUTORA DE ANTIBIÓTICOS,
S.A.
38 LITHO FORMAS, S.A.
39 SPORTING CLUBE DE BRAGA - FUTEBOL, SAD
40 SONAGI, SGPS, S.A.
41 IMOBILIÁRIA CONSTRUTORA GRÃO-PARÁ, S.A.

51
Appendices 2 - Evolution of gender 2011 – 2015
Year Mean of women Mean of Male
2011 .37 4.37
2012 .59 4.54
2013 2.98 16.24
2014 2.88 17.51
2015 4.34 21.90

52
Appendices 3 - Board Size Evolution 2011 – 2015
Year Mean of board size Standard deviation
2011 4.73 1.582
2012 5.12 1.269
2013 19.22 8.119
2014 20.39 6.324
2015 26.24 15.644

53
This page was intetionally left blank