Gender and Scientific Dissemination in Public and Private ...
42
Gender and Scientific Dissemination in Public and Private Science: A Multivariate and Network Approach Kjersten C. Bunker Whittington Department of Sociology Stanford University Stanford, CA 94305 [email protected] February 2006 Draft submitted for publication in the NBER/SEWP “Women and Underrepresented Minorities in S&E” conference proceedings. I wish to thank Walter Powell, Jason Owen-Smith, Laurel Smith-Doerr, Michael Rosenfeld, Cecilia Ridgeway, Justine Tinkler, and Stefanie Mollborn for their helpful comments and feedback on this project. This research is based upon work supported by a National Bureau for Economic Research (NBER) Dissertation Fellowship from the Science and Engineering Workforce Project, as well as an Association for Institutional Research (AIR) grant. Any opinions, findings, conclusions or recommendations expressed in this publication are those of the author(s) and do not necessarily reflect the views of NBER or AIR. Any remaining errors are, of course, my own.
Transcript of Gender and Scientific Dissemination in Public and Private ...

Gender and Scientific Dissemination in Public and Private Science:
A Multivariate and Network Approach
Kjersten C. Bunker Whittington
Department of Sociology Stanford University Stanford, CA 94305
February 2006
Draft submitted for publication in the NBER/SEWP “Women and Underrepresented Minorities in S&E” conference proceedings. I wish to thank Walter Powell, Jason Owen-Smith, Laurel Smith-Doerr, Michael Rosenfeld, Cecilia Ridgeway, Justine Tinkler, and Stefanie Mollborn for their helpful comments and feedback on this project. This research is based upon work supported by a National Bureau for Economic Research (NBER) Dissertation Fellowship from the Science and Engineering Workforce Project, as well as an Association for Institutional Research (AIR) grant. Any opinions, findings, conclusions or recommendations expressed in this publication are those of the author(s) and do not necessarily reflect the views of NBER or AIR. Any remaining errors are, of course, my own.

“Gender and Scientific Dissemination in Public and Private Science: A Multivariate and Network Approach”
Research on gender differences in productivity rarely includes scientists outside of academia, or focuses
on outcomes beyond scholarly publications. This paper addresses the extent to which gender, discipline
and employment sector disparities exist in the propensity to engage in publishing and patenting behavior.
I use log linear modeling to analyze the 1990-1995 publishing and patenting activities of scientists
working in three disciplines (life sciences, physical sciences, and engineering) and three employment
sectors (four-year universities, government, and industry). Empirical evidence suggests that gender
differences in involvement in dissemination activities cannot be attributed solely to the structural
locations and organizations where women are located. In addition, the models suggest that academic life
scientists experience a greater degree of gender disparity than industry life scientists, other things being
equal. Given these results, I explore the ways in which employment sector context may differentially
influence male and female scientists. Using patent data on US inventors in the life sciences across two
decades, I present co-inventor collaboration networks of university and industry inventors. The network
visualizations provide evidence that the structure of productivity mimics the structure of science across
industry and academia, and as such have important implications for the nature of gender disparities in
these work settings. I discuss these results and provide suggestions for future research.

Bunker Whittington – Page 1
1. Introduction
Information on the patenting and publishing activity of scientists and engineers has long
been an interest among scholars of science and technology. Publishing transmits valuable
knowledge and resources to other scientists, both in the academy and in industry, while patenting is
thought to spur innovation through economic and proprietary incentives. Traditionally, scientists
within academia have primarily published, shying away from pursuing economic ends through
patenting or other marketable ventures, while industrial scientists have predominantly pursued
commercial goals. Over the past two decades, however, federal promotion of technology transfer
by universities and the increased reliance of outside business firms on academic research have
created a strong link between science and technology through the commercialization of university
research (Rosenberg and Nelson 1993; Cohen, Florida, and Goe 1994; Owen-Smith 2000). At the
same time, in some sectors there is much greater involvement in basic research by industry (Powell
and Owen-Smith 1998). Academic patenting has increased 700% since 1980 (Owen-Smith 2000),
and now over 5% of all granted patents are assigned to universities (Jaffe 2000). Recent interviews
by Kleinman and Vallas (2005) suggest that tenure decisions may even one day ride on scientists’
patents or degree of commercial involvement. Conversely, some of the most highly cited articles
in the biological sciences are published by scientists in industry (Powell et al 1996; Stephan 1996;
Zucker et al 1998).
Past studies of scientific dissemination have focused largely on academic publishing, but
the changing landscape of science suggests the need to broaden dissemination measures to include
commercial ventures, and to consider scientists from a variety of employment sectors. In addition,
while recent work provides a starting point to understand how increases in academic-industry
relations shape faculty careers and identity, previous investigations leave the contemporary actions
and rationale of female scientists largely unaddressed.
The broader focus of this work is on explaining how these changes have influenced
women’s careers and work in the sciences. Previous literature clearly documents that science as an

Bunker Whittington – Page 2
institution exists in the face of great inequality (Long and Fox 1995). The fact that women face a
special series of barriers to entry and success in the realm of their scientific careers is well
recognized. Women are less likely to participate in science, have less prestigious positions, and
have received less recognition than their white male counterparts (Zuckerman and Cole 1975;
Reskin 1977; Fox 1995). Female scientists have traditionally published (Cole 1979; Fox 1983;
Cole and Zuckerman 1984; Xie and Shaumann 1998; Long 2001) and patented (Morgan et al.
2001, Bunker Whittington and Smith-Doerr 2005) less than majority males in the sciences. Studies
show that at all levels, there is a great disparity in the career attainments and opportunities of
female scientists (Etzkowitz et al. 2000). While past research on scientific women documents their
many structural and socialized constraints (see Long and Fox, 1995, for a review of the literature),
little work has investigated male and female scientists outside of the academic realm, or focused on
productivity outcomes beyond publications. Assessing the effects of organizational context on
multiple forms of dissemination is of great importance as scholars begin to sort out the
contemporary pushes, pulls, and constraints operating on female scientists in an era where
commercial and academic science are much more closely linked.
Gender, Scientific Location, and Dissemination
The persistence of gender inequities in scientific dissemination over the past two decades
has received much attention among scholars of science. Publications and/or patents are generally
taken as an indication of a scientist’s research capabilities, and as such are an important
determinant of career outcomes. Whether or not, and the degree to which, a scientist is active in
publishing or patenting are particularly defining signals of her research and development goals.
Although researchers have proposed many explanations for the productivity differences
between men and women, early research efforts that focused on individual status characteristics
have been unable to fully account for variation in publication output (Zuckerman 1991; Long and
Fox 1995; Ward and Grant 1995). Characterized most famously by Cole and Zuckerman (1984),

Bunker Whittington – Page 3
this inequity has traditionally been referred to as the female “productivity puzzle.” Much of the
early research, however, fails to consider how resource distribution, job placement, and the
structure of academic work is gendered. Organizational context likely plays an important role in
gender equality, as successful scientific work relies on equal access to facilities and funds,
available help, and a supportive research environment (Fox 2000). Indeed, in a recent study, Xie
and Shaumann (1998) are able to render much of the direct effects of gender on publication
productivity insignificant by taking into account organizational and family context. They suggest
that the traditional “productivity puzzle” should be replaced with a new puzzle to explain
differences in personal and structural characteristics.
By focusing solely on faculty members, however, previous research neglects a significant
part of the scientific population, and also an understanding of how the existing organization of
academic life compares with that of other science and technology sectors. While numerous studies
have contributed to our understanding of inequality among scientists, most have concentrated on
either one type of science or another, combined similar sciences together (often in an attempt to
increase the small percentages of women in their sample), or controlled for discipline or
employment sector effects irrespective of their joint interaction with gender. In addition, few
analyses have concentrated on how these contexts may affect male and female scientists
differentially (Fox 1985).
This issue is particularly important as there has been a slow but steady increase in the
percentage of scientists working beyond the academic sector (Long 2001). Historically, industry
has been seen as separate from and less prestigious than academia (Zuckerman 1970), yet it has
also provided some women with favorable workplace incentives (such as flexibility and higher
mobility) not present in the academy (Long and Fox 1995; Aisenberg and Harrington 1988). In the
past there has been speculation that women make a tradeoff in prestige for the slight advantages
available in industry (Etzkowitz 2000). Recently, however, scholars are recognizing that careers
outside the academy are growing in numbers and in prestige, as well as offering increased

Bunker Whittington – Page 4
incentives for those women who choose to leave the academy (Smith-Doerr 2004b; Rabinow
1996). Growth in university-industry relations has increased contact between academic and
industrial researchers, altering the dissemination and productivity paths of scientists outside of
academia. Whether this changing context has had a differential effect on male and female
scientists is unclear, as measures of inequality among industrial scientists are lacking. Recent work
by Smith-Doerr (2004a) shows that male and female scientists tend to hold comparable
management positions in industrial biotechnology firms. Past research by Long, Allison and
McGinnis (1993) shows a causal relationship between academic rank and dissemination, with
higher-producing scientists receiving more returns to career advance. We might expect that similar
processes may be acting upon industrial scientists, and as such, gender differences in involvement
among them may be smaller than their academic counterparts. To the extent that gender
differences in research productivity are the result of the different positions women hold, rather than
differences in capability or motivation, one can expect the gender gap in dissemination
involvement to vary across organizational contexts and scientific programs as well.
Gender and Patenting
It is important to consider the effects of organizational context on gender disparities for not
just publishing, but patenting activities as well. While commercial activity is often a given in
industrial firms, research by Owen-Smith and Powell (2001) suggests that commercial involvement
among academic scientists represents “the appearance of a new fault line” between those involved
and those who choose not to participate (109). Like publishing, women tend to patent less than
their male counterparts (Morgan et al. 2001; Bunker Whittington and Smith-Doerr 2005), but the
ways in which commercial dissemination may represent a new arena for gender disparities remain
largely unexplored.
This work builds upon my previous research with Smith-Doerr (2005), which finds gender
disparities in commercialization among life scientists to vary across work settings. Using a

Bunker Whittington – Page 5
combination of career history data and patenting information for a sample of life scientists across a
period of two decades, we find that female scientists engage in and produce less commercial work
than male scientists, and that the degree of gender disparity remains relatively constant across
time.1 Importantly, however, gender differences in commercial involvement are greatest in
academia, where the percentage of men involved more than doubles that of women. Although
women patent less than men in industry as well, it is a much smaller difference.
This previous research provides a starting place to address how dissemination varies across
sector, and has several implications for future work. First, the focus on a sample of life scientists
leaves the broader context of discipline unaddressed. In addition, the descriptive statistics do not
move beyond simple relationships between patenting and sector. Lastly, I have not focused on how
these results apply to publishing behavior as well. It would be preferable to know the extent to
which these findings are generalizable across disciplines and work settings, and whether they apply
to multiple dissemination outcomes.
The present work tackles these issues with a two-part analysis. The first analysis addresses
the relationship between organizational context and gender on a macro-level across 3 disciplines
and 3 employment sectors. I present log linear models of patenting and publishing activity using a
nationally representative sample of doctoral recipients in several sectors and disciplines. I
investigate the extent to which employment sector differences exist in a national population of
scientists and engineers from various disciplines, and for publishing as well as patenting.
Specifically, I address the following questions: Does male and female propensity to patent and
publish vary by type of science and employment sector? Is there a gender gap after controlling for
the distribution of males and females into lower or higher producing sciences and sectors? In sum,
what is the association between gender, discipline, employment sector, and involvement in
scientific dissemination?
1 The quality and impact of women’s commercial work remains the same or better than that of male scientists, however.
Bunker Whittington – Page 6
In the second part I explore the ways in which various organizational contexts may
differentially influence male and female scientists, highlighting the specific case of life scientists
working in the Boston region, one of the most active and fertile areas in the world for
biotechnology (Owen-Smith and Powell 2004, Porter, Bunker Whittington and Powell 2005).
Using NBER patent data on US inventors across time, I present network visualizations that depict
co-inventor collaborations of university and industry life science inventors. I suggest how the
structure of science within each sector may contribute to existing trends in gender differences in
productivity. Combined, the two analyses have important implications for the effects of
organizational context on productivity.
2. Analysis 1
Survey Data and Measures
To examine the relationship between scientific dissemination and gender, type of science,
and employment sector at the most macro level, I analyze data from the 1995 National Science
Foundation’s Survey of Doctoral Recipients (SDR).2 The SDR incorporates a complex survey
design that stratifies respondents by scientific discipline, employment sector, receipt of a doctoral
degree, and demographic variables. When weighted, SDR data characterizes a nationally
representative population of individuals trained and/or working as scientists or engineers between
1990 and 1995.3 The SDR includes scientists working across a variety of employment sectors and
disciplines, making it a useful dataset to address these research questions.
For this analysis I focus only on scientists whose principal work responsibilities include
research and development. The SDR asked respondents to indicate the primary and secondary
work activities on which they “spend the most hours during a typical work week.”4 I restrict the
2 The SDR population consists of all individuals under the age of 76 who received a research doctorate in science or engineering from a United States institution prior to June 1994 and who resided in the United States as of April 1995. 3 All results and data presented here incorporate weighted sample statistics. 4 Scientists could choose from the following work activities: 1) accounting, 2) applied research, 3) basic research, 4) computer applications, programming, or system development, 5) development, 6) design of equipment, processes or

Bunker Whittington – Page 7
sample of scientists to those who listed applied and basic research, development or design as their
primary work activity in order to reduce the potential of finding dissemination variation due to
differences among scientists’ primary work activities. Limiting the sample to scientists who
indicate that the majority of their time is spent on research and development helps to address
concerns over unequal allotments of work activities among male and female scientists in similar
positions (for example, variations in teaching loads or committees, management responsibilities,
etc).5
Measures
Dissemination activity is measured by combining responses to two survey questions.
Scientists were asked whether or not they had been named as an inventor on 1) a U.S. patent
application and 2) as an author or co-author on a peer-reviewed published paper, in the past five
years. These two variables were combined to make one variable with four categories: 1)
respondent neither published nor patented, 2) respondent published, but did not patent, 3)
respondent patented, but did not publish, and 4) respondent both published and patented.6
Scientists are classified by what NSF terms “major employment sector,” that is, two-year
colleges, four-year colleges, government, or business/industry. Institutions designated as four-year
colleges include baccalaureate and master’s institutions, and Research I and II universities. The
industrial sector includes private, for-profit companies, as well as scientists who are self-employed.
Most scientists within the government sector are federal workers; however, state and local
models, 7) employee relations including recruitment, training, or personal development, 8) managing and supervising, 9) production or operations, 10) professional services, 11) sales, purchasing, marketing, customer service, or public relations, 11) quality assurance, 12) teaching, or 13) other. 5 In addition, only scientists who are working full time are included in the sample. Part-time scientists may not have an equal opportunity to publish and patent to the same degree as compared to their full-time counterparts. The percentage of scientists who work part time while engaging in research and development as a primary work activity is small (3.6% of the sample (N = 636)). Models run with and without part-time scientists do not differ qualitatively. All coefficients have the same sign and significance, and magnitudes are negligibly different. 6 Across and within sectors, disciplines vary in their propensity to publish and patent. Using a measure of publications and patents accrued over a period of five years may seem stringent for some fields and too lengthy for others. Because this analysis controls for distributions across discipline and sector, however, it is possible to compare scientists within fields and sectors without having to choose a global average across fields.

Bunker Whittington – Page 8
government scientists are included as well. For the purposes of this paper, however, government is
included largely as a control.
In addition, scientists are placed in one of six disciplines according to the type of science
they perform in their current job. These categories are computer and mathematical sciences, life
sciences, physical sciences, social sciences, engineering, and non-scientific occupations. For this
analysis, I excluded scientists who worked at two-year colleges, as well as those located in
computer sciences, the social sciences or in non-science or non–engineering disciplines.
Theoretically, I am mainly concerned with scientific occupations that produce research that is
potentially patentable as well as publishable. Although publications may be common, non-
scientific occupations and the social sciences are not oriented towards commercialization in the
same way other sciences are (for example, only 0.4% (N=7) of social scientists in the sample
patent).7 Computer science faces a different issue. Its path-breaking technology moves at a much
faster pace in both discovery and development than other sciences. As such, transmission of
knowledge in computer science frequently requires routes that are much faster than the average
two-year lag between a filed and issued patent. Often computer science and similar fields resort to
other methods of dissemination such as trade secrets, publishing, or copyright to preserve property
rights and/or transmit new knowledge.
Once all variables and constraints are taken into account, the final sample for this analysis
consists of 10,144 scientists, 16.5% of whom are female. There are no missing data.
Survey Statistics
Table 1 presents weighted summary statistics on the sample’s participation in publishing
and patenting activities, broken down by employment sector. The table shows that scientists vary 7 However, because women represent a greater percentage of social and behavioral scientists than they do in the natural, physical, and engineering sciences, it is important to know how the exclusion of this group may bias the analysis. The majority of social scientists publish only or disseminate nothing (54.5% and 44.7%, respectively), and differences between men and women are small (although higher in academia than industry). Because very few members of these groups have a propensity to patent, many cells in the contingency table are small in count or have no activity at all. This sparseness ultimately causes methodological problems in the stability of the log linear models that cannot be resolved. While instable, models run with and without social scientists yield coefficients similar in sign, magnitude, and significance, and the substantive findings of this work remain the same.

Bunker Whittington – Page 9
in their propensity to publish and patent. Involvement in commercial activity remains an activity
pursued by a minority of the scientific population. The majority of all scientists, male and female,
tend to have only published, if at all, between 1990 and 1995. Approximately 25% of the national
population of scientific doctorates indicated that they had patented between 1990 and 1995. This
percentage is heavily skewed by the higher rates of industrial patenting, however. About 15% of
university scientists had patented in the period leading up to 1995, as compared with 39% of
industrial scientists.8
---------------------------------------- TABLE 1 ABOUT HERE
----------------------------------------
As Table 1 shows, male and female scientists have similar preferences for patenting and
publishing, although female participation differs from that of male scientists in a few notable areas.
First, a higher percentage of women than men only published. This is true in both academic and
industrial settings, although the largest difference among men and women in publishing only
occurs in industry. In addition, the 1995 SDR data echoes previous findings of commercial
participation, that female scientists participate less in patenting than male scientists (Morgan et al.
2001; Bunker Whittington and Smith-Doerr 2005). Approximately 13% of women as compared
with 21% of men patented by 1995. These sample statistics suggest the same result as that of the
life science sample mentioned above – that the majority of this disparity comes from the academic
sector. The proportion of male scientists involved in patenting is about twice that of female
academic scientists. Industrial male and female scientists, on the other hand, appear to be more
similar regarding commercialization. Women are only slightly less likely to participate in both
patenting and publishing activities (29% versus 25%).
The above descriptive statistics suggest the need to further investigate the effects of male
and female locations on dissemination activity. While women are less likely to engage in
8 The three disciplines also vary somewhat in their propensity to publish and patent. Engineers are more likely than life or physical scientists to patent in the university (24% versus 13% and 12%, respectively), and physical scientists are slightly more likely to patent in industry than engineers and life scientists (46% versus 38% and 31%, respectively).

Bunker Whittington – Page 10
commercial behavior, once sorted by sector the dissemination trends among male and female
scientists diverge. What effect does location have on female dissemination activity once the
distribution of women and men across disciplines is addressed? Moreover, how do documented
gender disparities in dissemination change after accounting for location and organizational context?
I turn to these questions below.
Survey Models and Methods of Estimation
To study publishing and patenting behavior by gender, discipline, and employment sector,
I use log linear models that identify the associations among these variables independent of the
marginal distributions of males and females across sciences and sectors. The primary objective of
log linear analysis is to determine if the distribution of counts among the cells of a table have an
underlying structure. With the case of gender and dissemination, we can make several predictions
about how the distribution of women and men in sciences and sectors may shape the degree to
which women participate in various scientific dissemination activities.
This methodology is both useful and necessary for this type of analysis because it permits
the modeling of relationships between two or more categorical variables. Rather than specify only
one outcome variable and several explanatory ones, log linear modeling allows one to study the
association patterns among all of the variables. This method is especially practical for this analysis
because it allows for the complexities of association linkages among all of the variables, rather
than looking solely at the effects of each variable on a single outcome. Log linear modeling
accounts for the inter-relationships between science, sector, gender and dissemination.
Importantly, log linear modeling provides a method by which to estimate the effects of multiple-
order interactions in conjunction with and controlling for the effects of other multiple-order
interactions.9
9 One possible reason for the lack of research addressing joint program and sector effects on gender and dissemination is the methodological difficulty of multiple third-order interactions. Log linear analysis provides a way to account for these multi-level interactions, simultaneously.

Bunker Whittington – Page 11
To examine these relationships, the scientific dissemination table was cross-classified by
gender, employment sector, and discipline. There are 72 cells in the dataset (4 (dissemination) x 2
(gender) x 3 (employment sector) x 3 (discipline)). Table 2 presents the seven nested models in
this analysis. In simplified hierarchical terms, they can be presented as follows:
(1) Log (U) = Constant (2) Log (U) = Model 1 + patpub + gender + discipline + empsectr (3) Log (U) = Model 2 + patpub x discipline + patpub x empsectr
+ discipline x empsectr + patpub x discipline x empsectr (4) Log (U) = Model 3 + gender x patpub (5) Log (U) = Model 4 + gender x empsectr x discipline
(6) Log (U) = Model 5 + gender x patpub x discipline + gender x patpub x discipline
(7) Log (U) = Model 6+ gender x patpub x empsectr x discipline
where only the highest-order terms are listed, and the lower-order terms are assumed. Here U is
the predicted number of scientists, discipline is the scientific discipline, empsectr is the
employment sector, patpub is patenting and publishing activity, and gender is the whether the
respondent is male or female.
------------------------------------- TABLE 2 ABOUT HERE
------------------------------------- Model Results
Table 2 presents the results from a series of log linear models, in which the associations
between gender, discipline, employment sector, and dissemination activity are estimated from the
data. Models 1 and 2 in Table 2 account for the constant-only model and the direct effects of the
variables. The direct effects model accounts for dissemination, gender, type of science, and
employment sector without making any assumptions about the relationships between the variables.
The likelihood-ratio (LR) chi-square for Model 2 is 4,903 with 63 degrees of freedom. As is to be
expected, this model fits very poorly by both the likelihood ratio test and by the Bayesian

Bunker Whittington – Page 12
Information Criterion (BIC).10 This is not surprising because Model 2 makes the unlikely
assumption that scientists are distributed evenly across sectors and programs, and disseminate
equally without effects from these areas.
The third model adds 28 terms to account for the effects of differential dissemination rates
across disciplines and employment sectors, and the distribution of scientists across combinations of
fields and sectors. Model 3 considerably reduces the goodness-of-fit chi-square from 4,903 to
1,085, but it still does not pass the likelihood ratio test or meet the BIC criterion. Model 4 adds
three more terms to the existing model to account for the effects of gender on dissemination. This
additional factor reduces the goodness-of-fit chi-square (from 1,085 to 891), and significantly
improves the fit of the model, but it is not yet a well-fitting model by either LR or BIC criteria.
This improvement, however, indicates the presence of differential dissemination trends among the
sexes.
Model 5 includes 8 additional terms for the three-way interaction between gender,
employment sector, and discipline, which accounts for the distribution of women across sectors and
sciences. The addition of these terms drastically reduces the goodness-of-fit chi-square, from 891
to 44. With a p value of 0.001, this model’s significance gets closer to, but not above, the 5%
probability threshold needed to reject the LR test. Model 5 is the first model that achieves a good
fit by the BIC criterion (-177.7). The significant increase in fit indicates the importance of
accounting for the different locations of male and female scientists when analyzing dissemination.
The significance of Model 5 suggests that aside from the uneven distribution of scientists across
sectors and disciplines (Model 3), female scientists have their own unique pattern of location.
Apart from gender distribution, however, disciplines and sectors may have differential
effects on male and female dissemination. The next two models test whether or not gender
10 The BIC calculates the goodness of fit in terms of how the data compares to the saturated model. When the BIC is negative, it is considered better than the saturated model (Raftery 1986). Although generally accepted in the literature as a satisfactory measure of a model’s goodness of fit, the BIC measure is considerably less stringent than the likelihood ratio test. For this reason, the results of both tests are reported for each of the models.

Bunker Whittington – Page 13
disparities change across disciplines or sectors. Model 6 adds two three-way interactions between
gender, dissemination, and discipline and gender, dissemination and employment sector. This
model improves on the previous one with a goodness of fit chi-square of 24.8 and 12 degrees of
freedom. The significant improvement of this model over the last suggests that there is a
differential gender effect operating among disciplines and sectors. The model’s p-value, however,
is 0.02, slightly below the 0.05 threshold needed to reject the LR test. This result indicates that the
saturated model – one that includes associations between all variables in the model - is most
appropriate for this data.11 Model 7 incorporates the saturated model by including an interaction
between dissemination, gender, discipline, and employment sector.
Model 7 is the final and best-fitting model of this analysis, indicating that male and female
scientists disseminate differently across sectors and disciplines, other things being equal.12 Model
7 also documents the persistent presence of direct gender effects on dissemination. Interaction
terms between gender and dissemination activity remain significant in the final model despite
accounting for the distribution of women across sciences (Model 5) and gendered employment
sector and discipline effects on dissemination (Models 6 and 7).
Changes in the coefficients for the interaction between gender and dissemination across
models are telling. Before controlling for the distribution of women across sectors and sciences,
women are more likely to publish than men, and only slightly less likely to engage in dual
dissemination. The final model portrays a very different story, one in which women are at a clear
disadvantage. The fact that the coefficients become more negative with the addition of female
distribution controls suggests that women tend to be located in sciences and sectors that are less
11 The significance of the saturated model indicates that a unique relationship exists between all four variables in the analysis, rather than an over-arching simpler trend based on combinations of the four. In laymen’s terms, this means that gender and dissemination likely vary by both discipline and employment sector, concurrently, rather than just discipline or sector alone. 12 Although Model 5 is best fitting by BIC standards, I choose the best fitting model by the more stringent likelihood ratio test. I make this decision primarily because the BIC criterion, in which models with BIC less than zero are preferred to the saturated model, is far easier to satisfy than the more stringent likelihood ratio test of model fit. In addition, there have been some critiques of the BIC’s ability to correctly take into account the sample size of the hypotheses in question (Weakliem 1999).

Bunker Whittington – Page 14
disadvantaging. When controlling for this distribution, however, we see that independent of sector
and science, women experience disparities between themselves and their male counterparts.
As predicted, results indicate that the propensity to publish and patent varies with gender as
well as discipline and employment sector. Including interactions between 1) gender and
dissemination, 2) gender, discipline, and employment sector, and 3) gender, employment sector,
and dissemination greatly improve the fit of the model. Despite accounting for the distribution of
scientists across fields, the persistence of significant interaction effects between gender and
dissemination indicates that the location of female scientists alone does not explain patenting and
publishing differences between male and female scientists. Furthermore, gender effects on
dissemination operate uniquely within disciplines and sectors, and the best fitting model includes
interactions between all four variables.
The final model coefficients suggest substantial discipline, sector, and gender effects on
dissemination, yet further analysis is needed to discern the relationship among all interactions
combined. From these results, it is possible to construct comparisons of log odds across and within
groups to investigate the implications of the final model. Table 3 presents the log odds and odds
ratios of dissemination between males and females across academia and industry, broken down by
discipline.13
------------------------------------- TABLE 3 ABOUT HERE
-------------------------------------
Odds Ratios
The raw percentages in the earlier descriptive statistics suggest that gender disparities may
vary by employment sector. In particular, industry settings appear to be more gender equal with
regard to both patenting and publishing, and industrial women appear to engage in publishing
behavior more than industrial men. The log linear models echo this finding, yet with an important
caveat – only for the life sciences. Due to significant, positive interactions between industry, 13 Table A1 in the appendix presents the log linear coefficients from the final model.

Bunker Whittington – Page 15
gender, and dissemination, female industrial scientists in the life sciences are equally likely to
publish as male scientists. Table 3 shows that male life scientists in academia have approximately
3.5 times higher odds of publishing and patenting than life science female academics (p < .001),
but there is no disparity between male and female life scientists in industry. Thus, the models show
significant gender disparities among life scientists in the academic sector, whereas male and female
industrial life scientists disseminate equally.
Table 3 also shows that uniform employment sector effects are not apparent in the other
disciplines. Male and female engineering and physical scientists in the academic setting do not
exhibit statistically significant gender differences in involvement. The results are similar for
industrial engineers, but male physical scientists in industry are approximately twice as likely to
patent and publish than female physical scientists in industry.
Thus, it appears that organizational context plays a highly significant role in addressing the
gender disparity seen in the descriptive statistics in these models. In particular, the trends seen in
the raw data stem from those exhibited by scientists in the life sciences. Engineers are remarkably
gender equal with regard to involvement in dissemination activities, and only in industry do male
and female physical scientists differ with regard to dual dissemination outcomes.
Implications of the Survey Models
The national sample sheds light on the degree to which the sector-level differences seen in
my previous research extend beyond the life sciences to other disciplines and sectors. At least on a
macro-scale, broad-based sector effects appear to be most prominent for scientists in the life
sciences. Why do gender disparities in the life sciences vary so clearly across sectors lines? Or
conversely, what factors in the academic and industrial settings of engineering, for example,
maintain a similar level of gender disparity across sectors?
One way in which the life sciences differ from the physical sciences and engineering is in
the proportion of women scientists working in the field. The life sciences have the highest female

Bunker Whittington – Page 16
composition of the science and engineering disciplines in both industry and academia. Previous
research has heralded the inroads women have been able to make in the life sciences, and presented
it as one of the more female-friendly disciplines. In contrast, women continue to remain a very low
proportion of physical scientists and engineers. Whereas the proportion of women in this sample in
the life sciences is 27%, they make up only 10% and 5% of the physical sciences and engineering,
respectively. The relative equality of men and women in sciences of extremely low female
proportion may reflect that, either by choice or necessity, women tend to more closely resemble the
men that dictate the norms of their working environments. Potential evidence for this speculation
is that the models show that women are more likely to engage in publishing and patenting behavior
than men in academic engineering settings. This activity may be related to discriminatory factors
and/or selection effects (the few women in the engineering have to “outperform” men in order to
continue on a similar path, for example) that may matter much less in environments where a higher
percentage of women work. Although this explanation seems plausible, it is difficult to
demonstrate quantitatively, as the past two decades of gender research have attested.
I suggest that an additional factor may be important to consider when looking at large scale
sector-level effects – organizational form. The structure of industrial firms differs from that of
academic settings, and industry context may vary across disciplines as well. Organizational work
settings within an industrial sector are not necessarily comparable; they may vary in terms of
whether they are more hierarchical or relational (Powell 1990; Sabel 1994). The life science
industry, in particular, is notable for its abundance of small, “dedicated biotechnology firms”
(DBFs) – research-intensive organizations primarily concentrating on genetic engineering and
molecular biology for human therapeutic and diagnostic applications (Powell et al. 1996).
Increasingly, life scientists in industry must decide whether to work for large diversified
pharmaceutical corporations or smaller “start-up” DBF organizations. Smith-Doerr’s research
(2004a) speaks to the relevance of gender in these two very different industrial work settings.
Specifically, she finds equality in the types of management positions male and female scientists

Bunker Whittington – Page 17
hold in small DBF organizations, but finds greater gender disparities among those in corporate labs
and in academia. My additional research with Smith-Doerr using the same sample of life scientists
also shows evidence that female scientists perform especially well in these science-based types of
organizations (Bunker Whittington and Smith-Doerr 2006). As in the national sample results
shown above, our multivariate analyses predicting involvement in commercial activity demonstrate
that female life scientists in industry are equally likely to become involved in patenting activity as
industrial males, while male academics are over twice as likely to patent than female academics.
Importantly, however, the models suggest that this sector difference is limited by type of industrial
organization – only in small, dedicated biotechnology firms. Life scientists working in industry for
large, multinational companies are not privy to this “industry advantage”. Hence, it appears that
the commercial activity of female scientists located in dedicated life science startups may be
driving the sector-level differences seen in the log linear models.
Clearly there is something unique about industrial DBF work settings. If the culture and
organization of scientific work across these varied work settings matters for predicting gender
disparity in productivity, the structure of science within smaller, dedicated biotechnology firms
may operate as an opportunity structure for gender equality in dissemination. In the next section, I
present network visualizations of academic and industrial inventors in biotechnology to examine
the structure of science across these two work settings. I compile connections among co-inventors
through US patent activity across a period of two decades, and present network graphs of the
scientific community in both sectors. Investigating collaboration networks allows me to visualize
otherwise intangible differences in sector-level structure, and make inferences about the degree to
which women and men may be affected by critical differences in organizational context. In
addition, collaboration networks permit me to address how the structure of “informal” personal
relationships among inventors speaks to the broader arrangement of the production of knowledge
across biotechnology firms and the academy.

Bunker Whittington – Page 18
3. Analysis 2
Network Data
The network data consist of inventor-level information from United States patents filed
between 1976 and 1998 from the academic and industrial sectors. To gauge the degree of female
and male commercialization in industry, data are available from Powell et. al (2005) on 482 public
and private biotechnology firms. Powell et al. collected the data on firms and firm networks from
Bioscan, an industry publication that reports information on firms and their formal agreements.
Bioscan includes nearly the entire population of biotechnology firms in existence between 1988
and 1998.14 The academic sample consists of all Research One universities in the United States (N
= 89). Academic and firm-level data are matched with patent information extracted from the U.S.
Patent and Trademark Office database. To ensure patent comparability across sector samples, the
academic database is limited to patents in the biotechnology sector. Suitable patent classes were
chosen by limiting the university sample to the subclasses which account for the 90th percentile and
below of life science firm patenting.15
I limit the collaboration network to firms and universities in the Boston region. I do so to
provide a natural boundary on the scope of the network so as to maintain a manageable size for
which to analyze the data. The Boston region is one of the top three areas of regional
biotechnology development in the United States. Boston is unique in the sense that, in conjunction
with biotechnology firms, its university activity and the activity of other public research
organizations (for example, Dana Farber Cancer Institute and Massachusetts Eye and Ear) play a
significant role in driving regional biotechnology innovation (Owen-Smith and Powell 2004;
14 There is a noticeable absence of large multi-divisional corporations, such as pharmaceutical companies, in all major biotechnology regions in the US, including Boston, during this time period (Owen-Smith and Powell 2004. Their lack of presence in the Boston network makes it difficult to ascertain the structure of inventor collaborations in large, hierarchically oriented, firms such as these. Novartis and Pfizer, however, both recently moved their R&D facilities into the Boston area since 2002, no doubt attempting to anticipate benefits from a closer location to such a dominant biotech regional economy. My dissertation work includes these organizations to enable a more fine-grained observation of the differing organizational contexts of industrial work settings. 15 It happens to be the case that these same classes hold the majority of the top patenting classes in university patents.
Bunker Whittington – Page 19
Porter, Bunker Whittington, and Powell, 2005). For this reason it is useful to analyze the Boston
area because of the jointly significant roles that universities and private firms play.16
Multiple inventions by the same person also involve the confirmation of similar names.
Inventions are considered to be from the same person when two inventors match in first, middle,
and last name (or part thereof, in the case of missing middle or first names). Importantly, however,
two names are only considered a match if they have similar first, middle and last names and a
similar city and state, assignee name, or the same primary and secondary technology class.
In addition, inventor gender is coded through the assistance of an algorithm that determines
gender based on first name comparisons with a list of names (broken out by gender) from the 90th
percentile and below of the 1990 U. S. Census.17 This list contains not only 90% of the most
common names in 1990, but the cumulative percentage of the U. S. population with each name. In
the case where a name appears on both the male and the female list, the cumulative percent for the
name in each gender is compared. Names in dispute that are above the 70th percentile are
considered rare, and gender is assigned to the opposite sex.18 Decisions are not made about
androgynous names (that is, names found on both a male and female list) where a cumulative
percentage is not given or jointly rare. There is a tendency in the name-matching algorithm to find
matches for a greater percentage of scientists with a typical “American” name, as many foreign-
based names are not present in the 90th percentile of the U.S. population. Much of the ~17%
missing data lies in names of Indian and Chinese descent, both of which are difficult to code for
gender.19 The missing data is still included (labeled “Gender Unknown”) in the network to
maintain its integrity.
16 In addition to firm and university inventors, I include collaboration networks of those in public research institutions. Although not the focus of this paper, the significant role such networks play in the Boston region suggests a more accurate picture of the joint firm-university network is achieved with their inclusion. 17 See Bunker Whittington (dissertation) for a detailed description of the name-matching algorithm. 18 When possible, names not on the 1990 census are coded using secondary name data, found in books and websites with downloadable lists of ethnic and foreign names. 19 In their complexity, Indian names are hard to compile into lists of common names. Chinese names tend to be androgynous when spelled in English, where gender is typically relayed in tone and written character in the Chinese

Bunker Whittington – Page 20
In the final sample there are 49 firms, 4 universities (Harvard, Tufts and Boston University,
and MIT), and 13 public research organizations (other than the universities) in the Boston area
between 1976 and 1998. There are 1115 inventors who have participated in a total of 1375 patents
between 1976-1998 in the Boston DBF network, and 1003 inventors who have been granted 792
patents between 1976 and 1998 in the Boston university network. The Boston firm and university
networks are comprised of 25% (N = 235) and 18% women (N = 153), respectively.
The Network
The data for this analysis represent two-mode affiliation data, where the inventors are the
actors and each patent is the event. In this way, a connection between actors is assumed strictly by
their collaboration activity. The affiliation network, when multiplied with its transpose, produces a
one-mode actor by actor network. I depend solely on this “one-mode” inventor-inventor network
in this paper.
I present network visualizations through the network program Pajek. Pajek produces
network images by applying energy-based physical science algorithms that act to minimize node
“strain” based on the inventor ties across the network. I create network images using Pajek’s
Kamada and Kawai (1989) and Fruchterman and Reingold (1991) energy algorithms.20 This two-
step process is done first to map and spread the structure of the network, and then to optimize that
spread according to the constraints inherent in the node relationships.21
I first present network graphs of the collaboration structure of all sectors combined, and
then of the largest components in the academic and industrial sectors separately. The structure of
collaborations among scientists in industry and academia exhibits characteristics that embody the
language. Presumably these missing names contain a similar percentage of men and women to the matched data, although that itself is not knowable. 20 For more information on the algorithms or their use for visualization, see Owen-Smith et. al. 2002; Powell, et al 2005, and http://vlado.fmf.uni-lj.si/pub/networks/pajek. 21 All networks are optimized to account for the number of patents in an inventors collaboration profile.

Bunker Whittington – Page 21
sector-level influences discussed above, and as such, visually shows ways in which organizational
context may act to influence individual action within employment sectors.
Network Visualizations
Visualizations of the combined network show the relationship between academic and
industrial collaboration networks, and their structure within sector. I focus my analysis of the
patent collaboration network on the largest, weakly connected component in a network (White and
Harary, 2001; Moody and White, 2003). This structure, the ‘main component,’ represents the
greatest concentration of co-inventors, and the largest hub of patenting collaboration in the Boston
region.22
Figure 1 is a visualization of the main component of the co-patenting network across time
(1976-1998), with 1298 inventors. Circles represent university inventors, squares are
biotechnology firms, and triangles are public research organizations. A select group of 127
individuals have patents assigned across universities, industry, or public research organizations .
These inventors are represented with diamonds. Gender is coded by color - black nodes are female
inventors, gray nodes are male inventors, and white nodes are scientists of unknown gender.
-------------------------------
Figure 1 about here ------------------------------
The central force in Figure 1 is the expansive “pump” of university inventors in the center
of the drawing. This cluster represents the laboratory work of Dr. Robert Langer and his students
and colleagues from MIT. Spreading out from the Langer cluster in the center are several firm,
university, and public research organization components, connected through the cross-sector
inventors. Though not the immediate focus of this paper, the combined network shows the
22 Visualizations of the main component omit all inventors with no collaboration ties to others, and smaller clusters of collaborators that do not connect to the largest cluster. In this network, there are very few small clusters of collaborators besides the main component.

Bunker Whittington – Page 22
important role that multivocality plays in linking the two sectors together (Padgett and Ansell 1993,
Powell et al 2005). While only 9.8% of the scientists in the component are cross-sector inventors,
without them the network breaks into 9 pieces of within-sector only collaboration. Had these 127
inventors not cross patented, the combined network would look vastly unconnencted.
That said, the full network is largely comprised of sector-similar activity. Breaking the full
network down by sector, we see distinct clusters of activity within academic and industrial life
science. In the Boston region, there are 4 main industrial and 3 main academic components (all
nodes in a component are connected to each other by at least one reachable path). Figures 2 and 3
display the largest components in both the academic and industrial sectors, respectively. The
network of collaborations in each of these components has implications for the structure of science
in academic and industrial settings, and the level of gender disparity seen in both. I focus on each
in turn.
-------------------------------- Figures 2 and 3 about here --------------------------------
Academic Collaboration Networks
Figure 2 shows the structure of the largest academic component in the Boston university
network. This component is a cluster of MIT scientists, with patents from Langer’s laboratory in
the center of the largest hub. This network contains 16% female scientists. The structure of
academic science resembles that of a bicycle wheel. “Star scientists” are located in the middle of
the wheel structure, and collaboration networks extend out from the scientists like spokes.
Connections may exist to other “wheel-like” structures of star scientists, in which collaboration
networks again surround the one, central scientist in the center. Figure 2 suggests that the structure
of academic science reflects the organizational goals of the university. Here, head scientists
represent the most central locations, and the domain within which each operates is kept largely
separate from other head scientist domains. Networks of collaborations are centered around one

Bunker Whittington – Page 23
area and only tangentially tied to other networks of collaborations. This may represent ways that
academic scientists organize, not only to facilitate large research projects, but also to offset
priority-loss and maximize economies of scale. The network drawings provide insight into how
informal relationships - cemented through formal patent assignments - are shaped by (and continue
to shape) the structure of organizational system.
The right-hand visualization in Figure 2 presents the same academic structure, but
organized hierarchically by level of degree centrality. Each level represents a standard deviation
above the average degree centrality of the component (represented at the lowest level). This
version of the network shows the hierarchical structure of scientists in the academic system.
Robert Langer is the top node, and below him are the collaborators that in the network to the left
formed the spokes of the Langer wheel. In academic science, star scientists (in this figure there are
two) reside at the top with limited paths and connections between individuals. When viewed this
way, the network suggests that collaborative action among inventors is closely orchestrated through
the actions of a few highly influential individuals.
Figure 2 also lends insight in how supply side demands may be shaped by the system.
Consider one’s location in the Langer hierarchy. Moving or finding opportunities and other
resources beyond the Langer cluster may be a difficult task given the single node collaboration
connections from which the Langer cluster is linked to other clusters at MIT. In university settings,
scientist’s ability to appropriate information and reach potential collaborators is limited structurally
by the inherent linkages (or lack of them) between clusters. Whether a scientist knows about his or
her resource limitations or is only aware of the difficulty in learning of them beyond his or her
place in the system yields similar hindrances. Visualizing how scientists are located in the
structure of academic science suggests ways to conceptualize how scientists’ decisions and actions
may interact with the existing structure of academic science.

Bunker Whittington – Page 24
Industrial Collaboration Networks
The structure of industrial science looks quite different from that of academic science.
Figure 3 presents visualizations of the largest connected component in the Boston firm network.
All of the inventors in this component have patented technology developed from a notable
biotechnology firm, Genetics Institute.23 In comparison with the main academic component, which
has 16% female scientists, the industrial component has 32%. In addition, we see a clear lack of
“star scientist” activity, where many nodes are connected to one node but not to others, and an
increase in nodes that are reachable through many paths. This difference is evident visually, but
also through descriptive information on the two networks. Whereas the average path distance of
reachable nodes in the academic network is 1.3, the industrial average is 2.0. This difference
suggests that the research networks of industrial scientists span a greater distance than those of
academic scientists.
------------------------------- Figure 3 about here
-------------------------------
Like the academic network, Figure 3 reflects the structure of industrial science, with its
associated organizational goals and incentives. Whereas academic scientists are organized around
specific labs and top scientists, industrial scientists are organized around research problems.
Lacking world-class superstar scientists, research teams operate more collaboratively. Research
teams within firms share information, supplies, and human capital with other groups. Across firms,
research collaborations with other companies enhance the flow of ideas and resources across many
individuals. Thus, we see sector-level organizational goals and incentives reflected in the structure
of industrial science.
23 Genetics Institute was acquired in 1998 by Wyeth, a large pharmaceutical company, but continues to operate as an independent division.

Bunker Whittington – Page 25
Figure 3 also presents the same industry component, but organized hierarchically by degree
centrality. In comparison with the university network in Figure 2, it is notable that the variance of
degree centrality for academic scientists is 6.7, whereas the variance for industry scientists is 3.6.
This indicates that industrial scientists have less spread in the distribution of degree centrality than
academic scientists. Visually, it is immediately clear that the hierarchy in the industry network is
more dispersed as compared with the academic network. Instead of all nodes connected to one or
two top scientists, in these firms multiple inventors are connected to many other inventors.
Measures of connectedness may be similar across the two sectors, but it is connectedness to whom
that makes the difference.
Figure 3 suggests that inventive activity in small dedicated biotechnology firms looks
rather different than in an academic setting. In biotech firms, the lack of a strong hierarchy and
sharp scientific competition speak directly to the nature of the industrial science system, and has
implications for how the supply side of sector activity may shape or be shaped by the structure of
industrial science. Because the network is more dispersed hierarchically, scientists may have more
resources to draw from, and more ability to appropriate new research collaborators. Network
mobility seems more fluid in small firm industrial science. Instead of movement being restrained
through the one node that connected the Langer cluster to other research areas, scientists within one
part of the industrial firm network have many collaborative opportunities available to them to
connect with others in the network. In this way, the structure may help to shape the decisions
scientists make, and their involvement in dissemination in general.
Network Discussion
The network visualizations suggest that the structure of scientific collaboration closely
follows that of the arrangements of work in the academic and industrial organizational forms. A
key difference between academia and dedicated biotechnology firms is how the structure of
knowledge production is organized within each. In the former, the university is arranged around

Bunker Whittington – Page 26
the laboratories of tenured scientists. Collaborators, often graduate students and/or research
scientists, are frequently responsible for small pieces of work within the laboratory’s focus. The
structure of science in this academic setting is such that all research (commercial or otherwise) is
tied through the head scientist, and collaborations with others in the lab and across labs with the
same focus are often kept to a minimum. Like academic science, in biotech firms there may also
be a comparable focus on a specific therapeutic arena. In this setting, however, scientists move
from research project to research project within the firm, and are often characterized as “voting
with their feet” because of the way they move across and between successful research projects in
the organization.24
I suggest that the difference between the broadly distributed work of academic science and
the more horizontal distribution of knowledge in biotech firms may be important in explaining
differences in productivity between male and female scientists within industry and academia.
Previous research suggests that women and men create and exist in qualitatively different patterns
of interaction within their work setting (Brass 1985; Smith-Lovin and McPherson 1993; Ibarra
1992). Women tend to exist in networks that have more strong relations, and potentially, have
access to a fewer number of important bridging, influential ties in their networks. Because
industrial settings may be less competitive within firms, or there may be more designated or
directed positions of collaboration, women may be better able to access these types of beneficial
ties. Additionally, scientists’ position at the confluence of reputation and collaborative networks
may just not be as important in industrial settings as they are in academic ones, where scientists’
networks can matter greatly to help offset loss through priority-based competition. If this is the
case, we may see less of an influence of network position and productivity for scientists in
industrial jobs, and differences in men’s and women’s networks are not as likely to matter as much
for research output as in the academy. Thus, gender differences in patenting may be amplified in
24 For a poignant example of this, see the Harvard Business School Case on “planning the un-plannable” in Amgen, a large, successful biotechnology firm in Los Angelos, California (Nohria and Berkley 1992).

Bunker Whittington – Page 27
public versus private settings due to variations in a) the differing network positions of men and
women, and b) the varying importance of network position on productivity in industry and
academia.
My dissertation explores these ideas more fully. This initial work shows key visual
differences, but from the network data it is possible to construct standard measures of individual
network centrality and overall network centralization, as well as various measures of male and
female position characteristics. The dissertation pays particular attention to inventors located in
“brokering” positions (Burt 1992). Brokers are nodes that are situated in between two or more
groups that lack ties to one other. Those in brokering positions benefit from their position because
they may have increased exposure to new and different information, they may be the first to see
new opportunities in research, and they can bring together new collaborative ventures with
available others, among other things. I explore the extent to which industrial female scientists are
more likely to be in brokering positions than academic female scientists. In general, I show the
degree to which the structure of academic and industrial science is statistically related to the degree
of gender disparity in patenting. I argue that one’s position in the network matters, but in addition,
the structure of one’s network may also play a more defining role.
One limitation of the network visualizations is that they include all connections among all
individuals over time, and cannot speak to the stability of the network structure over the years. My
future work will look at changes in the network structure over time to provide evidence of causality
between the impact of structure and the impact of scientists’ decisions. A related and pertinent
issue of the network graphs is how the organizational arrangements of large, broadly distributed
corporations (such as pharmaceutical firms) are similar or dissimilar from that of dedicated
biotechnology firms, as well as the academic life science setting. For reasons documented more
fully in the dissertation, I suggest large corporations may have a similar structure and dynamic to
that of university science. Including the activities of scientists in large pharmaceutical firms will

Bunker Whittington – Page 28
help to illuminate how this structure may also contribute to greater gender disparities in
commercial involvement.
4. Conclusion
The log linear models confirm that sector-level differences in gender disparities exist in the
life sciences, while also showing this discipline to be relatively unique in this regard. Viewed in
conjunction with previous research that shows the effects of industrial life sciences are driven by
smaller, dedicated biotechnology firms (Bunker Whittington and Smith-Doerr 2006), these results
suggest that sector-level differences may be due largely to features contained within the differing
organizational forms of academic versus small dedicated biotechnology settings. The network
visualizations suggest ways in which the structure of science varies across these diverse work
settings, and illustrate how male and female scientists’ commercial involvement may be related to
their positions within this structure.
An important caveat of this research is that it deals with sector differences in
“involvement” in dissemination activities, rather than “productivity” (i.e. amount of patents or
articles) per se. Academic gender disparities in the life sciences are greater when looking at
involvement in commercial behavior, to any degree, but in contrast, analyses using a count of
patents showed similar gender disparities across employment sectors.25 Hence, differences
between the academic and industrial sectors appear to stem largely from unequal opportunities to
engage in such behavior, rather than the amount of productivity once involved.
Because academics are typically free to choose their research topics, gender differences in
involvement within the university may suggest that fewer women have exposure to the commercial
process, or alternatively, foster a research focus that lends itself to becoming commercially
involved. A more structural explanation for this may be that women lack institutional support for 25 In these two-stage sample selection models predicting first, involvement in commercial activity, and second, the amount invented, women continue to patent less than their male counterparts. Unlike commercial involvement (to any degree), these models show no differences across employment sectors in gender disparities when looking at the number of patents granted to men and women in academic versus industrial science. (Bunker Whittington and Smith-Doerr 2006).

Bunker Whittington – Page 29
patenting. Perhaps universities fail to support initial commercialization for female scientists, but
once involved, women patent at rates similarly to men. Without further research, it is hard to speak
to female scientists’ motivations and interests in commercial work. My future work explores these
ideas more fully with qualitative data from scientists working across academic and industrial
settings. At the very least this research highlights the importance of conceptualizing dissemination
as a separate, two-part process – involvement, to any degree, and then amount, once involved.
Of final interest is how male and female dissemination compares across disciplines. The
log linear models clearly show something unique about the life sciences regarding sector-level
differences, as these effects do not occur in the physical sciences and engineering. Viewed in
conjunction with additional research showing the strong role that biotechnology firms play in the
relative commercial gender equality of industry, the implication is that something distinctive is
occurring in the structure of or group of workers in these work settings. Although commercial
work is becoming more common in all disciplines, the life sciences exhibit a higher proclivity to
commercialize than other sciences. At their core, biotechnology firms have a financial bottom line
to meet and, in the case of scientific work, they also aim to maximize their accumulation of
proprietary information. Hence, these firms are also likely to attract scientists with knowledge and
expectations of patenting. Conversely, for many of the reasons mentioned above, participation in
an activity that has historically been seen as “supplementary” (and even controversial) may be
more likely to lag among scientists in the academy. In the physical sciences and engineering,
female scientists are a rarity, and work settings may not be organized to maximize commercial
activity as efficiently as in life science firms. Thus, female workers may be equally less likely to
patent in both universities and industrial firms. The combination of these two factors may produce
the greatest differences in the life sciences across the two sectors. I present these cases in hopes of
stimulating future research on gender dynamics in physical science and engineering firms.
In conclusion, at the heart of this research is the goal of gaining a better understanding of
how work environments and changes in the context of science may make a difference on the

Bunker Whittington – Page 30
known disparities between men and women scientists. With academic participation in both basic
science and commercial endeavors on the rise, the fact that female scientists in the academy may
lag behind their male counterparts, for whatever reason, and are more comparable to their industrial
counterparts has significant implications for the future labor market choices of female scientists.
As commercialization becomes more common and has more repercussions for academic scientists,
these trends have considerable implications not only for the scientific labor market, but the wider
pursuit of knowledge as well.

Bunker Whittington – Page 31
5. Works Cited
Aisenburg, Nadya and Mona Harrington. 1988. Women of Academe: Outsiders in the Sacred Grove. Amherst, MA: University of Massachusetts Press.
Brass, D.J. 1985. “Men’s and Women’s Networks: A Study of Interaction Patterns and Influence in an
Organization.” Academy of Management Journal, 28: 327-343. Bunker Whittington, Kjersten C. (in progress). “Employment Sectors as Opportunity Structures: The
Effects of Location on Male and Female Scientific Dissemination.” Dissertation, Stanford University.
Bunker Whittington, Kjersten C. and Laurel Smith-Doerr. 2005. “Women and Commercial Science:
Women’s Patenting in the Life Sciences” Journal of Technology Transfer, 30: 355-370.
Bunker Whittington, Kjersten C. and Laurel Smith-Doerr. 2006. “Gender and Patenting Involvement Across Work Settings in the Life Sciences”. Working Paper.
Burt, Ronald S. 1992. Structural Holes: The Social Structure of Competition. Cambridge, MA: Harvard
University Press. Cohen, Wes, Richard Florida and Richard Goe. 1994. University-Industry Research Centers in the United
States. Pittsburgh, PA: Carnegie-Mellon University Press. Cole, Jonathon. 1979. Fair Science: Women in the Scientific Community. New York: Free. Cole, Jonathon and Harriet Zuckerman. 1984. “The Productivity Puzzle: Persistence and Change in
Patterns of Publication Among Men and Women Scientists”. In Advances in Motivation and Achievement, eds. P. Maehr and M. Steinkamp. Pp. 217-56. Greenwich, CT: JAI Press.
Etzkowitz, Henry, Carol Kemelgor, and Brian Uzzi. 2000. Athena Unbound: The Advancement of
Women in Science and Technology Cambridge, UK: Cambridge University Press. Fox, Mary Frank. 1983. “Publication Productivity Among Scientists: A Critical Review”. Social Studies
of Science 13:285-305. Fox, Mary Frank. 1985. “Publication, Performance, and Reward” In J. Smart (Ed.), Higher Education:
Handbook of Theory and Research, Volume I. New York Agathon Press. Fox, Mary Frank. 1995. “Women and Scientific Careers”. In Handbook of Science and Technology
Studies, ed. S. Jasanoff, G. Marckle, J. Peterson, and T. Pinch. Pp 205-23. Thousand Oaks, CA: Sage.
Fox, Mary Frank. 2000. "Organizational Environments and Doctoral Degrees Awarded to Women in
Science and Engineering Departments." Women's Studies Quarterly 28: 47-61. Fruchterman, T., E. Reingold. 1991. “Graph drawing by force-directed replacement.” Software—
Practice and Experience 21 1129–1164. Ibarra, Herminia. 1992. “Homophily and differential returns: Sex differences in network structure and
access in an advertising firm.” Administrative Science Quarterly, Vol. 37, S. 422-447.

Bunker Whittington – Page 32
Jaffe, Adam. 2000. “The U.S. Patent System in Transition: Policy Innovation and the Innovation
Process,” Research Policy 531-557. Kamada, T. and S. Kawai. 1989. “An Algorithm for Drawing General Undirected Graphs.” Information
Processing Letters 31:7-15. Kleinman, D. L. and S. P. Vallas. 2005. “Contradiction in Convergence: Universities and Industry in the
Biotechnology Field.” Forthcoming in The New Political Sociology of Science, S. Frickel and K. Moore (eds.), Madison: University of Wisconsin Press.
Long, J.S., ed. 2001. From Scarcity to Visibility: Gender Differences in the Careers of Doctoral Scientists and Engineers. Washington, D.C.:National Academy Press. Long, J. Scott, Paul Allison, and Robert McGinnis. 1993. “Rank Advancement in Academic Careers: Sex Differences and the Effects of Productivity.” American Sociological
Review 58: 703-22. Long, J. Scott and Mary Frank Fox 1995. “Scientific Careers: Universalism and Particularism.” Annual
Review of Sociology 21: 45-71. Moody, J. and D.R. White. 2003. “Social Cohesion and Embeddedness: A Hierarchical Conception of
Social Groups.” American Sociological Review. 68: 103-127. Morgan, Robert, Carlos Kruytbosch, and Nirmala Kannankutty. 2001. “Patenting and Invention Activity
of U.S. Scientists and Engineers in the Academic Sector: Comparisons with Industry.” Journal of Technology Transfer 26: 173-183.
Nohria, Nitin and James D. Berkley. 1992. “Amgen, Inc.: Planning the Unplannable.” HBS No. 492-052.
Boston: Harvard Business School Publishing. Owen-Smith, Jason. 2000. Public Science, Private Science: The Causes and Consequences of Patenting
by Research One Universities. Ph.D. Dissertation, University of Arizona. Owen-Smith, Jason and Walter W. Powell. 2001. "To Patent or Not: Faculty Decisions and Institutional
Success in Academic Patenting." Journal of Technology Transfer 26(1): 99-114. Owen-Smith, Jason and Walter W. Powell. 2004. "Knowledge Networks as Channels and Conduits: The
Effects of Spillovers in the Boston Biotechnology Community." Organization Science. 15(1):5-21.
Padgett J. and C. Ansell .1993. “Robust Action and the Rise of the Medici, 1400-1434.” American
Journal of Sociology, 98, 1259-1319. Porter, Kelley A., Kjersten Bunker Whittington, and Walter W. Powell. 2005. “The Institutional
Embeddedness of High-Tech Regions: Relational Foundations of the Boston Biotechnology Community”. Clusters, Networks, and Innovation, edited by Stefano Breschi and Franco Malerba, Oxford University Press. Pp 261-296.
Powell, Walter W. 1990. “Neither Market nor Hierarchy: Network Forms of Organization”. Research in
Organizational Behavior 12 295–336.

Bunker Whittington – Page 33
Powell, Walter W. and Jason Owen-Smith. 1998. “Universities and the Market for Intellectual Property in
the Life Sciences.” Journal of Policy Analysis and Management 17(2): 253-277. Powell, Walter W., Kenneth W. Koput, Laurel Smith-Doerr. 1996. “Interorganizational Collaboration
and the Locus of Innovation: Networks of Learning in Biotechnology.” Administrative Science Quarterly 41:116-145.
Powell, Walter W., Douglas R. White, Kenneth W. Koput & Jason Owen-Smith .2005. "Network
Dynamics and Field Evolution: The Growth of Inter-organizational Collaboration in the Life Sciences." American Journal of Sociology 110(4): 1132-205
Rabinow, Paul. 1996. Making PCR. Chicago: University of Chicago Press. Raftery, A. 1986. “Choosing Models for Cross-Classification.” American Sociological Review 51: 145-
46. Reskin, Barbara. 1977. “Scientific Productivity and the Reward Structure of Science”. American Sociological Review. 42:491-504. Rosenburg, Nathan and Richard R. Nelson. 1993. “American Universities and Technical Advance in Industry.” Research Policy 23: 323-348. Sabel, Charles F. 1994. "Learning by Monitoring: The Institutions of Economic Development." The
Handbook of Economic Sociology, ed. by Neil Smelser and Richard Swedberg. Princeton: Princeton University Press and Russell Sage Foundation, Pp. 137-165.
Smith-Doerr, Laurel. 2004a. “Flexibility and Fairness: Effects of the Network Form of Organization on
Gender Equity in Life Science Careers.” Sociological Perspectives 47(1): 25-54. Smith-Doerr, Laurel. 2004b. Women’s Work: Gender Equality versus Hierarchy in the Life Sciences.
Boulder, CO: Lynne Rienner Publishers. Smith-Lovin, Lynn and J. Miller MCPherson. 1993. “You are Who You Know: A Network Approach to
Gender,” in Paula England ed., Theory on Gender / Feminism on Theory, Hawthorne, NY: Aldine de Gruyter, 223-251.
Stephan, Paula. 1996. “The Economics of Science.” Journal of Economic Literature 34:1199-1235. Ward, K. B. and L. Grant. 1995. “Gender and Academic Publishing.” In Higher Education: Handbook of
Theory and Research. Volume 11, editor A. E. Bayer and J. C. Smart. New York: Agathon. Weakliem, D.L. 1999. “A Critique of the Bayesian Information Criterion for Model Selection.”
Sociological Methods and Research 27:359–97. White, D. R. and F. Harary. 2001. “The cohesiveness of blocks in social networks: node connectivity and
conditional density.” Social Methodology 31(1): 305-359.
Xie, Yu and Kimberlee Shaumann. 1998. “Sex Differences in Research Productivity: New Evidence About an Old Puzzle.” American Sociological Review 63: 847-870.

Bunker Whittington – Page 34
Zucker, Lynne G., Michael R. Darby and Marilynn B. Brewer. 1998. “Intellectual Capitaland the Birth of U.S. Biotechnology Enterprises.” American Economic Review 88: 290-306.
Zuckerman, Harriet. 1970. “Stratification in American Science”, in Social Stratification, E. Laumann
(ed.), pp. 235-257. Indianapolis:Bobbs-Merrill. Zuckerman, Harriet. 1991. “The Careers of Men and Women Scientists: A Review of Current
Research.” In The Outer Circle: Women in the Scientific Community, Harriet Zuckerman, Jonathon Cole, and John Bruer (eds.). Pp. 27-56. New York: W.W. Norton.
Zuckerman, Harriet and Jonathon Cole. 1975. “Women in American Science”. Minerva 13 (Spring): 82-
102.
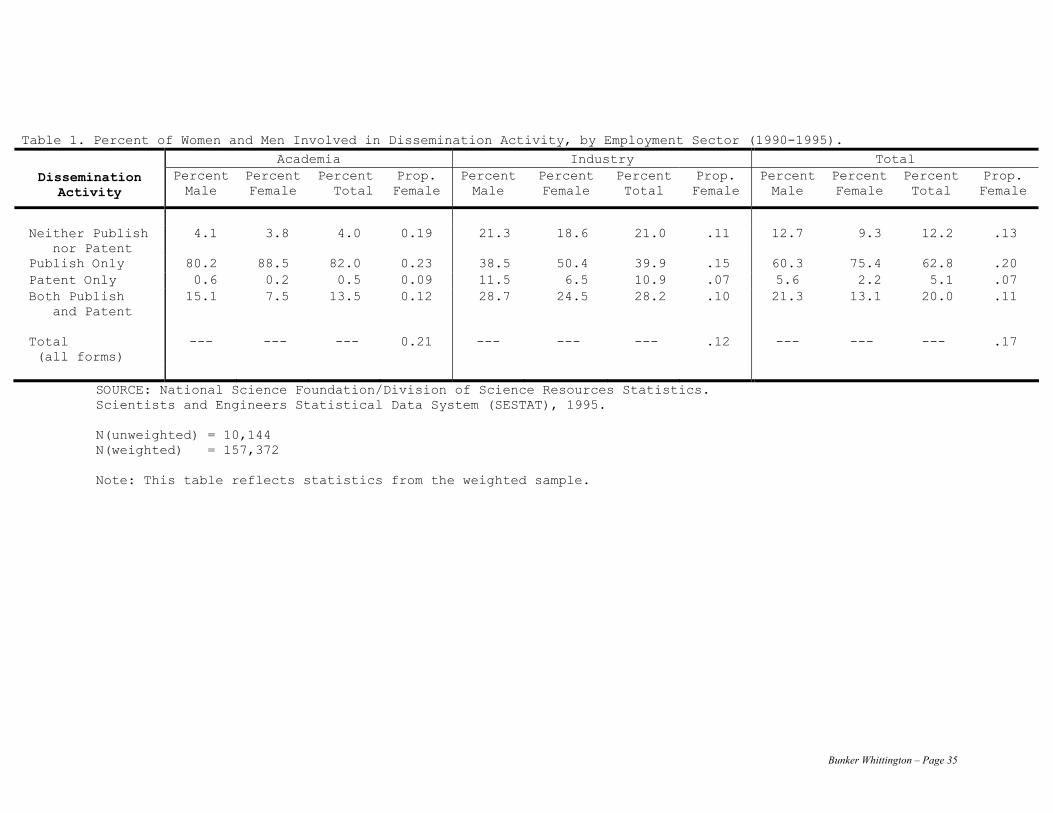
Bunker Whittington – Page 35
SOURCE: National Science Foundation/Division of Science Resources Statistics. Scientists and Engineers Statistical Data System (SESTAT), 1995. N(unweighted) = 10,144 N(weighted) = 157,372 Note: This table reflects statistics from the weighted sample.
Table 1. Percent of Women and Men Involved in Dissemination Activity, by Employment Sector (1990-1995). Academia Industry Total
Dissemination Activity
PercentMale
Percent Female
Percent Total
Prop. Female
Percent Male
Percent Female
Percent Total
Prop. Female
Percent Male
Percent Female
Percent Total
Prop. Female
Neither Publish nor Patent
4.1 3.8 4.0 0.19 21.3 18.6 21.0 .11 12.7 9.3 12.2 .13
Publish Only 80.2 88.5 82.0 0.23 38.5 50.4 39.9 .15 60.3 75.4 62.8 .20 Patent Only 0.6 0.2 0.5 0.09 11.5 6.5 10.9 .07 5.6 2.2 5.1 .07 Both Publish and Patent
15.1 7.5 13.5 0.12 28.7 24.5 28.2 .10 21.3 13.1 20.0 .11
Total (all forms)
--- --- --- 0.21 --- --- --- .12 --- --- --- .17

Bunker Whittington – Page 36
Table 2. Log-Linear Models of Scientific Dissemination, Gender, Discipline, and Employment Sector, 1990-1995.
Terms in Residual Goodness LR Model Description the model df of fit p-value BIC 1. Constant Only 1 71 22686.8 0.0 22031.8 2. Model 1 + direct effects 9 63 4903.2 0.0 4322.1 3. Model 2 + Pat/Pub Activity * Employment Sector 37 35 1085.4 0.0 762.5 + Pat/Pub Activity * Scientific Discipline + Scientific Discipline * Employment Sector + Pat/Pub Activity * Employment Sector * Scientific Discipline 4. Model 3 + Gender * Pat/Pub Activity 40 32 891.3 0.0 596.1 5. Model 4 + Gender * Scientific Discipline * 48 24 43.7 0.001 -177.7 Employment Sector 6. Model 5 + Gender * Pat/Pub Activity * 60 12 24.8 0.02 -85.9 Scientific Displine + Gender * Pat/Pub Activity * Employment Sector 7. Model 6 + Gender * Pat/Pub Activity * 72 0
N/A N/A N/A Scientific Discipline * Employment Sector (Saturated Model)

Bunker Whittington – Page 37
Table 3. Odds Ratios for Male and Female Scientists by Employment Sector, Holding Discipline Constant.
Life Sciences Engineering Physical Sciences Academia Industry Academia Industry Academia Industry Publishing Onlya
Male 3.705 1.430 2.272 0.066 2.584 0.777
Female 3.122 1.679 5.752 0.038 3.139 0.626 Relative Log Odds (M-F) 0.583*** -0.249 -3.480 0.028 -0.555 0.151 Relative Odds 1.791*** 0.780 0.030 1.028 0.574 1.160 Patenting Onlya Male -1.187 -0.950 -3.275 -2.112 -3.275 -0.253 Female -2.809 -1.110 -1.349 -2.917 -3.575 -0.796 Relative Log Odds (M-F) 1.622** 0.160 0.146 0.805** 0.300 0.543 Relative Odds 5.063** 1.174 0.146 2.237** 1.350 1.721 Both Publishing and Patenting
Male 1.926 0.730 1.181 -0.196 0.705 0.741
Female 0.647 0.784 3.925 -0.533 0.388 0.141 Relative Log Odds (M-F) 1.279*** -0.054 -2.744 0.336 0.317 0.600** Relative Odds 3.593*** 0.950 0.060 1.399 1.370 1.820** Notes: a The odds ratios for Publishing Only, Patenting Only, and Both Publishing and Patenting have Neither Publishing nor Patenting as a comparison group. * p < 0.1 ** p < 0.05 *** p < 0.01 (two-tailed)

Bunker Whittington – Page 38
Node Color Gray: Male (75.3%) Black: Female (16.0%) White: Gender Unknown (8.8%)
Percent Female: Industry: 22.5% Academia: 11.2% PRO: 16.8%
Node Shape Square: DBF (21.2%) Circle: University (49.3%) Triangle: PRO (19.7%) Diamond: Cross-sector (9.8%)
Figure 1. Boston Patent Co-Inventor Network, Main Component (1976-1998)

Bunker Whittington – Page 39
Network Graph Male Inventor (Gray nodes): 69% Female Inventor (Black): 16 Unknown Gender (White): 15
Figure 2. Largest Collaboration Component, Boston Universities (1976-1998)
Degree Distribution Bottom Level, Average: 5.6 Subsequent Levels, Std. Dev.: 6.7 Overall Centralization: 0.9

Bunker Whittington – Page 40
Network Graph Male Inventor (Gray nodes): 57% Female Inventor (Black): 32 Unknown Gender (White): 11
Figure 3. Largest Collaboration Component, Boston Firms (1976-1998)
Degree Distribution Bottom Level, Average: 5.4 Subsequent Levels, Std. Dev.: 3.7 Overall Centralization: 0.3