
Gender and Age affected to WOM
7
1 DEMOGRAPHIC BASES OF WORD OF MOUTH Robert East , Kingston Business School, Kingston Hill, Kingston, KT2 7LB Wendy Lomax, Kingston Business School, Kingston Hill, Kingston, KT2 7LB
-
Upload
mitya-voskresensky -
Category
Documents
-
view
1.297 -
download
5
description
Transcript of Gender and Age affected to WOM

1
DEMOGRAPHIC BASES OF WORD OF MOUTH
Robert East, Kingston Business School, Kingston Hill, Kingston, KT2 7LB Wendy Lomax, Kingston Business School, Kingston Hill, Kingston, KT2 7LB
2
DEMOGRAPHIC BASES OF WORD OF MOUTH
Abstract
We investigate how the volume and impact of positive and negative word of mouth (PWOM, NWOM) relate to age and gender. In specific categories, one sex gives more PWOM than the other and these differences are broadly predictable from culturally accepted gender interests.However, women give proportionately less NWOM than men in those categories where they give less PWOM. After age 55, WOM volume falls off. The impact of received WOM is relatively constant among women but increases with age among men.
Introduction
We want to know how word of mouth (WOM) patterns differ by age and sex because substantial demographic differences can be used in the design and placing of marketing communications. By adapting and targeting communications appropriately, we may be able to do more for less. The differences in WOM that we observe are likely to reflect underlyingsocial conditions that set opportunity and interest across age and gender. We study these demographic relationships so that practice is well grounded and relevant since popularassumptions can be mistaken.
We have survey data on 20 categories, all but one from the UK. Our dataset covers both positive and negative WOM (PWOM, NWOM), and received WOM as well as given WOM; in addition, we have the reported impact of received WOM on purchase probability.
Previous Research
Word of mouth (WOM) is consumer-to-consumer advice; often, it is interactive, sensitive to the needs of the receiver and impartial. As such, it is a powerful influence on consumption, particularly in those fields where trial is not possible (East et al. 2005). Some consumers are particularly active advisers in specific fields (opinion leaders) while others advise about a range of categories (market mavens, Feick and Price, 1987). With regard to gender, Carl (2006) notes that work on market mavens shows that most mavens are women (Feick andPrice, 1987; Higie, Feick, and Price, 1987). However, Feick and Price found that mavens were rare in the population. Under these circumstances, the sex ratio of the maven sample would exaggerate small differences between the sexes. Carl investigated BzzAgents – people who agree to talk about products they are given – and found that 80% were female. Here again, the selection process for becoming a BzzAgent could amplify any naturally occurring difference in the main population. A study by Swanson et al. (2003) found that women were more likely to recommend attendance at a sporting event but the authors cautioned that this might vary with the type of sport.
Fortunately, we have permission to report data for 2009 on “branded conversations” from the Keller Fay Group’s TalkTrack. This research from the USA is based on the WOM recalled from the previous 24 hours and shows that women report 17% more conversations relating to brands than men. Thus, there is evidence that women produce more WOM than men though the difference is not large and might be expected, given that women are more often the principal shoppers in the household. Keller Fay divide branded conversations into mostly positive, mostly negative, mixed and neutral. Focusing on the 73% of conversations that are mostly positive or negative, we find that, among men, 11.8% of these conversations are
3
negative compared to 9.9% of among women. Thus there is evidence here that, proportionately, men are more negative in their conversations about brands than women. This difference could simply reflect the goods and services that men and women are most concerned with, or it could relate to a psychologically based gender difference.
Women’s somewhat greater production of branded conversations corresponds with evidence on the total amount that men and women talk. Mehl et al. (2007) used portable recording to measure conversation in an unobtrusive way on mostly US population samples; they found that, on average, women used 16,200 words and men 15,700 each day. This difference was not statistically significant but, in the UK, Liberman (2006) found that women produced 8800 words to men’s 6100, or 44% more. Thus, if WOM is proportional to the amount that men and women talk, we would expect somewhat more WOM from women.
In our research, we cannot directly test whether women produce more WOM than menbecause our data are by category, and we do not know how representative our categories are of all brand conversations. However, we can see which categories elicit most WOM from men and women, and whether our data confirm the Keller Fay evidence that men tend to produce proportionately more NWOM than women. We can also report on impact.
We turn now to research relating to age. WOM depends upon social contact and this in turn depends on group memberships. People have neighbourhood contacts and may retain some links with those they knew in the education system. Other group contacts may diminish over time; group contacts created by work will cease or lessen with retirement and may not be fully replaced by alternative associations. In addition to this, death takes friends and relatives at an increasing rate with age, which further reduces contacts. We would expect to see this as a decline in the volume of WOM given and received from the point of retirement. If this decline is greater for men, it would fit the idea that work looms larger in the lives of men than women. We have checked levels of employment in the UK Office of National Statistics Bulletin, March 2010; men have higher levels of employment (full and part-time) up to the age band 50-64, where employment levels are the same. After 65 employment is low for both sexes (13% women, 11% men).
Research
With the data available, we ask the following research questions:RQ1. On which categories do men and women give most advice?RQ2. How do men and women differ in their production of PWOM and NWOM?RQ3. Are there any differences in the impact of WOM produced by men and women?RQ4. How does the volume of PWOM and NWOM vary by age in UK samples?RQ5. How does the impact of PWOM and NWOM vary by age in UK samples?
Measures
To measure WOM, given or received, we asked “How many times in the past six months have you given/received positive/negative advice about XXXX?” To measure the impact of WOM, we focused on the last instance of WOM received and used the Juster 11-point scale to assess the respondent’s probability of purchase before and after receiving the WOM. The Juster scale gives approximately 10% intervals (validated against objective probabilities
4
by Wright and MacRae, 2007). The difference (usually positive for PWOM and negative for NWOM) is the measure of impact. Note that our questions do not exclude person-to-person advice via the Internet, telephone or letter.
Data
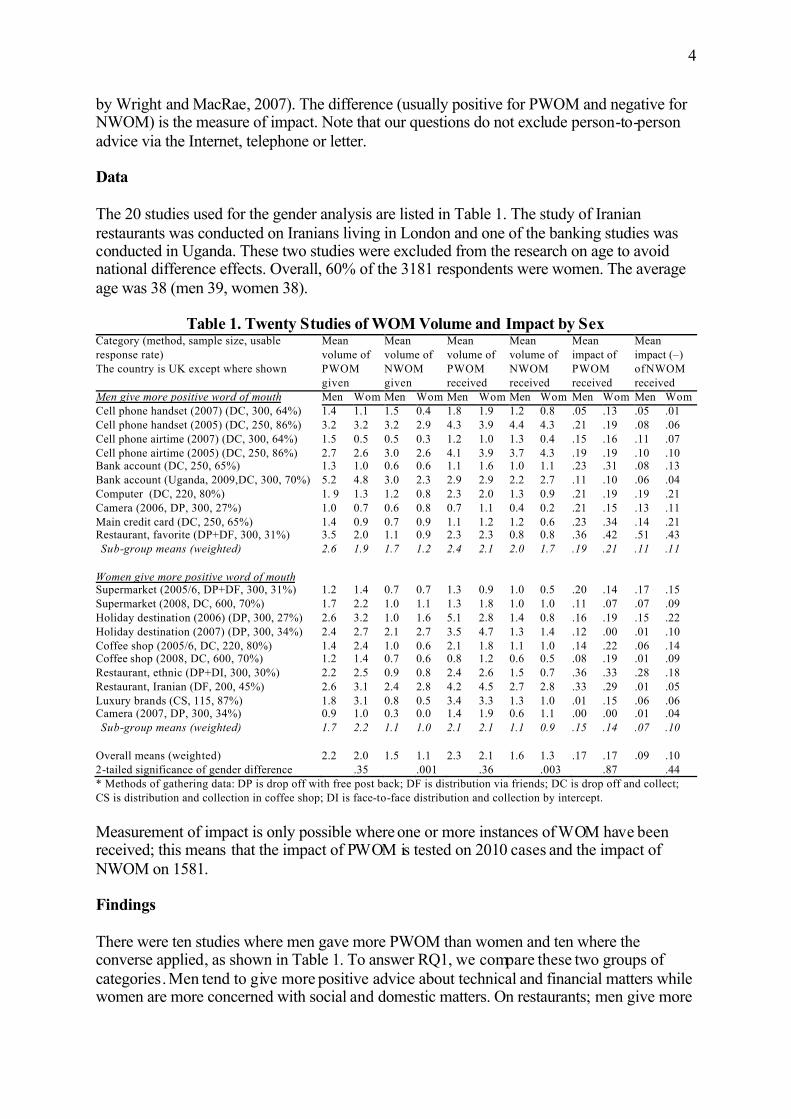
The 20 studies used for the gender analysis are listed in Table 1. The study of Iranian restaurants was conducted on Iranians living in London and one of the banking studies was conducted in Uganda. These two studies were excluded from the research on age to avoid national difference effects. Overall, 60% of the 3181 respondents were women. The average age was 38 (men 39, women 38).
Table 1. Twenty Studies of WOM Volume and Impact by SexCategory (method, sample size, usable response rate)The country is UK except where shown
Mean volume of PWOM given
Mean volume of NWOM given
Mean volume of PWOM received
Mean volume of NWOM received
Mean impact of PWOM received
Mean impact (–) ofNWOM received
Men give more positive word of mouth Men Wom Men Wom Men Wom Men Wom Men Wom Men WomCell phone handset (2007) (DC, 300, 64%) 1.4 1.1 1.5 0.4 1.8 1.9 1.2 0.8 .05 .13 .05 .01Cell phone handset (2005) (DC, 250, 86%) 3.2 3.2 3.2 2.9 4.3 3.9 4.4 4.3 .21 .19 .08 .06Cell phone airtime (2007) (DC, 300, 64%) 1.5 0.5 0.5 0.3 1.2 1.0 1.3 0.4 .15 .16 .11 .07Cell phone airtime (2005) (DC, 250, 86%) 2.7 2.6 3.0 2.6 4.1 3.9 3.7 4.3 .19 .19 .10 .10Bank account (DC, 250, 65%) 1.3 1.0 0.6 0.6 1.1 1.6 1.0 1.1 .23 .31 .08 .13Bank account (Uganda, 2009,DC, 300, 70%) 5.2 4.8 3.0 2.3 2.9 2.9 2.2 2.7 .11 .10 .06 .04Computer (DC, 220, 80%) 1. 9 1.3 1.2 0.8 2.3 2.0 1.3 0.9 .21 .19 .19 .21Camera (2006, DP, 300, 27%) 1.0 0.7 0.6 0.8 0.7 1.1 0.4 0.2 .21 .15 .13 .11Main credit card (DC, 250, 65%) 1.4 0.9 0.7 0.9 1.1 1.2 1.2 0.6 .23 .34 .14 .21Restaurant, favorite (DP+DF, 300, 31%) 3.5 2.0 1.1 0.9 2.3 2.3 0.8 0.8 .36 .42 .51 .43 Sub-group means (weighted) 2.6 1.9 1.7 1.2 2.4 2.1 2.0 1.7 .19 .21 .11 .11
Women give more positive word of mouthSupermarket (2005/6, DP+DF, 300, 31%) 1.2 1.4 0.7 0.7 1.3 0.9 1.0 0.5 .20 .14 .17 .15Supermarket (2008, DC, 600, 70%) 1.7 2.2 1.0 1.1 1.3 1.8 1.0 1.0 .11 .07 .07 .09Holiday destination (2006) (DP, 300, 27%) 2.6 3.2 1.0 1.6 5.1 2.8 1.4 0.8 .16 .19 .15 .22Holiday destination (2007) (DP, 300, 34%) 2.4 2.7 2.1 2.7 3.5 4.7 1.3 1.4 .12 .00 .01 .10Coffee shop (2005/6, DC, 220, 80%) 1.4 2.4 1.0 0.6 2.1 1.8 1.1 1.0 .14 .22 .06 .14Coffee shop (2008, DC, 600, 70%) 1.2 1.4 0.7 0.6 0.8 1.2 0.6 0.5 .08 .19 .01 .09Restaurant, ethnic (DP+DI, 300, 30%) 2.2 2.5 0.9 0.8 2.4 2.6 1.5 0.7 .36 .33 .28 .18Restaurant, Iranian (DF, 200, 45%) 2.6 3.1 2.4 2.8 4.2 4.5 2.7 2.8 .33 .29 .01 .05Luxury brands (CS, 115, 87%) 1.8 3.1 0.8 0.5 3.4 3.3 1.3 1.0 .01 .15 .06 .06Camera (2007, DP, 300, 34%) 0.9 1.0 0.3 0.0 1.4 1.9 0.6 1.1 .00 .00 .01 .04 Sub-group means (weighted) 1.7 2.2 1.1 1.0 2.1 2.1 1.1 0.9 .15 .14 .07 .10
Overall means (weighted) 2.2 2.0 1.5 1.1 2.3 2.1 1.6 1.3 .17 .17 .09 .102-tailed significance of gender difference .35 .001 .36 .003 .87 .44* Methods of gathering data: DP is drop off with free post back; DF is distribution via friends; DC is drop off and collect; CS is distribution and collection in coffee shop; DI is face-to-face distribution and collection by intercept.
Measurement of impact is only possible where one or more instances of WOM have been received; this means that the impact of PWOM is tested on 2010 cases and the impact of NWOM on 1581.
Findings
There were ten studies where men gave more PWOM than women and ten where the converse applied, as shown in Table 1. To answer RQ1, we compare these two groups of categories. Men tend to give more positive advice about technical and financial matters while women are more concerned with social and domestic matters. On restaurants; men give more
5
advice about favourite restaurants, a group that includes fast food, while women give more advice in the cases of ethnic and Iranian restaurants. To us, the more interesting aspect of this evidence is that small differences are observed between the sexes. Even on luxury goods, which might be seen as the sphere of women, the ratio is less than two to one.
We turn now to RQ2 about the extent to which the sexes differ. There is a difference between men and women with regard to NWOM. Over the 20 studies, 40% of men’s WOM is negative whereas 35% of women’s WOM is negative, echoing the findings from the Keller Fay Group; gender is a significant factor (p <.001) in the prediction of NWOM when it is entered in a multiple regression with PWOM. Interestingly, in the categories where men give more PWOM, the proportions of NWOM are the same for men and women. In the categories where women give more PWOM, they tend to give lower levels of NWOM, which accounts for the gender difference. Our evidence on received WOM shows no significant difference between the sexes; 35% of what men receive and 37% of what women receive is negative.
RQ3 was concerned with the impact of PWOM and NWOM on buying propensity. For convenience, we have expressed the negative impacts of NWOM as positive numbers in Table 1. Overall, neither PWOM nor NWOM impact differed significantly by sex. There seems to be a tendency for advice to have less impact on men when it is about a category where women give more PWOM but this did not reach significance (p = 0.1, 2-tailed test).
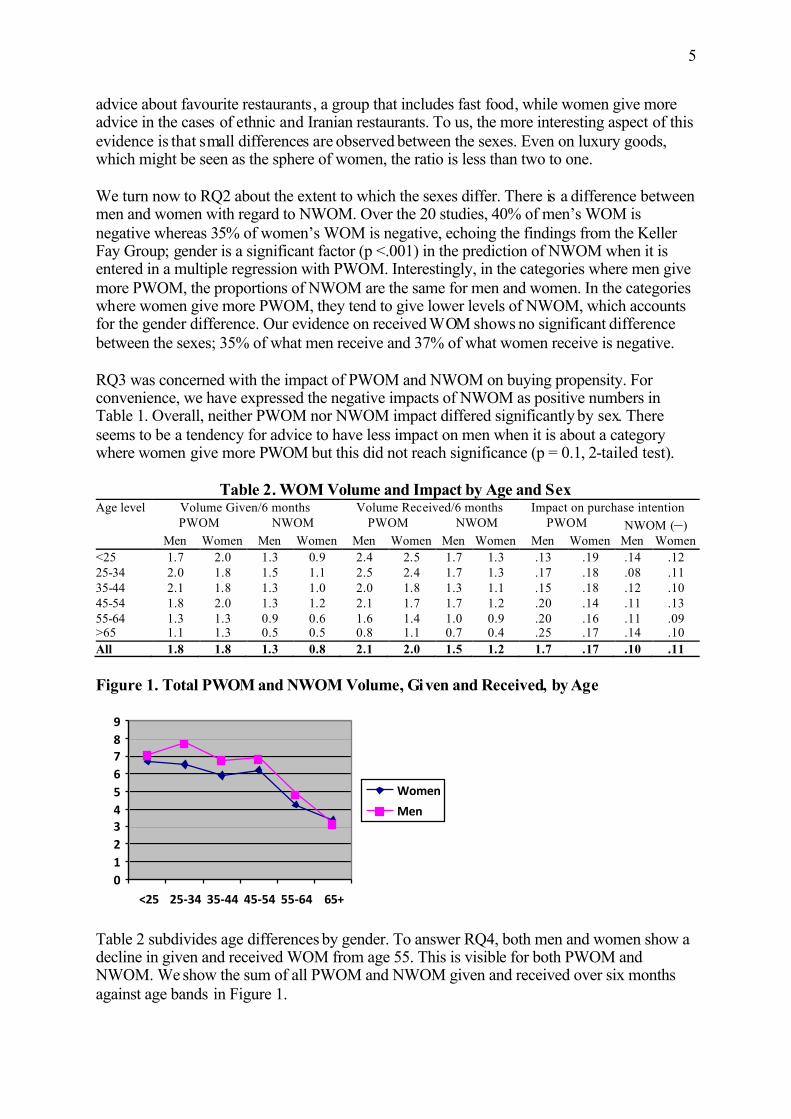
Table 2. WOM Volume and Impact by Age and SexAge level Volume Given/6 months Volume Received/6 months Impact on purchase intention
PWOM NWOM PWOM NWOM PWOM NWOM (–)Men Women Men Women Men Women Men Women Men Women Men Women
<25 1.7 2.0 1.3 0.9 2.4 2.5 1.7 1.3 .13 .19 .14 .1225-34 2.0 1.8 1.5 1.1 2.5 2.4 1.7 1.3 .17 .18 .08 .1135-44 2.1 1.8 1.3 1.0 2.0 1.8 1.3 1.1 .15 .18 .12 .1045-54 1.8 2.0 1.3 1.2 2.1 1.7 1.7 1.2 .20 .14 .11 .1355-64 1.3 1.3 0.9 0.6 1.6 1.4 1.0 0.9 .20 .16 .11 .09>65 1.1 1.3 0.5 0.5 0.8 1.1 0.7 0.4 .25 .17 .14 .10
All 1.8 1.8 1.3 0.8 2.1 2.0 1.5 1.2 1.7 .17 .10 .11
Figure 1. Total PWOM and NWOM Volume, Given and Received, by Age
0
1
2
34
5
6
78
9
<25 25-34 35-44 45-54 55-64 65+
Women
Men
Table 2 subdivides age differences by gender. To answer RQ4, both men and women show a decline in given and received WOM from age 55. This is visible for both PWOM and NWOM. We show the sum of all PWOM and NWOM given and received over six months against age bands in Figure 1.
6
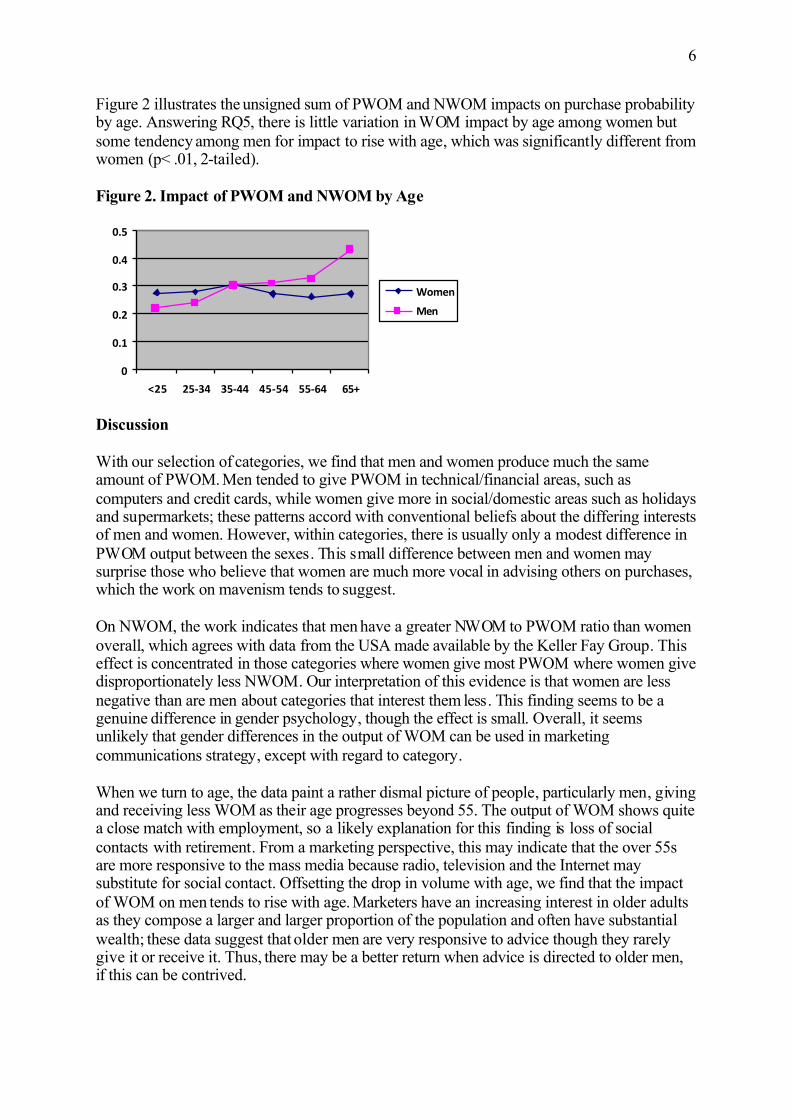
Figure 2 illustrates the unsigned sum of PWOM and NWOM impacts on purchase probability by age. Answering RQ5, there is little variation in WOM impact by age among women but some tendency among men for impact to rise with age, which was significantly different from women (p< .01, 2-tailed).
Figure 2. Impact of PWOM and NWOM by Age
0
0.1
0.2
0.3
0.4
0.5
<25 25-34 35-44 45-54 55-64 65+
Women
Men
Discussion
With our selection of categories, we find that men and women produce much the same amount of PWOM. Men tended to give PWOM in technical/financial areas, such as computers and credit cards, while women give more in social/domestic areas such as holidays and supermarkets; these patterns accord with conventional beliefs about the differing interests of men and women. However, within categories, there is usually only a modest difference in PWOM output between the sexes. This small difference between men and women maysurprise those who believe that women are much more vocal in advising others on purchases, which the work on mavenism tends to suggest.
On NWOM, the work indicates that men have a greater NWOM to PWOM ratio than womenoverall, which agrees with data from the USA made available by the Keller Fay Group. This effect is concentrated in those categories where women give most PWOM where women give disproportionately less NWOM. Our interpretation of this evidence is that women are less negative than are men about categories that interest them less. This finding seems to be a genuine difference in gender psychology, though the effect is small. Overall, it seems unlikely that gender differences in the output of WOM can be used in marketing communications strategy, except with regard to category.
When we turn to age, the data paint a rather dismal picture of people, particularly men, giving and receiving less WOM as their age progresses beyond 55. The output of WOM shows quite a close match with employment, so a likely explanation for this finding is loss of social contacts with retirement. From a marketing perspective, this may indicate that the over 55s are more responsive to the mass media because radio, television and the Internet may substitute for social contact. Offsetting the drop in volume with age, we find that the impact of WOM on men tends to rise with age. Marketers have an increasing interest in older adults as they compose a larger and larger proportion of the population and often have substantial wealth; these data suggest that older men are very responsive to advice though they rarely give it or receive it. Thus, there may be a better return when advice is directed to older men, if this can be contrived.

7
References
Carl, W. 2006. What's All the Buzz about? Everyday Communication and the Relational Basis of Word-of-Mouth and Buzz Marketing Practices, Management Communication Quarterly. 19(4), 601-634.
East, R. Hammond, K., Lomax, W. and Robinson, H. 2005. What is the Effect of a Recommendation? Marketing Review, 5(2), 145-157.
Feick, L., Price, L., 1987. The Market Maven: A Diffuser of Marketplace Information. Journal of Marketing, 51, 83-97.
Higie, R.A., Feick, L.F., Price, L.L., 1987. Types and Amount of Word-of-Mouth Communications about Retailers. Journal of Retailing, 63(3), 260-278.
Keller Fay TalkTrack data for 2009 were kindly provided by Brad Fay.
Liberman, M., 2006. Sex-Linked Lexical Budgets, http://itre.cis.upenn.edu/~myl/languagelog/archives/003420.html
Mehl, M.R., Vazire, S., Ramírez-Esparza, N., Slatcher, R.B., Pennebaker, J.W., 2007. Are Women Really more Talkative than Men? Science, 317(5834), 82.
Swanson, S.R., Gwinner, K.P., Larson, B.V., Janda, S., 2003. Motivations of College Student Game Attendance and Word-of-Mouth Behavior: The Impact of Gender Differences. Sport Marketing Quarterly, 12(3), 151-162.
Wright, M., MacRae, M., 2007. Bias and Variability in Purchase Intention Scales. Journal of the Academy of Marketing Science, 35(4), 617-624.