GDP AND MODIFIED GNI EXPLANATORY NOTE...National Income (hereafter ‘GNI’).7 GNI is a very...
16
Economic Division | GDP and ‘modified GNI’ – explanatory note Page | GDP AND ‘MODIFIED GNI’ – EXPLANATORY NOTE MAY 2018
Transcript of GDP AND MODIFIED GNI EXPLANATORY NOTE...National Income (hereafter ‘GNI’).7 GNI is a very...

Economic Division | GDP and ‘modified GNI’ – explanatory note Page |
GDP AND ‘MODIFIED GNI’ – EXPLANATORY NOTE
MAY 2018
Economic Division | GDP and ‘modified GNI’ – explanatory note Page | i
Contents
Page
Contents i Figures i Executive summary ii
1. Introduction and background 1
2. Conventional measures of economic activity 2
3. The disconnect between domestic income levels and GNP / GNI 4
3.1 Re-domiciled plcs / inversions 4 3.2 Aircraft leasing sector 5 3.3 On-shoring of intellectual property assets 5
4. Modified GNI 6
5. Key uses of modified GNI 8
6. Conclusion 11
Figures, boxes and appendices
Page
Figures Figure 1 ‘Walk’ from GDP to GNI 2 Figure 2 Difference between nominal GDP and GNI in the EU 3 Figure 3 GDP and modified GNI: 1995-2016 7 Figure 4 Difference between GNI and modified GNI: 1995-2016 8 Figure 5 Debt ratio 9
Boxes Box 1 Use of modified GNI – analysis of labour income share 10
Appendix Figure A1 Irish labour income share relative to EU average 12
Economic Division | GDP and ‘modified GNI’ – explanatory note Page | ii
Executive Summary
Globalisation presents significant challenges in terms of measuring economic activity. While this is the case in most advanced economies, the issues are particularly acute in an Irish context, given the large multinational footprint. For policy-makers, there are additional challenges, most notably related to interpreting the real-time information embedded in standard, internationally-recognised metrics such as Gross Domestic Product and Gross National Income. Movements in these aggregates have become increasingly disconnected from actual trends in living standards in Ireland. New Irish-specific measures of activity – most notably ‘modified Gross National Income’ – attempt to control for (part of) the impact of globalisation on Irish macro-economic statistics. While this is an important step forward, the data are not yet available in ‘real’ terms nor at a sufficiently high frequency (the data are currently published on an annual basis). In these circumstances, it is important that short-term cyclical analysis is cognisant of a wide suite of indicators: no single indicator provides a fully comprehensive overview of ‘true’ economic trends at present. The Department of Finance will continue to monitor all relevant metrics in order to fulfil its role in providing economic and budget advice to the Minister. Finally, it must be stressed that, notwithstanding statistical innovations, Ireland’s legal obligations (in the area of fiscal rules, for instance) are assessed on the internationally-agreed methodologies and there is little prospect of any change to this.
Economic Division | GDP and ‘modified GNI’ – explanatory note Page | 1
GDP and ‘modified GNI’ – explanatory note May 2018
1
Section 1 – Introduction and background Globalisation and, in particular, the increasing fragmentation of production across national borders, presents significant challenges for statisticians in measuring the size of an economy. For economic analysts, there is an additional challenge, namely the real-time interpretation of movements in conventional measures of economic activity, such as Gross Domestic Product and Gross National Income, and what these changes mean for the short-term evolution of the economy.2 For policy-makers, these statistical and interpretational issues complicate the formation of policies designed to stabilise demand, potentially leading to sub-optimal outcomes. As one of the most globally-integrated economies in the world, and with a large foreign-owned footprint, interpreting conventional measures of economic activity is especially challenging in an Irish context. Indeed, interpretation has become increasingly complicated in recent years due to the emergence of a number of relatively new phenomena, including inter alia the inclusion of intangible assets such as intellectual property in the capital stock. The purpose of this short note is to outline the differences between conventional measures of economic activity and the main3 alternative metric (‘modified’ Gross National Income’) that is now produced by the Central Statistics Office. The origins of the note lie in a request from the Public Accounts Committee for additional information following discussions with officials from the Department of Finance (19th April 2018).4 At the outset, it must be stressed that macroeconomic data in Ireland are compiled in line with international standards – the data measure what they are designed to measure. Instead, the fault-lines begin to emerge in the interpretation of the data, with the information-content of key macroeconomic aggregates in Ireland more limited than elsewhere. This document is structured as follows. Standard, internationally-recognised measures of economic activity are explained in section 2, which also outlines the key shortcomings of these metrics when applied in an Irish context. In section 3, key factors underpinning the growing divergence between Gross National Income and domestic income levels in recent years are documented while, in section 4, so-called ‘modified Gross National Income’ (also
1 This report was produced by the Economic Division of the Department of Finance, and does not necessarily reflect the views of the Minister of Finance or the Irish Government. 2 It is beyond doubt that forecasting short-term trends in highly globalised economies has become increasingly difficult in recent times with Ireland being a textbook example. 3 Other alternative metrics produced by the Central Statistics Office – such as domestic demand excluding investment in aircraft and intellectual property – are not considered in detail in this document. 4 Transcript available at: http://oireachtasdebates.oireachtas.ie/debates%20authoring/debateswebpack.nsf/committeetakes/ACC2018041900002?opendocument#L01300.
Economic Division | GDP and ‘modified GNI’ – explanatory note Page | 2
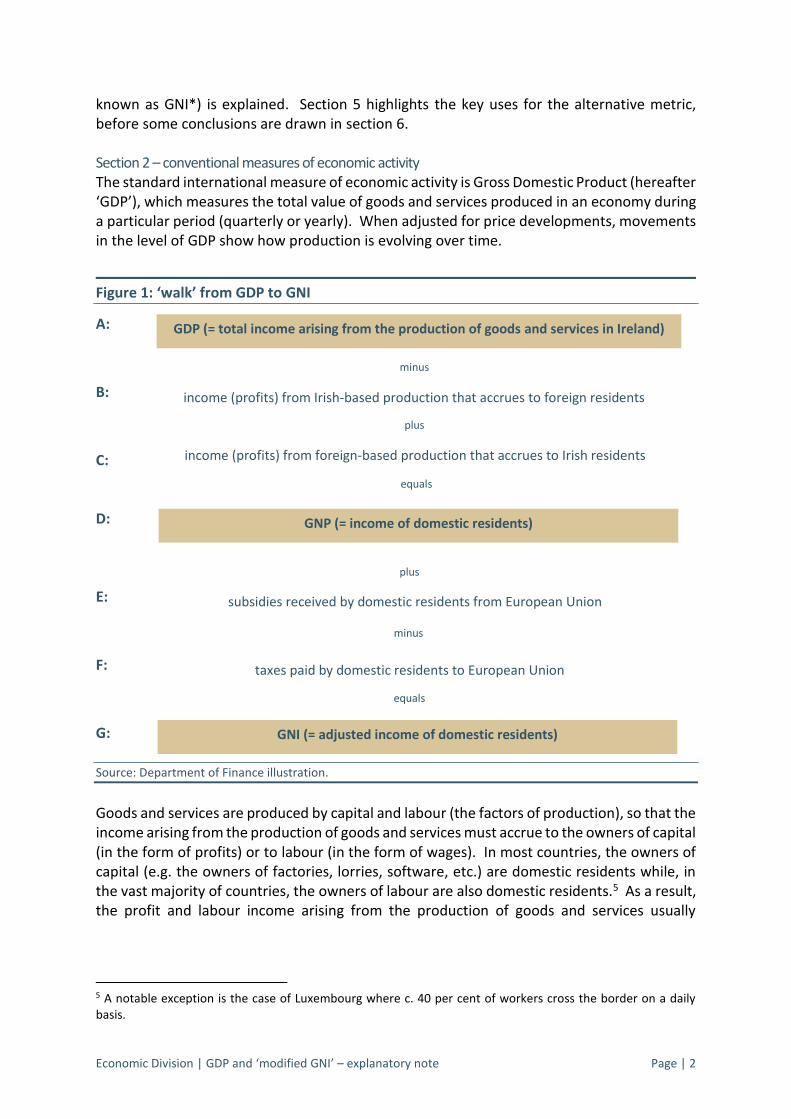
known as GNI*) is explained. Section 5 highlights the key uses for the alternative metric, before some conclusions are drawn in section 6. Section 2 – conventional measures of economic activity The standard international measure of economic activity is Gross Domestic Product (hereafter ‘GDP’), which measures the total value of goods and services produced in an economy during a particular period (quarterly or yearly). When adjusted for price developments, movements in the level of GDP show how production is evolving over time.
Figure 1: ‘walk’ from GDP to GNI
A:
B:
C:
D:
E:
F:
G: Source: Department of Finance illustration.
Goods and services are produced by capital and labour (the factors of production), so that the income arising from the production of goods and services must accrue to the owners of capital (in the form of profits) or to labour (in the form of wages). In most countries, the owners of capital (e.g. the owners of factories, lorries, software, etc.) are domestic residents while, in the vast majority of countries, the owners of labour are also domestic residents.5 As a result, the profit and labour income arising from the production of goods and services usually
5 A notable exception is the case of Luxembourg where c. 40 per cent of workers cross the border on a daily basis.
GDP (= total income arising from the production of goods and services in Ireland)
minus
income (profits) from Irish-based production that accrues to foreign residents
plus
income (profits) from foreign-based production that accrues to Irish residents
GNP (= income of domestic residents)
plus
minus
taxes paid by domestic residents to European Union
subsidies received by domestic residents from European Union
GNI (= adjusted income of domestic residents)
equals
equals
Economic Division | GDP and ‘modified GNI’ – explanatory note Page | 3
accrues to domestic residents, i.e. GDP measures the flow of income to domestic residents in a particular period.6 Ireland is somewhat unusual, however, in that the owners of a large part of the capital stock are, in fact, non-residents. This situation has arisen from the importance of inward foreign direct investment to the Irish economy from the 1960s onwards. As the pace of globalisation has accelerated over the past few decades, the Irish economy has become progressively more and more embedded in global supply-chains. An important consequence of this is that a significant part of the income arising from the production of goods and services in Ireland accrues to the foreign owners of capital assets based in Ireland. Hence, the GDP aggregate overstates the living standards of Irish residents. Gross National Product (hereafter ‘GNP’), on the other hand, removes the profits of foreign-owned firms (and, symmetrically, includes the profits earned by the foreign operations of Irish-owned firms) and, accordingly, provides a better measures of the income accruing to Irish residents.
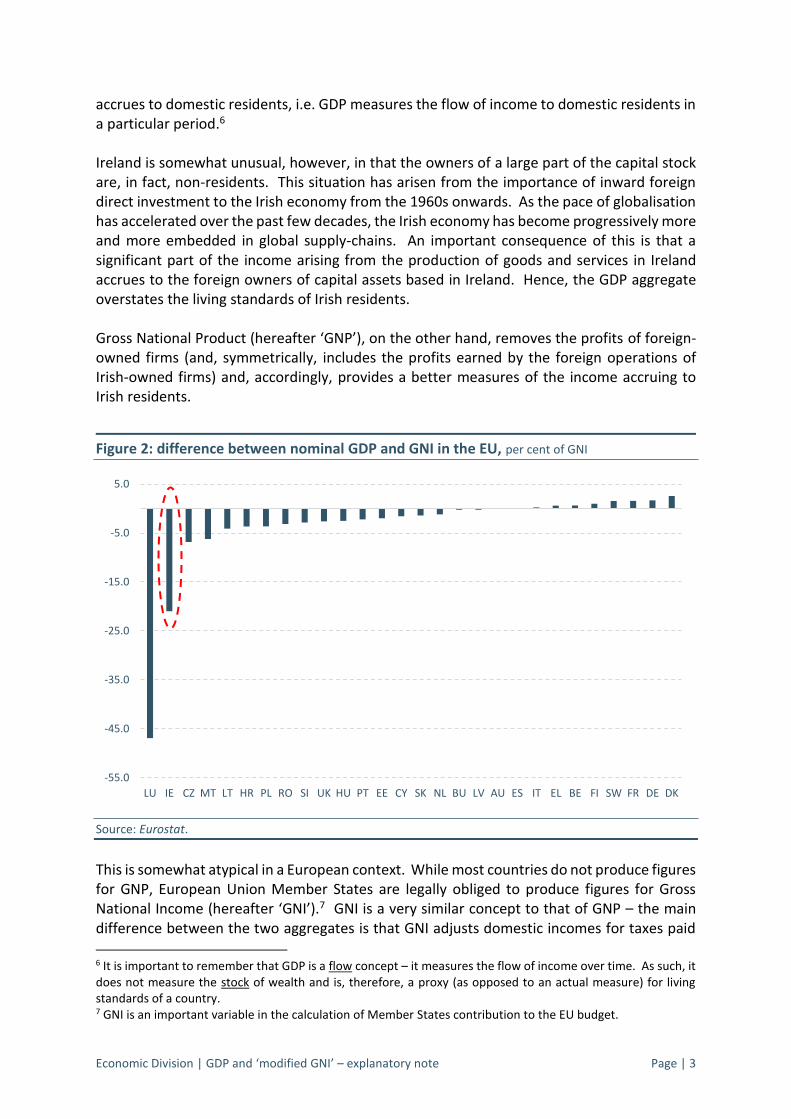
Figure 2: difference between nominal GDP and GNI in the EU, per cent of GNI
Source: Eurostat.
This is somewhat atypical in a European context. While most countries do not produce figures for GNP, European Union Member States are legally obliged to produce figures for Gross National Income (hereafter ‘GNI’).7 GNI is a very similar concept to that of GNP – the main difference between the two aggregates is that GNI adjusts domestic incomes for taxes paid
6 It is important to remember that GDP is a flow concept – it measures the flow of income over time. As such, it does not measure the stock of wealth and is, therefore, a proxy (as opposed to an actual measure) for living standards of a country. 7 GNI is an important variable in the calculation of Member States contribution to the EU budget.
-55.0
-45.0
-35.0
-25.0
-15.0
-5.0
5.0
LU IE CZ MT LT HR PL RO SI UK HU PT EE CY SK NL BU LV AU ES IT EL BE FI SW FR DE DK
Economic Division | GDP and ‘modified GNI’ – explanatory note Page | 4
to the EU and for subsidies received from the EU (see figure 1 and noting that the difference between lines E and F is small). Figure 2 shows the difference between GDP and GNI (expressed as a percentage of GNI) across the EU Member States in 2016. As is evident, Ireland and Luxembourg are outliers with, in Ireland’s case, the level of GNI over one-fifth lower than the level of GDP. For most Member States, the difference is fairly minor (for all but four Member States, the difference is in the + / - 5 per cent range). In summary, therefore, for most (advanced) countries, the level of GDP is a reasonable approximation of living standards. For small economies where the factors of production are highly mobile across national borders (such as Ireland and Luxembourg in the EU), GNP and GNI are more meaningful. This is the main reason why economists in Ireland have traditionally focussed on GNP as a better approximation of Irish living standards than on GDP. Section 3 – the disconnect between domestic income levels and GNP / GNI While the level of GNP (or GNI) has historically been a better approximation of Irish living standards, several factors have emerged in recent years that have resulted in an increasing disconnect between the GNP / GNI aggregates and the living standards of domestic residents. 3.1: redomiciled plcs / inversions An important factor inflating the level of GNP / GNI since the late-2000s has been multinational firms relocating (or ‘inverting’) their group headquarters to Ireland. These firms are referred to as ‘re-domiciled publically limited companies’. Because their headquarters are located in Ireland, the profits on their global operations are, in national accounting terms, treated as profit inflows to Ireland (included in line C in figure 1).8 From a taxation perspective, the income of the Irish entity would primarily consist of dividends received from the profits of substantive operations carried out by its subsidiaries in foreign jurisdictions. Foreign tax credits, reflecting the tax paid on the underlying activity carried out abroad, would be available to reduce, or potentially eliminate, any Irish tax payable on the dividend income received by the Irish entity. Foreign tax credits are a standard feature of all corporate tax systems and are required to prevent the same activity from being taxed twice or more. As a result, the ultimate Irish income tax liability of a re-domiciled entity that acts purely as a holding company can be very low or almost zero. Indeed, by raising the level of GNI without generating additional revenue, this type of activity imposes a cost on the national finances via higher contributions to the EU budget.9
8 Profit inflows are retained in Ireland with a corresponding outflow only arising when a dividend is paid to the foreign owner. 9 The US has taken action in recent years to discourage companies from moving abroad in this fashion. In particular, recent comprehensive US tax reform should have the effect of removing the “push” factors which encouraged companies to “invert” out of the US which is likely to see an end to this type of re-domiciliation activity by US companies.
Economic Division | GDP and ‘modified GNI’ – explanatory note Page | 5
3.2: aircraft leasing sector Ireland is an important hub for multinational firms engaged in aircraft leasing, with around 50 per cent of the world’s leased commercial aircraft managed here.10 Given the scale of this activity, this sector has a significant impact on the level of GNP / GNI. For instance, balance of payments data show that operational leasing exports (the bulk of which arise from the aircraft leasing sector) have recorded a three-fold increase between 2008 and 2016 and now account for around 9 per cent of all service exports. The growth of this sector has driven a wedge between measured GNP / GNI and actual income levels. This is because the Irish-resident firms own the aircraft and, as a result, the assets are included in the Irish capital stock (even though the aircraft may never cross Irish airspace). The depreciation bill associated with these assets is large, increasing GNP / GNI by reducing profit outflows from the sector. This is a capital-intensive sector with the domestic activity generated by the sector – the pay-bill and taxation paid – amounted to less than 0.2 per cent of GDP in 2016.11 3.3: on-shoring of intellectual property assets In response to the recommendations set out in the OECD’s Base Erosion and Profit Shifting (‘BEPS’) exercise, some multinational firms that had previously housed their high-income generating intellectual property (IP) assets offshore have been moving these assets ‘on-shore’ This phenomenon began around 2015 and, under the current classification system, intangible assets are included in the capital stock of the destination jurisdiction.12 From an Irish perspective, there is some evidence to suggest that ‘first mover advantage’ may be at work. In particular, it would seem that, in the on-shoring decision, some firms appear to be co-locating their IP assets where they have existing sizeable production capacity. As a result, there have been several instances of highly valuable IP assets being on-shored to Ireland. It is important to stress that, in most cases, the on-shoring is GDP-neutral in the short-term; this is because the investment in IP is offset by a corresponding increase in imports.
In 2015, however, a small number of firms relocated their entire balance sheets to Ireland, with these balance sheets mainly consisting of IP assets, i.e. the IP was on-shored by way of balance sheet relocation rather than purchased by an Irish-resident subsidiary. As a result, the stock of capital assets in Ireland rose by nearly 50 per cent (from €764 billion to €1.06 trillion) in a single year, an unprecedented pace of increase. This increase in the capital stock, together with contract manufacturing13 activity attributable to the entities and the
10 Source: ‘A better result for you – Opportunities for aviation finance companies to use Ireland’, PwC 2014. 11 See ‘Aircraft leasing in Ireland 2007 – 2016’, Central Statistics Office, February 2018, available at: http://www.cso.ie/en/releasesandpublications/ep/p-ali/aircraftleasinginireland2007-2016/incomeandexpenditure/.
The calculation assumes that there is no significant additional domestic costs/profits associated with the sector. 12 The System of National Accounts (SNA) 2008, adopted by the United Nations, was adopted in a European context via the European System of Accounts (ESA) 2010. One of the main changes relative to the previous standard (ESA 1995) was the capitalisation of intangible assets, i.e. under ESA 2010 intangible assets are included in the capital stock of Member States where these assets are located. 13 Contract manufacturing is a form of outsourcing whereby a company in Ireland engages a company abroad to manufacture products on its behalf (and vice versa) but where the Irish-resident firm retains ownership of all inputs into the production process.
Economic Division | GDP and ‘modified GNI’ – explanatory note Page | 6
composition of the assets (IP assets depreciate more rapidly than most physical assets) led to an increase of 34 per cent in exports in 2015 and an effective doubling in the national depreciation bill that year. The new contract manufacturing activity drove the GDP increase of 26 per cent, while the significant increase in the depreciation bill reduced profit outflows, leading to an almost 19 per cent increase in GNP.14 In summary, therefore, the level of GNP / GNI has been inflated in recent years by the inclusion of foreign profits of ‘inverted’ firms (notwithstanding that the profits do not accrue to Irish residents) and the depreciation bill associated with foreign-owned assets that are included in the Irish capital stock (notwithstanding that the bill must be borne by non-residents and not by Irish residents). Section 4 – modified GNI On foot of the exceptional growth rate recorded in 2015, as well as the growing disconnect between standard macroeconomic aggregates and actual income levels, an Economic Statistics Review Group (hereafter the ‘Group’) was established by the Central Statistics Office (hereafter ‘CSO’) in 2016. The remit of the Group was to advise on alternative measures that would provide better indicators of economic trends in Ireland. One of the key recommendations of the Group was for the CSO to develop a new indicator of the size of the economy that excludes globalisation activities that have a disproportionate impact on the Irish results.15 In July 2017, the CSO published an alternative measure of the size of the economy, so-called ‘modified Gross National Income’ (sometimes called GNI*). This aggregate is equal to GNI but excludes the following:
retained earnings of firms that have re-domiciled to Ireland;
the depreciation of foreign-owned intellectual property assets located in Ireland; and,
the depreciation of aircraft owned by aircraft-leasing companies. The rationale for excluding the retained earnings (sometimes called undistributed profits) of inverted firms is that these profits do not accrue to Irish residents and will, at some stage, be paid out to the non-resident owners of the firm by way of dividends. In relation to depreciation of Irish-based, but foreign-owned, IP and aircraft, these are costs borne by the foreign shareholders and not by Irish residents and, accordingly, should be excluded from actual incomes.16
14 Of course not all of the increase in activity that year was due to this phenomenon. 15 The final report of the ESRG is available at: http://www.cso.ie/en/media/csoie/newsevents/documents/reportoftheeconomicstatisticsreviewgroup/Economic_Statistics_Review_(ESRG)_Report_Dec_2016.pdf 16 GNI and GNI* are both gross measures of income, i.e. they include the cost of depreciation.
Economic Division | GDP and ‘modified GNI’ – explanatory note Page | 7
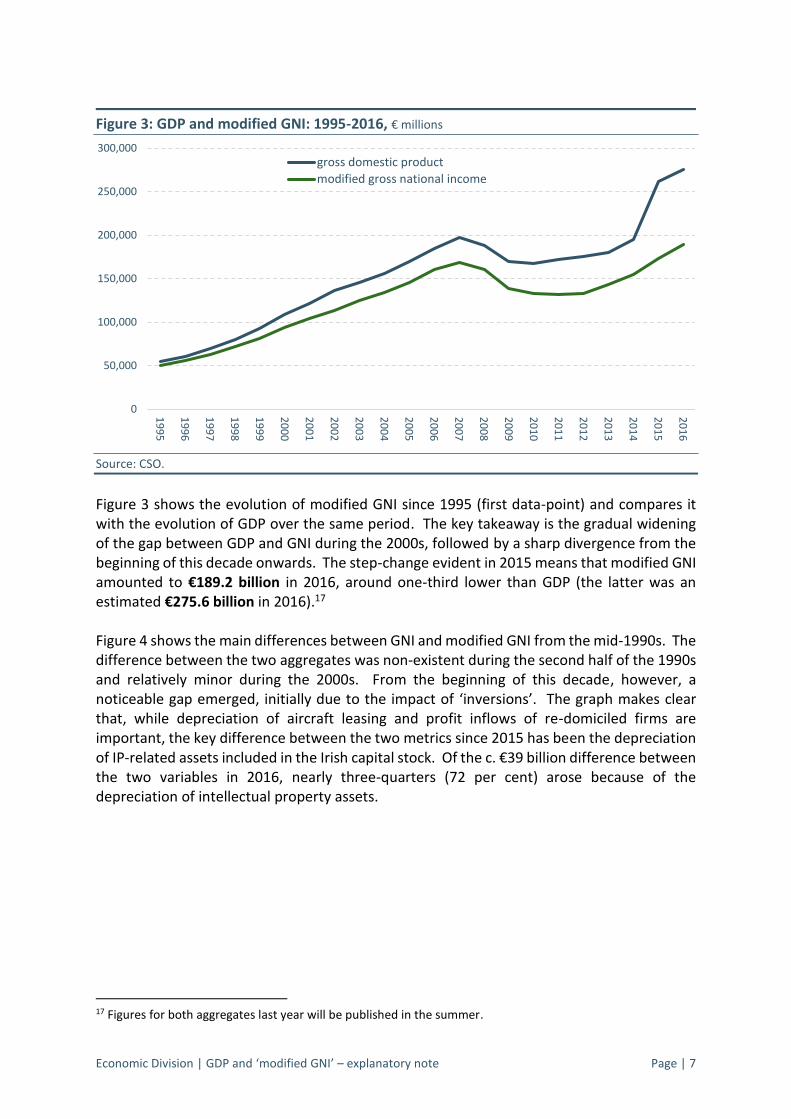
Figure 3: GDP and modified GNI: 1995-2016, € millions
Source: CSO.
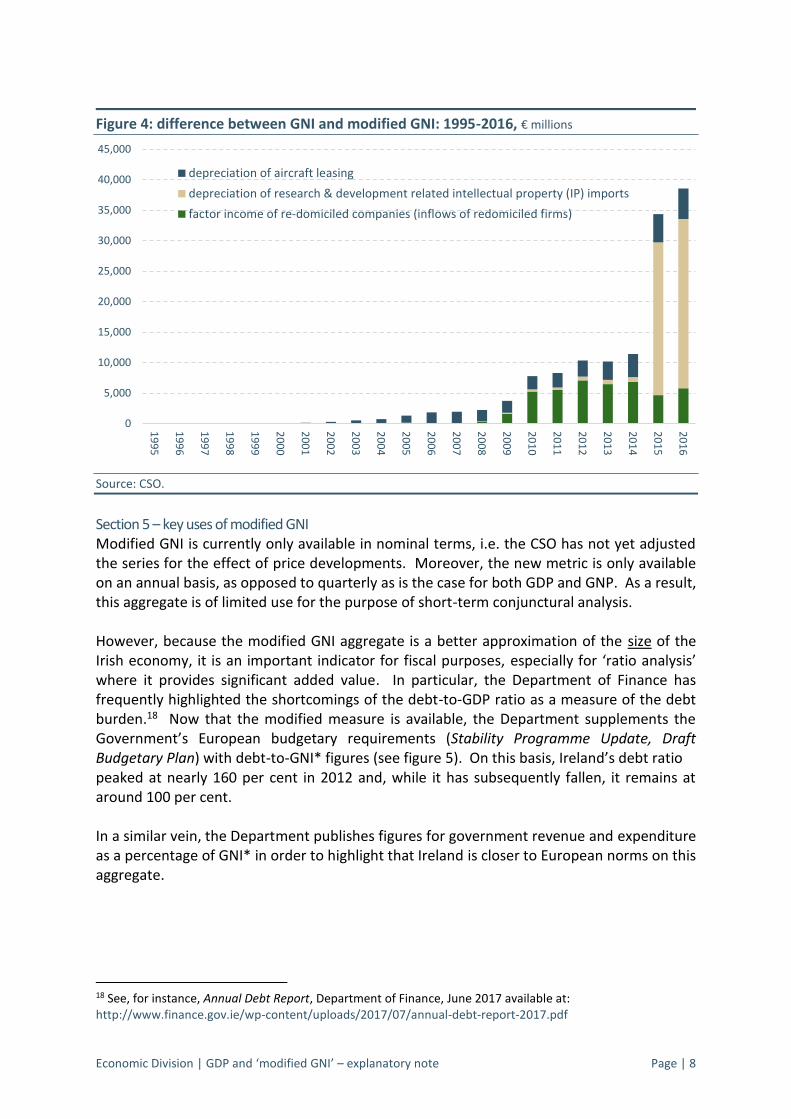
Figure 3 shows the evolution of modified GNI since 1995 (first data-point) and compares it with the evolution of GDP over the same period. The key takeaway is the gradual widening of the gap between GDP and GNI during the 2000s, followed by a sharp divergence from the beginning of this decade onwards. The step-change evident in 2015 means that modified GNI amounted to €189.2 billion in 2016, around one-third lower than GDP (the latter was an estimated €275.6 billion in 2016).17 Figure 4 shows the main differences between GNI and modified GNI from the mid-1990s. The difference between the two aggregates was non-existent during the second half of the 1990s and relatively minor during the 2000s. From the beginning of this decade, however, a noticeable gap emerged, initially due to the impact of ‘inversions’. The graph makes clear that, while depreciation of aircraft leasing and profit inflows of re-domiciled firms are important, the key difference between the two metrics since 2015 has been the depreciation of IP-related assets included in the Irish capital stock. Of the c. €39 billion difference between the two variables in 2016, nearly three-quarters (72 per cent) arose because of the depreciation of intellectual property assets.
17 Figures for both aggregates last year will be published in the summer.
0
50,000
100,000
150,000
200,000
250,000
300,000
19
95
19
96
19
97
19
98
19
99
20
00
20
01
20
02
20
03
20
04
20
05
20
06
20
07
20
08
20
09
20
10
20
11
20
12
20
13
20
14
20
15
20
16
gross domestic product
modified gross national income
Economic Division | GDP and ‘modified GNI’ – explanatory note Page | 8
Figure 4: difference between GNI and modified GNI: 1995-2016, € millions
Source: CSO.
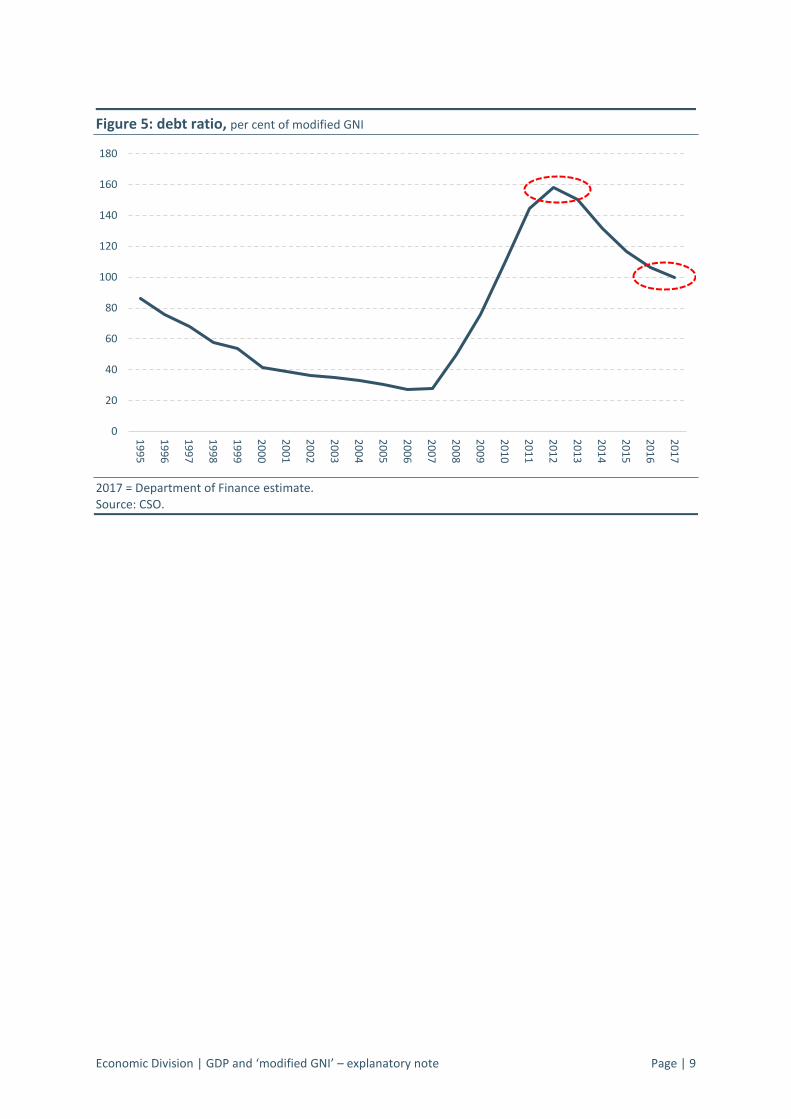
Section 5 – key uses of modified GNI Modified GNI is currently only available in nominal terms, i.e. the CSO has not yet adjusted the series for the effect of price developments. Moreover, the new metric is only available on an annual basis, as opposed to quarterly as is the case for both GDP and GNP. As a result, this aggregate is of limited use for the purpose of short-term conjunctural analysis. However, because the modified GNI aggregate is a better approximation of the size of the Irish economy, it is an important indicator for fiscal purposes, especially for ‘ratio analysis’ where it provides significant added value. In particular, the Department of Finance has frequently highlighted the shortcomings of the debt-to-GDP ratio as a measure of the debt burden.18 Now that the modified measure is available, the Department supplements the Government’s European budgetary requirements (Stability Programme Update, Draft Budgetary Plan) with debt-to-GNI* figures (see figure 5). On this basis, Ireland’s debt ratio peaked at nearly 160 per cent in 2012 and, while it has subsequently fallen, it remains at around 100 per cent. In a similar vein, the Department publishes figures for government revenue and expenditure as a percentage of GNI* in order to highlight that Ireland is closer to European norms on this aggregate.
18 See, for instance, Annual Debt Report, Department of Finance, June 2017 available at: http://www.finance.gov.ie/wp-content/uploads/2017/07/annual-debt-report-2017.pdf
0
5,000
10,000
15,000
20,000
25,000
30,000
35,000
40,000
45,000
19
95
19
96
19
97
19
98
19
99
20
00
20
01
20
02
20
03
20
04
20
05
20
06
20
07
20
08
20
09
20
10
20
11
20
12
20
13
20
14
20
15
20
16
depreciation of aircraft leasing
depreciation of research & development related intellectual property (IP) imports
factor income of re-domiciled companies (inflows of redomiciled firms)
Economic Division | GDP and ‘modified GNI’ – explanatory note Page | 9
Figure 5: debt ratio, per cent of modified GNI
2017 = Department of Finance estimate. Source: CSO.
0
20
40
60
80
100
120
140
160
180
19
95
19
96
19
97
19
98
19
99
20
00
20
01
20
02
20
03
20
04
20
05
20
06
20
07
20
08
20
09
20
10
20
11
20
12
20
13
20
14
20
15
20
16
20
17
Economic Division | GDP and ‘modified GNI’ – explanatory note Page | 10
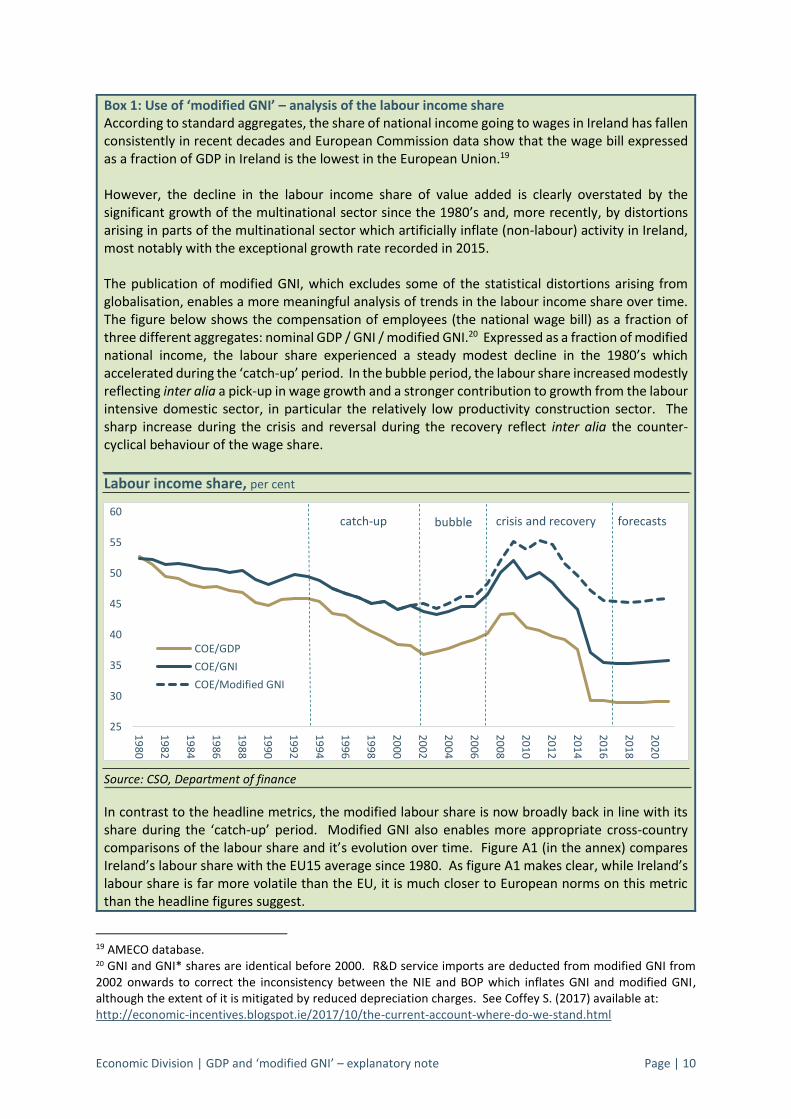
Box 1: Use of ‘modified GNI’ – analysis of the labour income share According to standard aggregates, the share of national income going to wages in Ireland has fallen consistently in recent decades and European Commission data show that the wage bill expressed as a fraction of GDP in Ireland is the lowest in the European Union.19 However, the decline in the labour income share of value added is clearly overstated by the significant growth of the multinational sector since the 1980’s and, more recently, by distortions arising in parts of the multinational sector which artificially inflate (non-labour) activity in Ireland, most notably with the exceptional growth rate recorded in 2015. The publication of modified GNI, which excludes some of the statistical distortions arising from globalisation, enables a more meaningful analysis of trends in the labour income share over time. The figure below shows the compensation of employees (the national wage bill) as a fraction of three different aggregates: nominal GDP / GNI / modified GNI.20 Expressed as a fraction of modified national income, the labour share experienced a steady modest decline in the 1980’s which accelerated during the ‘catch-up’ period. In the bubble period, the labour share increased modestly reflecting inter alia a pick-up in wage growth and a stronger contribution to growth from the labour intensive domestic sector, in particular the relatively low productivity construction sector. The sharp increase during the crisis and reversal during the recovery reflect inter alia the counter-cyclical behaviour of the wage share.
Labour income share, per cent
Source: CSO, Department of finance
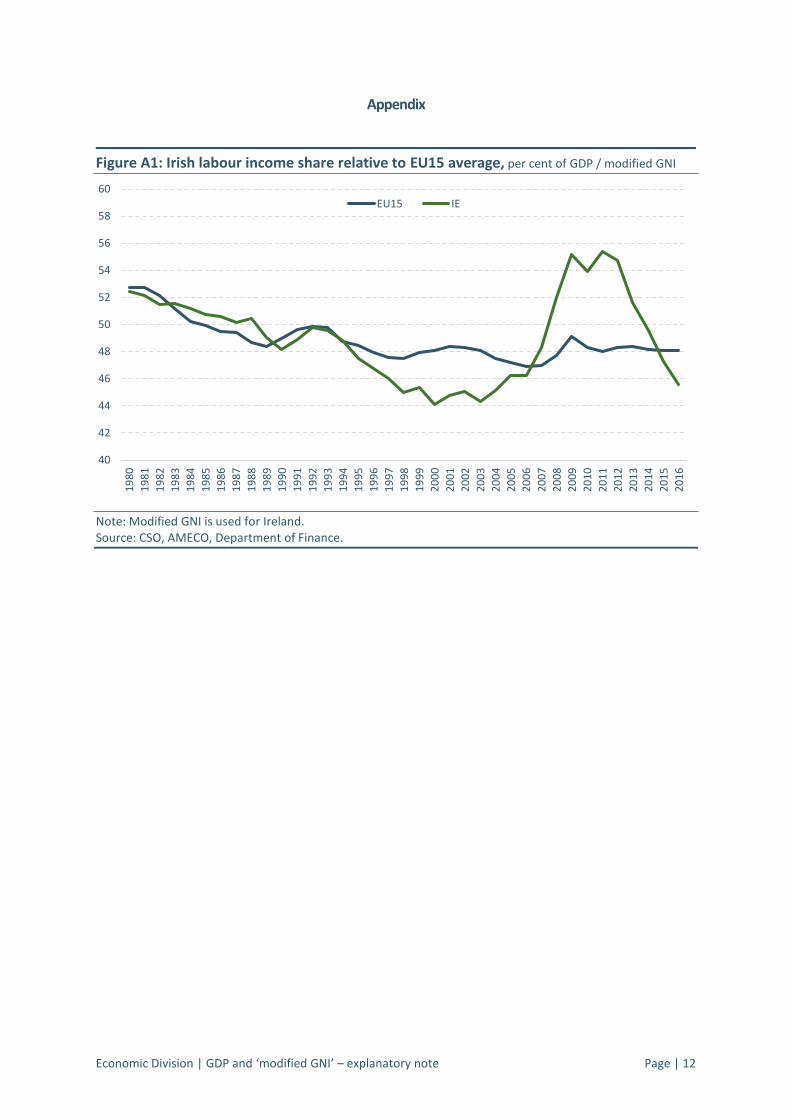
In contrast to the headline metrics, the modified labour share is now broadly back in line with its share during the ‘catch-up’ period. Modified GNI also enables more appropriate cross-country comparisons of the labour share and it’s evolution over time. Figure A1 (in the annex) compares Ireland’s labour share with the EU15 average since 1980. As figure A1 makes clear, while Ireland’s labour share is far more volatile than the EU, it is much closer to European norms on this metric than the headline figures suggest.
19 AMECO database. 20 GNI and GNI* shares are identical before 2000. R&D service imports are deducted from modified GNI from 2002 onwards to correct the inconsistency between the NIE and BOP which inflates GNI and modified GNI, although the extent of it is mitigated by reduced depreciation charges. See Coffey S. (2017) available at: http://economic-incentives.blogspot.ie/2017/10/the-current-account-where-do-we-stand.html
25
30
35
40
45
50
55
60
19
80
19
82
19
84
19
86
19
88
19
90
19
92
19
94
19
96
19
98
20
00
20
02
20
04
20
06
20
08
20
10
20
12
20
14
20
16
20
18
20
20
COE/GDP
COE/GNI
COE/Modified GNI
catch-up bubble crisis and recovery forecasts
Economic Division | GDP and ‘modified GNI’ – explanatory note Page | 11
Section 6 – conclusion It is important to stress that, from a legal perspective, the CSO is compelled to produce existing macroeconomic statistics (GDP, GNP, etc.) in accordance with internationally-agreed methodologies. Similarly, Ireland’s international obligations are still assessed on these bases (e.g. the EU budget contribution is still based on GNI, compliance with the Stability and Growth Pact is assessed on the basis of GDP). There is no prospect of any change in this in the short- or medium-term. Having said that, in formulating domestic policies, modified GNI is an important input. The Department of Finance will continue to publish the debt-to-GNI* ratio in all relevant publications in order to overcome the shortcomings of the debt-to-GDP ratio and to provide a better understanding regarding the ‘true’ burden of debt. Furthermore, once modified GNI is available on a ‘real’ basis, it could potentially become a better indicator of the cyclical position of the economy. Real-time information on the cyclical position of the economy is crucial in formulating appropriate, counter-cyclical budgetary policy. Until such time as this is available, the Department will continue to analyse a wider suite of indicators, including domestic demand (excluding the volatile components) and labour market variables, in order to fully inform its assessment of the economic cycle.
Economic Division | GDP and ‘modified GNI’ – explanatory note Page | 12
Appendix
Figure A1: Irish labour income share relative to EU15 average, per cent of GDP / modified GNI
Note: Modified GNI is used for Ireland. Source: CSO, AMECO, Department of Finance.
40
42
44
46
48
50
52
54
56
58
60
19
80
19
81
19
82
19
83
19
84
19
85
19
86
19
87
19
88
19
89
19
90
19
91
19
92
19
93
19
94
19
95
19
96
19
97
19
98
19
99
20
00
20
01
20
02
20
03
20
04
20
05
20
06
20
07
20
08
20
09
20
10
20
11
20
12
20
13
20
14
20
15
20
16
EU15 IE

Economic Division | GDP and ‘modified GNI’ – explanatory note Page | 13