GDB in SV_1st_meetup_09082016
25
How to implement Project Data into Graph Database
-
Upload
joshua-bae -
Category
Data & Analytics
-
view
164 -
download
0
Transcript of GDB in SV_1st_meetup_09082016

How to implement Project Data into Graph Database
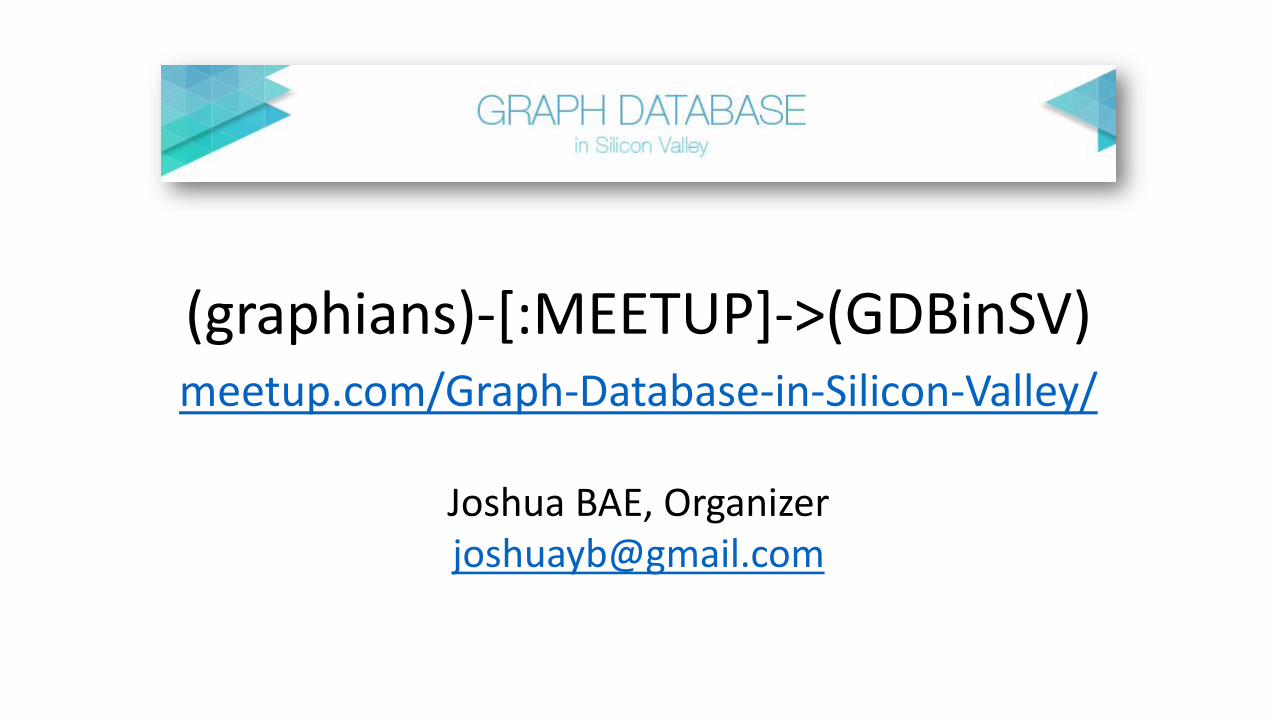
(graphians)-[:MEETUP]->(GDBinSV)meetup.com/Graph-Database-in-Silicon-Valley/
Joshua BAE, [email protected]
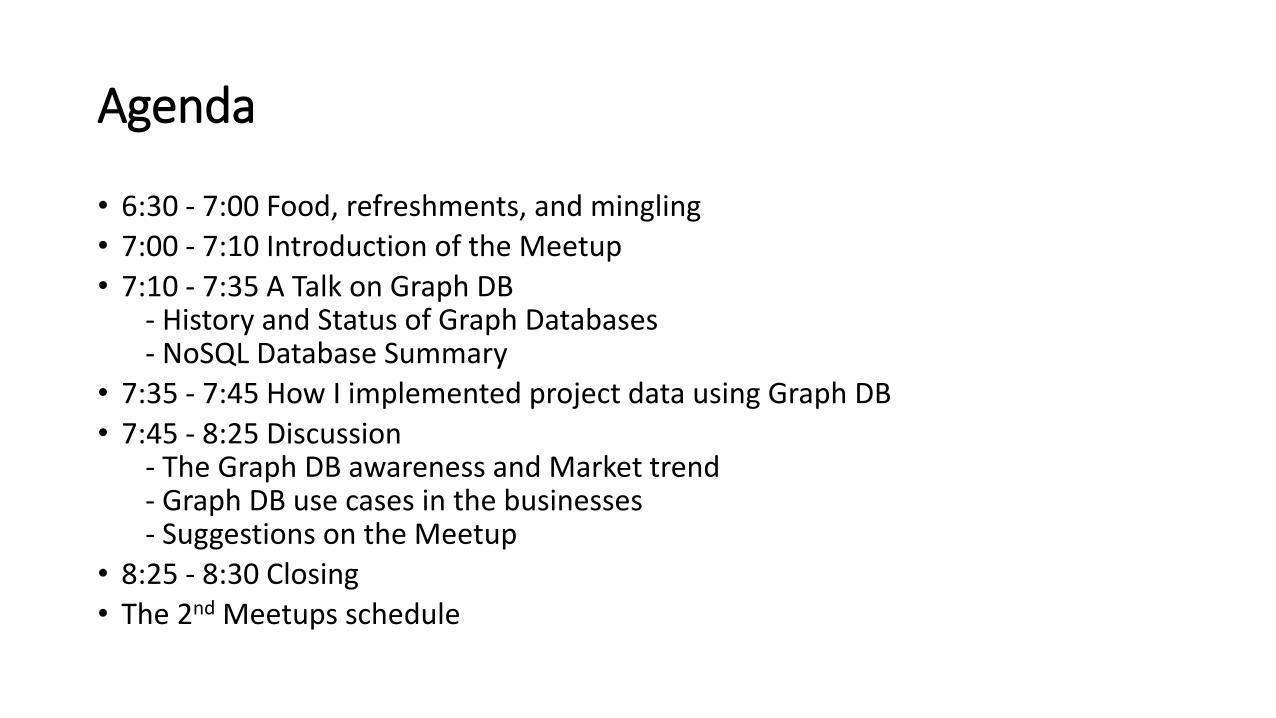
Agenda
• 6:30 - 7:00 Food, refreshments, and mingling
• 7:00 - 7:10 Introduction of the Meetup
• 7:10 - 7:35 A Talk on Graph DB- History and Status of Graph Databases- NoSQL Database Summary
• 7:35 - 7:45 How I implemented project data using Graph DB
• 7:45 - 8:25 Discussion- The Graph DB awareness and Market trend- Graph DB use cases in the businesses- Suggestions on the Meetup
• 8:25 - 8:30 Closing
• The 2nd Meetups schedule

( Bitnin)-[:Sponsors]->(GDBinSV)


There are approximately 260,000 cell site towers across the US. This chart displays the number of cell towers per state.

TX 25,969
CA 21,835
UT1,703
Interestingly, there are more cell sites in Texas than in California while California has about 12 million more in population.
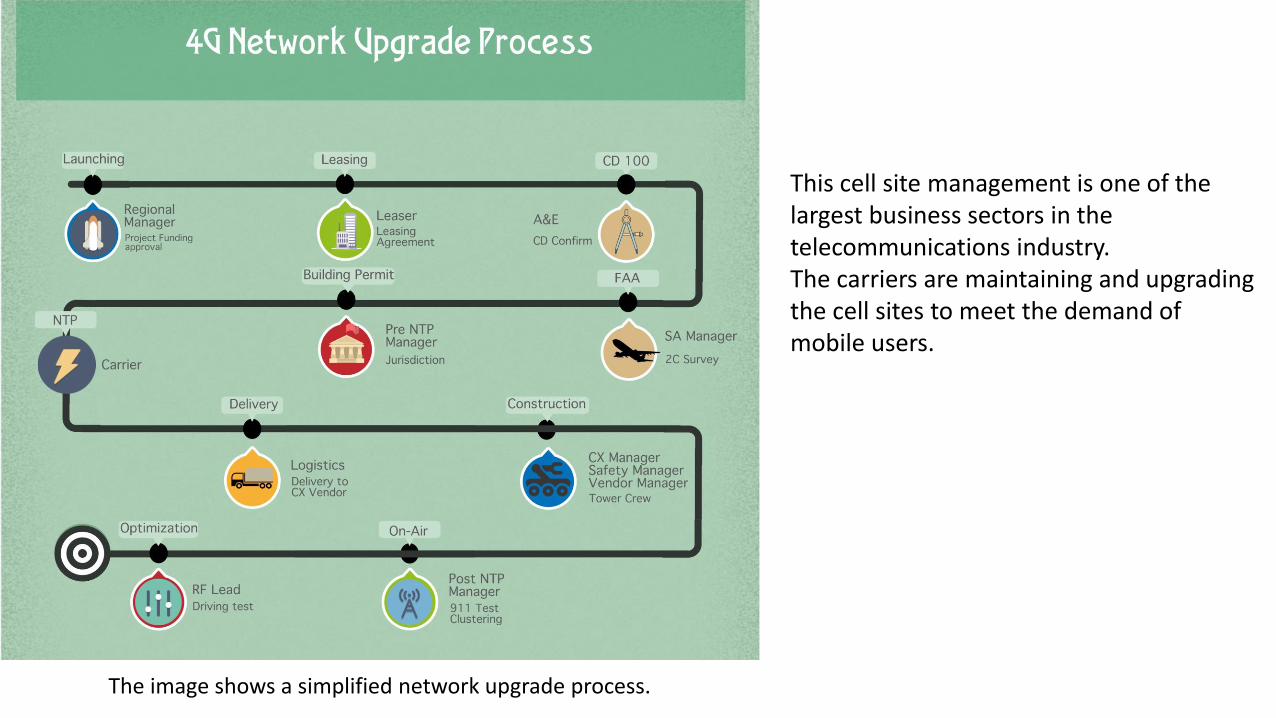
The image shows a simplified network upgrade process.
This cell site management is one of the largest business sectors in the telecommunications industry. The carriers are maintaining and upgrading the cell sites to meet the demand of mobile users.
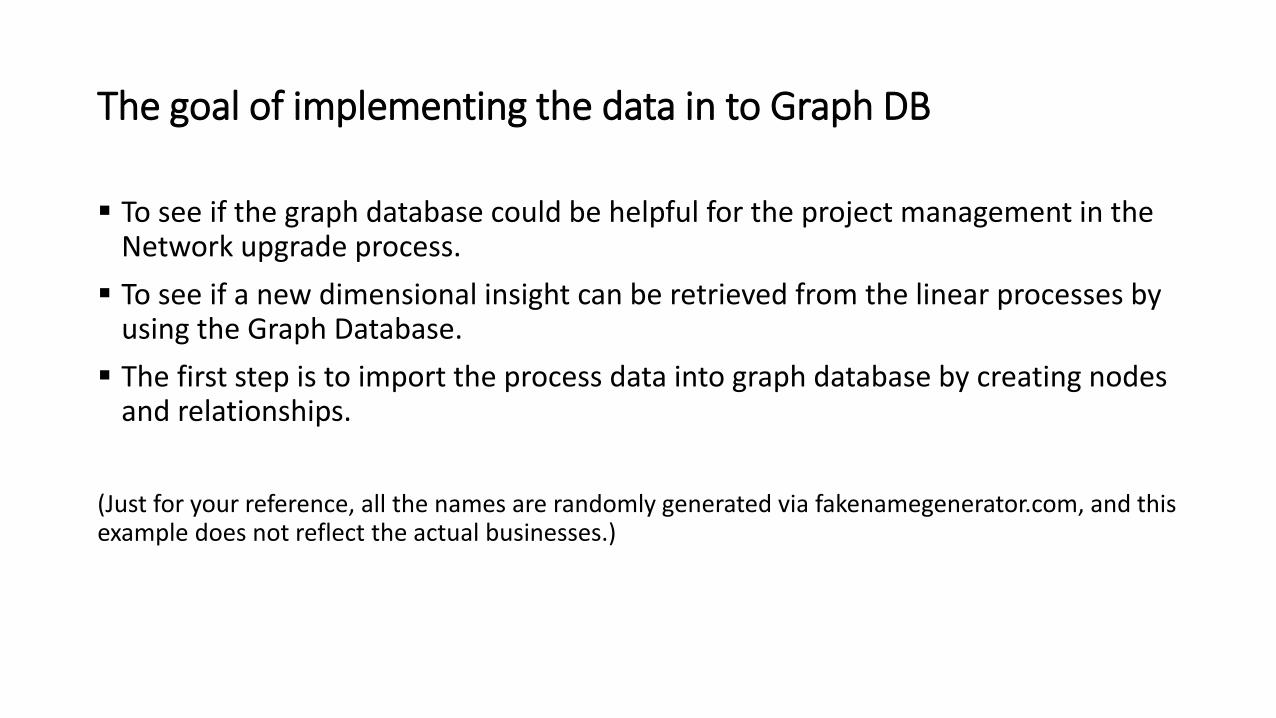
To see if the graph database could be helpful for the project management in the Network upgrade process.
To see if a new dimensional insight can be retrieved from the linear processes by using the Graph Database.
The first step is to import the process data into graph database by creating nodes and relationships.
(Just for your reference, all the names are randomly generated via fakenamegenerator.com, and this example does not reflect the actual businesses.)
The goal of implementing the data in to Graph DB
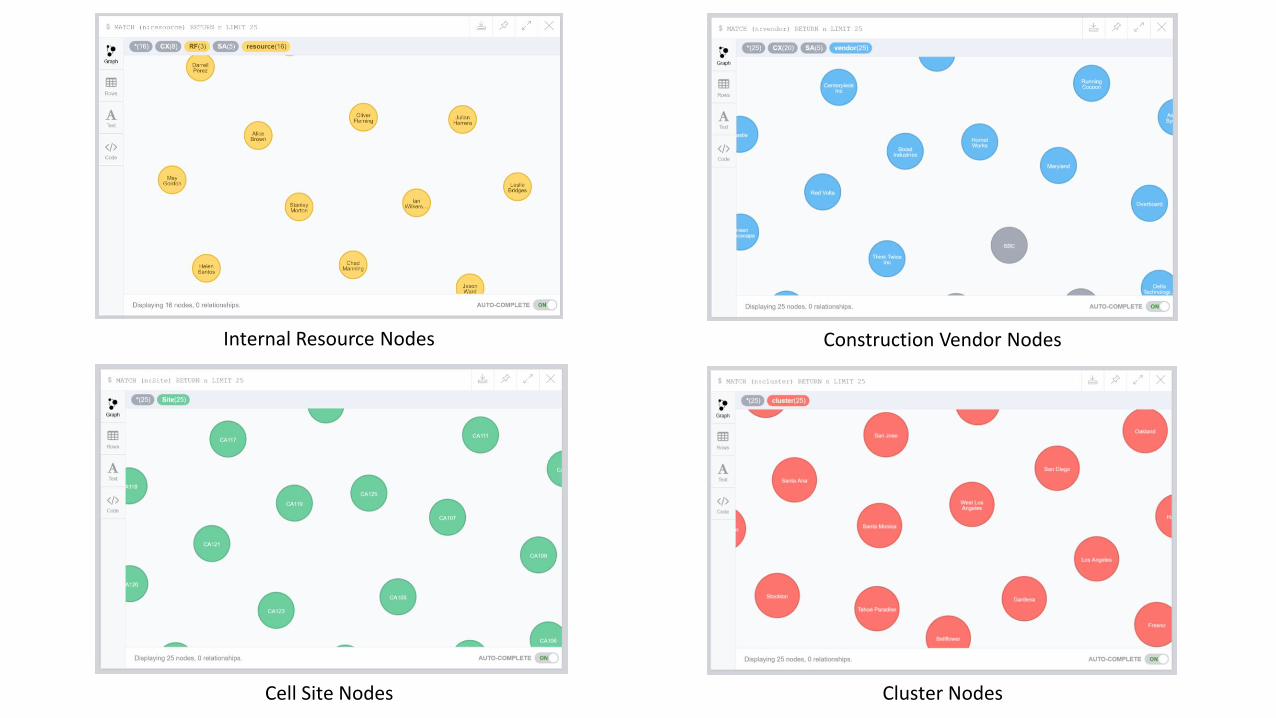
Internal Resource Nodes
Cell Site Nodes Cluster Nodes
Construction Vendor Nodes
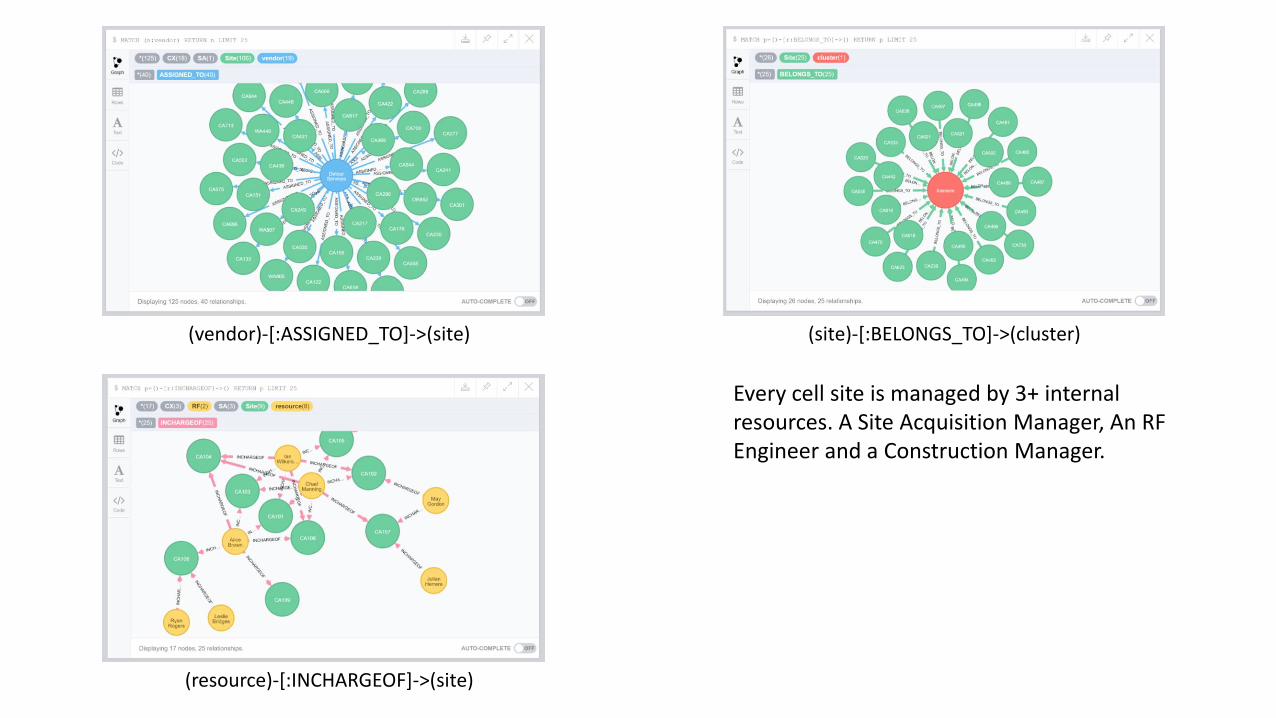
(vendor)-[:ASSIGNED_TO]->(site)
(resource)-[:INCHARGEOF]->(site)
(site)-[:BELONGS_TO]->(cluster)
Every cell site is managed by 3+ internal resources. A Site Acquisition Manager, An RF Engineer and a Construction Manager.

The traditional DBMS’s have limits in identifying dynamics between the entities when they handle the multiple relationships across the entities. Imagine how many tables and joins will be required to return a single result.

A Situation
One construction manager reported that a vendor named ‘Castle’ is underperforming.
Due to the delay of the site id ‘CA164’, the entire schedule of the ‘Fresno’ Cluster launching might be affected.

An Intuitive approach to the problem.
Look up the other sites which belong to this cluster and see if the other vendorswho are assigned to those sites have enough crew to handle this matter.
‘CA612’ and ‘CA149’ are assigned to ‘Maryland’ who has indicated good performance.
Both sites are under the management of the same internal resource group. A less hectic period when it is reassigned to another vendor.
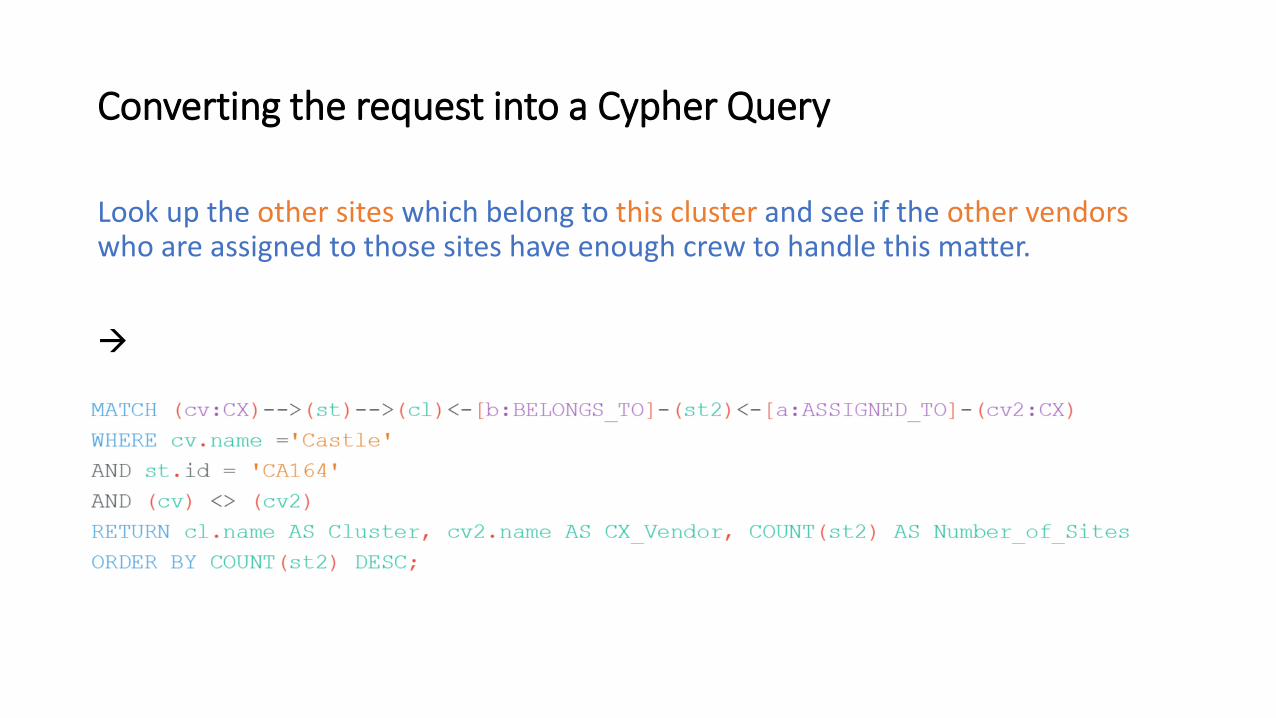
Look up the other sites which belong to this cluster and see if the other vendorswho are assigned to those sites have enough crew to handle this matter.
Converting the request into a Cypher Query
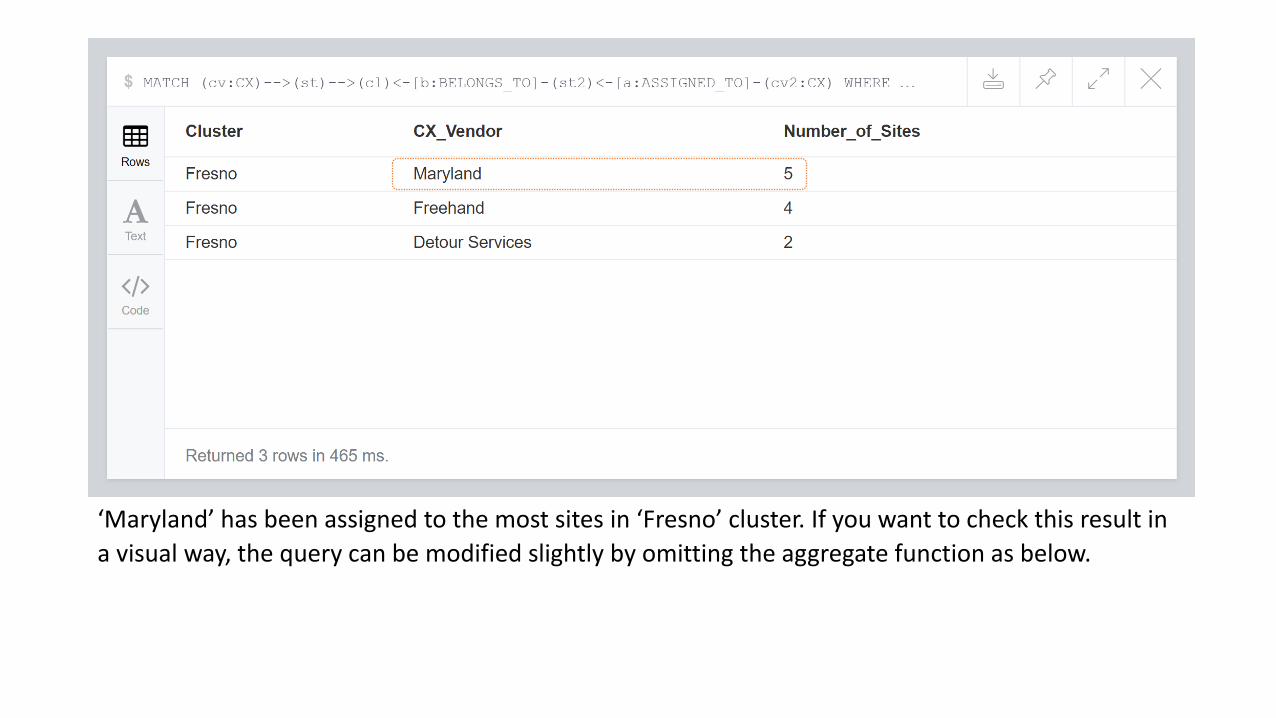
‘Maryland’ has been assigned to the most sites in ‘Fresno’ cluster. If you want to check this result in
a visual way, the query can be modified slightly by omitting the aggregate function as below.
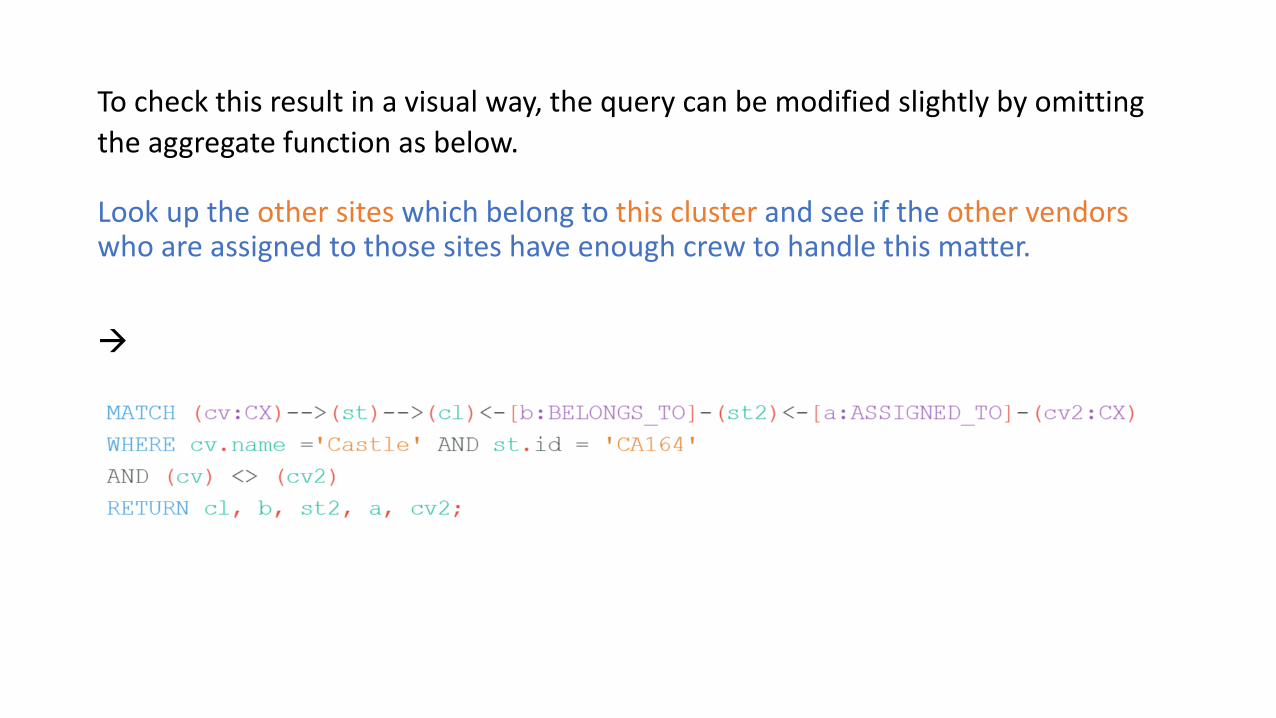
To check this result in a visual way, the query can be modified slightly by omitting
the aggregate function as below.
Look up the other sites which belong to this cluster and see if the other vendorswho are assigned to those sites have enough crew to handle this matter.
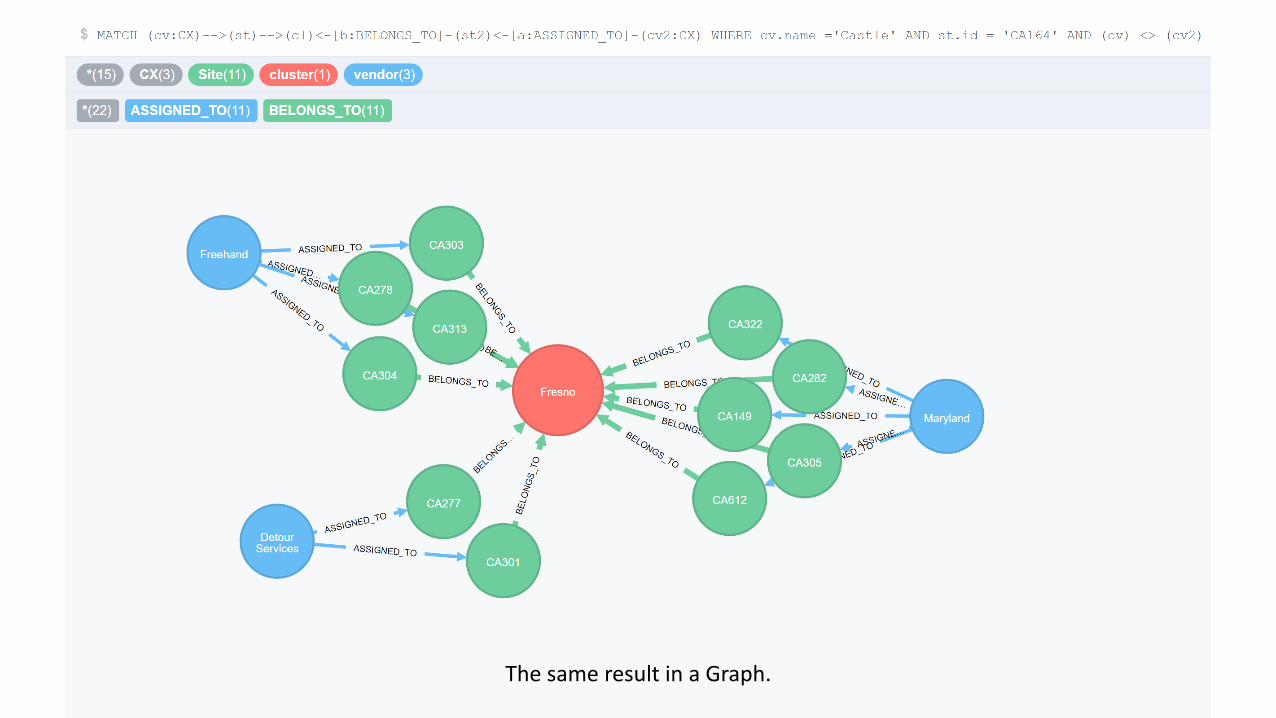
The same result in a Graph.
StateLicense {expiration:‘mm/dd/yyyy’}
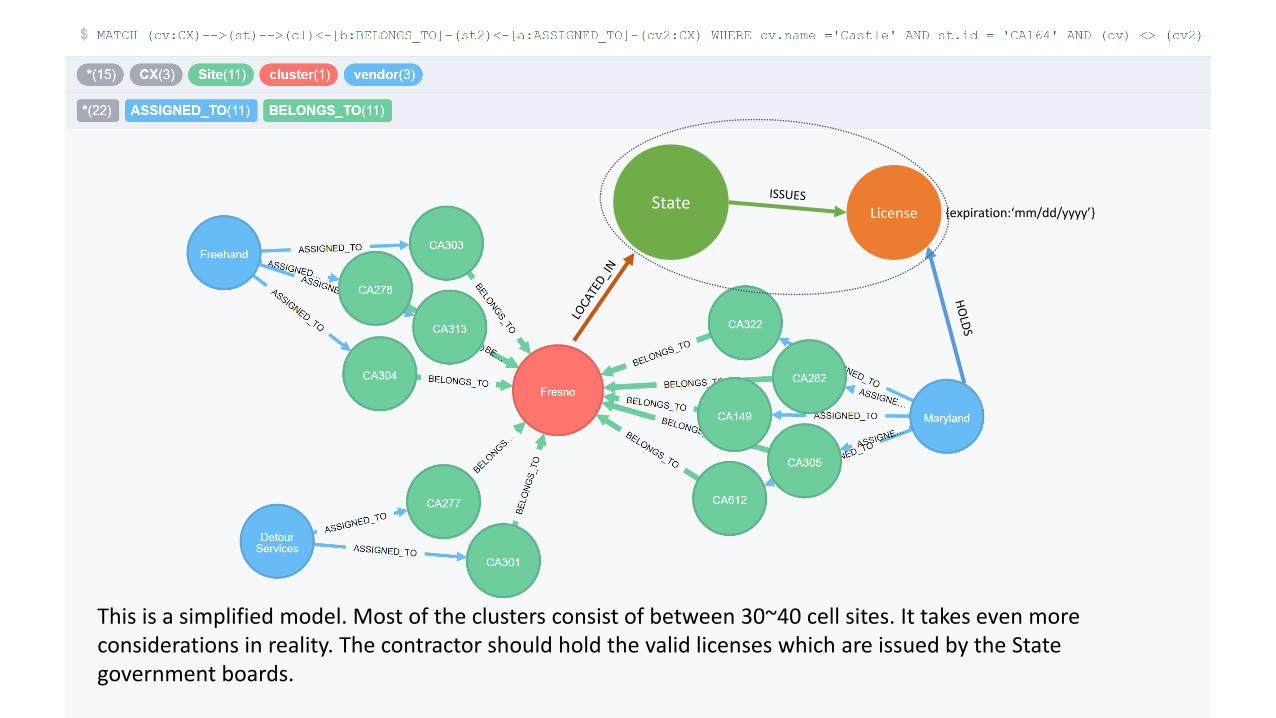
This is a simplified model. Most of the clusters consist of between 30~40 cell sites. It takes even more considerations in reality. The contractor should hold the valid licenses which are issued by the State government boards.
Conclusion
Project management is all about time and resource management.
Graph Database could be utilized in process control and decision makings.
The result of Graph DB query can be shared with the stakeholders more intuitively where every time-sensitive decision counts.
Less chance of biased opinions thanks to the clear visibility.
The traditional DBMS’s are not designed to handle these types of matters.
(graphians)-[:SELECT]->(topics)

Discussion
The Graph DB awareness and Market trend
Graph DB use cases in the businesses
Suggestions on the Meetup
Thank you!See you at the next Meetup.


![MIT OpenCourseWare 6.189 Multicore …...Running Processes Under GDB ppu-gdb ./hello-world (gdb) run [args] … (gdb) quit export SPU_INFO=1 for extra information about threads Phil](https://static.fdocuments.us/doc/165x107/5f19ba63a6b0b957e67c7a59/mit-opencourseware-6189-multicore-running-processes-under-gdb-ppu-gdb-hello-world.jpg)