Gdb Tutorial Presentation
35
GDB Tutorial A Walkthrough with Examples CMSC 212 - Spring 2009 Last modified March 22, 2009 GDB Tutorial
-
Upload
aristeu-junior -
Category
Documents
-
view
44 -
download
1
Transcript of Gdb Tutorial Presentation

GDB TutorialA Walkthrough with Examples
CMSC 212 - Spring 2009
Last modified March 22, 2009
GDB Tutorial
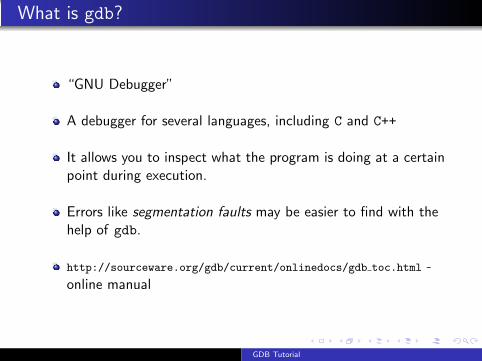
What is gdb?
“GNU Debugger”
A debugger for several languages, including C and C++
It allows you to inspect what the program is doing at a certainpoint during execution.
Errors like segmentation faults may be easier to find with thehelp of gdb.
http://sourceware.org/gdb/current/onlinedocs/gdb toc.html -online manual
GDB Tutorial

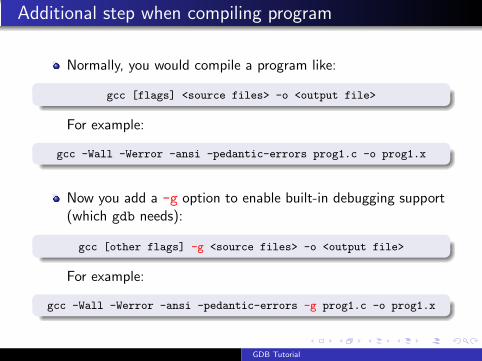
Additional step when compiling program
Normally, you would compile a program like:
gcc [flags] <source files> -o <output file>
For example:
gcc -Wall -Werror -ansi -pedantic-errors prog1.c -o prog1.x
Now you add a -g option to enable built-in debugging support(which gdb needs):
gcc [other flags] -g <source files> -o <output file>
For example:
gcc -Wall -Werror -ansi -pedantic-errors -g prog1.c -o prog1.x
GDB Tutorial
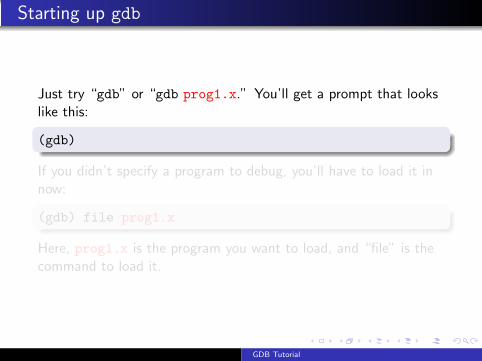
Starting up gdb
Just try “gdb” or “gdb prog1.x.” You’ll get a prompt that lookslike this:
(gdb)
If you didn’t specify a program to debug, you’ll have to load it innow:
(gdb) file prog1.x
Here, prog1.x is the program you want to load, and “file” is thecommand to load it.
GDB Tutorial
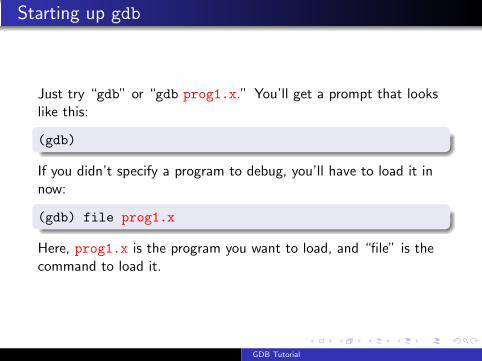
Starting up gdb
Just try “gdb” or “gdb prog1.x.” You’ll get a prompt that lookslike this:
(gdb)
If you didn’t specify a program to debug, you’ll have to load it innow:
(gdb) file prog1.x
Here, prog1.x is the program you want to load, and “file” is thecommand to load it.
GDB Tutorial
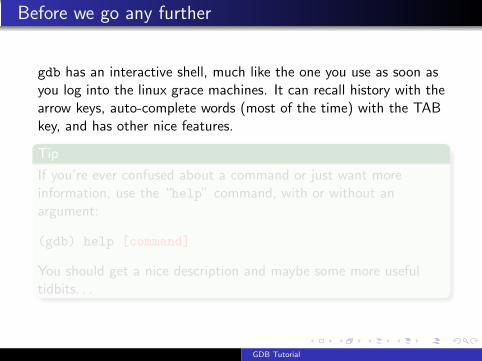
Before we go any further
gdb has an interactive shell, much like the one you use as soon asyou log into the linux grace machines. It can recall history with thearrow keys, auto-complete words (most of the time) with the TABkey, and has other nice features.
Tip
If you’re ever confused about a command or just want moreinformation, use the “help” command, with or without anargument:
(gdb) help [command]
You should get a nice description and maybe some more usefultidbits. . .
GDB Tutorial
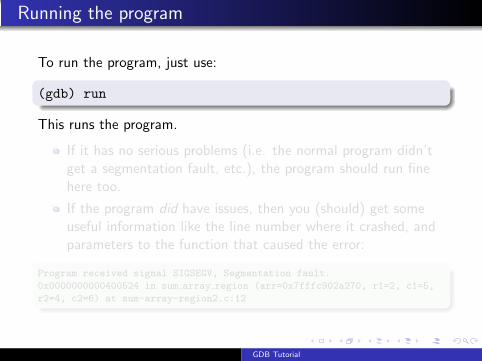
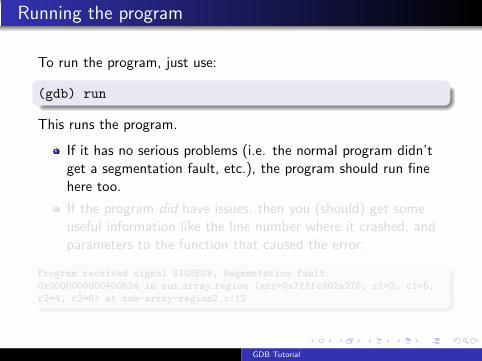
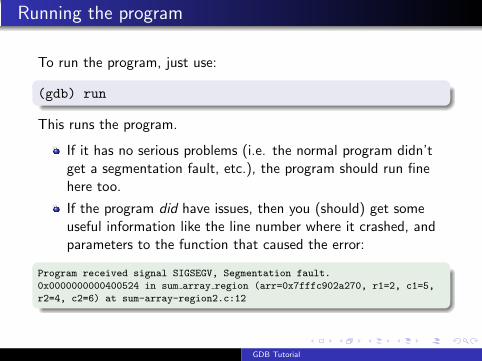
Running the program
To run the program, just use:
(gdb) run
This runs the program.
If it has no serious problems (i.e. the normal program didn’tget a segmentation fault, etc.), the program should run finehere too.
If the program did have issues, then you (should) get someuseful information like the line number where it crashed, andparameters to the function that caused the error:
Program received signal SIGSEGV, Segmentation fault.
0x0000000000400524 in sum array region (arr=0x7fffc902a270, r1=2, c1=5,
r2=4, c2=6) at sum-array-region2.c:12
GDB Tutorial

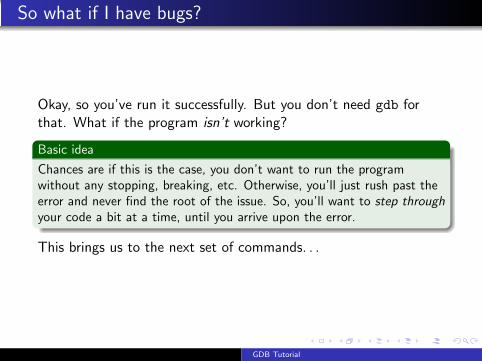
So what if I have bugs?
Okay, so you’ve run it successfully. But you don’t need gdb forthat. What if the program isn’t working?
Basic idea
Chances are if this is the case, you don’t want to run the programwithout any stopping, breaking, etc. Otherwise, you’ll just rush past theerror and never find the root of the issue. So, you’ll want to step throughyour code a bit at a time, until you arrive upon the error.
This brings us to the next set of commands. . .
GDB Tutorial

Setting breakpoints
Breakpoints can be used to stop the program run in the middle, ata designated point. The simplest way is the command “break.”This sets a breakpoint at a specified file-line pair:
(gdb) break file1.c:6
This sets a breakpoint at line 6, of file1.c. Now, if the programever reaches that location when running, the program will pauseand prompt you for another command.
Tip
You can set as many breakpoints as you want, and the programshould stop execution if it reaches any of them.
GDB Tutorial
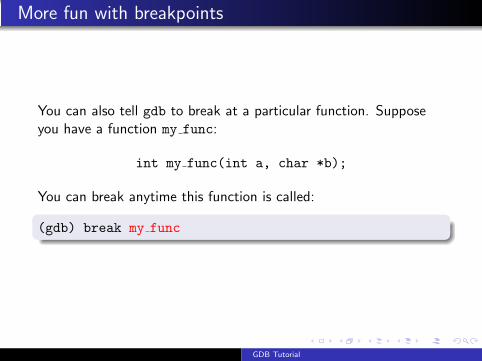
More fun with breakpoints
You can also tell gdb to break at a particular function. Supposeyou have a function my func:
int my func(int a, char *b);
You can break anytime this function is called:
(gdb) break my func
GDB Tutorial
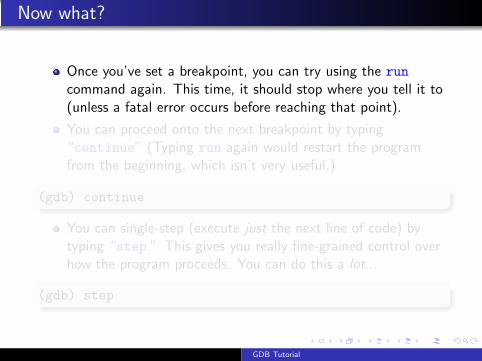
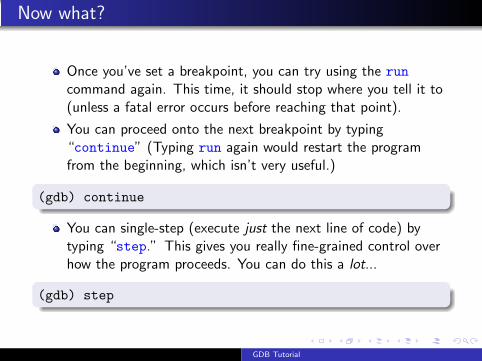
Now what?
Once you’ve set a breakpoint, you can try using the runcommand again. This time, it should stop where you tell it to(unless a fatal error occurs before reaching that point).
You can proceed onto the next breakpoint by typing“continue” (Typing run again would restart the programfrom the beginning, which isn’t very useful.)
(gdb) continue
You can single-step (execute just the next line of code) bytyping “step.” This gives you really fine-grained control overhow the program proceeds. You can do this a lot...
(gdb) step
GDB Tutorial
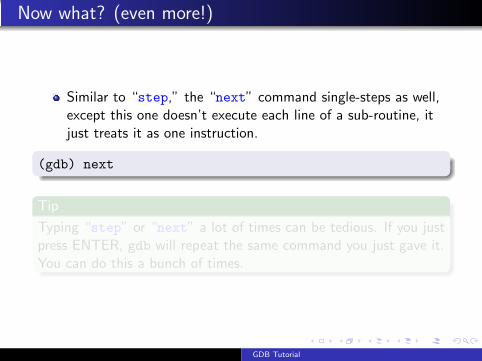
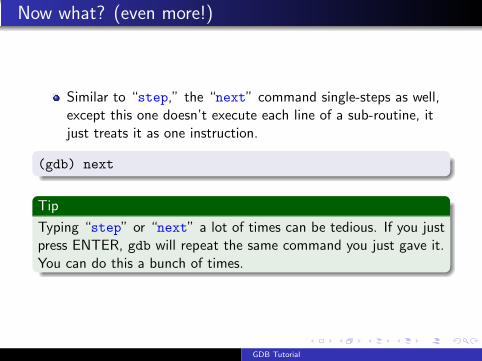
Now what? (even more!)
Similar to “step,” the “next” command single-steps as well,except this one doesn’t execute each line of a sub-routine, itjust treats it as one instruction.
(gdb) next
Tip
Typing “step” or “next” a lot of times can be tedious. If you justpress ENTER, gdb will repeat the same command you just gave it.You can do this a bunch of times.
GDB Tutorial
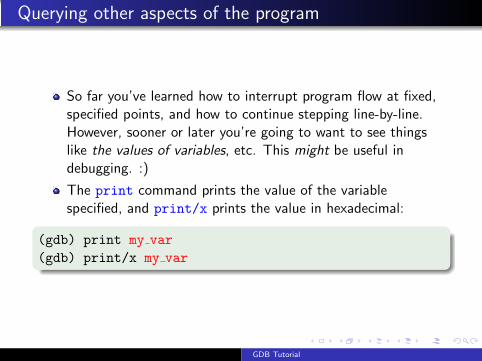
Querying other aspects of the program
So far you’ve learned how to interrupt program flow at fixed,specified points, and how to continue stepping line-by-line.However, sooner or later you’re going to want to see thingslike the values of variables, etc. This might be useful indebugging. :)
The print command prints the value of the variablespecified, and print/x prints the value in hexadecimal:
(gdb) print my var(gdb) print/x my var
GDB Tutorial

Setting watchpoints
Whereas breakpoints interrupt the program at a particular line orfunction, watchpoints act on variables. They pause the programwhenever a watched variable’s value is modified. For example, thefollowing watch command:
(gdb) watch my var
Now, whenever my var’s value is modified, the program willinterrupt and print out the old and new values.
Tip
You may wonder how gdb determines which variable named my var to watch if thereis more than one declared in your program. The answer (perhaps unfortunately) isthat it relies upon the variable’s scope, relative to where you are in the program at thetime of the watch. This just means that you have to remember the tricky nuances ofscope and extent :(.
GDB Tutorial
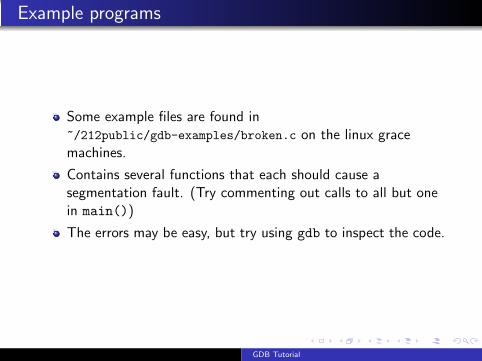
Example programs
Some example files are found in~/212public/gdb-examples/broken.c on the linux gracemachines.
Contains several functions that each should cause asegmentation fault. (Try commenting out calls to all but onein main())
The errors may be easy, but try using gdb to inspect the code.
GDB Tutorial
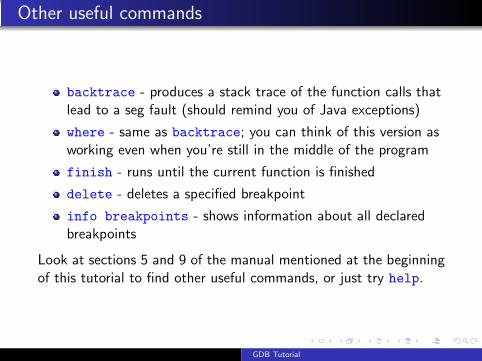
Other useful commands
backtrace - produces a stack trace of the function calls thatlead to a seg fault (should remind you of Java exceptions)
where - same as backtrace; you can think of this version asworking even when you’re still in the middle of the program
finish - runs until the current function is finished
delete - deletes a specified breakpoint
info breakpoints - shows information about all declaredbreakpoints
Look at sections 5 and 9 of the manual mentioned at the beginningof this tutorial to find other useful commands, or just try help.
GDB Tutorial
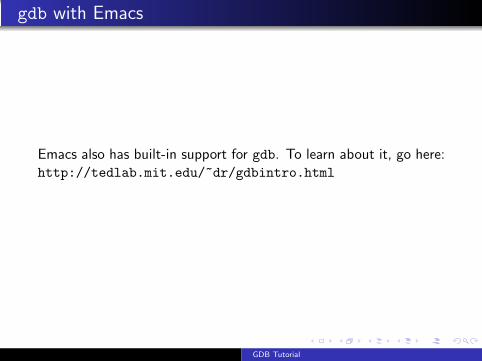
gdb with Emacs
Emacs also has built-in support for gdb. To learn about it, go here:http://tedlab.mit.edu/~dr/gdbintro.html
GDB Tutorial

More about breakpoints
Breakpoints by themselves may seem too tedious. You have tokeep stepping, and stepping, and stepping. . .
Basic idea
Once we develop an idea for what the error could be (like dereferencing aNULL pointer, or going past the bounds of an array), we probably onlycare if such an event happens; we don’t want to break at each iterationregardless.
So ideally, we’d like to condition on a particular requirement (or setof requirements). Using conditional breakpoints allow us toaccomplish this goal. . .
GDB Tutorial
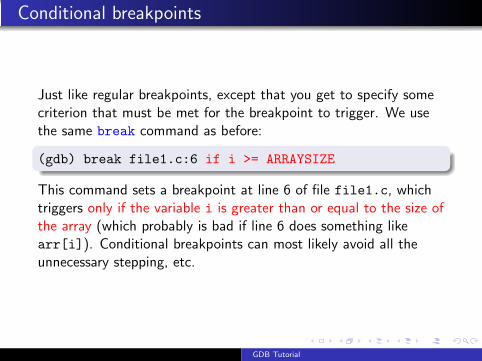
Conditional breakpoints
Just like regular breakpoints, except that you get to specify somecriterion that must be met for the breakpoint to trigger. We usethe same break command as before:
(gdb) break file1.c:6 if i >= ARRAYSIZE
This command sets a breakpoint at line 6 of file file1.c, whichtriggers only if the variable i is greater than or equal to the size ofthe array (which probably is bad if line 6 does something likearr[i]). Conditional breakpoints can most likely avoid all theunnecessary stepping, etc.
GDB Tutorial

Fun with pointers
Who doesn’t have fun with pointers? First, let’s assume we havethe following structure defined:
struct entry {int key;char *name;float price;long serial_number;
};
Maybe this struct is used in some sort of hash table as part of acatalog for products, or something related.
GDB Tutorial
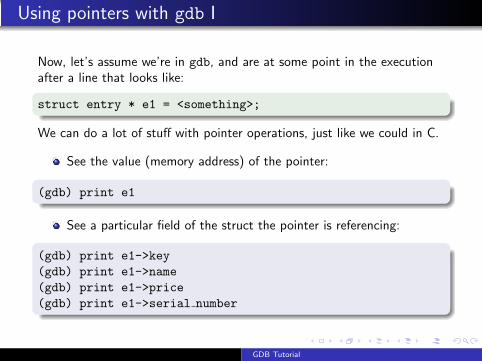
Using pointers with gdb I
Now, let’s assume we’re in gdb, and are at some point in the executionafter a line that looks like:
struct entry * e1 = <something>;
We can do a lot of stuff with pointer operations, just like we could in C.
See the value (memory address) of the pointer:
(gdb) print e1
See a particular field of the struct the pointer is referencing:
(gdb) print e1->key(gdb) print e1->name(gdb) print e1->price(gdb) print e1->serial number
GDB Tutorial

Using pointers with gdb II
You can also use the dereference (*) and dot (.) operators in placeof the arrow operator (->):
(gdb) print (*e1).key(gdb) print (*e1).name(gdb) print (*e1).price(gdb) print (*e1).serial number
See the entire contents of the struct the pointer references (youcan’t do this as easily in C!):
(gdb) print *e1
You can also follow pointers iteratively, like in a linked list:
(gdb) print list prt->next->next->next->data
GDB Tutorial
![MIT OpenCourseWare 6.189 Multicore …...Running Processes Under GDB ppu-gdb ./hello-world (gdb) run [args] … (gdb) quit export SPU_INFO=1 for extra information about threads Phil](https://static.fdocuments.us/doc/165x107/5f19ba63a6b0b957e67c7a59/mit-opencourseware-6189-multicore-running-processes-under-gdb-ppu-gdb-hello-world.jpg)


![GDB telux ver090906 - cs.tau.ac.il · (gdb) watch expr –stops whenever the value of the expression changes (gdb ) i b (gdb) clear [arg ] (gdb) delete [bnum ] Without arguments deletes](https://static.fdocuments.us/doc/165x107/5ae0abbc7f8b9ab4688daeeb/gdb-telux-ver090906-cstauacil-gdb-watch-expr-stops-whenever-the-value-of.jpg)