GBAR Monthly DomusLink PDF - Greater Boston Real Estate Board › GBREBDocs › GBAR › News ›...
17
© 2019 North Leaf Solutions LLC as Domus Analytics, under license for Greater Boston Association of REALTORS® 1 DECEMBER 2019 Detached Single-Family Homes The 1,180 homes sold in December was a 21 percent increase in sales volume from the December 2018 sales total of 975 homes sold. This is the third highest sales total on record for the month of December. Additionally, the median sales price reached a new record high for the month at $605,000, which is a 3.4 percent increase from the December 2018 median sales price of $585,000. Condominiums With 887 condos sold, it was a 18 percent increase in sales from the 752 units sold in December 2018, and making for the fourth highest sales volume on record for the month of December. The median sales price for condos rose 7.9 percent from $542,250 in December 2018 to $585,000. Multi-Family Homes This month, 178 multi-family homes were sold in Greater Boston, which was a 4 percent increase on the 171 units sold in December 2018. CONTENTS Greater Boston 2 Units Sold 3 Median Selling Price 4 Active Listings 5 New Listings 6 Pending Sales 7 Central Middlesex 8 Eastern Middlesex 9 Metro Boston 10 Metro West 11 Southern Norfolk 12 City of Boston 13 Multi-Family 14 Regional Map 16 Glossary 17 Data thru 1/12/2020 MONTHLY MARKET INSIGHT REPORT Greater Boston Association of REALTORS® A division of the Greater Boston Real Estate Board Three Center Plaza, Mezzanine Suite 68 Main Street Boston, MA 02108 Reading, MA 01867 Phone: 617-423-8700 Email: [email protected] Online: www.gbar.org
Transcript of GBAR Monthly DomusLink PDF - Greater Boston Real Estate Board › GBREBDocs › GBAR › News ›...
© 2019 North Leaf Solutions LLC as Domus Analytics, under license for Greater Boston Association of REALTORS® 1
DECEMBER 2019
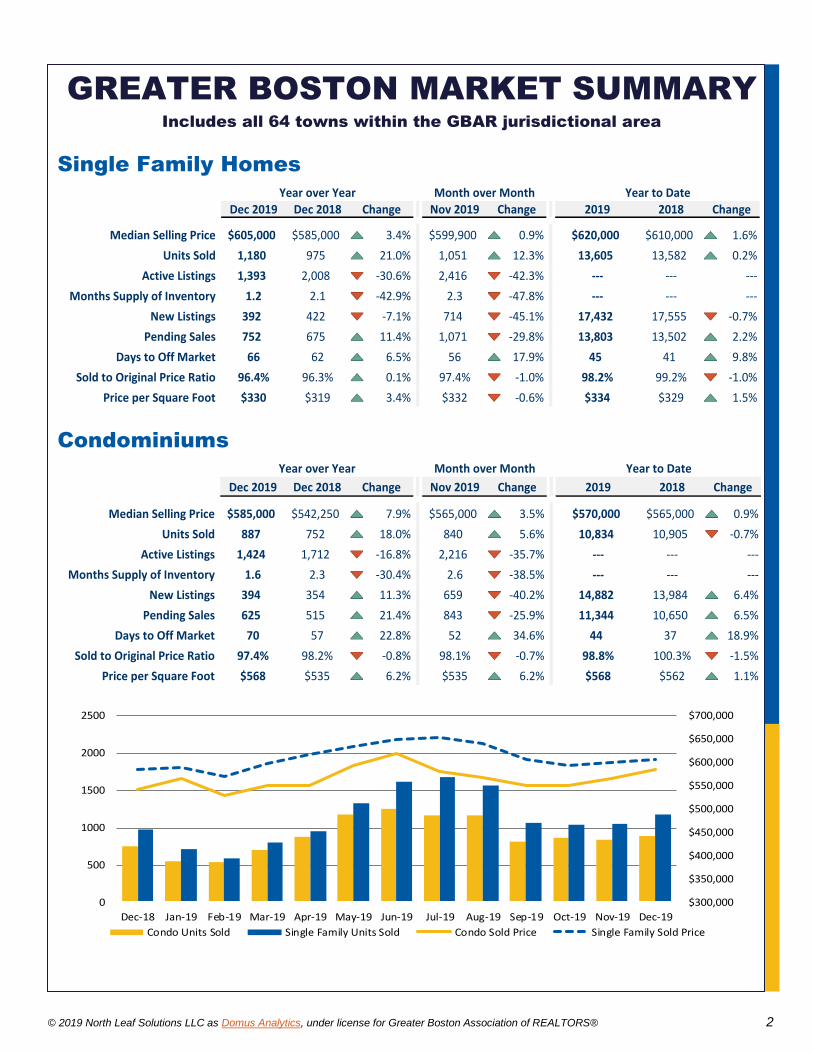
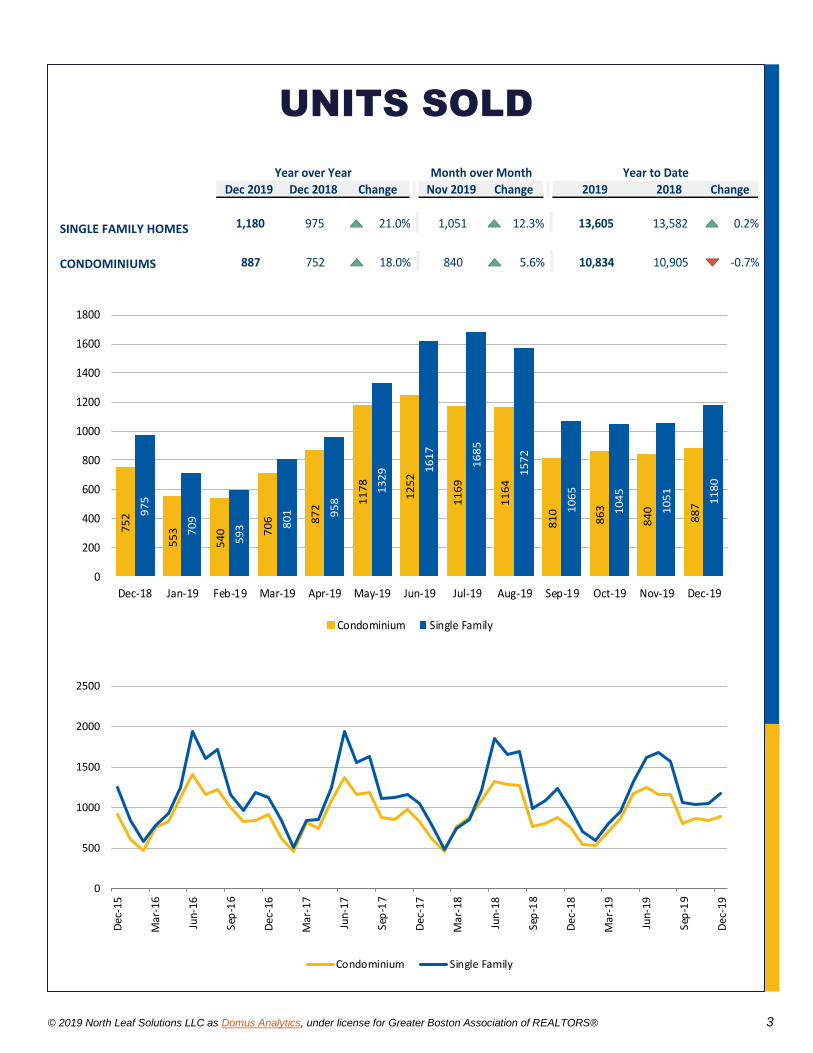
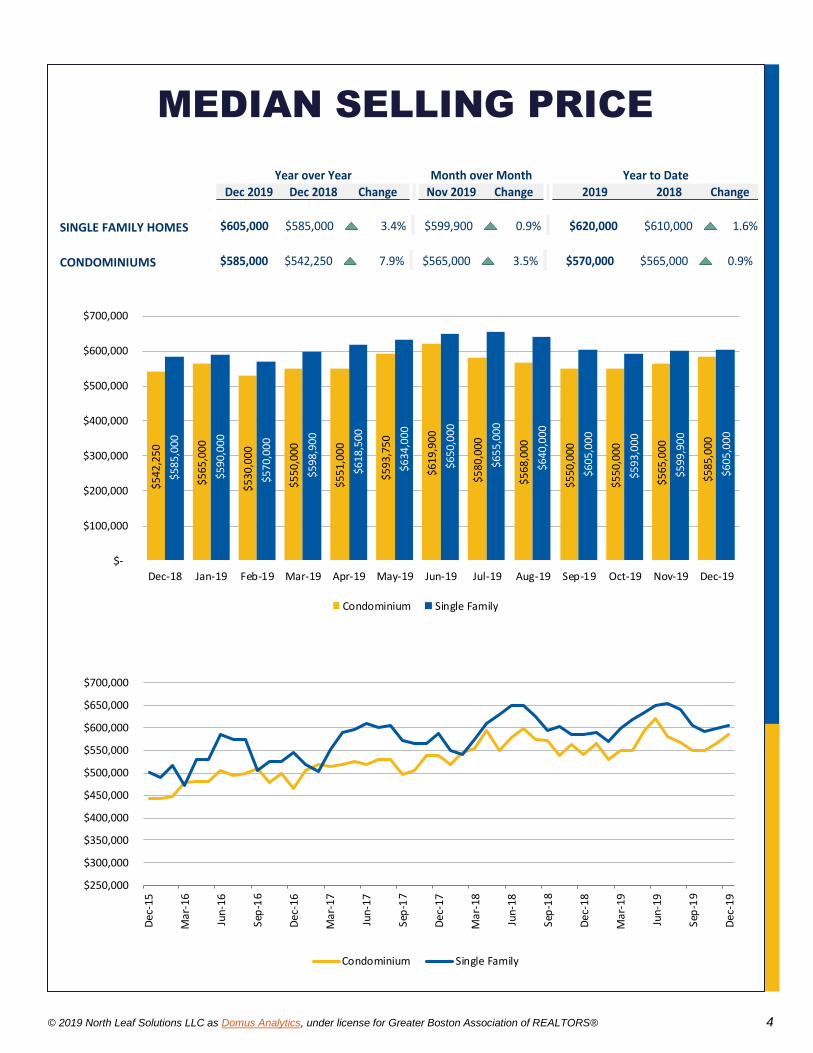
Detached Single-Family Homes The 1,180 homes sold in December was a 21 percent increase in sales volume from the December 2018 sales total of 975 homes sold. This is the third highest sales total on record for the month of December. Additionally, the median sales price reached a new record high for the month at $605,000, which is a 3.4 percent increase from the December 2018 median sales price of $585,000.
Condominiums With 887 condos sold, it was a 18 percent increase in sales from the 752 units sold in December 2018, and making for the fourth highest sales volume on record for the month of December. The median sales price for condos rose 7.9 percent from $542,250 in December 2018 to $585,000.
Multi-Family Homes This month, 178 multi-family homes were sold in Greater Boston, which was a 4 percent increase on the 171 units sold in December 2018.
CONTENTS
Greater Boston 2
Units Sold 3
Median Selling Price 4
Active Listings 5
New Listings 6
Pending Sales 7
Central Middlesex 8
Eastern Middlesex 9
Metro Boston 10
Metro West 11
Southern Norfolk 12
City of Boston 13
Multi-Family 14
Regional Map 16
Glossary 17
Data thru 1/12/2020
MONTHLY MARKET
INSIGHT REPORT
Greater Boston Association of REALTORS®
A division of the Greater Boston Real Estate Board
Three Center Plaza, Mezzanine Suite 68 Main Street
Boston, MA 02108 Reading, MA 01867
Phone: 617-423-8700
Email: [email protected] Online: www.gbar.org
© 2019 North Leaf Solutions LLC as Domus Analytics, under license for Greater Boston Association of REALTORS® 2
GREATER BOSTON MARKET SUMMARY Includes all 64 towns within the GBAR jurisdictional area
Single Family Homes
Dec 2019 Dec 2018 Change Nov 2019 Change 2019 2018 Change
Median Selling Price $605,000 $585,000 3.4% $599,900 0.9% $620,000 $610,000 1.6%
Units Sold 1,180 975 21.0% 1,051 12.3% 13,605 13,582 0.2%
Active Listings 1,393 2,008 -30.6% 2,416 -42.3%
Months Supply of Inventory 1.2 2.1 -42.9% 2.3 -47.8%
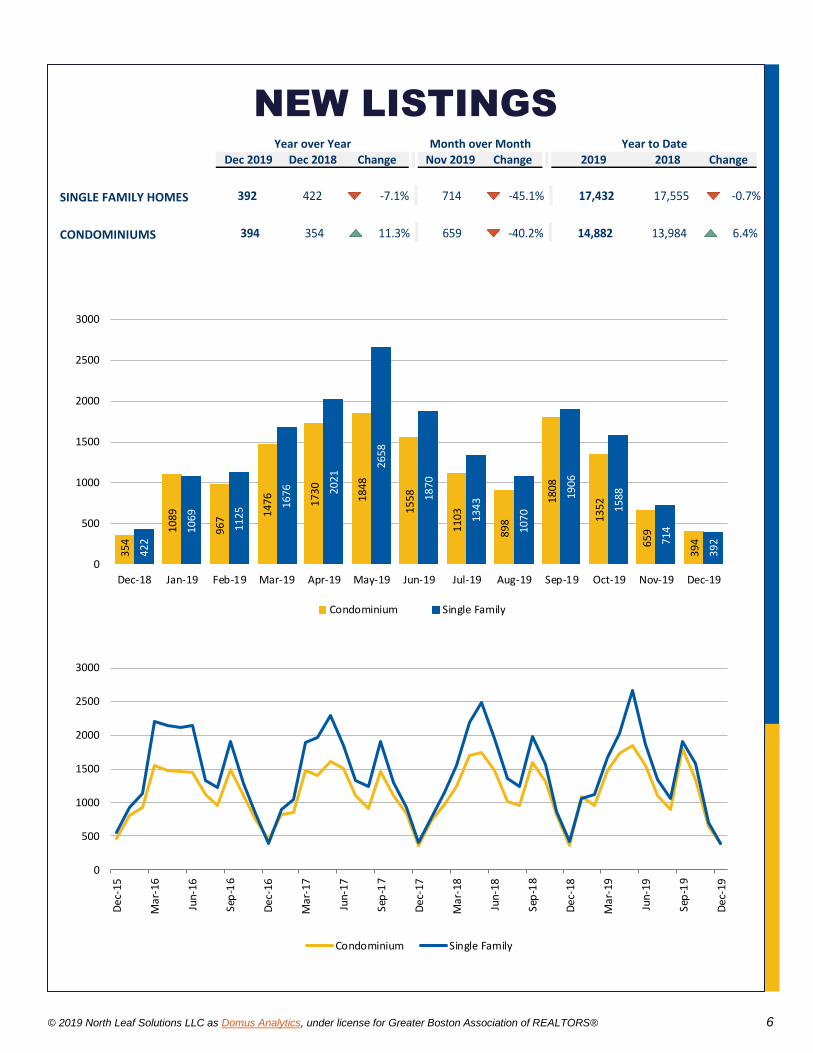
New Listings 392 422 -7.1% 714 -45.1% 17,432 17,555 -0.7%
Pending Sales 752 675 11.4% 1,071 -29.8% 13,803 13,502 2.2%
Days to Off Market 66 62 6.5% 56 17.9% 45 41 9.8%
Sold to Original Price Ratio 96.4% 96.3% 0.1% 97.4% -1.0% 98.2% 99.2% -1.0%
Price per Square Foot $330 $319 3.4% $332 -0.6% $334 $329 1.5%
Year over Year Month over Month Year to Date
Condominiums
Dec 2019 Dec 2018 Change Nov 2019 Change 2019 2018 Change
Median Selling Price $585,000 $542,250 7.9% $565,000 3.5% $570,000 $565,000 0.9%
Units Sold 887 752 18.0% 840 5.6% 10,834 10,905 -0.7%
Active Listings 1,424 1,712 -16.8% 2,216 -35.7%
Months Supply of Inventory 1.6 2.3 -30.4% 2.6 -38.5%
New Listings 394 354 11.3% 659 -40.2% 14,882 13,984 6.4%
Pending Sales 625 515 21.4% 843 -25.9% 11,344 10,650 6.5%
Days to Off Market 70 57 22.8% 52 34.6% 44 37 18.9%
Sold to Original Price Ratio 97.4% 98.2% -0.8% 98.1% -0.7% 98.8% 100.3% -1.5%
Price per Square Foot $568 $535 6.2% $535 6.2% $568 $562 1.1%
Year over Year Month over Month Year to Date
$300,000
$350,000
$400,000
$450,000
$500,000
$550,000
$600,000
$650,000
$700,000
0
500
1000
1500
2000
2500
Dec-18 Jan-19 Feb-19 Mar-19 Apr-19 May-19 Jun-19 Jul-19 Aug-19 Sep-19 Oct-19 Nov-19 Dec-19
Condo Units Sold Single Family Units Sold Condo Sold Price Single Family Sold Price
© 2019 North Leaf Solutions LLC as Domus Analytics, under license for Greater Boston Association of REALTORS® 3
Dec 2019 Dec 2018 Change Nov 2019 Change 2019 2018 Change
Year over Year Month over Month Year to Date
SINGLE FAMILY HOMES 1,180 975 21.0% 1,051 12.3% 13,605 13,582 0.2%
CONDOMINIUMS 887 752 18.0% 840 5.6% 10,834 10,905 -0.7%
75
2
55
3
54
0 70
6 87
2
11
78
12
52
11
69
11
64
81
0
86
3
84
0
88
7
97
5
70
9
59
3 80
1 95
8
13
29 1
61
7
16
85
15
72
10
65
10
45
10
51
11
80
0
200
400
600
800
1000
1200
1400
1600
1800
Dec-18 Jan-19 Feb-19 Mar-19 Apr-19 May-19 Jun-19 Jul-19 Aug-19 Sep-19 Oct-19 Nov-19 Dec-19
Condominium Single Family
0
500
1000
1500
2000
2500
Dec
-15
Mar
-16
Jun-
16
Sep
-16
Dec
-16
Mar
-17
Jun-
17
Sep
-17
Dec
-17
Mar
-18
Jun-
18
Sep
-18
Dec
-18
Mar
-19
Jun-
19
Sep
-19
Dec
-19
Condominium Single Family
UNITS SOLD
© 2019 North Leaf Solutions LLC as Domus Analytics, under license for Greater Boston Association of REALTORS® 4
Dec 2019 Dec 2018 Change Nov 2019 Change 2019 2018 Change
Year over Year Month over Month Year to Date
SINGLE FAMILY HOMES $605,000 $585,000 3.4% $599,900 0.9% $620,000 $610,000 1.6%
CONDOMINIUMS $585,000 $542,250 7.9% $565,000 3.5% $570,000 $565,000 0.9%
$542
,250
$5
65
,00
0
$5
30
,00
0
$550
,000
$551
,000
$593
,750
$6
19
,90
0
$580
,000
$568
,000
$550
,000
$550
,000
$565
,000
$585
,000
$585
,000
$590
,000
$570
,000
$598
,900
$618
,500
$6
34
,00
0
$650
,000
$655
,000
$640
,000
$605
,000
$5
93
,000
$599
,900
$605
,000
$-
$100,000
$200,000
$300,000
$400,000
$500,000
$600,000
$700,000
Dec-18 Jan-19 Feb-19 Mar-19 Apr-19 May-19 Jun-19 Jul-19 Aug-19 Sep-19 Oct-19 Nov-19 Dec-19
Condominium Single Family
$250,000
$300,000
$350,000
$400,000
$450,000
$500,000
$550,000
$600,000
$650,000
$700,000
Dec
-15
Mar
-16
Jun-
16
Sep
-16
Dec
-16
Mar
-17
Jun-
17
Sep
-17
Dec
-17
Mar
-18
Jun-
18
Sep
-18
Dec
-18
Mar
-19
Jun-
19
Sep
-19
Dec
-19
Condominium Single Family
MEDIAN SELLING PRICE

© 2019 North Leaf Solutions LLC as Domus Analytics, under license for Greater Boston Association of REALTORS® 5
Dec 2019 Dec 2018 Change Nov 2019 Change
Year over Year Month over Month
SINGLE FAMILY HOMES Active Listings 1,393 2,008 -30.6% 2,416 -42.3%
Months Supply of Inventory 1.2 2.1 -42.9% 2.3 -47.8%
CONDOMINIUMS Active Listings 1,424 1,712 -16.8% 2,216 -35.7%
Months Supply of Inventory 1.6 2.3 -30.4% 2.6 -38.5%
0
500
1000
1500
2000
2500
3000
3500
4000
4500
5000
Dec
-15
Mar
-16
Jun-
16
Sep
-16
Dec
-16
Mar
-17
Jun-
17
Sep
-17
Dec
-17
Mar
-18
Jun-
18
Sep
-18
Dec
-18
Mar
-19
Jun-
19
Sep
-19
Dec
-19
Active Listings
Condominium Single Family
0
1
2
3
4
5
6
Dec
-15
Mar
-16
Jun-
16
Sep
-16
Dec
-16
Mar
-17
Jun-
17
Sep
-17
Dec
-17
Mar
-18
Jun-
18
Sep
-18
Dec
-18
Mar
-19
Jun-
19
Sep
-19
Dec
-19
Months Supply of Inventory
Condominium Single Family
ACTIVE LISTINGS
© 2019 North Leaf Solutions LLC as Domus Analytics, under license for Greater Boston Association of REALTORS® 6
Dec 2019 Dec 2018 Change Nov 2019 Change 2019 2018 Change
Year over Year Month over Month Year to Date
SINGLE FAMILY HOMES 392 422 -7.1% 714 -45.1% 17,432 17,555 -0.7%
CONDOMINIUMS 394 354 11.3% 659 -40.2% 14,882 13,984 6.4%
354
1089
96
7 1476 17
30
1848
15
58
1103
89
8
18
08
1352
659
394
422
10
69
11
25 16
76 20
21
26
58
18
70
13
43
1070
1906
15
88
714
39
2
0
500
1000
1500
2000
2500
3000
Dec-18 Jan-19 Feb-19 Mar-19 Apr-19 May-19 Jun-19 Jul-19 Aug-19 Sep-19 Oct-19 Nov-19 Dec-19
Condominium Single Family
0
500
1000
1500
2000
2500
3000
Dec
-15
Mar
-16
Jun-
16
Sep
-16
Dec
-16
Mar
-17
Jun-
17
Sep
-17
Dec
-17
Mar
-18
Jun-
18
Sep
-18
Dec
-18
Mar
-19
Jun-
19
Sep
-19
Dec
-19
Condominium Single Family
NEW LISTINGS

© 2019 North Leaf Solutions LLC as Domus Analytics, under license for Greater Boston Association of REALTORS® 7
Dec 2019 Dec 2018 Change Nov 2019 Change 2019 2018 Change
Year over Year Month over Month Year to Date
SINGLE FAMILY HOMES 752 675 11.4% 1,071 -29.8% 13,803 13,502 2.2%
CONDOMINIUMS 625 515 21.4% 843 -25.9% 11,344 10,650 6.5%
51
5
576 75
8 10
26 12
79
12
95
11
87
99
8
863
865 10
29
843
625
675
642 79
7
11
54 14
78 16
62
15
93
12
67
1093
1026 1
26
8
10
71
75
2
0
200
400
600
800
1000
1200
1400
1600
1800
Dec-18 Jan-19 Feb-19 Mar-19 Apr-19 May-19 Jun-19 Jul-19 Aug-19 Sep-19 Oct-19 Nov-19 Dec-19
Condominium Single Family
0
200
400
600
800
1000
1200
1400
1600
1800
2000
Dec
-15
Mar
-16
Jun-
16
Sep
-16
Dec
-16
Mar
-17
Jun-
17
Sep
-17
Dec
-17
Mar
-18
Jun-
18
Sep
-18
Dec
-18
Mar
-19
Jun-
19
Sep
-19
Dec
-19
Condominium Single Family
PENDING SALES

© 2019 North Leaf Solutions LLC as Domus Analytics, under license for Greater Boston Association of REALTORS® 8
CENTRAL MIDDLESEX REGION Acton, Bedford, Boxboro, Concord, Hudson, Lexington, Lincoln, Maynard, Stow, Sudbury, Wayland, Weston
Single Family Homes
Dec 2019 Dec 2018 Change Nov 2019 Change 2019 2018 Change
Median Selling Price $799,500 $801,000 -0.2% $740,000 8.0% $780,000 $790,078 -1.3%
Units Sold 172 121 42.1% 127 35.4% 1,901 1,916 -0.8%
Active Listings 272 343 -20.7% 471 -42.3%
Months Supply of Inventory 1.6 2.8 -42.9% 3.7 -56.8%
New Listings 47 53 -11.3% 87 -46.0% 2,675 2,544 5.1%
Pending Sales 98 71 38.0% 166 -41.0% 1,949 1,905 2.3%
Days to Off Market 86 77 11.7% 78 10.3% 57 52 9.6%
Sold to Original Price Ratio 94.5% 95.4% -0.9% 95.7% -1.3% 97.1% 98.0% -0.9%
Price per Square Foot $315 $322 -2.2% $324 -2.8% $316 $323 -2.2%
Year over Year Month over Month Year to Date
Condominiums
Dec 2019 Dec 2018 Change Nov 2019 Change 2019 2018 Change
Median Selling Price $480,000 $466,500 2.9% $484,500 -0.9% $418,758 $404,000 3.7%
Units Sold 39 41 -4.9% 38 2.6% 582 552 5.4%
Active Listings 79 95 -16.8% 106 -25.5%
Months Supply of Inventory 2.0 2.3 -13.0% 2.8 -28.6%
New Listings 18 17 5.9% 24 -25.0% 699 693 0.9%
Pending Sales 22 33 -33.3% 34 -35.3% 567 554 2.3%
Days to Off Market 107 75 42.7% 67 59.7% 52 49 6.1%
Sold to Original Price Ratio 97.4% 99.8% -2.4% 97.4% 0.0% 98.8% 99.2% -0.4%
Price per Square Foot $289 $292 -1.0% $290 -0.3% $283 $269 5.2%
Year to DateYear over Year Month over Month
$0
$100,000
$200,000
$300,000
$400,000
$500,000
$600,000
$700,000
$800,000
$900,000
0
50
100
150
200
250
300
Dec-18 Jan-19 Feb-19 Mar-19 Apr-19 May-19 Jun-19 Jul-19 Aug-19 Sep-19 Oct-19 Nov-19 Dec-19
Condo Units Sold Single Family Units Sold Condo Sold Price Single Family Sold Price
© 2019 North Leaf Solutions LLC as Domus Analytics, under license for Greater Boston Association of REALTORS® 9
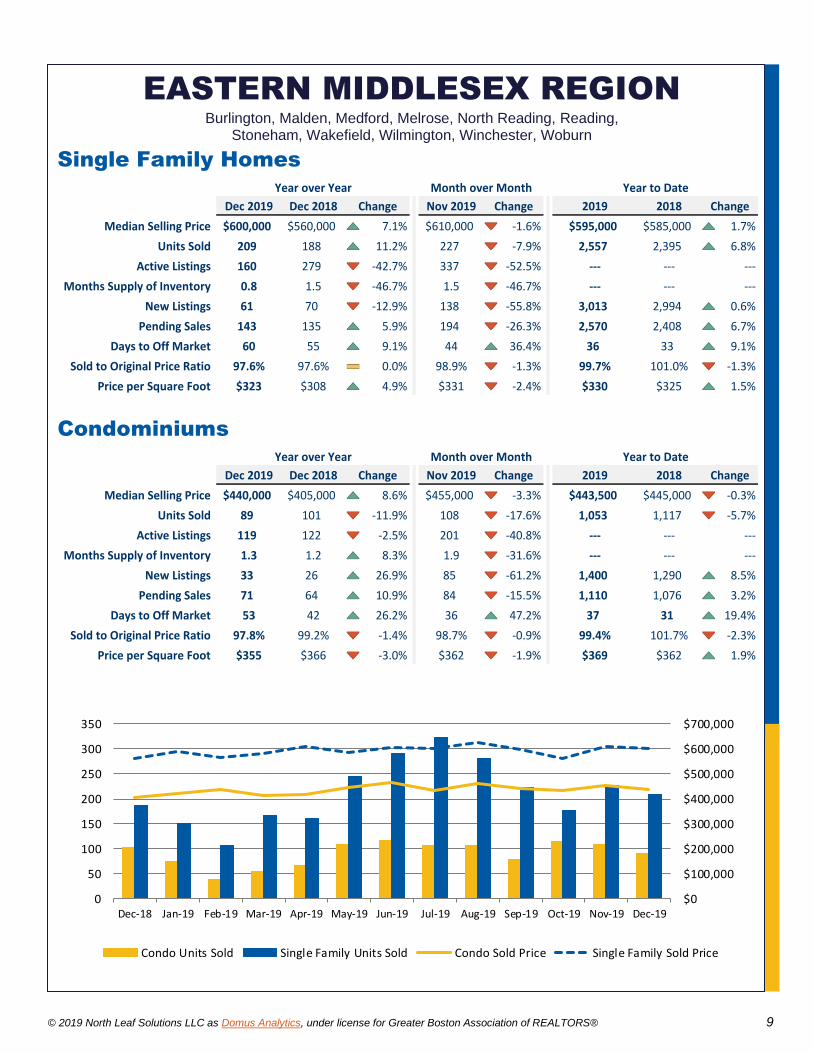
EASTERN MIDDLESEX REGION Burlington, Malden, Medford, Melrose, North Reading, Reading,
Stoneham, Wakefield, Wilmington, Winchester, Woburn
Single Family Homes
Dec 2019 Dec 2018 Change Nov 2019 Change 2019 2018 Change
Median Selling Price $600,000 $560,000 7.1% $610,000 -1.6% $595,000 $585,000 1.7%
Units Sold 209 188 11.2% 227 -7.9% 2,557 2,395 6.8%
Active Listings 160 279 -42.7% 337 -52.5%
Months Supply of Inventory 0.8 1.5 -46.7% 1.5 -46.7%
New Listings 61 70 -12.9% 138 -55.8% 3,013 2,994 0.6%
Pending Sales 143 135 5.9% 194 -26.3% 2,570 2,408 6.7%
Days to Off Market 60 55 9.1% 44 36.4% 36 33 9.1%
Sold to Original Price Ratio 97.6% 97.6% 0.0% 98.9% -1.3% 99.7% 101.0% -1.3%
Price per Square Foot $323 $308 4.9% $331 -2.4% $330 $325 1.5%
Year over Year Month over Month Year to Date
Condominiums
Dec 2019 Dec 2018 Change Nov 2019 Change 2019 2018 Change
Median Selling Price $440,000 $405,000 8.6% $455,000 -3.3% $443,500 $445,000 -0.3%
Units Sold 89 101 -11.9% 108 -17.6% 1,053 1,117 -5.7%
Active Listings 119 122 -2.5% 201 -40.8%
Months Supply of Inventory 1.3 1.2 8.3% 1.9 -31.6%
New Listings 33 26 26.9% 85 -61.2% 1,400 1,290 8.5%
Pending Sales 71 64 10.9% 84 -15.5% 1,110 1,076 3.2%
Days to Off Market 53 42 26.2% 36 47.2% 37 31 19.4%
Sold to Original Price Ratio 97.8% 99.2% -1.4% 98.7% -0.9% 99.4% 101.7% -2.3%
Price per Square Foot $355 $366 -3.0% $362 -1.9% $369 $362 1.9%
Year over Year Month over Month Year to Date
$0
$100,000
$200,000
$300,000
$400,000
$500,000
$600,000
$700,000
0
50
100
150
200
250
300
350
Dec-18 Jan-19 Feb-19 Mar-19 Apr-19 May-19 Jun-19 Jul-19 Aug-19 Sep-19 Oct-19 Nov-19 Dec-19
Condo Units Sold Single Family Units Sold Condo Sold Price Single Family Sold Price

© 2019 North Leaf Solutions LLC as Domus Analytics, under license for Greater Boston Association of REALTORS® 10
METRO BOSTON REGION Arlington, Belmont, Boston, Brookline, Cambridge, Chelsea, Dedham, Everett,
Milton, Newton, Revere, Somerville, Waltham, Watertown, Winthrop
Single Family Homes
Dec 2019 Dec 2018 Change Nov 2019 Change 2019 2018 Change
Median Selling Price $675,000 $670,000 0.7% $679,500 -0.7% $720,000 $693,750 3.8%
Units Sold 332 274 21.2% 296 12.2% 3,686 3,706 -0.5%
Active Listings 339 484 -30.0% 592 -42.7%
Months Supply of Inventory 1.0 1.8 -44.4% 2.0 -50.0%
New Listings 113 108 4.6% 202 -44.1% 4,783 4,796 -0.3%
Pending Sales 203 177 14.7% 312 -34.9% 3,749 3,652 2.7%
Days to Off Market 58 53 9.4% 46 26.1% 40 35 14.3%
Sold to Original Price Ratio 96.9% 96.1% 0.8% 98.1% -1.2% 98.6% 99.9% -1.3%
Price per Square Foot $415 $397 4.5% $409 1.5% $425 $413 2.9%
Year over Year Month over Month Year to Date
Condominiums
Dec 2019 Dec 2018 Change Nov 2019 Change 2019 2018 Change
Median Selling Price $675,000 $635,000 6.3% $646,000 4.5% $650,000 $656,888 -1.0%
Units Sold 607 491 23.6% 547 11.0% 7,527 7,578 -0.7%
Active Listings 988 1,205 -18.0% 1,572 -37.2%
Months Supply of Inventory 1.6 2.5 -36.0% 2.9 -44.8%
New Listings 266 254 4.7% 450 -40.9% 10,585 9,984 6.0%
Pending Sales 411 343 19.8% 598 -31.3% 7,864 7,368 6.7%
Days to Off Market 68 56 21.4% 53 28.3% 44 36 22.2%
Sold to Original Price Ratio 96.7% 97.7% -1.0% 97.5% -0.8% 98.5% 100.4% -1.9%
Price per Square Foot $686 $658 4.3% $657 4.4% $685 $681 0.6%
Year over Year Month over Month Year to Date
$0
$100,000
$200,000
$300,000
$400,000
$500,000
$600,000
$700,000
$800,000
$900,000
0
200
400
600
800
1000
Dec-18 Jan-19 Feb-19 Mar-19 Apr-19 May-19 Jun-19 Jul-19 Aug-19 Sep-19 Oct-19 Nov-19 Dec-19
Condo Units Sold Single Family Units Sold Condo Sold Price Single Family Sold Price
© 2019 North Leaf Solutions LLC as Domus Analytics, under license for Greater Boston Association of REALTORS® 11
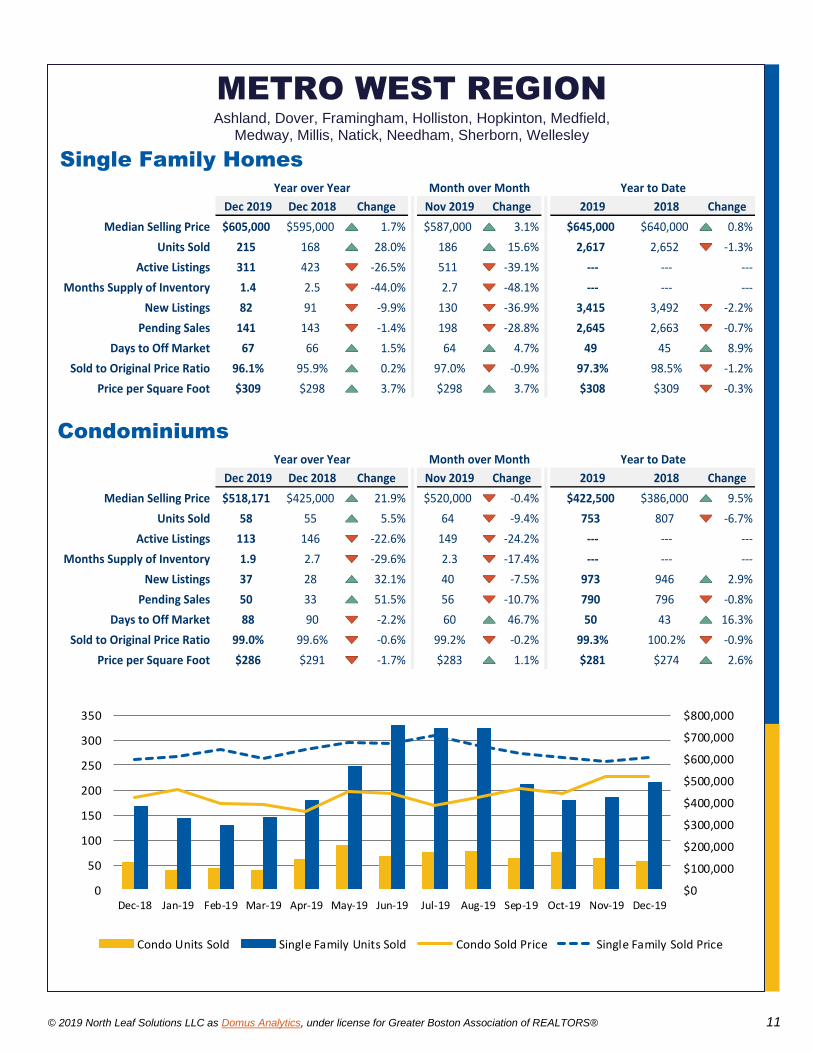
METRO WEST REGION Ashland, Dover, Framingham, Holliston, Hopkinton, Medfield,
Medway, Millis, Natick, Needham, Sherborn, Wellesley
Single Family Homes
Dec 2019 Dec 2018 Change Nov 2019 Change 2019 2018 Change
Median Selling Price $605,000 $595,000 1.7% $587,000 3.1% $645,000 $640,000 0.8%
Units Sold 215 168 28.0% 186 15.6% 2,617 2,652 -1.3%
Active Listings 311 423 -26.5% 511 -39.1%
Months Supply of Inventory 1.4 2.5 -44.0% 2.7 -48.1%
New Listings 82 91 -9.9% 130 -36.9% 3,415 3,492 -2.2%
Pending Sales 141 143 -1.4% 198 -28.8% 2,645 2,663 -0.7%
Days to Off Market 67 66 1.5% 64 4.7% 49 45 8.9%
Sold to Original Price Ratio 96.1% 95.9% 0.2% 97.0% -0.9% 97.3% 98.5% -1.2%
Price per Square Foot $309 $298 3.7% $298 3.7% $308 $309 -0.3%
Year over Year Month over Month Year to Date
Condominiums
Dec 2019 Dec 2018 Change Nov 2019 Change 2019 2018 Change
Median Selling Price $518,171 $425,000 21.9% $520,000 -0.4% $422,500 $386,000 9.5%
Units Sold 58 55 5.5% 64 -9.4% 753 807 -6.7%
Active Listings 113 146 -22.6% 149 -24.2%
Months Supply of Inventory 1.9 2.7 -29.6% 2.3 -17.4%
New Listings 37 28 32.1% 40 -7.5% 973 946 2.9%
Pending Sales 50 33 51.5% 56 -10.7% 790 796 -0.8%
Days to Off Market 88 90 -2.2% 60 46.7% 50 43 16.3%
Sold to Original Price Ratio 99.0% 99.6% -0.6% 99.2% -0.2% 99.3% 100.2% -0.9%
Price per Square Foot $286 $291 -1.7% $283 1.1% $281 $274 2.6%
Year over Year Month over Month Year to Date
$0
$100,000
$200,000
$300,000
$400,000
$500,000
$600,000
$700,000
$800,000
0
50
100
150
200
250
300
350
Dec-18 Jan-19 Feb-19 Mar-19 Apr-19 May-19 Jun-19 Jul-19 Aug-19 Sep-19 Oct-19 Nov-19 Dec-19
Condo Units Sold Single Family Units Sold Condo Sold Price Single Family Sold Price
© 2019 North Leaf Solutions LLC as Domus Analytics, under license for Greater Boston Association of REALTORS® 12
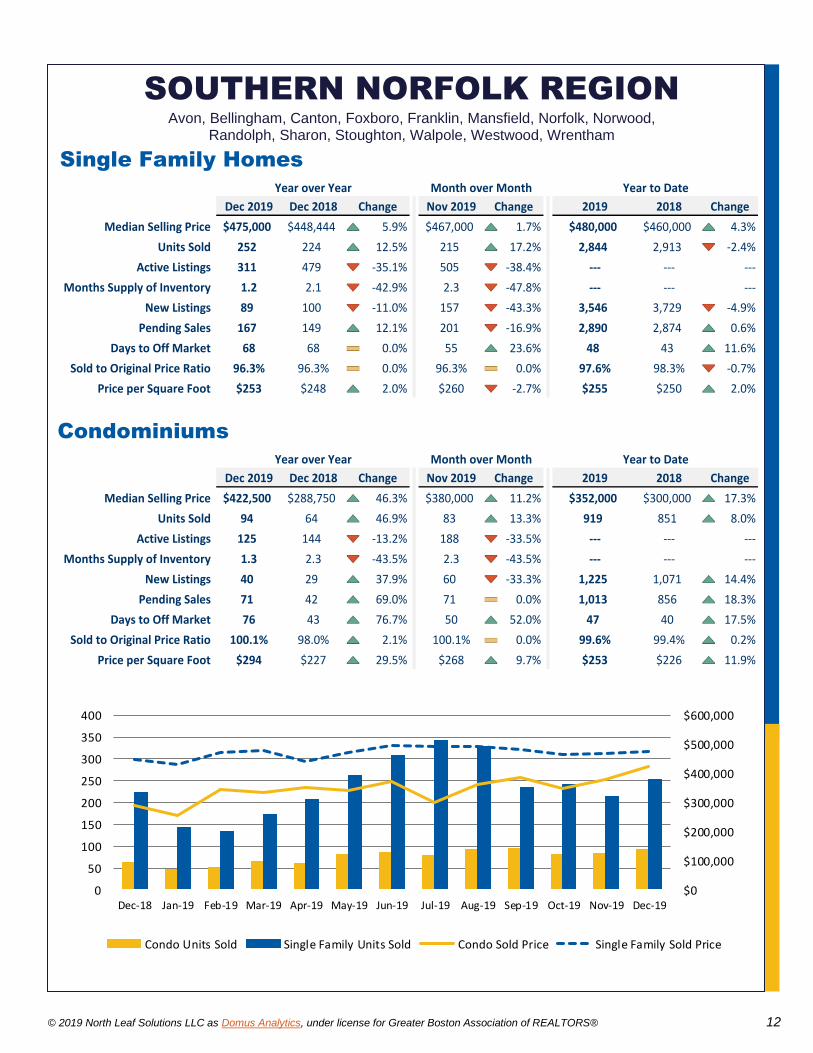
SOUTHERN NORFOLK REGION Avon, Bellingham, Canton, Foxboro, Franklin, Mansfield, Norfolk, Norwood,
Randolph, Sharon, Stoughton, Walpole, Westwood, Wrentham
Single Family Homes
Dec 2019 Dec 2018 Change Nov 2019 Change 2019 2018 Change
Median Selling Price $475,000 $448,444 5.9% $467,000 1.7% $480,000 $460,000 4.3%
Units Sold 252 224 12.5% 215 17.2% 2,844 2,913 -2.4%
Active Listings 311 479 -35.1% 505 -38.4%
Months Supply of Inventory 1.2 2.1 -42.9% 2.3 -47.8%
New Listings 89 100 -11.0% 157 -43.3% 3,546 3,729 -4.9%
Pending Sales 167 149 12.1% 201 -16.9% 2,890 2,874 0.6%
Days to Off Market 68 68 0.0% 55 23.6% 48 43 11.6%
Sold to Original Price Ratio 96.3% 96.3% 0.0% 96.3% 0.0% 97.6% 98.3% -0.7%
Price per Square Foot $253 $248 2.0% $260 -2.7% $255 $250 2.0%
Year over Year Month over Month Year to Date
Condominiums
Dec 2019 Dec 2018 Change Nov 2019 Change 2019 2018 Change
Median Selling Price $422,500 $288,750 46.3% $380,000 11.2% $352,000 $300,000 17.3%
Units Sold 94 64 46.9% 83 13.3% 919 851 8.0%
Active Listings 125 144 -13.2% 188 -33.5%
Months Supply of Inventory 1.3 2.3 -43.5% 2.3 -43.5%
New Listings 40 29 37.9% 60 -33.3% 1,225 1,071 14.4%
Pending Sales 71 42 69.0% 71 0.0% 1,013 856 18.3%
Days to Off Market 76 43 76.7% 50 52.0% 47 40 17.5%
Sold to Original Price Ratio 100.1% 98.0% 2.1% 100.1% 0.0% 99.6% 99.4% 0.2%
Price per Square Foot $294 $227 29.5% $268 9.7% $253 $226 11.9%
Year over Year Month over Month Year to Date
$0
$100,000
$200,000
$300,000
$400,000
$500,000
$600,000
0
50
100
150
200
250
300
350
400
Dec-18 Jan-19 Feb-19 Mar-19 Apr-19 May-19 Jun-19 Jul-19 Aug-19 Sep-19 Oct-19 Nov-19 Dec-19
Condo Units Sold Single Family Units Sold Condo Sold Price Single Family Sold Price
© 2019 North Leaf Solutions LLC as Domus Analytics, under license for Greater Boston Association of REALTORS® 13
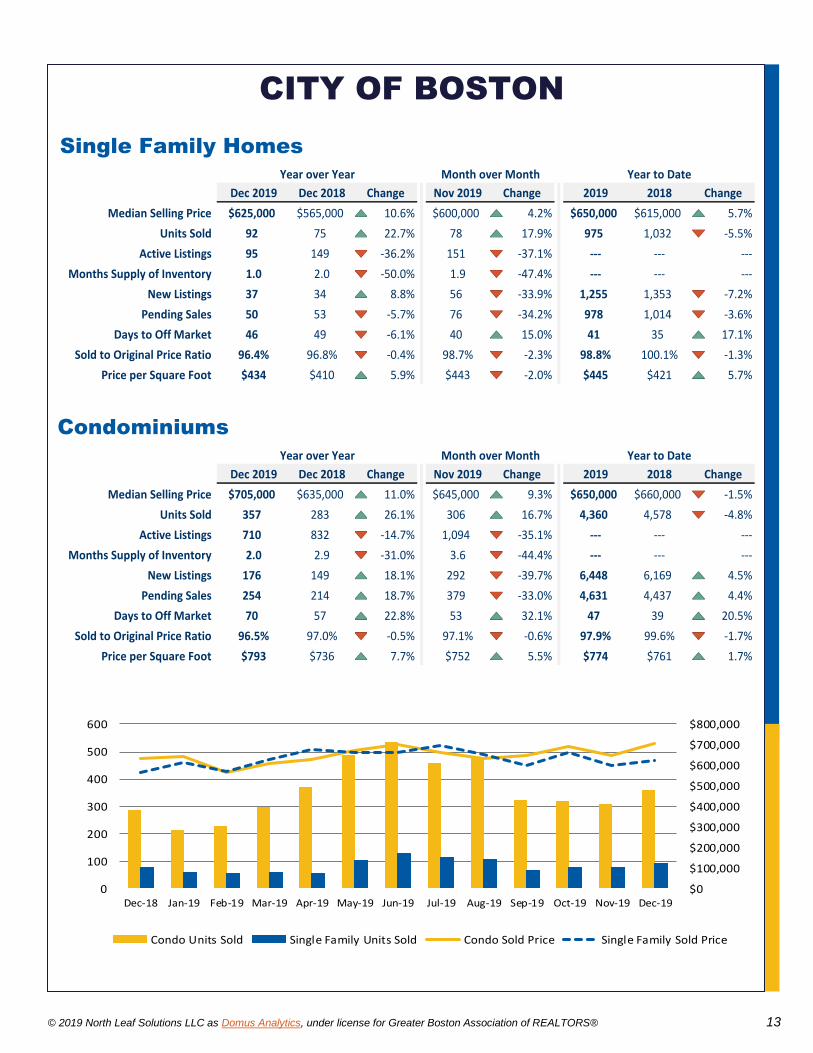
CITY OF BOSTON
Single Family Homes
Dec 2019 Dec 2018 Change Nov 2019 Change 2019 2018 Change
Median Selling Price $625,000 $565,000 10.6% $600,000 4.2% $650,000 $615,000 5.7%
Units Sold 92 75 22.7% 78 17.9% 975 1,032 -5.5%
Active Listings 95 149 -36.2% 151 -37.1%
Months Supply of Inventory 1.0 2.0 -50.0% 1.9 -47.4%
New Listings 37 34 8.8% 56 -33.9% 1,255 1,353 -7.2%
Pending Sales 50 53 -5.7% 76 -34.2% 978 1,014 -3.6%
Days to Off Market 46 49 -6.1% 40 15.0% 41 35 17.1%
Sold to Original Price Ratio 96.4% 96.8% -0.4% 98.7% -2.3% 98.8% 100.1% -1.3%
Price per Square Foot $434 $410 5.9% $443 -2.0% $445 $421 5.7%
Year over Year Month over Month Year to Date
Condominiums
Dec 2019 Dec 2018 Change Nov 2019 Change 2019 2018 Change
Median Selling Price $705,000 $635,000 11.0% $645,000 9.3% $650,000 $660,000 -1.5%
Units Sold 357 283 26.1% 306 16.7% 4,360 4,578 -4.8%
Active Listings 710 832 -14.7% 1,094 -35.1%
Months Supply of Inventory 2.0 2.9 -31.0% 3.6 -44.4%
New Listings 176 149 18.1% 292 -39.7% 6,448 6,169 4.5%
Pending Sales 254 214 18.7% 379 -33.0% 4,631 4,437 4.4%
Days to Off Market 70 57 22.8% 53 32.1% 47 39 20.5%
Sold to Original Price Ratio 96.5% 97.0% -0.5% 97.1% -0.6% 97.9% 99.6% -1.7%
Price per Square Foot $793 $736 7.7% $752 5.5% $774 $761 1.7%
Year over Year Month over Month Year to Date
$0
$100,000
$200,000
$300,000
$400,000
$500,000
$600,000
$700,000
$800,000
0
100
200
300
400
500
600
Dec-18 Jan-19 Feb-19 Mar-19 Apr-19 May-19 Jun-19 Jul-19 Aug-19 Sep-19 Oct-19 Nov-19 Dec-19
Condo Units Sold Single Family Units Sold Condo Sold Price Single Family Sold Price
© 2019 North Leaf Solutions LLC as Domus Analytics, under license for Greater Boston Association of REALTORS® 14
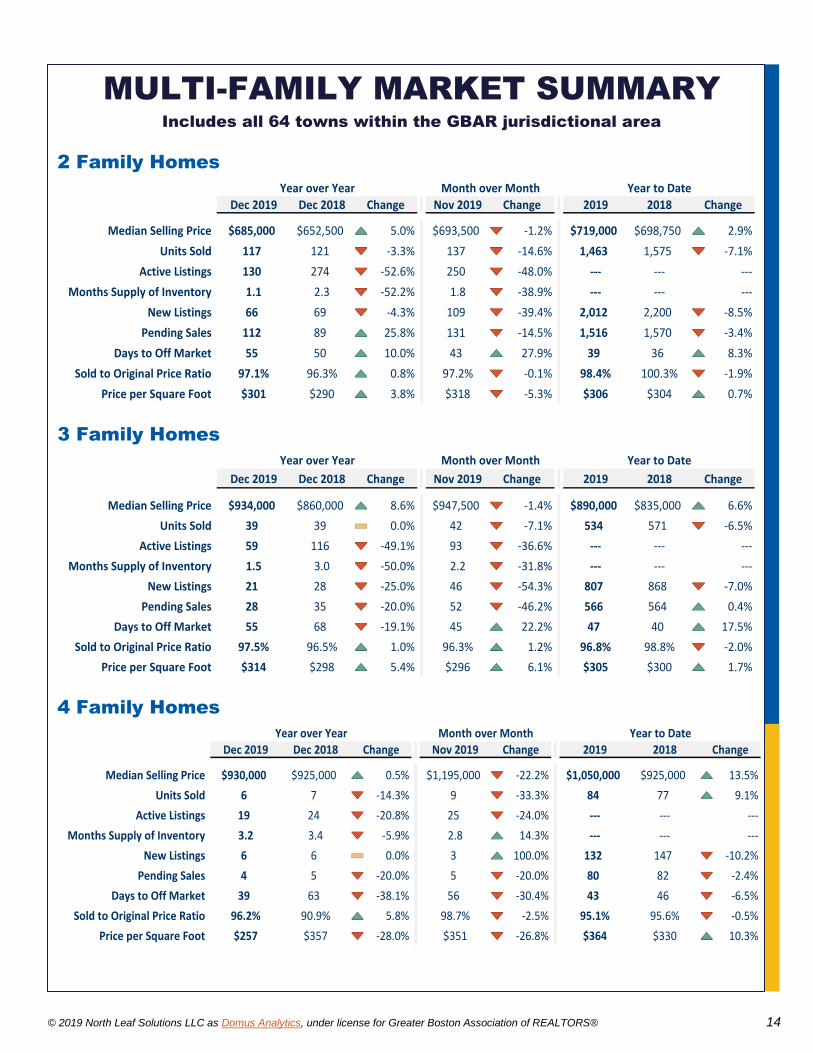
MULTI-FAMILY MARKET SUMMARY Includes all 64 towns within the GBAR jurisdictional area
2 Family Homes
Dec 2019 Dec 2018 Change Nov 2019 Change 2019 2018 Change
Median Selling Price $685,000 $652,500 5.0% $693,500 -1.2% $719,000 $698,750 2.9%
Units Sold 117 121 -3.3% 137 -14.6% 1,463 1,575 -7.1%
Active Listings 130 274 -52.6% 250 -48.0%
Months Supply of Inventory 1.1 2.3 -52.2% 1.8 -38.9%
New Listings 66 69 -4.3% 109 -39.4% 2,012 2,200 -8.5%
Pending Sales 112 89 25.8% 131 -14.5% 1,516 1,570 -3.4%
Days to Off Market 55 50 10.0% 43 27.9% 39 36 8.3%
Sold to Original Price Ratio 97.1% 96.3% 0.8% 97.2% -0.1% 98.4% 100.3% -1.9%
Price per Square Foot $301 $290 3.8% $318 -5.3% $306 $304 0.7%
Year over Year Month over Month Year to Date
3 Family Homes
Dec 2019 Dec 2018 Change Nov 2019 Change 2019 2018 Change
Median Selling Price $934,000 $860,000 8.6% $947,500 -1.4% $890,000 $835,000 6.6%
Units Sold 39 39 0.0% 42 -7.1% 534 571 -6.5%
Active Listings 59 116 -49.1% 93 -36.6%
Months Supply of Inventory 1.5 3.0 -50.0% 2.2 -31.8%
New Listings 21 28 -25.0% 46 -54.3% 807 868 -7.0%
Pending Sales 28 35 -20.0% 52 -46.2% 566 564 0.4%
Days to Off Market 55 68 -19.1% 45 22.2% 47 40 17.5%
Sold to Original Price Ratio 97.5% 96.5% 1.0% 96.3% 1.2% 96.8% 98.8% -2.0%
Price per Square Foot $314 $298 5.4% $296 6.1% $305 $300 1.7%
Year over Year Month over Month Year to Date
4 Family Homes
Dec 2019 Dec 2018 Change Nov 2019 Change 2019 2018 Change
Median Selling Price $930,000 $925,000 0.5% $1,195,000 -22.2% $1,050,000 $925,000 13.5%
Units Sold 6 7 -14.3% 9 -33.3% 84 77 9.1%
Active Listings 19 24 -20.8% 25 -24.0%
Months Supply of Inventory 3.2 3.4 -5.9% 2.8 14.3%
New Listings 6 6 0.0% 3 100.0% 132 147 -10.2%
Pending Sales 4 5 -20.0% 5 -20.0% 80 82 -2.4%
Days to Off Market 39 63 -38.1% 56 -30.4% 43 46 -6.5%
Sold to Original Price Ratio 96.2% 90.9% 5.8% 98.7% -2.5% 95.1% 95.6% -0.5%
Price per Square Foot $257 $357 -28.0% $351 -26.8% $364 $330 10.3%
Year to DateYear over Year Month over Month
© 2019 North Leaf Solutions LLC as Domus Analytics, under license for Greater Boston Association of REALTORS® 15
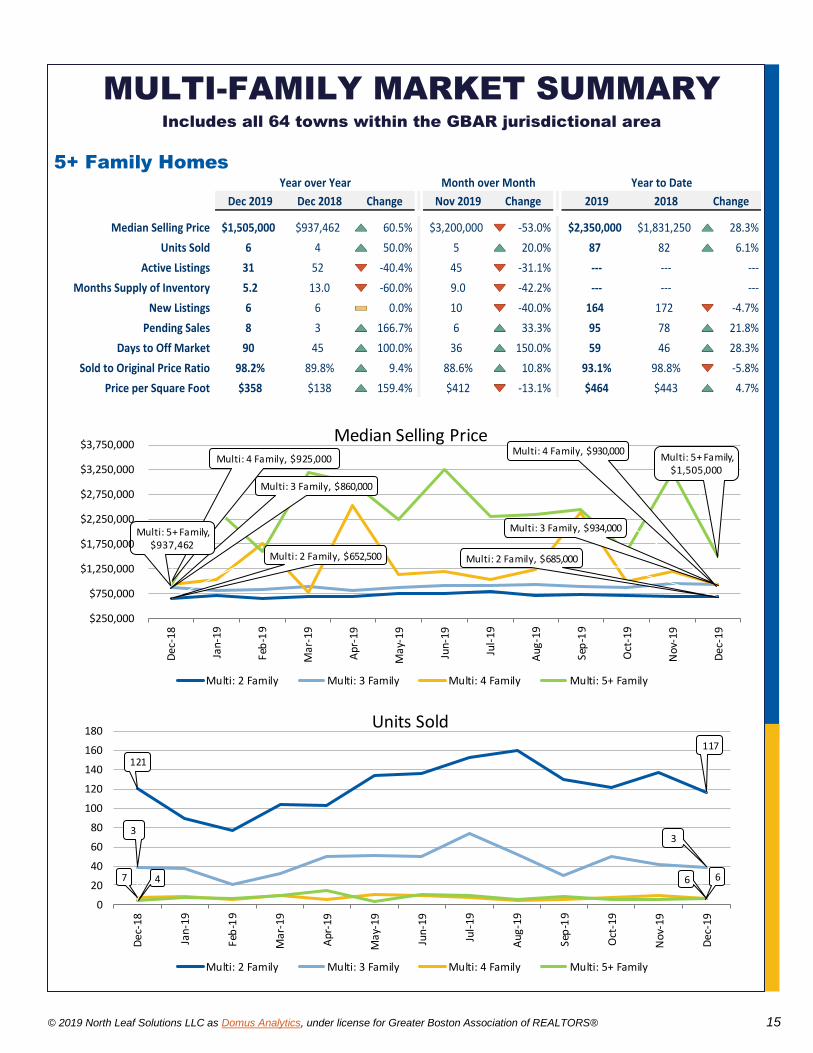
MULTI-FAMILY MARKET SUMMARY Includes all 64 towns within the GBAR jurisdictional area
5+ Family Homes
Dec 2019 Dec 2018 Change Nov 2019 Change 2019 2018 Change
Median Selling Price $1,505,000 $937,462 60.5% $3,200,000 -53.0% $2,350,000 $1,831,250 28.3%
Units Sold 6 4 50.0% 5 20.0% 87 82 6.1%
Active Listings 31 52 -40.4% 45 -31.1%
Months Supply of Inventory 5.2 13.0 -60.0% 9.0 -42.2%
New Listings 6 6 0.0% 10 -40.0% 164 172 -4.7%
Pending Sales 8 3 166.7% 6 33.3% 95 78 21.8%
Days to Off Market 90 45 100.0% 36 150.0% 59 46 28.3%
Sold to Original Price Ratio 98.2% 89.8% 9.4% 88.6% 10.8% 93.1% 98.8% -5.8%
Price per Square Foot $358 $138 159.4% $412 -13.1% $464 $443 4.7%
Year over Year Month over Month Year to Date
Multi: 2 Family, $652,500 Multi: 2 Family, $685,000
Multi: 3 Family, $860,000
Multi: 3 Family, $934,000
Multi: 4 Family, $925,000 Multi: 4 Family, $930,000
Multi: 5+ Family, $937,462
Multi: 5+ Family, $1,505,000
$250,000
$750,000
$1,250,000
$1,750,000
$2,250,000
$2,750,000
$3,250,000
$3,750,000
Dec
-18
Jan-
19
Feb
-19
Ma
r-1
9
Apr
-19
Ma
y-1
9
Jun
-19
Jul-
19
Aug
-19
Sep
-19
Oct
-19
No
v-1
9
De
c-1
9
Median Selling Price
Multi: 2 Family Multi: 3 Family Multi: 4 Family Multi: 5+ Family
121
117
33
7 64 6
0
20
40
60
80
100
120
140
160
180
De
c-1
8
Jan-
19
Feb
-19
Mar
-19
Apr
-19
May
-19
Jun
-19
Jul-
19
Aug
-19
Sep
-19
Oct
-19
No
v-1
9
De
c-1
9
Units Sold
Multi: 2 Family Multi: 3 Family Multi: 4 Family Multi: 5+ Family

© 2019 North Leaf Solutions LLC as Domus Analytics, under license for Greater Boston Association of REALTORS® 16
GBAR JURISDICTIONAL AREA

© 2019 North Leaf Solutions LLC as Domus Analytics, under license for Greater Boston Association of REALTORS® 17
Days to Off Market is the Average number of days between when a property is listed and the off
market date when an offer is accepted.
Active Listings is the number of Active properties available for sale at the end of the month.
Median Selling Price is the mid-point where the price for half of the sales are higher and half are
lower. Median is preferred to average as it better accounts for outliers at the high or low end of the price
range.
Months Supply of Inventory (MSI), also known as Absorption, is the number of months it would
take to sell through the units available for sale at the current monthly sales rate. The National Association
of REALTORS® describes a balanced market as between 5 and 7 months supply of inventory (MSI).
New Listings is the number of properties listed in a given month or time period.
Pending Sales is the number of properties newly under contract in a given month or time period.
Price per Square Foot is the average of the sold price divided by the square feet of the property.
Sale Price to Original Price Ratio is the average of the Sales Price divided by the Original List
Price, and expressed as a percentage.
Units Sold is the number of properties which actually Sold within a given month or time period.
Members of the Greater Boston Association of REALTORS® are authorized to reproduce and redistribute this copyrighted report or sections within in any format, including electronic or hard copy distribution. No other reprint or distribution of this report is granted unless specifically approved in writing by the GBAR, and all logos, graphics, or copyright information must not be removed or edited in any way. Market trends and analysis based on data from the MLS Property Information Network, Inc. through the end of each month. Due to timing of data entry into the MLS, data shown may be different than previously reported.
The Monthly Insights report provides monthly summaries of the overall market served by the Greater Boston Association of
REALTORS®. As market conditions vary within smaller geographic areas, the Association also provides to its members an online,
interactive dashboard which delivers timely, relevant data with many more metrics and filtering capabilities. Contact your
Association representative for details.
GLOSSARY
USAGE & DISCLAIMERS