Gaze Tracking: Application to Perception of...
9
3D Computer Vision Fall 2008 (CS 6320) University of Utah Gaze Tracking: Application to Perception of Symmetry Manasi Datar Nikhil Pratap Singh Introduction Part1: System Eye gaze can be defined as the ray of sight which represents person's focus of attention. Eye gaze tracking has been an active research topic for many decades because of its potential usages in various applications such as Human Computer Interaction (HCI), Virtual Reality, Eye Disease Diagnosis and Human Behavior Study, etc. In order for some of these applications to be developed and become available for use to the average person, the systems used to track and estimate a person’s gaze need to be relatively inexpensive, require no specialized equipment, be non-intrusive (no hardware components are attached to the user), require little or no calibration for new or return users to the system, and be robust against normal head movements. As a part of the class project (CS 6320) we implement the gaze detection and tracking system based on set of visual cues. We define a set of 12 features representing a person's gaze. We use the k-nearest neighbor learning algorithm for classifier learning. This implementation gives a fairly reasonable accuracy in “per-user-per-session” mode. Part2: Application to perception of symmetry Hypothesis: We propose that, there is a trend in perception of symmetry that maps to the human psychology. The gaze scan path over a set of symmetric figures, broken symmetric figures and images with artificially induced asymmetry obtained from vision cues reflect the corresponding distinguishable pattern.
Transcript of Gaze Tracking: Application to Perception of...

3D Computer Vision
Fall 2008
(CS 6320)
University of Utah
Gaze Tracking: Application to Perception of Symmetry
Manasi Datar
Nikhil Pratap Singh
Introduction
Part1: System
Eye gaze can be defined as the ray of sight which represents person's focus of attention. Eye gaze
tracking has been an active research topic for many decades because of its potential usages in various
applications such as Human Computer Interaction (HCI), Virtual Reality, Eye Disease Diagnosis and
Human Behavior Study, etc.
In order for some of these applications to be developed and become available for use to the average
person, the systems used to track and estimate a person’s gaze need to be relatively inexpensive, require
no specialized equipment, be non-intrusive (no hardware components are attached to the user), require
little or no calibration for new or return users to the system, and be robust against normal head
movements.
As a part of the class project (CS 6320) we implement the gaze detection and tracking system based on
set of visual cues. We define a set of 12 features representing a person's gaze. We use the k-nearest
neighbor learning algorithm for classifier learning. This implementation gives a fairly reasonable
accuracy in “per-user-per-session” mode.
Part2: Application to perception of symmetry
Hypothesis: We propose that, there is a trend in perception of symmetry that maps to the human
psychology. The gaze scan path over a set of symmetric figures, broken symmetric figures and images
with artificially induced asymmetry obtained from vision cues reflect the corresponding distinguishable
pattern.
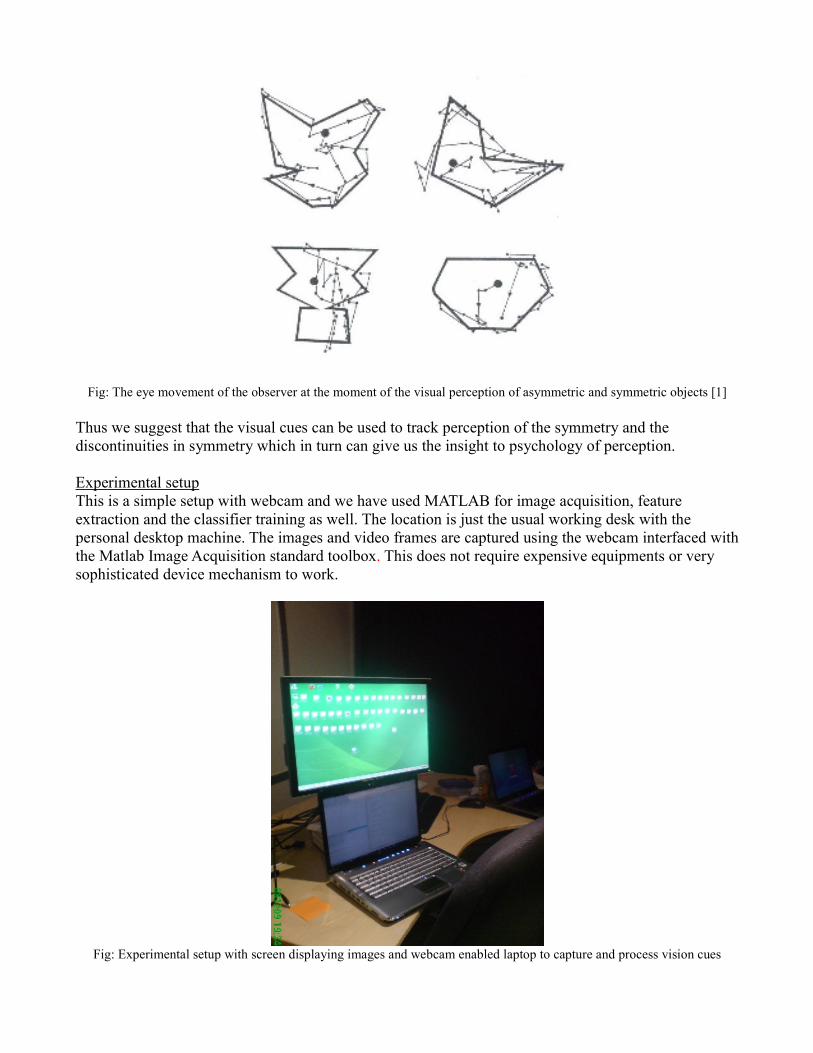
Fig: The eye movement of the observer at the moment of the visual perception of asymmetric and symmetric objects [1]
Thus we suggest that the visual cues can be used to track perception of the symmetry and the
discontinuities in symmetry which in turn can give us the insight to psychology of perception.
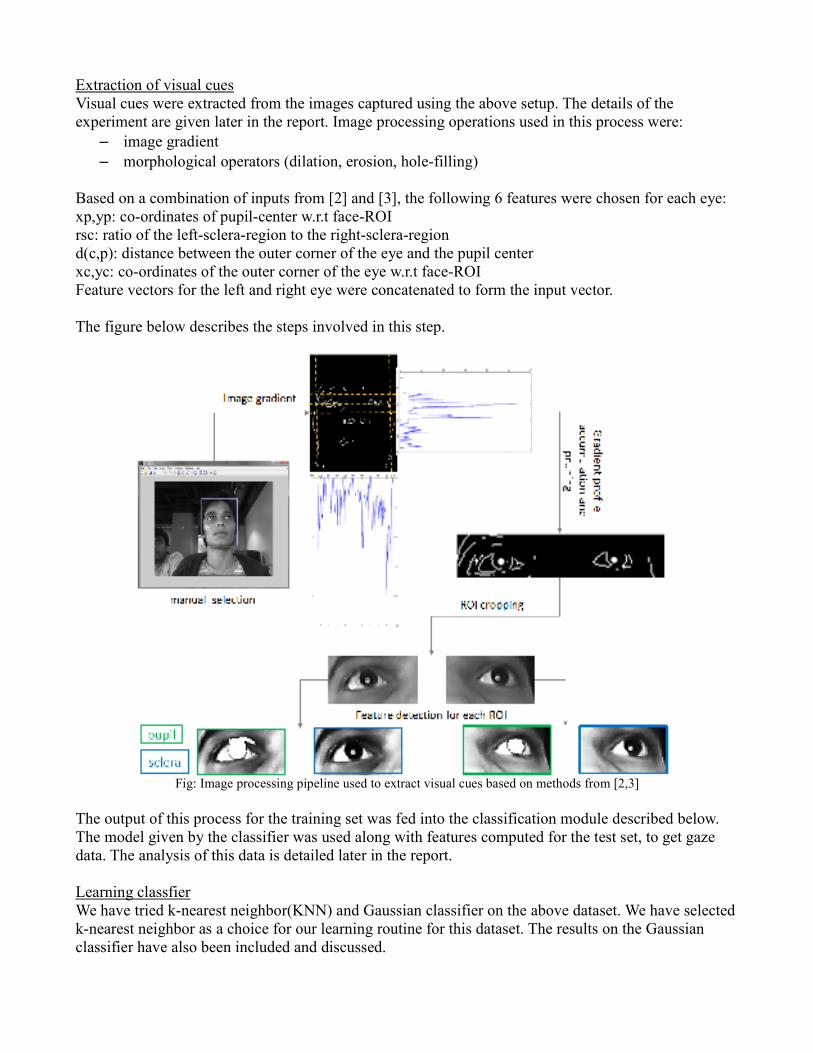
Experimental setup
This is a simple setup with webcam and we have used MATLAB for image acquisition, feature
extraction and the classifier training as well. The location is just the usual working desk with the
personal desktop machine. The images and video frames are captured using the webcam interfaced with
the Matlab Image Acquisition standard toolbox. This does not require expensive equipments or very
sophisticated device mechanism to work.
Fig: Experimental setup with screen displaying images and webcam enabled laptop to capture and process vision cues
Extraction of visual cues
Visual cues were extracted from the images captured using the above setup. The details of the
experiment are given later in the report. Image processing operations used in this process were:
– image gradient
– morphological operators (dilation, erosion, hole-filling)
Based on a combination of inputs from [2] and [3], the following 6 features were chosen for each eye:
xp,yp: co-ordinates of pupil-center w.r.t face-ROI
rsc: ratio of the left-sclera-region to the right-sclera-region
d(c,p): distance between the outer corner of the eye and the pupil center
xc,yc: co-ordinates of the outer corner of the eye w.r.t face-ROI
Feature vectors for the left and right eye were concatenated to form the input vector.
The figure below describes the steps involved in this step.
Fig: Image processing pipeline used to extract visual cues based on methods from [2,3]
The output of this process for the training set was fed into the classification module described below.
The model given by the classifier was used along with features computed for the test set, to get gaze
data. The analysis of this data is detailed later in the report.
Learning classfier
We have tried k-nearest neighbor(KNN) and Gaussian classifier on the above dataset. We have selected
k-nearest neighbor as a choice for our learning routine for this dataset. The results on the Gaussian
classifier have also been included and discussed.

Rationale for choosing K-��:
1. Simple implementation
2. K-NN deals more robustly with continuous valued features, presumably because it actually uses
most of the features to make the classification.
3. Intuitively it makes sense to use K-NN for graphically systematic data.
4. Besides K-NN other classifiers can be used:
1. Gaussian classifier (tried this)
2. Self organized map (SOM) algorithm
3. Neural networks (backpropagation)
4. Nonlinear SVM with gaussian kernel
K-NN Classifier Performance
The below set of results helped us decide the best K for the K-NN classifier
********************************************************************
** GAZE TRACKING EXPERIMENTS - LEAVE-ONE-OUT CROSS VALIDATION
********************************************************************
leave-one-out cross-validation accuracy of set 1 is 88.8889%
leave-one-out cross-validation accuracy of set 2 is 77.7778%
leave-one-out cross-validation accuracy of set 3 is 77.7778%
leave-one-out cross-validation accuracy of set 4 is 66.6667%
leave-one-out cross-validation accuracy of set 5 is 66.6667%
leave-one-out cross-validation accuracy of set 6 is 55.5556%
leave-one-out cross-validation accuracy of set 7 is 55.5556%
Press any key to continue...
NOW RUNNING DATA PREPROCESSING SCRIPT...
Press any key to continue...
NOW RUNNING DATA ANALYSIS SCRIPT...
Press any key to continue...
initializing empty results
********************************************************************
** GAZE TRACKING EXPERIMENTS
********************************************************************
Press any key to continue...
First, we load the data...
We randomize the training set and pick 20% of the data as test set...
Press any key to continue...
Note: Since we have limited data points, say just 3-5 sets of calibration data, we artificially create data points by replicating
the data by adding noise. This is done just to get an idea of what K works better for this particular kind of dataset. The
solution to this problem would ideally involve gathering enough sample points to ensure large training set.
Now, we vary the k for the KNN classifier and see how it affects accuracy.
K=1: accuracy 100%
K=4: accuracy 100%
K=8: accuracy 100%
K=16: accuracy 100%
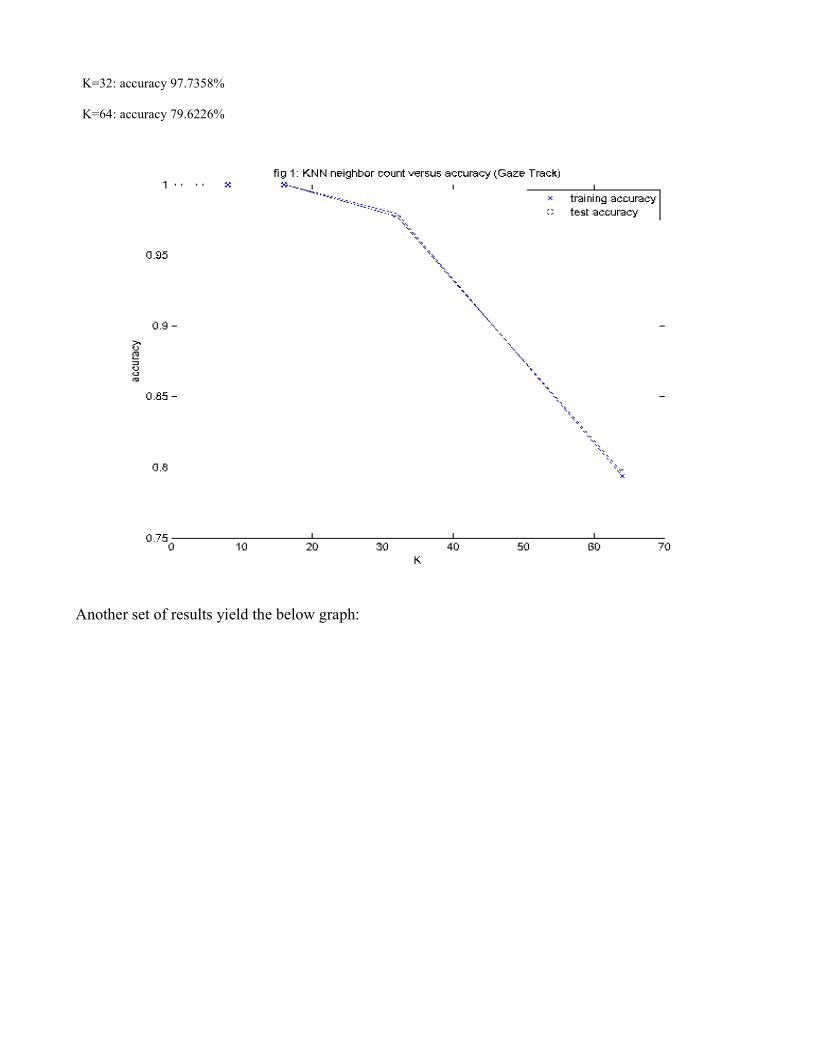
K=32: accuracy 97.7358%
K=64: accuracy 79.6226%
Another set of results yield the below graph:

Gaussian classifier performance
********************************************************************
** GAZE TRACKING EXPERIMENTS - LEAVE-ONE-OUT CROSS VALIDATION
********************************************************************
***leave-one-out cross-validation accuracy of set 1***
0 1: identity, shared ==> ... accuracy train = 0.720459, dev = 0.777778
1 1: diagonal, shared ==> ... accuracy train = 0.730159, dev = 0.777778
2 1: full , shared ==> ... accuracy train = 0.812169, dev = 0.777778
1 0: diagonal, per-class ==> ... accuracy train = 0.732804, dev = 0.777778
2 0: full , per-class ==> ... accuracy train = 0.887125, dev = 0.888889
***leave-one-out cross-validation accuracy of set 2***
0 1: identity, shared ==> ... accuracy train = 0.732804, dev = 0.555556
1 1: diagonal, shared ==> ... accuracy train = 0.747795, dev = 0.555556
2 1: full , shared ==> ... accuracy train = 0.822751, dev = 0.666667
1 0: diagonal, per-class ==> ... accuracy train = 0.700176, dev = 0.777778
2 0: full , per-class ==> ... accuracy train = 0.92328, dev = 0.777778
***leave-one-out cross-validation accuracy of set 3***
0 1: identity, shared ==> ... accuracy train = 0.676367, dev = 0.666667
1 1: diagonal, shared ==> ... accuracy train = 0.686949, dev = 0.666667
2 1: full , shared ==> ... accuracy train = 0.836861, dev = 0.666667
1 0: diagonal, per-class ==> ... accuracy train = 0.684303, dev = 0.777778
2 0: full , per-class ==> ... accuracy train = 0.873898, dev = 0.777778
***leave-one-out cross-validation accuracy of set 4***

0 1: identity, shared ==> ... accuracy train = 0.723986, dev = 0.888889
1 1: diagonal, shared ==> ... accuracy train = 0.726631, dev = 0.888889
2 1: full , shared ==> ... accuracy train = 0.828924, dev = 0.888889
1 0: diagonal, per-class ==> ... accuracy train = 0.695767, dev = 0.666667
2 0: full , per-class ==> ... accuracy train = 0.912698, dev = 0.777778
This gives promising results and looks to be a good alternative to k-nn. If time permits we would try
this model out on this dataset.
Factors affecting accuracy of the implementation
1. Size of the monitor display.
2. Head movements.
3. Number of calibration sets. (training data)
4. ROI picking methodology – eyes/face
Experiments
A regular 3x3 grid (shown in figure below) was used for calibration. Points on the grid were
highlighted sequentially and an image was captured while the subject gazed at the point. This was
repeated for the image. In total, 3 sets of calibration data were acquired.
Fig: Point grid used for calibration
The gaze data collected from the above experiment was used to train the classifier mentioned above.
We chose synthetic and real images which had a break in symmetry in one particular region to test our
hypothesis. An example of each is shown below (the region of interest is highlighted):
Fig: Synthetic and real images used in the study, with aberrations highlighted
The synthetic image was created to have a symmetric object in each region. The symmetry was broken

arbitrarily in 3 regions. The real images were chosen from the Internet and showed a fair amount of
symmetry with a few aberrations.
Results
We realized early on that we will not be able to capture enough training images to get results which
allow exhaustive testing of our hypothesis. Hence, only qualitative evaluation was done and some of
the results are shown below.
Fig: Best result obtained using experimental setup described. Other results were promising, but not as conclusive
Conclusion
We analyze all the results with the assumption that there is evidence of symmetry in the images, and
that a break in symmetry or aberration exists naturally {as in real images} or has been inserted {as in
the synthetic image}.
Gaze Histograms
Gaze histograms can be used as a tool to analyze the span of attention.
We see a distinct increase in the attention paid to regions with aberrations (or break in symmetry). A
trend can only be detected if we observe the same increase across a population of subjects. However,
this serves as a proof of concept that vision cues can be used to assess symmetry in an image or vice
versa.

Gaze Paths
Gaze paths can be used to analyze the path of interest and its correlation with the underlying symmetry.
The gaze path for an image with no observable break in symmetry (e.g. row 3 in results above) is
distinctly different from that obtained by gazing at an image with a break in symmetry. The other
important observation is that this path links the aberration-region with its corresponding region as
defined by the image symmetry (e.g. row 4 in results above).
This data is clearly insufficient to draw poignant conclusions about general trends of perception, but
does indicate a potential relationship between gaze and the perception of symmetry.
Challenges
Acquiring sufficient data to train the classifier was the biggest challenge. Our analysis and conclusions
are severely limited due to the sparse nature of the data collected.
Future work and improvements
1. Feature extraction: feature extraction robust to head movements by doing face detection.
2. Automation of ROI extraction with tracking of eye over the frames.
3. Classifier tuning to increase accuracies of predictions. We can try Gaussian classifier, neural
networks, SOM etc.
4. Set up experiments to acquire a larger amount of training data to improve classification
accuracy and analysis of gaze.
5. Generalize the model from current implementation of per-user-per-session to many-users-many-
sessions applicability.
References
1. “Symmetry as perception factor and the basis of "good form",”
Webpage URL: http://www.mi.sanu.ac.yu/vismath/jadrbookhtml/part46.html
2. Stephen Bialkowski, Zeb Johnson, Kathryn Morgan, Xiaojun Qi, and Donald H. Cooley, "A Non-
Intrusive Approach to Gaze Estimation," Proc. of the 8th International Conference on Computer
Vision, Pattern Recognition, and Image Processing (CVPRIP'07), July 18-24, Salt Lake City, UT,
USA, 2007
3. David Bäck, “Neural Network Gaze Tracking using Web Camera,”
Thesis URL: www.imt.liu.se/mi/Publications/pdfs/back05.pdf