GAViewer Documentation - Geometric Algebra For Computer Science
61
GAViewer Documentation Version 0.84 Daniel Fontijne University of Amsterdam March 19, 2010
Transcript of GAViewer Documentation - Geometric Algebra For Computer Science

GAViewer DocumentationVersion 0.84
Daniel FontijneUniversity of Amsterdam
March 19, 2010

2

Contents
1 Introduction 7
2 The user interface 92.1 The view window . . . . . . . . . . . . . . . . . . . . . . . . . . . 9
2.1.1 Viewpoint rotation . . . . . . . . . . . . . . . . . . . . . . 92.1.2 Viewpoint translation . . . . . . . . . . . . . . . . . . . . 92.1.3 Object selection . . . . . . . . . . . . . . . . . . . . . . . . 102.1.4 Object selection . . . . . . . . . . . . . . . . . . . . . . . . 102.1.5 Object translation / modification . . . . . . . . . . . . . . 102.1.6 View window control summary . . . . . . . . . . . . . . 11
2.2 The console . . . . . . . . . . . . . . . . . . . . . . . . . . . . . . 112.3 Object controls window . . . . . . . . . . . . . . . . . . . . . . . 112.4 Scalar controls window . . . . . . . . . . . . . . . . . . . . . . . . 122.5 The menu bar . . . . . . . . . . . . . . . . . . . . . . . . . . . . . 12
3 .geo and .gpl files 153.1 title . . . . . . . . . . . . . . . . . . . . . . . . . . . . . . . . . . . 153.2 fgcolor, bgcolor, olcolor, cvcolor . . . . . . . . . . . . . . . . . . . 163.3 e3ga, ca3d, p3ga, ca4d, c3ga, ca5d . . . . . . . . . . . . . . . . . . 163.4 label . . . . . . . . . . . . . . . . . . . . . . . . . . . . . . . . . . . 173.5 fontsize . . . . . . . . . . . . . . . . . . . . . . . . . . . . . . . . . 183.6 tsmode . . . . . . . . . . . . . . . . . . . . . . . . . . . . . . . . . 183.7 tsfont . . . . . . . . . . . . . . . . . . . . . . . . . . . . . . . . . . 183.8 tsreset . . . . . . . . . . . . . . . . . . . . . . . . . . . . . . . . . . 183.9 tsinterpret . . . . . . . . . . . . . . . . . . . . . . . . . . . . . . . 193.10 factor . . . . . . . . . . . . . . . . . . . . . . . . . . . . . . . . . . 193.11 eyepos, campos . . . . . . . . . . . . . . . . . . . . . . . . . . . . 193.12 eyetrl, camtrl . . . . . . . . . . . . . . . . . . . . . . . . . . . . . . 193.13 eyeori, camori . . . . . . . . . . . . . . . . . . . . . . . . . . . . . 193.14 eyerot, camrot . . . . . . . . . . . . . . . . . . . . . . . . . . . . . 203.15 hide, show . . . . . . . . . . . . . . . . . . . . . . . . . . . . . . . 203.16 remove . . . . . . . . . . . . . . . . . . . . . . . . . . . . . . . . . 203.17 fade, fade and remove, fade and hide, show and fade . . . . . 203.18 sleep . . . . . . . . . . . . . . . . . . . . . . . . . . . . . . . . . . 213.19 wait . . . . . . . . . . . . . . . . . . . . . . . . . . . . . . . . . . . 213.20 exit . . . . . . . . . . . . . . . . . . . . . . . . . . . . . . . . . . . 213.21 clearconsole . . . . . . . . . . . . . . . . . . . . . . . . . . . . . . 213.22 console . . . . . . . . . . . . . . . . . . . . . . . . . . . . . . . . . 21
3

4 CONTENTS
3.23 resize . . . . . . . . . . . . . . . . . . . . . . . . . . . . . . . . . . 213.24 viewwindowsize . . . . . . . . . . . . . . . . . . . . . . . . . . . 223.25 consoleheight . . . . . . . . . . . . . . . . . . . . . . . . . . . . . 223.26 consolefontsize . . . . . . . . . . . . . . . . . . . . . . . . . . . . 223.27 fullscreen . . . . . . . . . . . . . . . . . . . . . . . . . . . . . . . . 223.28 bookmark . . . . . . . . . . . . . . . . . . . . . . . . . . . . . . . 223.29 open, switchto, import . . . . . . . . . . . . . . . . . . . . . . . . 233.30 clip . . . . . . . . . . . . . . . . . . . . . . . . . . . . . . . . . . . 233.31 delete . . . . . . . . . . . . . . . . . . . . . . . . . . . . . . . . . . 233.32 polygon, simplex . . . . . . . . . . . . . . . . . . . . . . . . . . . 233.33 mesh . . . . . . . . . . . . . . . . . . . . . . . . . . . . . . . . . . 24
3.33.1 meshvertex . . . . . . . . . . . . . . . . . . . . . . . . . . 243.33.2 meshnormal . . . . . . . . . . . . . . . . . . . . . . . . . . 253.33.3 meshface . . . . . . . . . . . . . . . . . . . . . . . . . . . . 253.33.4 Full usage example for mesh . . . . . . . . . . . . . . . . 25
3.34 play (.gpl files only) . . . . . . . . . . . . . . . . . . . . . . . . . . 25
4 The Programming Language and the Console 274.1 Comma, semicolon and space . . . . . . . . . . . . . . . . . . . . 274.2 ans . . . . . . . . . . . . . . . . . . . . . . . . . . . . . . . . . . . 284.3 Operators, assignment, precendence . . . . . . . . . . . . . . . . 284.4 Variables, types and casting . . . . . . . . . . . . . . . . . . . . . 294.5 Builtin Constants . . . . . . . . . . . . . . . . . . . . . . . . . . . 30
4.5.1 Renaming builtin constants . . . . . . . . . . . . . . . . . 314.6 Adding your own constants . . . . . . . . . . . . . . . . . . . . . 314.7 ’Arrays’ . . . . . . . . . . . . . . . . . . . . . . . . . . . . . . . . . 314.8 Calling functions . . . . . . . . . . . . . . . . . . . . . . . . . . . 314.9 Built-in functions . . . . . . . . . . . . . . . . . . . . . . . . . . . 32
4.9.1 Products . . . . . . . . . . . . . . . . . . . . . . . . . . . . 324.9.2 Basic GA functions . . . . . . . . . . . . . . . . . . . . . . 334.9.3 Boolean . . . . . . . . . . . . . . . . . . . . . . . . . . . . 334.9.4 Drawing . . . . . . . . . . . . . . . . . . . . . . . . . . . . 344.9.5 Controls . . . . . . . . . . . . . . . . . . . . . . . . . . . . 374.9.6 Goniometric functions, sqrt, abs, log, exp, pow. . . . . . . 384.9.7 Projective model functions . . . . . . . . . . . . . . . . . 384.9.8 Conformal model functions . . . . . . . . . . . . . . . . . 384.9.9 System functions . . . . . . . . . . . . . . . . . . . . . . . 394.9.10 Networking . . . . . . . . . . . . . . . . . . . . . . . . . . 40
4.10 Dynamic statements . . . . . . . . . . . . . . . . . . . . . . . . . 414.10.1 Named Dynamic Statements . . . . . . . . . . . . . . . . 424.10.2 Animations . . . . . . . . . . . . . . . . . . . . . . . . . . 42
4.11 Control constructs . . . . . . . . . . . . . . . . . . . . . . . . . . . 434.11.1 if else . . . . . . . . . . . . . . . . . . . . . . . . . . . . . . 434.11.2 for . . . . . . . . . . . . . . . . . . . . . . . . . . . . . . . 434.11.3 while . . . . . . . . . . . . . . . . . . . . . . . . . . . . . . 444.11.4 switch . . . . . . . . . . . . . . . . . . . . . . . . . . . . . 44
4.12 Writing functions and batches . . . . . . . . . . . . . . . . . . . . 454.12.1 Batches . . . . . . . . . . . . . . . . . . . . . . . . . . . . . 46
4.13 Autocolor. . . . . . . . . . . . . . . . . . . . . . . . . . . . . . . . 474.13.1 Writing your own autocolor() function. . . . . . . . . . . 47

CONTENTS 5
5 Typesetting labels. 495.1 txt and eqn modes. . . . . . . . . . . . . . . . . . . . . . . . . . . 50
5.1.1 txt mode details: . . . . . . . . . . . . . . . . . . . . . . . 505.1.2 eqn mode details: . . . . . . . . . . . . . . . . . . . . . . . 51
5.2 Fonts . . . . . . . . . . . . . . . . . . . . . . . . . . . . . . . . . . 515.3 Scaling of fonts . . . . . . . . . . . . . . . . . . . . . . . . . . . . 535.4 Forced whitespace, forced newlines . . . . . . . . . . . . . . . . 535.5 Alignment . . . . . . . . . . . . . . . . . . . . . . . . . . . . . . . 545.6 Sub- and superscript . . . . . . . . . . . . . . . . . . . . . . . . . 545.7 Parentheses . . . . . . . . . . . . . . . . . . . . . . . . . . . . . . 555.8 Tabulars . . . . . . . . . . . . . . . . . . . . . . . . . . . . . . . . 565.9 (Square) roots . . . . . . . . . . . . . . . . . . . . . . . . . . . . . 575.10 Fractions . . . . . . . . . . . . . . . . . . . . . . . . . . . . . . . . 575.11 Hats . . . . . . . . . . . . . . . . . . . . . . . . . . . . . . . . . . . 585.12 Colors . . . . . . . . . . . . . . . . . . . . . . . . . . . . . . . . . . 58
5.12.1 Custom colors . . . . . . . . . . . . . . . . . . . . . . . . . 595.13 Custom commands . . . . . . . . . . . . . . . . . . . . . . . . . . 595.14 Special symbols . . . . . . . . . . . . . . . . . . . . . . . . . . . . 60

6 CONTENTS

Chapter 1
Introduction
GAViewer is a multi-purpose program for performing geometric algebra com-putations and visualizing geometric algebra. Some possible uses are:
• Visualizing geometric algebra output from other programs.
• Interactively performing GA computations and visualizing the outcome.
• Presenting lectures, slideshows, doing tutorials, demonstrations, with(interactive) geometric algebra animations.
• Rendering (hi-res) images of GA objects for use in papers.
• Debugging other programs that use geometric algebra.
We do not consider GAViewer appropriate for implementing ’serious’ applica-tions. The internal (interpreted) programming language is too slow and limitedfor such purposes.
GAViewer has outgrown its original purpose. We initially created GAVieweras a small program for visualizing GABLE/Matlab output because we weren’tsatisfied with the Matlab graphics. Then we wanted to have a typesetting sys-tem for labels and support for slideshows. After some time the desire rose toadd a console for interactive computations inside the viewer. After a consolewas added, we wanted to have functions and batches. Then dynamic state-ments were added. The latest additions include animations based an dynamicstatements and scalar controls.
In the following chapters, the various features of GAViewer are describedin the following order:
• The user interface.
• Visualizing geometric algebra output from other programs using .geofiles.
• The programming language.
• Typesetting labels.
• Using .geo files for slideshows and presentations.
7

8 CHAPTER 1. INTRODUCTION

Chapter 2
The user interface
When you start GAViewer, it should look something like figure 2.1. At the topof the window, there is a standard menu bar, desribed in section 2.5. The largestpart of window is occupied the view window (section 2.1). At the bottom, thereis the console (section 2.2). The right part of the window is split into the objectcontrols (section 2.3) and the scalar controls (section 2.4).
Finally, at the very bottom of the window there is the status bar, and thepause button, which is useful during presentations.
2.1 The view window
In the view window, all currently visible objects are drawn. You can rotateand translate your viewpoint, select objects and translate most types of ob-jects. All this is done using certain combinations of mouse movements, mouseclicks/drags and the ctrl button, as explained below.
First, let’s create some objects such that the view window isn’t empty. Onthe console, type
>> a = no, b = green(e1), c = e2 ˆ e3
This draws a flat shaded red point a, a green vector b and a blue bivector (disc)c.
2.1.1 Viewpoint rotation
To rotate the your viewpoint, hold the left mouse button down while the mouseis inside the viewpoint, and move the mouse. Let’s call this left mouse dragfor short. The view window has a so-called spaceball interface. This means thatif you left mouse drag in the center of the view window, the viewpoint willrotate about an axis in the screen plane, and if you left mouse drag outsidethe center, the viewpoint will rotate about the axis perpendicular to the screenplane.
2.1.2 Viewpoint translation
Viewpoint translation is a lot simpler than rotation. Middle mouse drag willtranslate your viewpoint parallel to the screen plane, right mouse drag will
9

10 CHAPTER 2. THE USER INTERFACE
menu Bar
view window
console scalar controls
objectcontrols
status bar pause button
Figure 2.1: GAViewer user interface.
translate perpendicular to the screen plane.
2.1.3 Object selection
Hold down the ctrl button and left mouse click on one of the objects in theview window. This selects the object and shows information and controls inthe object controls window on the right.
If an object is hidden behind another object, you can still select it by cyclingthrough the objects. For instance, ctrl left mouse click the red point a in thecenter of the disc c. This will select a. Now don’t move the mouse, and ctrl leftmouse click again at exactly the same location. This will select c or b. ctrl leftmouse click again to continue cycling until you have selected the object youwant.
2.1.4 Object selection
Sometimes, you may want to select an object and also have it’s name on theconsole, to use it in some calculation. This can be achieved by ctrl middlemouse clicking the object.
2.1.5 Object translation / modification
Many objects allow some kind of translation / modification to be performedon them by ctrl right mouse dragging. For example, the red point a can betranslated, as can the tip of the green vector b. The blue bivector c can not betranslated, but you can modify its size by ctrl right mouse dragging.
2.2. THE CONSOLE 11
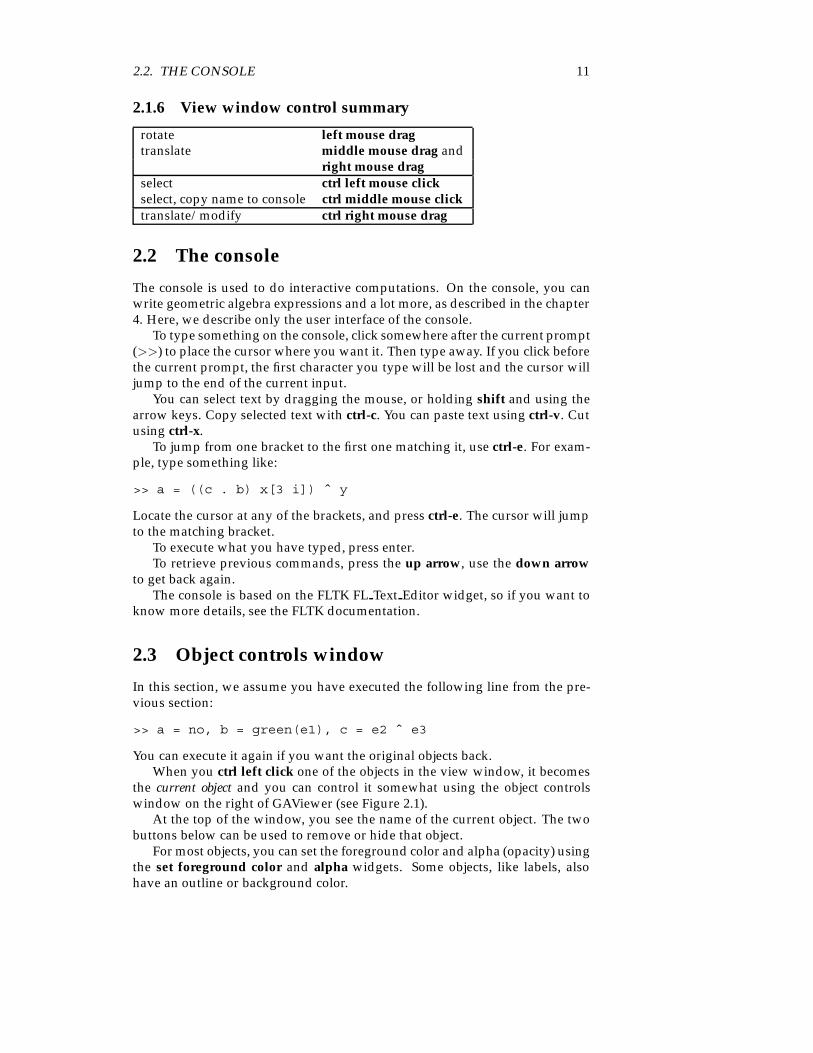
2.1.6 View window control summary
rotate left mouse dragtranslate middle mouse drag and
right mouse dragselect ctrl left mouse clickselect, copy name to console ctrl middle mouse clicktranslate/modify ctrl right mouse drag
2.2 The console
The console is used to do interactive computations. On the console, you canwrite geometric algebra expressions and a lot more, as described in the chapter4. Here, we describe only the user interface of the console.
To type something on the console, click somewhere after the current prompt(>>) to place the cursor where you want it. Then type away. If you click beforethe current prompt, the first character you type will be lost and the cursor willjump to the end of the current input.
You can select text by dragging the mouse, or holding shift and using thearrow keys. Copy selected text with ctrl-c. You can paste text using ctrl-v. Cutusing ctrl-x.
To jump from one bracket to the first one matching it, use ctrl-e. For exam-ple, type something like:
>> a = ((c . b) x[3 i]) ˆ y
Locate the cursor at any of the brackets, and press ctrl-e. The cursor will jumpto the matching bracket.
To execute what you have typed, press enter.To retrieve previous commands, press the up arrow, use the down arrow
to get back again.The console is based on the FLTK FL Text Editor widget, so if you want to
know more details, see the FLTK documentation.
2.3 Object controls window
In this section, we assume you have executed the following line from the pre-vious section:
>> a = no, b = green(e1), c = e2 ˆ e3
You can execute it again if you want the original objects back.When you ctrl left click one of the objects in the view window, it becomes
the current object and you can control it somewhat using the object controlswindow on the right of GAViewer (see Figure 2.1).
At the top of the window, you see the name of the current object. The twobuttons below can be used to remove or hide that object.
For most objects, you can set the foreground color and alpha (opacity) usingthe set foreground color and alpha widgets. Some objects, like labels, alsohave an outline or background color.

12 CHAPTER 2. THE USER INTERFACE
The checkboxes in the middle of the window can be used to make somevisual distictions between objects. E.g., you could stipple imaginary objects,or turn off the shading to indicate flatness.
Certain objects can be drawn in multiple ways. For instance, select the bluebivector c. It has a draw method pull down menu from which you can choosevarious ways of drawing a bivector.
At the very bottom of the object controls window is a text field that shows:
• The interpretation of the object.
• Some numerical properties that are used to draw the object.
• The coordinates of the object (with limited precision).
When the object controls window is hidden (menu View→Controls), you canstill see a ’condensed’ version of this information in the status bar.
2.4 Scalar controls window
You can create a scalar control on the console like this:
>> ctrl_range(a = 2.0, 0.5, 10.0)
It will appear in the lower right corner of GAViewer.Scalar controls are explained in 4.9.5. For the scalar controls window to be
visible, the console or the object controls window must be visible.
2.5 The menu bar
The menu bar has the following structure:
• File
– Open: allows you to open any type of file.
– Open→∗ Open geo file: opens a .geo file∗ Open geo playlist: opens a .gpl file∗ Open g file: opens a .g file
– Load .g directory: allows you read an entire directory full of .g filesin one run. Will also read subdirectories.
– Save state: save the current state of the GAViewer into a .geo file.
– Replay: replays the current .geo file.
– Next file in playlist: switches to the next .geo file in the currentplaylist.
– Previous file in playlist: switches to the previous .geo file in thecurrent playlist.
– Exit: terminates GAViewer.
• View

2.5. THE MENU BAR 13
– Select object: pops up a dialog that allows you to select any object.
– Hide: allows interaction with hidden objects.
∗ Unhide all: shows all hidden objects.∗ Select hidden object: pops up a dialog that allows you to select
a hidden object.∗ Show hidden object: pops up a dialog that allows to toggle the
hide/show state of hidden objects.
– Canvas: selects the color of the canvas (white, (light) grey or black).
– Console font size: selects the font size used on the console.
– Controls: toggles whether the object controls window is visible.
– Scalar Controls: toggles whether the scalar controls window is vis-ible.
– Console: toggles whether the console is visible.
– Labels always on top: when on, labels will always be drawn on topof other objects.
– Fullscreen: toggles fullscreen/windowed user interface. In fullscreenmode, only the view window will be visible.
• Dynamic: contains dynamic statement and animation related items.
– View Dynamic statements: pops up a dialog where you can view/modifythe current dynamic statements (see section 4.10).
– Start / resume animation: starts the atime variable (see section 4.10.2).
– Pause animation: pauses the atime variable.
– Stop animation: stops the atime variable.
– Playback speed: controls how fast animations play.
• Utils
– Search for next bookmark: goes to the next bookmark in the current.geo file, if any.
– Output current camera orientation (bivector): prints the currentcamera (viewpoint) orientation (camori) to the console, in bivectorform.
– Output current camera orientation (rotor): same as above, but inrotor form.
– Output current camera translation: prints camera the translation(campos) to the console.
– Screenshot: pops up a dialog that allows you to renders a screen-shot of the view window in arbitrary resolution. The file is stored inthe .png file format.
• Help
– About: displays some info about GAViewer.

14 CHAPTER 2. THE USER INTERFACE

Chapter 3
.geo and .gpl files
.geo files are one form of input that GAViewer can handle. The others – whichare more interesting to casual users – are the console and .g files (see the nextchapter). .geo files are harder to write by hand than .g file, but can be veryuseful for presentations and displaying output from other programs. The .geofile format is also used to store the state of the GAViewer (menu File→Savestate).
The .geo file format can do some things that the .g ’programming language’cannot and vice versa. This has grown historically. If we were to redesignGAViewer we would choose one unified, richer, programming language ableto do everything.
Every line in a .geo file has the following format:
keyword arguments
The keyword can be something like fgcolor, e3ga or delete. The argumentsvary per keyword. You can not split keyword and arguments over multipleline. Everything following a ’#’ sign is considered comment (unless the #’ issomewhere inside a quoted string):
#this is commentlabel label_1 [1.0*e1+1.0*e2] "a quoted string with a # inside"
We now describe every keyword and its arguments. At the end of thislist there is one entry play which is valid only for .gpl files. These are ’geoplaylists’ and can be used to play multiple .geo in a sequence. This is useful forpresentations.
3.1 title
Sets the title bar of the viewer window. Usage example:
title "this is my demo"
Sets the title bar of the window to ’GAViewer: this is my demo’
15
16 CHAPTER 3. .GEO AND .GPL FILES
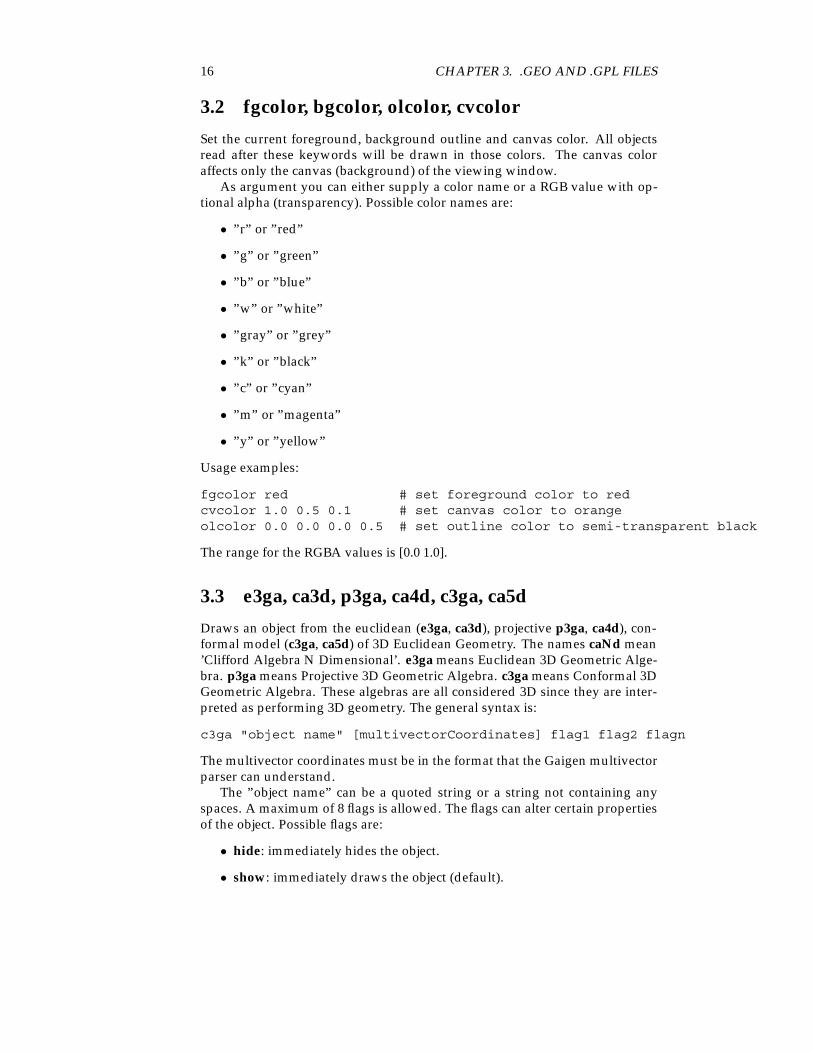
3.2 fgcolor, bgcolor, olcolor, cvcolor
Set the current foreground, background outline and canvas color. All objectsread after these keywords will be drawn in those colors. The canvas coloraffects only the canvas (background) of the viewing window.
As argument you can either supply a color name or a RGB value with op-tional alpha (transparency). Possible color names are:
• ”r” or ”red”
• ”g” or ”green”
• ”b” or ”blue”
• ”w” or ”white”
• ”gray” or ”grey”
• ”k” or ”black”
• ”c” or ”cyan”
• ”m” or ”magenta”
• ”y” or ”yellow”
Usage examples:
fgcolor red # set foreground color to redcvcolor 1.0 0.5 0.1 # set canvas color to orangeolcolor 0.0 0.0 0.0 0.5 # set outline color to semi-transparent black
The range for the RGBA values is [0.0 1.0].
3.3 e3ga, ca3d, p3ga, ca4d, c3ga, ca5d
Draws an object from the euclidean (e3ga, ca3d), projective p3ga, ca4d), con-formal model (c3ga, ca5d) of 3D Euclidean Geometry. The names caNd mean’Clifford Algebra N Dimensional’. e3ga means Euclidean 3D Geometric Alge-bra. p3ga means Projective 3D Geometric Algebra. c3ga means Conformal 3DGeometric Algebra. These algebras are all considered 3D since they are inter-preted as performing 3D geometry. The general syntax is:
c3ga "object name" [multivectorCoordinates] flag1 flag2 flagn
The multivector coordinates must be in the format that the Gaigen multivectorparser can understand.
The ”object name” can be a quoted string or a string not containing anyspaces. A maximum of 8 flags is allowed. The flags can alter certain propertiesof the object. Possible flags are:
• hide: immediately hides the object.
• show: immediately draws the object (default).

3.4. LABEL 17
• stipple: draws the object stippled.
• orientation: draws something related to the orientation of the object, ifpossible.
• wireframe: draws the object in wireframe, if possible.
• magnitude: draws the magnitude (called weight in the GAViewer UI) ofthe object, if possible.
• shade: shades the object, if possible.
• versor: force versor interpretation of the multivector (e.g. to interpret ablade like a versor).
• blade: force blade interpretation of the multivector (e.g. to interpret ’0’as a blade).
• grade0 ... grade8: force gradeX interpretation of multivector (e.g. to in-terpret ’0’ as a vector).
• dm1 ... dm7: use draw method 1 to 7, if supported by the object. Someobject can be drawn in multiple ways. The default draw method is ’1’.
Usage examples:
c3ga "the arbitrary origin" [no]e3ga stippled_vector [e1+e2+e3] stipplee3ga z [4.0*e3ˆe1] magnitude orientation dm2
3.4 label
Adds a label to the scene. The syntax is:
label "name" "point" "text" flag1 flag2 ... flagn
Draws a label (in current colors and font siz, and other typesetting parameters)at position ’point’. ’point’ can be any previously specified multivector objectwhich has a point interpretation, or a 3D multivector coordinates like [1.0*e1 +2.0*e3].
The flags can be some of the following:
• 2d: label coordinates are in 2D window coordinates.
• 3d: label coordinates are in 3D world coordinates (default).
• cx: x-axis origin is in center of window (only in combination with 2D).
• cy: y-axis origin is in center of window (only in combination with 2D).
• px: positive x axis is towards the right (only in combination with 2D).
• nx: positive x axis is towards the left (only in combination with 2D).
• py: positive y axis is towards the bottom (only in combination with 2D).

18 CHAPTER 3. .GEO AND .GPL FILES
• ny: positive y axis is towards the top (only in combination with 2D).
• acx: the label is x-aligned in the center of the window (overrides all othercommands related to the ’X’-axis, only in combination with 2D).
• dynamic: the position of the label will follow the multivector object ’point’.
• image: the label text is actually a filename of a .png image that will bedisplayed inside the label.
• fullscreen: scales the images such that it fill the viewer/screen (only incombination with image) (image width/height proportion is not fixed).
Usage examples:
label simple [1.0*e1] "a simple label"label attached_to_z z "this label follows ’z’" dynamiclabel fullscreen_image [0] "c:\images\dog.png" 2d image fullscreen px py
3.5 fontsize
Sets the size of the font for the labels in pixels. Usage example:
fontsize 30.0
3.6 tsmode
Sets the initial parsing mode of the typesetting system for labels. See chapter5 for more details on typesetting. The mode can be any of: text, equation,verbatim, uppercase or lowercase. In fact, only the first character of the stringis used to determine the mode. Verbatim mode bypasses the whole typesettingsystem and displays labels using the regular ASCII characters directly.
Usage example:
tsmode equation
3.7 tsfont
Sets the initial font of the typesetting system for labels See chapter 5 for moredetails on typesetting. The font can be any of: regular, bold, italic, greek,uppercase or lowercase. In fact, only the first character of the string is used todetermine the font.
Usage example:
tsfont italic
3.8 tsreset
Resets the typesetting system to its initial mode. See chapter 5 for more detailson typesetting.
Usage example:
tsreset
3.9. TSINTERPRET 19
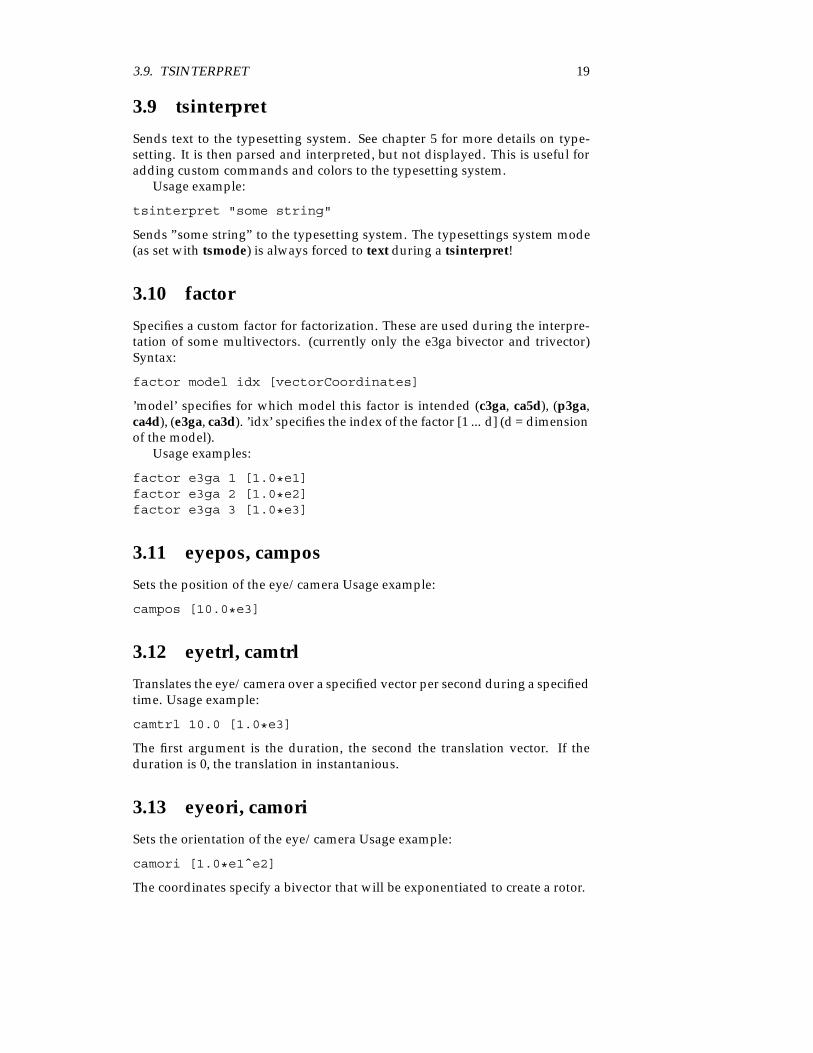
3.9 tsinterpret
Sends text to the typesetting system. See chapter 5 for more details on type-setting. It is then parsed and interpreted, but not displayed. This is useful foradding custom commands and colors to the typesetting system.
Usage example:
tsinterpret "some string"
Sends ”some string” to the typesetting system. The typesettings system mode(as set with tsmode) is always forced to text during a tsinterpret!
3.10 factor
Specifies a custom factor for factorization. These are used during the interpre-tation of some multivectors. (currently only the e3ga bivector and trivector)Syntax:
factor model idx [vectorCoordinates]
’model’ specifies for which model this factor is intended (c3ga, ca5d), (p3ga,ca4d), (e3ga, ca3d). ’idx’ specifies the index of the factor [1 ... d] (d = dimensionof the model).
Usage examples:
factor e3ga 1 [1.0*e1]factor e3ga 2 [1.0*e2]factor e3ga 3 [1.0*e3]
3.11 eyepos, campos
Sets the position of the eye/camera Usage example:
campos [10.0*e3]
3.12 eyetrl, camtrl
Translates the eye/camera over a specified vector per second during a specifiedtime. Usage example:
camtrl 10.0 [1.0*e3]
The first argument is the duration, the second the translation vector. If theduration is 0, the translation in instantanious.
3.13 eyeori, camori
Sets the orientation of the eye/camera Usage example:
camori [1.0*e1ˆe2]
The coordinates specify a bivector that will be exponentiated to create a rotor.

20 CHAPTER 3. .GEO AND .GPL FILES
3.14 eyerot, camrot
Rotates the eye/camera over a specified plane/angle per second during a spec-ified time. Syntax: Usage example:
camrot 10.0 [1.0*e1ˆe2]
The first argument is the duration, the second the rotation bivector. If the du-ration is 0, the rotation in instantanious.
3.15 hide, show
Hides or shows a specified object (can be a label, algebra object, polygon, etc)or user interface element.
Usage examples:
show "name of object"hide "name of object"
The user interface elements that can affected by hide and show are:
• controls: object controls window.
• scalar controls: scalar controls window.
• console: the console.
3.16 remove
Removes the specified object. Usage example:
remove x
3.17 fade, fade and remove, fade and hide, show and fade
The keywords allow you to fade in and out objects. Before the fade, the objectcan be shown (show and fade). After the fade is over, the object can be hidden(fade and hide) or removed (fade and remove). The syntax is:
fade "object name" fade_duration fade_target fade_start
The first argument is the name of the object. The second argument is the dura-tion of the fade in seconds. The third argument is the target alpha of the fade.The fourth, optional argument is the alpha at the start of the fade. Using fadewill not actually modify the alpha of the any of the colors of the object, butrather multiplies those alpha values before they are sent to OpenGL.
Usage examples:
fade x 2.0 1.0fade_and_remove y 1.0 0.0 1.0

3.18. SLEEP 21
3.18 sleep
Pauses the reading of the input file for a specified number of seconds. Userinterface will be fully functional during this sleep.
Usage examples:
sleep 10.0
Sleeps for 10.0 seconds. The maximum resolution for the sleep time is about1/30th of a second.
3.19 wait
Pauses the reading of the input file until the waiting button is pressed. Usageexample:
wait
3.20 exit
Terminates the GAViewer immediately. Usage example:
exit
3.21 clearconsole
Clears the console and removes scalar controls. Usage example:
clearconsole
3.22 console
console allows you to execute a command in a .geo as if it was typed on theconsole. Usage example:
console a = e1 ˆ e2
3.23 resize
Changes the size and optionally the position of the GAViewer window. Syntax:
resize w hresize x y w h
The first format (with 2 arguments) changes the width and height of the win-dow to w and h. The second format (with 4 arguments) also sets the positionto x and y.

22 CHAPTER 3. .GEO AND .GPL FILES
3.24 viewwindowsize
Changes the size of the view window. This will resize the main window andkeep the height of the console and the width of the controls constant. Usageexample:
viewwindowsize 1024 768
3.25 consoleheight
Changes the height of the console. This will resize the console and the viewwindow to achieve the desired height. Usage example:
consoleheight 10 linesconsoleheight 200 pixels
You must specify eiter pixels or lines.
3.26 consolefontsize
Changes the size (in pixels) of the font used on the console. Usage example:
consolefontsize 14
3.27 fullscreen
Sets the viewer to fullscreen mode or windowed mode. Only the view windowis visible in full screen mode. Usage examples:
fullscreenfullscreen onfullscreen off
The first two lines turn fullscreen mode on, the second line turns it off. Infullscreen mode, a small red W may be visible in the lower right corner whenGAViewer would normally flash the waiting button.
3.28 bookmark
Indicates a bookmark in the file. When the user selects menu bar item utils→searchfor next bookmark, input will be parsed quickly until such a bookmark isfound. This is useful for skipping through a (slow) demo quickly. Usage ex-ample:
bookmark "optional name that is not used yet"

3.29. OPEN, SWITCHTO, IMPORT 23
3.29 open, switchto, import
These keywords all open a .geo file. GAViewer maintains an internal stack ofopen files.
• open opens a new file at the top level. All current files are removed fromthe stack and the new file becomes the only open file.
• switchto closes the top-level file and replaces it with the new file.
• import pushes the new file on top of the file stack and starts reading it
You can give argument to these commands which will be available as $1, $2,etc, in the files. Usage examples:
switchto file1.geoimport conformal_paraboload.geo paraboloidopen matlab.geo
The second example give the argument ’paraboloid’ to conformal paraboload.geo.Any occurence of $1 in conformal paraboload.geo will be replaced with ’paraboloid’.
3.30 clip
Sets the distance of the clipping planes to the origin. Currently not functional.Usage examples:
clip 10.0
3.31 delete
Specifies whether to delete this .geo file or not when a new file is opened orGAViewer is terminated. This used to be useful when GAViewer was onlyused to visualize Matlab output, where .geo files were usually just a temporarycommunication channel. Syntax:
delete [yes|no|ask] "question to ask"
If the first argument is ’ask’ the user is asked whether to delete or not. Thequestion to ask can be supplied as the optional second argument. If you use’by the name of the file. Usage examples:
delete yesdelete ask "delete %s?"
3.32 polygon, simplex
Creates a polygon or simplex object. Syntax:
polygon "polygon name" nb "p 1" "p 2" "p n" flag1 flag2 flagnsimplex "simplex name" nb "p 1" "p 2" "p n" flag1 flag2 flagn

24 CHAPTER 3. .GEO AND .GPL FILES
The first argument is the name of the object. The second the number of vertices,followed by a name of a ’point’ for every vertex. After that, a number of flagscan be added. The maximum number of vertices is 3 for a simplex. Polygonsmust be convex, or the resulting graphics will be unpredicatble. The ”p 1” ...”p n” are names of objects that have some kind of point interpretation. E.g.,they can be vectors in the 3D model, or points in the conformal model.
Possible flags:
• dynamic: the vertices of the polygon will lookup their position from theoriginal point objects everytime the polygon gets redrawn.
• outline: draws an outline around the polygon.
• dm1 ... dm7: use draw method 1 to 7 (dm1: filled, dm2: line strip, dm3:line loop, dm4: 1D simplex is drawn as true vector).
Usage example:
polygon "P1 -> Q2" 2 P1 Q2 dm2
3.33 mesh
This keyword allows for the creation of a mesh object. A mesh consists of anumber of vertices (with optional surface normals) and polygons. The vertices,surface normals and polygons are specified after the mesh. The syntax of meshis:
mesh "mesh name" normal_flag
’normal flag’ can be
• compute normals flat: compute the surface normals such that the objectwill have a flat shaded appearance.
• compute normals gouraud: compute the surface normals such that theobject will have a smooth (Gouraud) shaded appearance.
• specify normals: specify normals in the file.
The mesh must be followed by its vertices, normals and faces, described below.Usage example (a full example is given after the meshvertex, meshnormal
and meshface have been described:
mesh teapot compute_normals_gouraud
3.33.1 meshvertex
The syntax of meshvertex is:
meshvertex "mesh name" index point
The mesh name refers to the mesh name given in an earlier mesh keyword.index is the positive index of the vertex in the list of vertices. point can be thename of an existing object with a point interpretation, or the 3D coordinates ofthe point between square brackets. Usage example:
meshvertex teapot 0 [1.0e1 + 1.0*e3]

3.34. PLAY (.GPL FILES ONLY) 25
3.33.2 meshnormal
meshnormal allows you to specify the surface normal at a vertex. The syntaxof meshnormal is:
meshnormal "mesh name" index vector
The mesh name refers to the mesh name given earlier in a mesh keyword.index is the positive index of the vertex in the list of vertices. point can be thename of an existing object with a vector interpretation, or the 3D coordinatesof the vector (not a bivector.... :) between square brackets. Usage example:
meshnormal teapot 0 [1.0e1 + 1.0*e3]
3.33.3 meshface
meshface specifies a face of a mesh. It can have an arbitrary (current max 16)number of vertices. Vertices should be listed in counter clockwise order, whenviewed from the front side. The syntax is:
meshface "mesh name" vertex_idx1 vertex_idx2 ... vertex_idxN
Usage example:
meshface teapot 295 327 328
3.33.4 Full usage example for mesh
This example should draw a cube (you may have to zoom out to see it, if theseare the only commands in a .geo file. Usage example:
mesh cube compute_normals_flatmeshvertex cube 0 [1.0*e1+-1.0*e2+1.0*e3]meshvertex cube 1 [1.0*e1+-1.0*e2+-1.0*e3]meshvertex cube 2 [-1.0*e1+-1.0*e2+-1.0*e3]meshvertex cube 3 [-1.0*e1+-1.0*e2+1.0*e3]meshvertex cube 4 [1.0*e1+1.0*e2+1.0*e3]meshvertex cube 5 [1.0*e1+1.0*e2+-1.0*e3]meshvertex cube 6 [-1.0*e1+1.0*e2+-1.0*e3]meshvertex cube 7 [-1.0*e1+1.0*e2+1.0*e3]meshface cube 3 2 1 0meshface cube 0 1 5 4meshface cube 0 4 7 3meshface cube 5 1 2 6meshface cube 6 2 3 7meshface cube 4 5 6 7
3.34 play (.gpl files only)
.gpl files are very special .geo files that can contain only one type of keyword:play. The syntax of play is:

26 CHAPTER 3. .GEO AND .GPL FILES
play filename.geo arg1 arg2 ... argN
The arguments are optional and will replace $1, $2 ... $N. A playlist for a pre-sentation could look like this:
play ppt/ppt.geo ppt_01_title.png
play ppt/ppt.geo ppt_02_overview_1.pngplay ppt/ppt.geo ppt_02_overview_2.pngplay ppt/ppt.geo ppt_02_overview_3.pngplay ppt/ppt.geo ppt_02_overview_4.png
#block 1play ppt/ppt.geo ppt_03_block1.png
play demos/crossproduct.geoplay demos/outerproduct.geoplay demos/trivector.geoplay demos/basiselements.geo...

Chapter 4
The Programming Languageand the Console
GAViewer contains a small internal programming language. It is basically a C-like language, with features like functions and conditional control structures,global and local scopes. It has a very limited set of types (3D Euclidean mul-tivectors, 4D homogeneous multivectors, 5D conformal multivectors). Thesetypes can be automatically coerced. Functions can be overloaded. There is lim-ited support for arrays. Dynamic statements allow for quite amazing flexibility.Dynamic statements depend on the variables used to evaluate them. Every timesuch a variable changes, the dynamic statement is reevaluated.
The programming language can be used on the console, and in .g files.These files typically contain functions and batches.
A large number of built in functions are provided to handle all kinds oftypical GA operations.
4.1 Comma, semicolon and space
As in Matlab, the symbol used to terminate a statement determines if the resultis shown on the console/view window. Typing
>> a = e1,
will pop up a vector in the view window and show you the coordinates of a onthe console. On the other hand, typing
>> a = e1;
hides the vector and does not print its coordinates. The multivector a still ex-ists, but it is simply not shown. You can use the menu view→hide→showhidden object to make it appear again. Using no symbol to end a statement isequivalent to a comma:
>> a = e1
This will again pop up a vector in the view window and show you the coordi-nates of a on the console. In .g files, you must always terminate all statementswith either a semicolon or a comma.
27

28 CHAPTER 4. THE PROGRAMMING LANGUAGE AND THE CONSOLE
4.2 ans
When you type e1 on the console:
>> e1ans = 1.00*e1
you’ll see that the value of the statement e1 gets assigned to ans.When you enter a statement on the console that’s (implicitly) terminated
with a comma, every variable that was assigned a value is displayed on theconsole and in the view window. If no assignments were made, the result ofthe statement is assigned to the ans variable.
When you enter a statement that is terminated by a semicolon, ans is deleted.
4.3 Operators, assignment, precendence
A number of operators is available for commonly used functions. Unary prefixoperators:
symbol function∼ reverse− negate! inverse
The unary operators have the highest precedence, so they are executed be-fore any other operations. Because each of these operators will cancel itself,GAViewer will determine if it is necessary to execute it. So if you can writeminus minus not not tilde tilde x not a single operator function will be to xbecause all operators cancel each other.
The following binary operators are available: (in order of precedence):symbol function precedence level∧ outer product 9| join 8& meet 8. inner product 7’space’ geometric product 6∗ geometric product 6/ inverse geometric product 6+ addition 5− subtraction 5< less 4> greater 4<= less or equal 4>= greater or equal 4== equal 3! = not equal 3&& boolean and 2|| boolean or 1= assignment 0
All operators are left associative, except assignment which is right associa-tive (but it isn’t really an operator...) The geometric product can be written aseither a space or a ∗, so the following two lines are equivalent:

4.4. VARIABLES, TYPES AND CASTING 29
>> x = a b;>> x = a * b;
All these operators are internally translated to function calls by GAViewer(sections 4.9.1 and 4.9.3). The . operator is translated to hip (Hestenes innerproduct) by default, but it can be set by the inner product() function. Thedefault is hip, but mhip, rcont and lcont are also possibilities 1. This exampleshows the effect of changing the inner product from Hestenes inner product toleft contraction:
>> e1 ˆ e2 . e1 // here the default Hestenes inner productans = -1.00*e2>> inner_product(lcont)>> e1 ˆ e2 . e1 // now the left contraction is usedans = 0>>
4.4 Variables, types and casting
Variables like x, a and b in the example above always have a type. This typecan be e3ga (Euclidean), p3ga (projective, homogeneous) or c3ga (conformal).Variables usually ’inherit’ their type from the variables used to compute them.So if in th example above a and b are both of type p3ga, then the result x willalso be of type p3ga.
The type of a variable determines how a variable gets interpreted and drawn.GAViewer can analyze blades and versors from the three models, and drawsthem as such. Multivectors that can not be analyze are cam not be drawn.
The type of a variable can also be explicit set or cast:
>> a = (c3ga)e3a = e3>> b = (e3ga)nib = 0
As you can see in the example b = (c3ga)ni, no interpretation is done dur-ing casting. Since there is no ni basis vector in the e3ga model, it is simplydiscarded. As an other example, a ’free vector’ in the conformal model will notturn into a regular vector in the Euclidean model by simply casting it.
If a variable name does not exist yet, it is assumed to be 0:
>> a = longVariableNameThatDoesNotExistYeta = 0
This can be quite confusing if you mistype the name of a function:
>> a = duel(x)a = 0
Here, a typo was made: duel instead of dual. GAViewer will assume duel isa variable instead of the function dual. It computes the geometric product ofduel (which is assumed to be 0) and (x), so the result will be 0 as well.
1Actually you can use any 2-argument function

30 CHAPTER 4. THE PROGRAMMING LANGUAGE AND THE CONSOLE
If some identifier, like alpha is currently a function, you can force it to be-come a variable by using the variable statement. The other way around can bedone by declaring the function again. Consider:
>> a = alpha(e1, 0.5)a = 1.00*e1>> variable alpha; // declare alpha -> variable>> alpha = 1alpha = 1.00>>>> function alpha(x, y); // declare alpha -> function>> alpha = 1 // this is no longer allowedline 1:7: expecting (, found ’= ’ans = 1.00>> a = alpha(e1, 0.5)a = 1.00*e1
4.5 Builtin Constants
The following builtin constants are available:
• All scalar numbers are constants. Scalar numbers can have the followingforms: 1, 1.2, 1.2e3, 1.2e-3 They are of type e3ga.
• e1, e2, e3: These are the three Euclidean basis vectors, type e3ga.
• e0: the origin in the projective model, type p3ga.
• ni and no: conformal infinity and origin, type c3ga.
• einf: synonym for conformal infinity, type c3ga.
• pi: 3.1415926535897932384626433832795, type e3ga.
• e : 2.7182818284590452353602874713527, type e3ga 2.
By default, constants always have the type of the smallest model that con-tains them. So scalars and the Euclidean basis vectors are all of type e3gaby default. But this behaviour can be changed by calling the default model()function. For example:
>> default_model(c3ga);
After this call to default model(), all constants (except e0) will be of type c3ga.Valid arguments to default model() are e3ga, p3ga, c3ga, c5ga, i2ga.
If you want to go back to the normal behaviour, just call default model()without any arguments:
>> default_model();
Why does it matter what the default type/model of constants is? It makesa difference for certain functions, such as dualization with respect to the wholespace. It also makes a difference in interpretation. For example, e3 is drawn asa vector in the e3ga model, but drawn as a (dual) plane in the c3ga model.
2’e ’ is called ’e ’ and not e because otherwise you could not use e as a variable name, which isquite common.
4.6. ADDING YOUR OWN CONSTANTS 31
4.5.1 Renaming builtin constants
You can rename the builtin constants using the function rename builtin const().This also effects the textual output of multivector coordinates, as shown in thissmall example, which renames the conformal origin (no by default) and infin-ity (ni by default) to e0 and einf, respectively.
>> rename_builtin_const(e0, e4); // proj. origin e0 -> e4>> rename_builtin_const(no, e0); // conf. origin no -> e0>> rename_builtin_const(ni, einf); // conf. infinity ni -> einf>> a = e0 ˆ einfa = 1.00*e0ˆeinf
You have to be careful to avoid nameclashes. In the example, the projectiveorigin e0 first had to be renamed to e4, so that no could be renamed to e0.
4.6 Adding your own constants
You can add your own user constants using the add const() and remove themusing remove const(). This is useful, because ordinary variables are removedwhen you do a clf(), constants are not. Also, user constants are subject tothe casting/default model rules described above. Here is an example of us-ing add const() and remove const():
>> add_const(I3 = e1 ˆ e2 ˆ e3);>> I3ans = 1.00*e1ˆe2ˆe3>> remove_const(I3);
4.7 ’Arrays’
Array indices can be used to generate new variable identifiers. GAViewer doesnot have any real support for arrays. For example, you can not pass arrays tofunctions or return them from functions. The C-like syntax for accessing anarray element in GAViewer is A[idx1][idx2] ... [idxN].
4.8 Calling functions
A function is called as follows:
>> returnValue = func_name(arg1_name, ... , argn_name);
For example, if you want to project blade ’a’ onto blade ’b’ and store the resultin ’x’, you can call project like this:
>> x = project(a, b);
GAViewer will always search for the best matching function to do the job.Best matching means:
• The function must have the right name and right number arguments.

32 CHAPTER 4. THE PROGRAMMING LANGUAGE AND THE CONSOLE
• Preferably, all arguments have the right type (e3ga, p3ga, c3ga). Thiswould be a perfect match.
• If no perfect match can be found, the next best match is searched: allfunctions with the right name and right number arguments are collected.The best matching function is the one for which the ’coercing distance’ issmallest. This distance is defined as follows: coercing to a higher dimen-sional model is preferred over coercing to a lower dimensional model,since no information is lost.
4.9 Built-in functions
A description of these functions is also accessible on the GAViewer consolethrough
>> help();
and
>> help(topic);
4.9.1 Products
While many products are accessible through operators, they can also be explic-itly called through the following functions:
function(arguments) return valuegp(a, b) geometric product of a and bigp(a, b) inverse geometric product of a and bop(a, b) outer product of a and b (a / b)hip(a, b) Hestenes inner product of a and bmhip(a, b) modified Hestenes inner product of a and blcont(a, b) left contraction of a and brcont(a, b) right contraction of a and bscp(a, b) scalar product of a and bmeet(a, b) meet of a and bjoin(a, b) join of a and b
Since version 0.41, two products are available in a Euclidean Metric flavouralso, which can be useful for low level work (for example, the meet and joinuse these products internally):
function(arguments) return valuegpem(a, b) geometric product (Euclidean Metric) of a and blcem(a, b) left contraction (Euclidean Metric) of a and b

4.9. BUILT-IN FUNCTIONS 33
4.9.2 Basic GA functions
The following table list some basic GA functions:function(arguments) return valueadd(a, b) the sum of a and bsub(a, b) the sum of a and -bscalar(a) the scalar part of adual(a) the dual of a with respect to the full spacedual(a, b) the dual of a with respect to breverse(a) the reverse of aclifford conjugate(a) the clifford conjugate of agrade involution(a) the grade involution of ainverse(a) the (versor) inverse of ageneral inverse(a) the inverse of a even if
a is not a versor (returns 0 if inverse does not exist)negate(a) returns the negation of a
To extract a grade part, or to determine the grade of a blade:
• grade(a, b): returns the grade b part of a, e.g., grade(a, 2).
• grade(a): if a is a blade, returns the grade of arg1, returns -1 otherwise.
To determine the parity of a versor :
• versor parity(a): if a is an even versor returns: 0, odd versor: 1; not aversor : -1.
To compute the norm of a multivector, orto normalize a multivector, youcan use of the following functions:
function(arguments) return valuenorm 2(a) the sum of the square of all coordinates of anorm r(a) the grade 1 part of aanorm(a) the square root abs(norm r(a)), multiplied by
the sign of norm r(a)normalize(a) a / abs(norm r(a))
To wrap it up, there are a few handy functions for doing versor products,projection, rejection and factorization of a blade:
function(arguments) return valueversor product(a, b) returns a b inverse(a)vp(a, b) synonym of versor product(a, b)inverse versor product(a, b) returns inverse(a) b aivp(a, b) synonym of inverse versor product(a, b)project(a, b) returns the projection of a onto breject(a, b) returns the rejection of a from bfactor(a, b) returns factor ’b’ of blade a
(b must be an integer in range [1 gradea])
4.9.3 Boolean
A number of functions for doing boolean arithmetic are available. 0.0 is ’false’.Any value that is not ’false’ is considered to be ’true’. The function scalar()

34 CHAPTER 4. THE PROGRAMMING LANGUAGE AND THE CONSOLE
returns the grade 0 part of a multivector.function(arguments) return valueequal(a, b) true if (a - b) equals 0ne(a, b) true if (a - b) does not equal 0less(a, b) true if scalar(a)< scalar(b)greater(a, b) true if scalar(a)> scalar(b)le(a, b) (less or equal) true if scalar(a) ≤ scalar(b)ge(a, b) (greater or equal) true if scalar(a) ≥ scalar(b)and(a, b) true if a is true and b is trueor(a, b) true if a is true or b is truenot(a) true if a is false
Bitwise boolean arithmetic can be done with the functions in the followingtable. Arguments are converted to 32 bit unsigned integers before performingthe bitwise operation.
function(arguments) return valuebit not(a) returns the bitwise not of scalar(a)bit and(a, b) returns the bitwise and of scalar(a) and scalar(b)bit or(a, b) returns the bitwise or of scalar(a) and scalar(b)bit xor(a, b) returns the bitwise xor of scalar(a) and scalar(b)bit shift(a, b) returns bitwise shift left of scalar(a) by scalar(b)
The second argument of bit shift() can be negative for right shift. The onlyreason to include these bitwise boolean functions was to allow user to writethere own autocolor() 4.13 function, where some tests on bitfields need to bedone. The bitwise boolean functions are not of much use for geometric algebra.
4.9.4 Drawing
Various drawing properties of multivectors can be set with the functions de-scribed below. The functions are always used as in the example:
>> a = cyan(e1)a = 1.00*e1>>
This draws the vector a in cyan.Compare this to the following example, which will not work as expected:
>> green(a)ans = 1.00*e1
One might expect green(a) to turn the multivector a green. Bit what actu-ally happens is that the value of ’a’ gets assigned to ans, and then ans getsdrawn. Since ans is equal to a, it may or may not be drawn on top of a. On thenext statement you enter, the value of ans will be overwritten or removed, andyou’ll see that the actual color of a has not changed.
So the functions that modify drawing properties only set certain flags andvalues on the intermediate variables and have no effect unless such intermedi-ate variables are assigned to something.
Drawing functions can be nested like this:

4.9. BUILT-IN FUNCTIONS 35
>> a = cyan(stipple(e1))a = 1.00*e1>>
This draws a stippled vector a in cyan.
Color and alpha
The color and opacity (often called ’alpha’ in computer graphics) of variablescan be set using these functions:
function(arguments) effect:red(a) a turns redgreen(a) a turns greenblue(a) a turns bluewhite(a) a turns whitemagenta(a) a turns magentayellow(a) a turns yellowcyan(a) a turns cyanblack(a) a turns blackgrey(a) a turns greygray(a) a turns graycolor(a, R, G, B) the color of a becomes the RGB value [R, G, B]color(a, R, G, B, A) the color/opacity of a becomes the RGBA value [R, G, B, A]alpha(a, value) the alpha (opacity) of a becomes alpha
Red, green, blue and alpha values should be in the range [0.0 1.0]. A alphaof 0.0 is entirely transparent (the object will be invisible), while a value of 1.0will be entirely opaque. Values outisde the [0.0 1.0] range will be clamped byOpenGL.
Multivectors can be drawn stippled, wireframed, with or without weightor orientation, and some multivector interpretations allow for an outline to bedrawn. All of this can be set with these functions:
function(arguments) effect:stipple(a) draws a stippledno stipple(a) draws a not stippledwireframe(a) draws a in wireframeno wireframe(a) draws a without wireframeoutline(a) outlines ano outline(a) does not outline aweight(a) draws the weight of ano weight(a) does not draw the weight of aori(a) draws the orientation of ano ori(a) does not draw the orientation of a
To force hiding/showing a multivector, use the show() and hide() func-tions, but rememeber to assign!
>> a = e1 // Draws ’a’a = 1.00*e1>> a = hide(a), // Hides ’a’, despite the comma.a = 1.00*e1>> a = show(a); // Shows ’a’, despite the semicolon.a = 1.00*e1

36 CHAPTER 4. THE PROGRAMMING LANGUAGE AND THE CONSOLE
>> hide(a) // Does not hide ’a’.// Instead, assigns the value of ’a’ to ’ans’,// and hides ’ans’.
Some multivector interpretations can be drawn in multiple ways. For in-stance, if you type:
>> line = ori(ni ˆ no ˆ e1)
you’ll see a popup menu labeled ’draw method’ in the controls on the righthand side of tha GAViewer UI. Use it to select various ways to draw the orien-tation of the line. From the console, you can also set the draw method, usingthe dm functions:
>> line = dm2(ori(ni ˆ no ˆ e1))
The index (’2’ in the example) can range from ’1’ to ’7’. If it is out of range forthe specific multivector interpretation, the default is used.
You can retrieve the drawing properties of variables using the followingfunctions:
function(arguments) return value:get color(a) a vector with rgb color of aget alpha(a) a scalar with alpha of aget stipple(a) a boolean scalar with flag stipple of aget wireframe(a) a boolean scalar with flag wireframe of aget outline(a) a boolean scalar with flag outline of aget weight(a) a boolean scalar with flag weight of aget ori(a) a boolean scalar with flag ori of aget hide(a) a boolean scalar with flag hide of a
A label can be drawn at the ’position’ of an object using the label() function.Not every object has a positional aspect to it, in which case the label will bedrawn in the origin. The first argument to label() is the variable that you wantto label. The optional second argument is that text of the label (by default, thename of the variable is used as the label text). Some examples:
>> a = e1a = 1.00*e1>> label(a);>> label(b = 2 a) // this is short for b = 2a, label(b);b = 2.00*e1>> label(c = e2, "this is c")c = 1.00*e2
The following two functions don’t really affect how a variable is drawn, butmore how a variable is interpreted.
• versor(a): forces a versor interpretation of a.
• blade(a): forces blade interpretation of a.
versor() can be useful when a versor coincidentally becomes single-grade. Con-sider:
>> a = versor(e1 ˆ e2)a = 1.00*e1ˆe2

4.9. BUILT-IN FUNCTIONS 37
This draws a rotor, whereas simply
>> a = e1 ˆ e2a = 1.00*e1ˆe2
draws a bivector.blade() is useful when floating point noise on some grade parts becomes so
large that GAViewer mistakes a blade for a versor. Suppose you have a bivectora = e1 ∧ e2 but due to some manipulations, floating point nouse causes thescalar part to be 0.01 instead of 0:
>> a = e1 ˆ e2 + 0.01a = 0.01 + 1.00*e1ˆe2
a gets interpreted and drawn as a rotor in this case. Now, to force a to beinterpreted as a blade, use:
>> a = blade(e1 ˆ e2 + 0.01)a = 0.01 + 1.00*e1ˆe2
4.9.5 Controls
Scalar controls can be created by using the functions described in the list be-low. To get an idea of what scalar controls are useful for, enter the followingcode on the console:
>> ctrl_range(a = 2.0, 0.5, 10.0);>> dynamic{v = a e1,}v = 2.00*e1
Now move the slider that appeared in the lower right window (section 4.10 fora discussion of dynanic).
• ctrl bool(name = value): creates a boolean control with name name, setto value.
• ctrl range(name = value, min value, max value): creates a slider controlwith name name, set to value, limited to min value and max value.
• ctrl range(name = value, min value, max value, step): creates a slidercontrol with name name, set to value, limited to min value and max valuevalues, that can only be changed step at a time.
• ctrl select(name = value, option1 = value1, ..., optionN = valueN): cre-ates a selection menu with name name, set to value. A maximum op 7options can be specified, value must be one of the options
• ctrl remove(name): removes any control with name name
All these functions also have a variant where you can specify a callbackbatch function to be called when the user changes the widget. These functionshave names ending in with callback. An example:

38 CHAPTER 4. THE PROGRAMMING LANGUAGE AND THE CONSOLE
batch myCallback() {switch(choice) {case 1:
x = c3ga_point(e1),break;
case 2:x = c3ga_point(e2),break;
}}
ctrl_select_with_callback(choice=1, choice1 = 1, choice2 = 2, "myCallback");
4.9.6 Goniometric functions, sqrt, abs, log, exp, pow.
All values for goniometric functions in radians. For all functions except expand pow, only the scalar part of the argument is used.
function(arguments) return value:tan(a) obvioussin(a) obviouscos(a) obviousatan(a) obviousasin(a) obviousacos(a) obviousatan2(a) obvioussinh(a) hyperbolic sine of acosh(a) hyperbolic cosine of asinc(a) sin(a)/asqrt(a) square root of aabs(a) absolute value of alog(a) natural logarithm of scalar(a)exp(a) exponentiation of a,
inaccurate and slow series expansionpow(a, b) a multiplied b times with itself
(b must be integer ≥ 0)scalar pow(a, b) a raised to the power of b
4.9.7 Projective model functions
Two functions are available to construct point in the p3ga model.
• p3ga point(c1, c2, c3): returns the p3ga point constructed from the e3gavector [c1 e1 + c2 e2 + c3 e3].
• p3ga point(e3ga a): returns the projective point constructed from thee3ga vector a.
4.9.8 Conformal model functions
The following functions are of use in the c3ga model:

4.9. BUILT-IN FUNCTIONS 39
• c3ga point(c1, c2, c3): returns the conformal point constructed from thee3ga vector [c1 e1 + c2 e2 + c3 e3].
• c3ga point(e3ga a): returns the conformal point constructed from thee3ga vector a.
• c3ga point(p3ga b): returns the conformal point constructed from thep3ga point a.
• translation versor(a): returns a conformal versor that translates over thee3ga vector a.
• tv(a): synonym of translation versor(a).
• translation versor(c1, c2, c3): returns a conformal versor that translatesover vector [c1 e1 + c2 e2 + c3 e3]
• tv(c1, c2, c3): synonym of translation versor(c1, c2, c3).
4.9.9 System functions
A collection of functions that give access some low level aspects of the viewer.
• assign(a, b): assigns the value of b to a, returns b. This is what the =operator evaluates to.
• cprint(”a string”): prints ”a string” to the console.
• print(a): prints coordinates of a to the console, returns 0.
• print(a, prec): prints coordinates of a to the console with precision prec(e.g., prec = ”e”), returns 0.
• cmd(”a command”) executes ”a command” as if it had been read from a.geo file.
• prompt() sets the default console prompt.
• prompt(”prompt text”) turns the console prompt into ”prompt text”.
• select(a) selects a as the current variable / object, as if it had been selectedusing ctrl-left-click.
• remove(a) removes the variable / object a, as if the remove this objecthad been clicked.
• clc() clears the console and removes all control variables.
• clf() removes all variables / objects.
• reset() resets the entire viewer (console, dynamics, variables, user con-stants, etc).

40 CHAPTER 4. THE PROGRAMMING LANGUAGE AND THE CONSOLE
4.9.10 Networking
Since version 0.4, other programs can communicate with GAViewer over a TCPconnection. To enable this, use the command:
>> add_net_port(6860);Server socket setup correctly at port 6860
After this command, GAViewer will listen on TCP port 6860 to clients trying toconnect.
You can try the connection out by using telnet. In a Unix terminal, or on aWindows command prompt use something like
telnet localhost 6860
to connect. GAViewer will immediately send the values of all known variables:
"autocolor" = 1.000000000000000e+000;$"camori" = 1.000000000000000e+000;$"camp" = 1.100000000000000e+001*e3;$
In the telnet application, you can type commands that you would otherwisetype on the GAViewer console, but they must be terminated with a dollar sign.For example:
a = e1 + e2,$
GAViewer will reply:
"a" = 1.000000000000000e+000*e1 + 1.000000000000000e+000*e2,$
because the value of variable a changed. Every time a variable changes value,GAViewer will send such a message to all connected clients.
Here are the commands related to networking
• add net port(port): start listening on TCP port.
• remove net port(port): stop listening on TCP port; disconnect all currentclients.
• net status(): prints out a summary of the network status.
• net close(): shuts down all network connections and ports.
You can start up GAViewer as follows:
gaviewer -net
This enables TCP port 6860 immediately. Optionally you can specify the port,for example
gaviewer -net 5000
This enables TCP port 5000 immediately.Networking is disabled by default, because anyone on the internet can con-
nect to your GAViewer this way (unless you block this using a firewall) andI cannot guarantee that GAViewer cannot be exploited (through buffer over-flows, for example) to give someone access to your computer. However, it isunlikely that someone will go through the effort of finding such an exploit aslong as GAViewer is a niche application.

4.10. DYNAMIC STATEMENTS 41
4.10 Dynamic statements
Dynamic statements are created using the dynamic language construct as shownin the following example:
>> a = e1,a = 1.00*e1>> dynamic{b = a ˆ e2,}b = 1.00*e1ˆe2
Dynamic statements depend on the variables used to evaluate them. In the ex-ample, the statement b = a ∧ e2, depends on the variable a, and b. Every timeone of these variables changes, the dynamic statement is re-evaluated. Becauseconstants like e2 never change, they don’t effect when a dynamic statement isre-evaluated.
If, after entering the example above on the console, you would alter thevalue of a, e.g.:
>> a = e1,a = 2.00*e1
you would see that b gets updated automatically. You can also ctrl-right-draga and b will change as well.
If you would set the value of b by hand, e.g.:
>> b = 0,b = 0
you will notice that b does not change. GAViewer detects that b has beenaltered and reevaluates all dynamic statement involving b.
You can view, edit and remove active dynamic statements by selecting themenu item Dynamic→View dynamic statements.
If you enter multiple dynamic statements that assign values to the samevariables, things can get tricky and confusing. Consider:
>> a = e1,a = 1.00 * e1>> dynamic{b = a ˆ e2,}b = 1.00*e1ˆe2>> dynamic{b = c ˆ e2,}b = 0
Directly after the second dynamic statement has been entered, b will be setto 0. But immediately after that, GAViewer will notice that the first dynamicstatement (b = a ∧ e2,) should be reevaluated, because the value of b has beenaltered. Thus GAViewer will execute b = a ∧ e2,. If no infinite loop protectionwas in place, GAViewer would now re-evaluate the second dynamic statementagain, followed by the first, etc.
However, GAViewer protects against infinite loops in dynamic statementevaluation. A dynamic statement will never get reevaluated twice due to somekind of loop-dependency in the dynamic statements. In general it is better toavoid such loops because they can be quite confusing.
Some short remarks:

42 CHAPTER 4. THE PROGRAMMING LANGUAGE AND THE CONSOLE
• dynamic can only be called in the global scope, not inside functions orbatches called by functions.
• Setting the inner product using inner product() (section 4.3) will not causedynamic statements using the . operator to be re-evaluated.
• The function cld() removes all dynamic statements
• Terminating statements with colon or semincolon only effects the visi-bility of variables on the first time the dynamic statement is evaluated.hide() and show() do affect visibility on every re-evaluations.
4.10.1 Named Dynamic Statements
The problem with dynamics is that you have little control over them once theyhave been created. You can remove them all using cld(), you can edit them inDynamic→View dynamic statements, but that’s it. Named dynamics offer moreflexibility. By adding a name tag to every dynamic, you can overwrite it later.
An example of the syntax for creating and overwriting a named dynamicis:
>> a = e1,a = 1.00 * e1>> dynamic{my_dynamic: b = a ˆ e2,}b = 1.00*e1ˆe2>> dynamic{my_dynamic: b = a ˆ e3,}b = 1.00*e1ˆe3
4.10.2 Animations
One way to achieve animation in GAViewer is by writing dynamic statementsthat depend on the atime variable.
For example, enter the following dynamic statement on the console:
>> dynamic{print(atime);}atime = 0
Now select Dynamic→Start/Resume Animation:
>> atime = 0>> atime = 0.01>> atime = 0.07>> atime = 0.13>> atime = 0.19
As you can see, atime will be set to the time elapsed since the ’animation’ wasstarted. atime will be set at most 30 times per second, but it may be slower,depending on the time required to redraw the view window and to re-evaluatedynamics.
To stop the animation, select Dynamic→Stop Animation. To pause, selectDynamic→Stop Animation.
By writing more complicated dynamic statements involving atime, moreinteresting animations can be produced.
You can also start and stop animations from the console.

4.11. CONTROL CONSTRUCTS 43
• start animation() starts the animation of dynamics depending on atime.It is guaranteed that when an animation starts, atime will be 0. You cancheck atime == 0 and do some kind of initialization if you need to.
• stop animation(): stops animation.
• pause animation(): pauses animation.
• resume animation(): resumes animation (synonym of start animation()).
For example:
>> cld(); // remove all current dynamics>> dynamic{a = sin(atime) e1, if (atime > 10) stop_animation();}a = -0.86*e1>> start_animation();
This animation will run for about 10 seconds because it stops itself when atimeis larger than 10.
4.11 Control constructs
Several control constucts are available in the language. They are all modelledafter the C programming language.
4.11.1 if else
An if else looks like this
if (condition) statement[else statement]
As indicated by the square brackets, the else part is optional.For example:
>> if (a == 1) {b = 1;} else {b = 2;}
For simple if else statements you can leave out the curly brackets. So the exam-ple from above can be rewritten without change in semantics to the following:
>> if (a == 1) b = 1; else b = 2;
4.11.2 for
A for statement allows one to write a loop. It looks like:
for ([init] ; [cond] ; [update]) statement
It works as follows: to begin with, the init statement is executed. Then beforeevery execution of the statement, it is checked whether cond is true. If so,statement is executed, otherwise the loop terminates. After the statement hasbeen executed, update is executed.
The square brackets around init, cond and update indicate that they are alloptional. If cond is not specified, it is assumed to be true.
An example of a for loop is:

44 CHAPTER 4. THE PROGRAMMING LANGUAGE AND THE CONSOLE
>> for (i = 0; i < 5; i = i + 1) {print(i);}i = 0i = 1.00i = 2.00i = 3.00i = 4.00
A for loop can be terminated prematurely by issuing a break statement. Afor loop can be forced to terminate the execution of the current loop body byusing a continue statement.
The following for loop would loop forever, if it wasn’t for the break state-ment. The print() of i for i == 1 is skipped, as you can see in the output.
>> for (;;) {if (i == 1) continue;print(i);if (i == 3) break;
}i = 0i = 2.00i = 3.00
4.11.3 while
The while language construct also allows you to perform loops, but in a slightlydifferent format. A while loop looks like
while (cond) statement
It loops as long as cond is true, executing the statement on every loop.An example of a while loop is:
>> while (i < 5) {print(i); i = i + 1}
It is very easy to write infinite for or while loops, for example, by forgettingto increment i. In such a case, GAViewer will hang forever. Try for example:
>> while (1) {}
As with the for loop, continue and break can be used to control the loop.
4.11.4 switch
A switch statement allows you to compare the value of an expression againstthe value of a bunch of other expressions, and to undertake some action de-pending on the outcome of that. It looks like this:
switch(expression) {case expr1:
[statements]case exprn:
[statements]default:
[statements]}
4.12. WRITING FUNCTIONS AND BATCHES 45
All the statements are optional. They may include break statements to leavethe switch.
A more or less typical switch would look like:
switch(i) {case 1:
cprint("i is 1");break;
case 2:case 3:
cprint("i is 2 or i is 3");break;
case j + 2:cprint("i is (j + 2)");break;
default:cprint("the default action was called");
}
Note that, as opposed to C, arbitrary expressions (such as j + 2) are allowed forcases.
4.12 Writing functions and batches
You can write your own functions and batches and load them into GAViewer.A batch is a function, except it executes in the same scope as the caller. Inwhat follows we will refer to both functions and batches as just ’functions’,and explain the special stuff for batches later.
You can store functions in .g files, or type them at the console. For example,a small function that returns the largest of two values can be entered directlyon the console:
>> function max(a, b) {if (norm(a) > norm(b)) {return a;}else {return b;}};
Added function max( a, b)
You can then use max() like this:
>> max(1, 3)ans = 3.00
A function definition looks like this:
function func_name([e3ga|p3ga|c3ga] arg1_name, ...[e3ga|p3ga|c3ga] argn_name) {
// function statements}
The first word of a function definition is always function or batch. This is fol-lowed by the name of the function (func name in the example above. Betweena round open and a round close parentheses, the arguments to the function arespecified. A function can have 0 to 8 arguments. The value 8 is hard coded.

46 CHAPTER 4. THE PROGRAMMING LANGUAGE AND THE CONSOLE
More than 8 arguments currently crashes the GAViewer. An arbitrary numberof arguments should be allowed for in the future.
The type specifier (e3ga, p3ga, c3ga) is optional. If no type is specified,actual arguments always match perfectly. A return type specifier can not begiven. A multivector is always returned, without any restrictions on the model/type.
Inside a function, you can type arbitrary statements. A return expr state-ment cause the function to terminate and return the value of expr.
It is also allowed to define new functions inside functions. For example:
function f(a) {function neg(b) {
return -b;}return 2 * neg(a);
}
You can declare the existence of a certain function without defining it likethis:
function f(a);
So a function declaration is like a function definition, except you leave out thefunction body and replace it with a semicolon.
All variables inside a function are local by default. This means that you cannot see variables from the global scope, nor can you set variables in the globalscope. The :: operator can be used reach variables in the global scope frominside a function:
function setGlobalVar(a) {::globalVar = a;
}
4.12.1 Batches
Batches are functions that execute in the same scope as the caller. This meansthat you’ll have to be really careful when calling batches and make sure thatvariable names used in the batch are not used for some other purpose in thecalling scope. For instance, if formal argument names of a batch are alreadypresent in the scope of the caller, they will be overwritten.
Batches are most useful for writing interactive demos and tutorials. Oftenyou want to execute a bunch of statements that are too tedious for the userof your tutorial to type by hand. Then you can collect these statements intoa batch, store them in a .g file and have the user load that. There is a specialsuspend statement to allow for interaction inside batches. Consider:
batch demo1() {a = show(e1);cprint("’a’ is now equal to e1.");cprint("Drag the left mouse button to rotate your view.");cprint("Type arbitrary commands on the console.");cprint("Press enter to continue.");

4.13. AUTOCOLOR. 47
// set a special promptprompt("demo1 suspended... >> ");
// suspend the current batchsuspend;
// set the prompt back to normalprompt();
cprint("Welcome back to demo1");a = show(e2);cprint("’a’ is now equal to e2");cprint("This is the end of demo1");}
Using suspend is not allowed outside the global scope.
4.13 Autocolor.
You may have noticed that not all variables are drawn in the same color. Grade1 variables are red, grade 2 variables are blue, etc. This color is set by a built-infunction called autocolorfunc().
Every time variable in the global scope that is assigned a value, it is send isthrough autocolorfunc() to give it a distinctive look before. The default built-in autocolorfunc() changes the color of the variable depending on it grade (butonly if the color has not been set explicitly by one of the drawings function(section 4.9.4)). It also turns on stippling for imaginary conformal model ob-jects (such as the circles of intersection of two spheres that do not intersect).
You can turn the auto-color feature of by setting the global variable auto-color to false. If autocolor is false, all variables get the same default foregroundcolor.
4.13.1 Writing your own autocolor() function.
You can also write your own autocolorfunc() if you are not satified with thedefault. Writing your own autocolorfunc() is pretty low level, so be prepared.Check out the autocolor.g that is included in the GAViewer documentation pack-age to see what the default autocolorfunc() looks like. Also remember that thedefault built-in autocolorfunc() executes faster than ordinary .g files because itwas written in C++ instead and compiled to machine code, while .g files areinterpreted.
Two important things you’ll want to know is:
• How do I get information about how an object is interpreted? You canfind out by calling get interpretation(a). This returns a bitfield that con-tains information about the interpretation of a. You can use the bitwiseboolean functions to extract information from the bitfield (see autocolor.gfor an example).

48 CHAPTER 4. THE PROGRAMMING LANGUAGE AND THE CONSOLE
• How do I know whether some drawing property of a variable was al-ready set explicitly by the user. Of course, you don’t want to overridewhat the user has explicitly set. So call get draw flags(a). This will re-turn a bitfield that contains information about which drawing propertieswere set by the user.

Chapter 5
Typesetting labels.
GAViewer features a simple typesetting language which resembles Latex. Itwas implemented by the author as an introduction to parsing and interpretinglanguages, and of course because of its functionality. Here is a list of some ofthe features the the typesetting system provides:
• text and equation modes,
• sub- and superscripts,
• four scalable fonts (regular, italic, bold, greek),
• some special ’GA’-symbols,
• tabulars,
• left, right, center, and justifyable alignment,
• hats,
• scalable parenthesis,
• (square) roots,
• fractions,
• custom commands (macros), and
• (custom) colors.
The implementation of the typesetting system was kept simple, which makesit unsuitable for typesetting large amounts of text. The input is parsed, checkedfor syntax errors, and converted to a parse tree. After the parse pass havebeen completed, the parse tree is interpreted an turned into drawing com-mands. Then the parse tree can be released, and the drawing commands sentto OpenGL (or some other graphics API). Because parsing, interpreting anddrawing do not occur in one pass, large amounts of memory will be requiredin large amounts of text are supplied as input. As a side note, lex and yacc areused for parsing the input.
The font for the typesetting is a 1024 × 1024 pixel ’GL ALPHA’ texture. Itis included directly in the source code, in fontdata.cpp. The font is antialiased
49

50 CHAPTER 5. TYPESETTING LABELS.
Figure 5.1: An example of the use of text and equation modes.
and contains all ASCII symbols of four font: regular, italic, bold, greek. It alsocontains several special GA-only symbols.
Figure 5.1 shows an example of a complex typeset label. This figure is repre-sentative for the complexity the typesetting system was designed. The systemcan handle multiple lines and such, but don’t use it to typeset entire pages likeyou can do with Latex.
5.1 txt and eqn modes.
There are two parse modes with subtle differences. txt mode, the default, isused to typeset ordinary text, like this sentence. eqn mode is intended fortypesetting equations. Whitespaces, numbers and operators are treated differ-ently in both modes, and some commands, such as sqrt and frac are only validin eqn mode. Here is an example of switching between modes:
\txt{This is ordinary sentence}
\eqn{a = b + c - d}
The former line switches to text mode. This causes all text between the curlyparentheses to be parsed as ordinary text. The latter line uses equation mode.The following, more complex line combines the uses of txt and eqn modes:
\txt{A sphere: \eqn{\bold{s} = \par{()}{\bold{q} + \frac{1}{2}\rhoˆ{2}\bold{e}_{\infty}}ˆ{*}}
As you can see, the eqn part is inside embedded in the txt part. Because thedefault parsing mode is txt, the following is equivalent to the previous line(unless you have changed the default parsing mode):
\txt{A sphere: \eqn{\bold{s} = \par{()}{\bold{q} + \frac{1}{2}\greek{r}ˆ{2}\bold{e}_{\infty}}ˆ{*}}
Both these sample lines result in the output shown figure 5.1.
5.1.1 txt mode details:
In txt mode, multiple instances of spaces, newline and tabs are interpreted asa single instance of whitespace. Whitespace at the end of a line is ignored anddeleted. To force the insertion whitespace, use the ws command (section 5.4).
Sequences of letters, numbers, underscores, plus and minus signs are in-terpreted as words. Other ASCII characters are interpreted as single-character

5.2. FONTS 51
Figure 5.2: An example of a number in eqn mode.
words. A backslash followed by letters is interpreted as a command. A back-slash followed by numbers is interpreted as a custom command argument (sec-tion 5.13). Two backslashes next to each other is short for the newline com-mand. A backslash followed by any other character is interpreted as an escapesequence for that character. To produce an actual backslash in the output, usethe backslash command.
The frac, sqrt, har and par commands are not valid in txt mode.
5.1.2 eqn mode details:
In eqn mode, all whitespace is ignored (unless it was forced using the ws com-mand). Characters and symbols that are recognized as operators are automat-ically surrounded by a small amount of whitespace.
A sequence of letters is interpreted as a word. These are printed in italicsby default. A sequence of numbers, possibly followed by an exponent are in-terpret as numbers. The following line results in the output shown in figure5.2.
\eqn{123e-456}
The frac, sqrt, har and par commands can be used to typeset (square) roots,fractions, to put hats on top of expressions and, and to surround an expressionin parentheses.
5.2 Fonts
Four fonts are available, as illustrated in figure 5.3. The input used to generatethe figure speaks for itself:
Figure 5.3: The four fonts.

52 CHAPTER 5. TYPESETTING LABELS.
Greek symbol command ASCII mappingα alpha aβ beta bγ gamma gδ delta dε epsilon eζ zeta zη eta hθ theta qι iota iκ kappa kλ lambda lμ mu mν nu nξ xi xo omikron oπ pi pρ rho rσ sigma sτ tau tυ upsilon uφ phi fχ chi cψ psi yω omega w
Figure 5.4: Mapping of the Greek to the ASCII alfabet.
\regular{Regular font.}\newline\bold{Bold font.}\newline\italic{Italic font.}\newline\greek{Greek font.}
If you find regular, bold, italic, greek, too long to type, you may considerusing the equivalent abbreviations fr, fb, fi, fg, which stand for ’font’ followedby the first letter of the name of the font.
Of couse, fonts can be embedded in each other as with the txt and eqnmodes. So the following lines also result in the output shown in figure 5.3:
\regular{Regular font.\newline\bold{Bold font.\newline\italic{Italic font.\newline\greek{Greek font.}}}}
The default font in math mode is italic for letters (variables) and regular forall other symbols.
The greek alphabet is mapped to the ASCII alfabet as shown in figure 5.4.Their are two ways to produce greek characters. The first way is to switch tothe greek font, the second is to use the command supplied for each character,e.g., alpha to produce the symbol ’α’:

5.3. SCALING OF FONTS 53
Figure 5.5: Scaling the font using the scale command.
\greek{a}
\alpha
The greek symbol commands work in both txt and eqn modes.
5.3 Scaling of fonts
The typesetting system always start typesetting with a default font size. Thesize of the font can change implicitly through the use of certain commands andconstructions. For example, the size of the font of a sub- or superscript is 0.6×the size of the parent text.
You can explicitly scale the size of the font by using the scale command, asshown in the next example (output is in figure 5.5:
\scale{0.5}{Small,} \scale{1.0}{normal, and}\scale{2.0}{big} text
5.4 Forced whitespace, forced newlines
To force whitespace between words or at the end of a line, use the ws com-mand. Suppose the typesetting system typesets something badly, e.g.:
\italic{ape}:nut
(see output in figure 5.6a), then you could use whitespace commands to forcesome space at both sides of the colon:
\italic{ape}\ws{0.05}:\ws{0.1}nut
(see output in figure 5.6b)If you don’t supply an argument to the ws command, a default of 0.25 is
used.
Figure 5.6: Forcing whitespace at both sides of the semicolon using the wscommand.

54 CHAPTER 5. TYPESETTING LABELS.
Figure 5.7: The four alignment modes.
Newline are automatically inserted when text is too wide to fit on the cur-rent line. To force a newline to be inserted, you can use the newline command,as was already shown in the four fonts example above (section 5.2). Two back-slashes is a short synonym for a newline.
5.5 Alignment
Four alignment modes are offered to place text on a line as required, and to fillout the line if required.
The first mode is left. This places all text as far to the left as possible. rightmodes places all text as far to the right as possible. center modes places all textin the center of the line. justify mode spaces all text such that it nicely fits themaximum width of the line. The ouput in figure 5.7 was generated from thefollowing input:
\left{Left mode}\newline\right{Right mode}\newline\center{Center mode}\newline\justify{Justify mode}
5.6 Sub- and superscript
In eqn mode, sub- and superscripts can be added to the previous ’word’ in thesentence. The syntax of the sub- and superscript constructors is pretty straight-forward, and should become clear from the following input and its output (fig-ure 5.8):
Figure 5.8: Script example.

5.7. PARENTHESES 55
Figure 5.9: The three types of parentheses, and an example of how parenthesesscale with their contents.
\eqn{xˆ{y} + M_{12} - e_{1}ˆ{2}}
If you try to append multiple subscripts or multiple superscripts to a sin-gle word, the system will complain and ignore everthing but the first sub- orsuperscript.
5.7 Parentheses
Three types of parentheses can be placed around pieces of text in eqn mode:square parentheses [], round parentheses () and curly parentheses {}. Thebrackets automatically scale with the size of the input. Here are some examplesof their use, the output is in figure 5.9:
\center{\eqn{\par{()}{\txt{Round parentheses}}}\newline\eqn{\par{[]}{\txt{Square parentheses}}}\newline\eqn{\par{\{\}}{\txt{Curly parentheses}}}\newline\eqn{\par{\{\}}{\frac{\txt{Curly parentheses with some}}{\scale{2.0}{\txt{big text}}}}}}
As you can see, the first argument to the par command is the parenthesesyou would like. These can be any mix of types, e.g.: [], (] or even somethingweird like }{. The second arguments specifies the contents of the parenthe-ses. Note that you always have to be in eqn mode (for no apparent reason...),but you can cheat you way around this by including txt commands inside theparentheses command.

56 CHAPTER 5. TYPESETTING LABELS.
5.8 Tabulars
Tabulars can be used for all kinds of purposes where you want to arrange textin row and columns. Examples of their use are tables and matrices. We willgive an example of both.
The tabular command first argument specify the number of columns, thealignment of content inside the columns, and optional vertical lines betweenthem. All following arguments specify rows. Inside a row, each column isseperated by an ampersand: ’&’. The alignment of a column can be Here is anexample of a table with 4 columns and 4 rows (output in figure 5.10):
\tabular{|r||c|c|c|}{\hline}{ &\bold{1998}&\bold{1999}&\bold{2000}}{\hline}{\hline}{\bold{x}&1.0&1.2&1.4}{\bold{y}&+&-&++}{\bold{z}&bad&worse&horrible}{\hline}
The width of a column is determined by the width of the widest item in thecolumn. The alignment can be ’l’, ’r’, ’c’ or ’j’ (left, right, center, or justify), andbehaves as described in section 5.5. A vertical bar ’—’ in the first argumentproduces a vertical line. A row containing only an hline command producesa horizontal line. Empty or unspecified entries in row are filled with blanks;surplus columns in row are ignored with a warning issued.
Now for an example of a matrix:
\eqn{\bold{M} =\par{[]}{\tabular{cccc}{\fr{R_{11}}\ws{0.2}&\fr{R_{12}}\ws{0.2}&\fr{R_{13}}\ws{0.2}&0}{\fr{R_{21}}&\fr{R_{22}}&\fr{R_{23}}&0}{\fr{R_{31}}&\fr{R_{32}}&\fr{R_{33}}&0}
Figure 5.10: Tabular example 1.

5.9. (SQUARE) ROOTS 57
Figure 5.11: Tabular example 2.
{\fr{t_{1}}&\fr{t_{2}}&\fr{t_{3}}&1}}}
This produces figure 5.11. Note the use of the ws command to force some extrawhitespace between columns.
5.9 (Square) roots
The construct a (square) root, use the sqrt command. It takes at least one argu-ment (the contents of the root), and optionally a second argument, which is the’power’ of the root. For example:
\eqn{\sqrt{x + y}\ws{1.0}\sqrt{\pi}{3}\ws{1.0}\sqrt{\fb{Z}}{\scale{0.5}{\frac{1}{2}}}}
This produces the output shown in figure 5.12. As you can see in the last line,sometimes you have to manually scale the font size of the ’power’ if you putsomething weird or large in there.
5.10 Fractions
To construct complicated fractions where the numerator and the denominatorare separated by a horizontal line, use the frac command. It takes two argu-ments (the contents of the numerator and the denominator). The size of the
Figure 5.12: Square root example.

58 CHAPTER 5. TYPESETTING LABELS.
Figure 5.13: Fraction example.
font is implicitly scaled by 0.9 in a fraction, but this can be corrected by usingthe scale command (section 5.3). The output in figure 5.13 was generated fromthe following input:
\eqn{\frac{1}{x+y}\ws{2.0}\frac{aˆ{2} - bˆ{2}}{a + b} = a - b}
5.11 Hats
You can add hats, bars and tildes on top of text by using the hat, widehat, bar,widebar, tilde or widetilde commands. The wide variants scale with the sizeof the content, as is illustrated by the following examples, and its output infigure 5.14.
\eqn{\hat{A}\ws{1.0}\tilde{\frac{x}{y}}\ws{1.0}\widehat{A + B + C}\ws{1.0}\widebar{A + B + C}}
All types of hats look rather bad when (OpenGL) antialiasing is turned off.
5.12 Colors
Text can be typeset in arbitrary colors. A fixed number of colors is known to thesystem, and custom colors can be defined using a special command describedbelow. The default colors are: red, green, blue, magenta, yellow, cyan, black,white, grey and gray (these last two are synonyms).
The draw text in one of these colors (the default is black by the way), dosomething like the following (output in figure 5.15):
Black text, \red{red text}, \blue{blue text}\newline and a green \green{frog}.
Figure 5.14: Hats example.

5.13. CUSTOM COMMANDS 59
Figure 5.15: Color example.
5.12.1 Custom colors
Custom colors can be added using the newcolor command. The commandtakes one argument, which is a sentence that contains the name of the color,the red value (range: [0.0, 1.0]), the green value and the blue value, seperatedby whitespace:
\newcolor{brightpink 1.0 0.0 0.6}
Once a new color is defined like this, it can be used as any other color:
\brightpink{Some bright pink text.}
If a color is already defined, issuing a newcolor command for it will overrideits current rgb value. Redefining an existing command as a color is possiblebut not recommended.
5.13 Custom commands
When you want to do the same thing a lot of times, it might be useful to create acustom command or ’macro’. A custom command defines a fixed input string,with variable arguments. An example might be when you always want totypeset your geometric algebra multivectors in bold font. You can define anew command mv (short for multivector), and use that everytime you wantto typeset something as a multivector. Custom commands can save you a lotof typing work, make your input more readible, and if you later change yourmind and decide that all you multivectors should be typeset in italics, it is
a b
Figure 5.16: Custom command example.

60 CHAPTER 5. TYPESETTING LABELS.
easier and less error-prone to change a single custom command definition, thanto replace every occurance of the bold command.
Here is an example of defining and using a custom command:
\newcommand{\mv}{\bold{\1}}\eqn{\mv{C} = \mv{a} \op \mv{b}}
The output is in figure 5.16a. The first argument to the newcommand com-mand is the name of the the new command (mv in this case). The secondargument is what the command should be expanded to. Inside the secondargument, a backslash followed by an positive number i will be replaced ith
argument of the new command. The mv command takes only one argument,but next we give an example of multiple arguments (output in figure 5.16b).
\newcommand{\wc}{\eqn{\sqrt{\frac{\1}{\2}}{\3}}}\wc{1}{2}{3}
Note that the eqn command is included inside the custom command, toforce equation mode every time the command is used (otherwise the frac com-mand may not work). This is like ensuremath in Latex.
Commands with no arguments are also possible by simply not using any’backslash positive numbers’ inside the custom command string.
If a command is already defined, issuing a newcommand command for itwill override its current value. Redefining an existing predefined command(such as txt or par is possible but not recommended.
5.14 Special symbols
Several special symbols for geometric algebra use are available, and more canbe added quite easily as required. Currently the following symbols are avail-able through commands:
Command Symbolgp half spaceop ∧ip ·lc �rc cp ×infty or inf ∞
Accessing the greek special characters directly was already discussed insection 5.2. Most ASCII characters that are not numbers or letters can also beaccessed by typing a backslash followed by the character. For some charac-ters, this is the only way of producing them, since they are reserved (e.g., thebackslash).

Bibliography
[1] D. Fontijne, T. Bouma, L. Dorst Gaigen: A Geometric Algebra ImplementationGenerator. Available at http://carol.science.uva.nl/∼fontijne/gaigen
61


![Clifford algebra, geometric algebra, and applications · PDF filearXiv:0907.5356v1 [math-ph] 30 Jul 2009 Clifford algebra, geometric algebra, and applications Douglas Lundholm and](https://static.fdocuments.us/doc/165x107/5a7327fa7f8b9aac538e5155/cliord-algebra-geometric-algebra-and-applications-arxiv09075356v1-math-ph.jpg)