GAUTENG BIODIVERSITY GAP ANALYSIS - … - Conservation Plan.pdf · PROJECT AIM To identify and map...
23
Introduction Project aim Approach to project Data collection Threat layers Data analysis Time frame ENVIRONMENT & LAND AFFAIRS GAUTENG BIODIVERSITY GAP ANALYSIS DEPARTMENT OF AGRICULTURE, CONSERVATION,
Transcript of GAUTENG BIODIVERSITY GAP ANALYSIS - … - Conservation Plan.pdf · PROJECT AIM To identify and map...

IntroductionProject aimApproach to projectData collectionThreat layersData analysisTime frame
ENVIRONMENT & LAND AFFAIRS
GAUTENG BIODIVERSITY GAP ANALYSIS
DEPARTMENT OF AGRICULTURE, CONSERVATION,

INTRODUCTION
Policy context
South Africa is a signatory to the United Nations Convention on Biological Diversity and is therefore committed to ensuring its objectives are met.The White Paper on the Conservation and Sustainable Use of South Africa’s Biological Diversity describes South Africa’s approach to upholding this Convention.The BGAP addresses the first of the goals listed in the White Paper, i.e. to conserve the diversity of landscapes, ecosystems, habitats, communities, populations, species and genes in South Africa.

LANDSCAPES
COMMUNITIES
SPECIES/POPULATIONS
INDIVIDUALS
GENES
Biodiversity defined
The variety and variability among living organisms and the ecological complexes in which they occur.The term encompasses different levels of organization including landscapes, communities, species, populations, individual organisms and genes.Ecological processes are also included.

Biodiversity of Gauteng
Although the smallest province in SA, Gauteng is characterized by a high biodiversity.Gauteng falls within both the savanna and highly threatened grassland biomes that together constitute six vegetation types.Approximately 83% of the province falls within Highveld Grassland, of which an estimated 0.8% is currently conserved in SA.An estimated 3303 plant species, 125 mammal species, 483 bird species, 23 amphibian and 101 reptile species occur in the province.25 plant species are endemic or “near endemic” to the province, all of them threatened with extinction with at least 56% Critically Endangered or Endangered.

Problems and challenges
There is a serious lack of up-to-date information on the biodiversity of Gauteng; information that does exist is associated with sampling bias, is outdated or has been recorded at too coarse a scale (e.g. quarter degree grids).The province has the highest human population density and the highest urbanization levels in the country.The biodiversity of Gauteng is highly threatened by industrialization, mining, agriculture and especially urbanization.Successful conservation of biodiversity requires the identification and mapping of priority areas where development and habitat transformation and fragmentation should be discouraged and conservation efforts should be focused.

PROJECT AIM
To identify and map the distribution of areas that are of importance to biodiversity in Gauteng through a conservation planning exercise that is based on explicit representation goals and the principles of:
complementarity (avoidance of duplication of important attributes),efficiency (most protection for the least cost/area),defensibility and flexibility (many combinations of potential solutions in the face of competing land uses),irreplaceability,retention (consideration of threatening factors),persistence (capturing of ecological processes and exclusion of threats) andaccountability (in allowing decisions to be critically reviewed)
and ultimately to provide recommendations for the conservation and management of these areas.

APPROACH TO PROJECT
The history of conservation planning
In the past, conservation areas were not established with biodiversity criteria under consideration – in many southern African countries, protected areas were established for the sole purpose of conserving larger mammal species.
Conservation planning exercises targeting solely the species level of biodiversity.More studies targeting the level of communities, habitats, ecosystems and landscapes.More thorough studies targeting both lower and higher levels ofbiodiversity. Focusing on both species and higher organizational levels should help integrate patterns and processes into conservation planning.H
isto
rical
tren
ds in
co
nser
vatio
n pl
anni
ng
Gauteng BGAP project

site irreplaceability map
site databasesite by feature databasefeature database
conservation plan
management & policy strategiesco
nser
vatio
n ta
rget
svu
lner
abilit
y ra
tings
GIS shape files
Threat layers
Medicinal plant use
Varroa infestation
Others
Conservation areas
Habitat diversity and processes
Ridges
Caves
Rivers
Wetlands
Biodiversity
Flora
Invertebrates
Birds, reptiles and amphibians
Mammals
Fish
Threat layers
Medicinal plant use
Varroa infestation
Others
Biodiversity
Flora
Invertebrates
Birds, reptiles and amphibians
Mammals
Fish
Biodiversity Information Management System
database
GIS shape files
Conservation areas
Habitat diversity and processes
Ridges
Caves
Rivers
Wetlands
cons
erva
tion
targ
ets
vuln
erab
ility
ratin
gs
Biodiversity Information Management System
database
site databasesite by feature databasefeature database
site irreplaceability map
conservation plan
management & policy strategies
DATA COLLECTION DATA CAPTURE DATA ANALYSIS IN C-PLAN

Ridges layer
Using a GIS digital elevation model, all ridges mapped.A histogram analysis of five major ridge systems in the province indicated that the minimum slope of a ridge is 5º (contour intervals of 20m at 1:50 000 scale).Class 1 & 2 ridgesClass 1 & 2 ridges: Conserve 100% of all untransformedareasClass 3 & 4 ridgesClass 3 & 4 ridges: Conserve 100% of all untransformed portions >4ha
Class 1Class 2Class 3Class 4
Sensitivity classes

Rivers layer (Piet Müller)
The National River Health Programme contributes to this layer.Involves the biological monitoring of all the aquatic drainage systems in Gauteng by means of standardized survey techniques.
Target: Conserve 100% of all rivers.100m buffer against edge effects and for rough approximation of 1:100 year floodline.
Riverine Vegetation Index: Surveying of riverine vegetationSouth African Scoring system version 4: Surveying of aquatic invertebratesFish Assemblage Integrity Index: Surveying of fish populations

Wetland layer (Reggy Nkosi)
Current GIS data on wetlands in Gauteng obtained from
will be updated and verified.
Target: Conserve 100% of all wetlands.100m buffer against edge effects and for rough approximation of 1:100 year floodline.
1:50 000 mapsAerial photographisOrthophotos2000 Landcover wetland mapping project

Flora layer (Michèle Pfab)Plant communities
All untransformed natural/semi-natural vegetation in Gauteng classified into component plant communities using LANDSAT 7 satellite imagery and ground truthing.All Red Data plant populations in Gautengmapped using a GPS and suitable habitat modeled.The vegetation type/community and species/population layers combined in a GIS to form flora diversity layer.
RD plant populations

Invertebrate layer (Marianne Forsyth)
Targets threatened and endemic species as well as functional groups (pollinators, seed dispersers, predators, biomass and soil workers).Sampling using baited pitfalls, vegetation sweeps, malaise trapping, aerial sweeps, baited butterfly traps, night light traps, hand collection and honeybee catch boxes.Identification of material to genus and species level outsourced to experts.
Heidelberg copper butterflyHEIDELBERG

Birds, reptiles & amphibians layer(Craig Whittington-Jones)
All existing information collated.Species prioritized using criteria such as endemism, Red Data status and conservation importance in Gauteng. All habitat types in each quarter degree grid square sampled at least once from October to April of each year.Surveying of reptiles and amphibians involves both active and passive capture techniques.A bird atlas underway in co-operation with BirdLife South Africa and local Gauteng bird clubs. Field surveys of birds involve line transects through each habitat type.

Mammal layer (Dean Peinke)
All existing information collated.All naturally occurring free-ranging mammal species prioritized.All habitat types in each quarter degree grid square sampled at least once from October to April of each year.Shrews, elephant shrews and small rodents sampled using small mammal traps.Mole traps set in areas where mole activity is observed.At least four hours a night allocated to bat sampling using the AnabatII bat detector and mist netting.Small and large carnivore traps set at suitable sites.Spotlight surveys for nocturnal species.All diurnal species encountered during active searches recorded as well as spoor, droppings, feeding signs, burrows, etc.Habitat suitable for Red Data species afforded specific attention.
Juliana’s golden moleBRONBERG
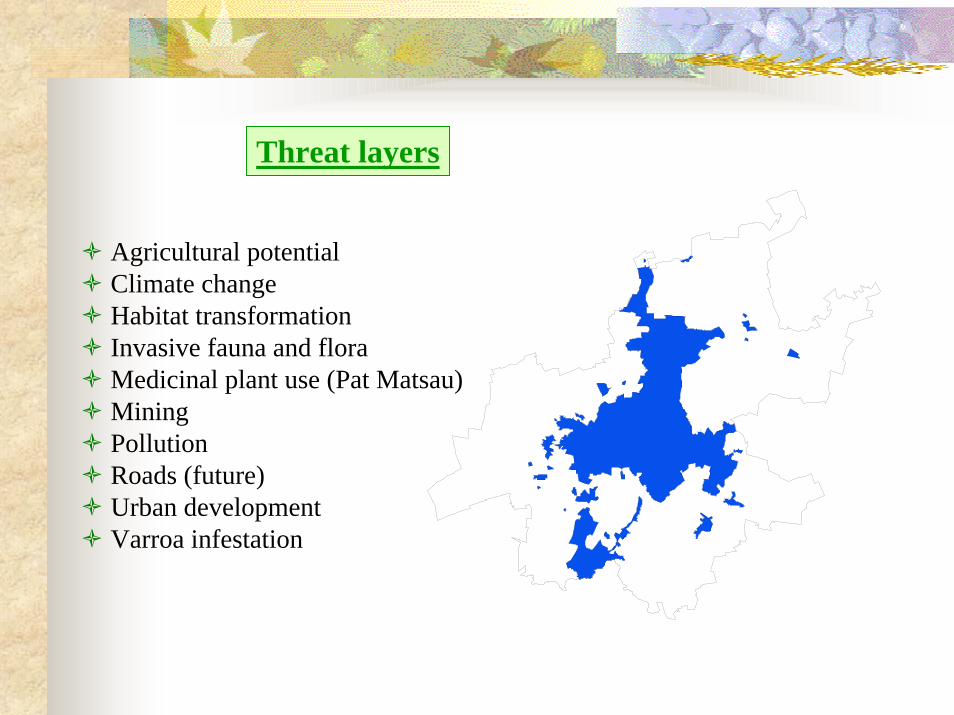
Threat layers
Agricultural potentialClimate changeHabitat transformationInvasive fauna and floraMedicinal plant use (Pat Matsau)MiningPollutionRoads (future)Urban developmentVarroa infestation

Systematic conservation planning protocol
1. Features to be used as surrogates for overall biodiversity selected.2. Explicit goals, translated into quantitative operational targets, set.3. Extent to which conservation goals met in existing reserves determined.4. Simple, explicit methods used for locating and designing new reserves to
complement existing ones in achieving goals.5. Explicit criteria for implementing conservation action on the ground
applied.6. Explicit objectives and mechanisms for maintaining conditions within
reserves adopted, together with monitoring and adaptive management as required.

Irreplaceability
Inherent in any data set, irreplaceability is the major constraint on selecting new areas to achieve representation targets not met by existing conservation areas.The irreplaceability map produced through the C-plan exercise indicates for each of the areas in a planning region the options for replacing it while still achieving conservation targets.Irreplaceable areas have no replacements, whereas others have many.Choosing between alternative replacements can be based on land tenure, threatening factors, trade-offs between opportunity costs and biodiversity gain and the position of existing conservation areas in relation to alternatives.Areas characterized by high irreplaceability values and high vulnerability ratings should receive priority conservation action.
Irre
plac
eabi
lity
Vulnerability
Priority sites

Conservation plan: Version 1
IrreplaceableImportantConservation areas

PROJECT OUTPUTS
A Gauteng conservation plan indicating areas important for the conservation of biological diversity where/that:
New provincial nature reserves or other legislated protected areas should be established.Conservancies or natural heritage sites or other community-based conservation projects should be established.Strategic Environmental Assessments are required.Increased policing i.t.o. the Nature Conservation Ordinance, NEMA and ECA is required.Should be listed as sensitive environments in the schedules of the Gautengprovincial EIA regulations.

PROJECT OUTPUTS …
Evaluations of the conservation status of threatened elements of biodiversity in the province.Biodiversity inventories for development hotspots in the province.Biodiversity inventories and management recommendations for conservation areas/reserves in the province.Incorporation of information into and updating of information contained within GOSP.Identification of gaps requiring further conservation research by external academic institutions.

PROJECT OUTPUTS …
Contribution towards:
A Gauteng Conservation Information Database for use as a decision supporttool by DACEL, other government departments, environmental consultants, the public and NGO’s.The land-use planning process at local government level, e.g. IDP process.The fulfillment of the goals described in the White Paper on the Conservation and Sustainable Use of South Africa’s Biological Diversity and future Biodiversity Act.The fulfillment of international obligations in terms of the Convention on Biological Diversity, the RAMSAR Convention, the Rio Convention and CITES.The development of provincial policies for the conservation and management of biodiversity.Identification of management priorities for protected areas and informing the contents of management plans.

TIME FRAME
Project initiated: June 2001Final report: end January 2007
Yearly schedule:
September -June
FieldworkTransfer of collected data to Environment on monthly basis
May -September
Progress report and detailed planning for following seasonRevise conservation targets and vulnerability ratingsData capture within BIMS and C-plan
October –December
C-plan analysisRevised conservation planDraft management and policy strategies