G20 low carbon competitiveness - E3G · This report assesses the low carbon competitiveness of the...
65
G20 low carbon competitiveness
Transcript of G20 low carbon competitiveness - E3G · This report assesses the low carbon competitiveness of the...

G20 low carbon competitiveness

The Climate Institute and E3G
G20 low carbon competitiveness
FINAL REPORT 14th SEPTEMBER 2009
Preface from Lord Nicholas Stern
Chairman, Grantham Research Institute on Climate Change and the Environment, LSE
Head of the Stern Review on the Economics of Climate Change
This report on low carbon competitiveness comes at a critical time in the
international negotiations on climate change. Over the next few months countries
have the opportunity to adopt credible policies to reduce emissions and to prosper in
a low carbon world. Moreover, the global economic recovery presents an ideal
opportunity for countries to shift towards low carbon growth. Countries which don't
seize this opportunity will undermine their future competitiveness and prosperity.
The report by Vivid Economics provides an important picture of the competitiveness
of the G20 countries. This type of analysis will be a welcome input into negotiations
over the coming months.

The Climate Institute and E3G Low carbon competitiveness
i
Sponsors of this report
Established in late 2005, The Climate Institute is a non-partisan, independent
research organisation that works with community, business and government to drive
innovative and effective climate change solutions. We research. We educate. We
communicate. Our vision is for an Australia leading the world in clean technology
use and innovation, with clean and low carbon solutions a part of everyday life
throughout the community, government and business. The Climate Institute is
primarily funded by a donation from the Poola Foundation (Tom Kantor Fund).
More information can be found at www.climateinstitute.org.au
Third Generation Environmentalism Ltd (E3G) is an independent, non-profit
European organisation operating in the public interest to accelerate the global
transition to sustainable development. E3G builds cross-sectoral coalitions to achieve
carefully defined outcomes, chosen for their capacity to leverage change. E3G works
closely with like-minded partners in government, politics, business, civil society,
science, the media, public interest foundations and elsewhere.
More information is available at www.e3g.org
The Climate Institute and E3G Low carbon competitiveness
ii
Acknowledgements
Valuable comments were received from Professor Stephen Howes of the Crawford
School of Economics and Government at the Australian National University, John
Llewellyn of Llewellyn Consulting, Sofia Fenichell and Sophie Sanders of Beetle
Capital and a referee who wishes to remain anonymous. While these comments were
gratefully received, they should not be taken as an indication that these people
endorse the findings of this report and responsibility for any errors remains with
Vivid Economics.

The Climate Institute and E3G Low carbon competitiveness
iii
Executive Summary A concerted global effort to reduce greenhouse gas (GHG) emissions will be required
if a global average temperature rise of more than two degrees Celsius is to be
avoided. Fundamental changes in both the global economy and the economy of each
individual country will be necessary to achieve this goal. How each nation adapts to
a carbon constrained world will, to a large extent, determine its future economic
competitiveness and ability to create prosperity for its residents.
This report assesses the low carbon competitiveness of the nineteen G20 countries.1
Traditional measurements of competitiveness fail to assess the consequences of how
countries adapt to the opportunities and costs of moving to a carbon constrained
world. This report seeks to fill this gap by providing a comparative, data-driven
analysis of the progress countries are making to carry out this transition now and
over time.
The G20 countries account for 76 per cent of world GDP and 69 per cent of total
greenhouse gas emissions.2 The G20 is therefore an important group in addressing
climate change. Plans to unlock public and private sector financing for low carbon
solutions are on the agenda at the upcoming G20 summit in Pittsburgh, USA in
September 2009; therefore this meeting may play a crucial role in the lead up to the
United Nations Climate Change Conference in Copenhagen in December 2009.
There are three elements to assessing overall low carbon competitiveness: where
countries are positioned now, the rate at which this is changing, and the scale of the
challenge they face. This report therefore compares the performance of the G20
countries along three key metrics:
1 There are nineteen country members of the G20 plus the EU. The performance of the EU as a whole
is not considered in this report.
2 GDP calculations based upon IMF data for 2008, while the emissions calculations are based upon
World Resources Institute data for 2000 and include land use change and forestry.
The Climate Institute and E3G Low carbon competitiveness
iv
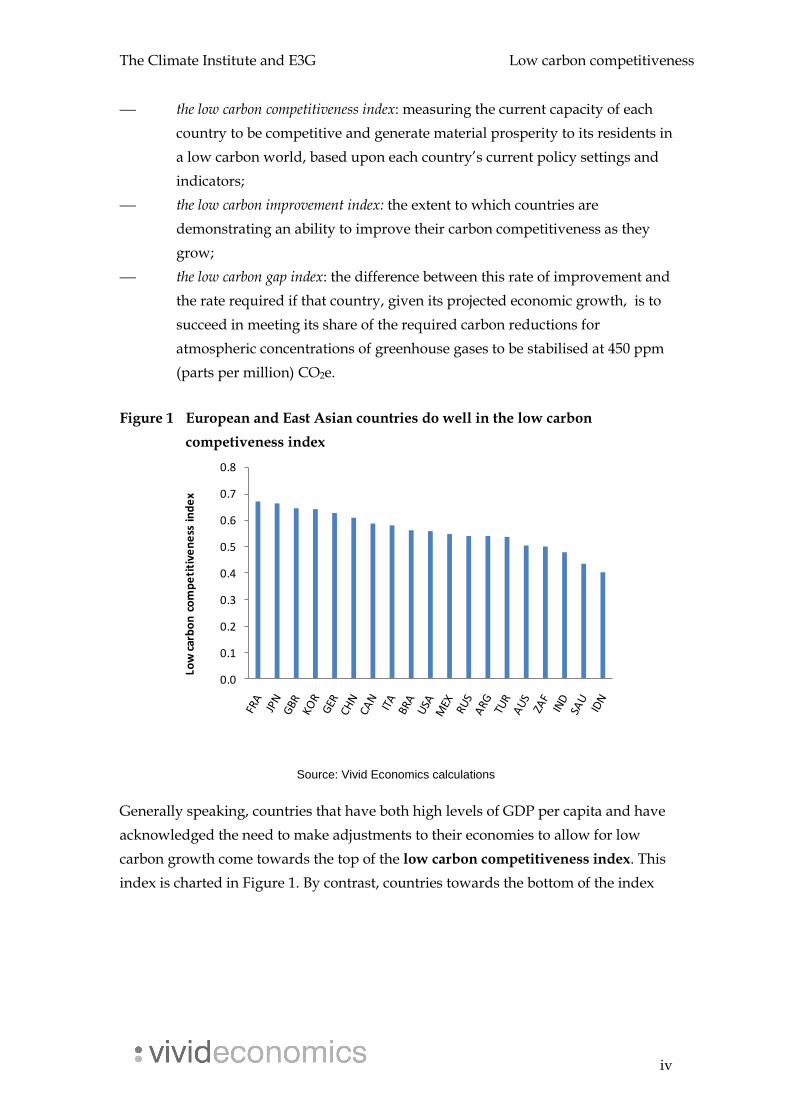
the low carbon competitiveness index: measuring the current capacity of each
country to be competitive and generate material prosperity to its residents in
a low carbon world, based upon each country‟s current policy settings and
indicators;
the low carbon improvement index: the extent to which countries are
demonstrating an ability to improve their carbon competitiveness as they
grow;
the low carbon gap index: the difference between this rate of improvement and
the rate required if that country, given its projected economic growth, is to
succeed in meeting its share of the required carbon reductions for
atmospheric concentrations of greenhouse gases to be stabilised at 450 ppm
(parts per million) CO2e.
Figure 1 European and East Asian countries do well in the low carbon
competiveness index
Source: Vivid Economics calculations
Generally speaking, countries that have both high levels of GDP per capita and have
acknowledged the need to make adjustments to their economies to allow for low
carbon growth come towards the top of the low carbon competitiveness index. This
index is charted in Figure 1. By contrast, countries towards the bottom of the index
0.0
0.1
0.2
0.3
0.4
0.5
0.6
0.7
0.8
Low
car
bo
n c
om
pe
titi
ven
ess
in
de
x
The Climate Institute and E3G Low carbon competitiveness
v
are Australia and non-Annex I nations that are heavily dependent upon carbon
intensive production for income.
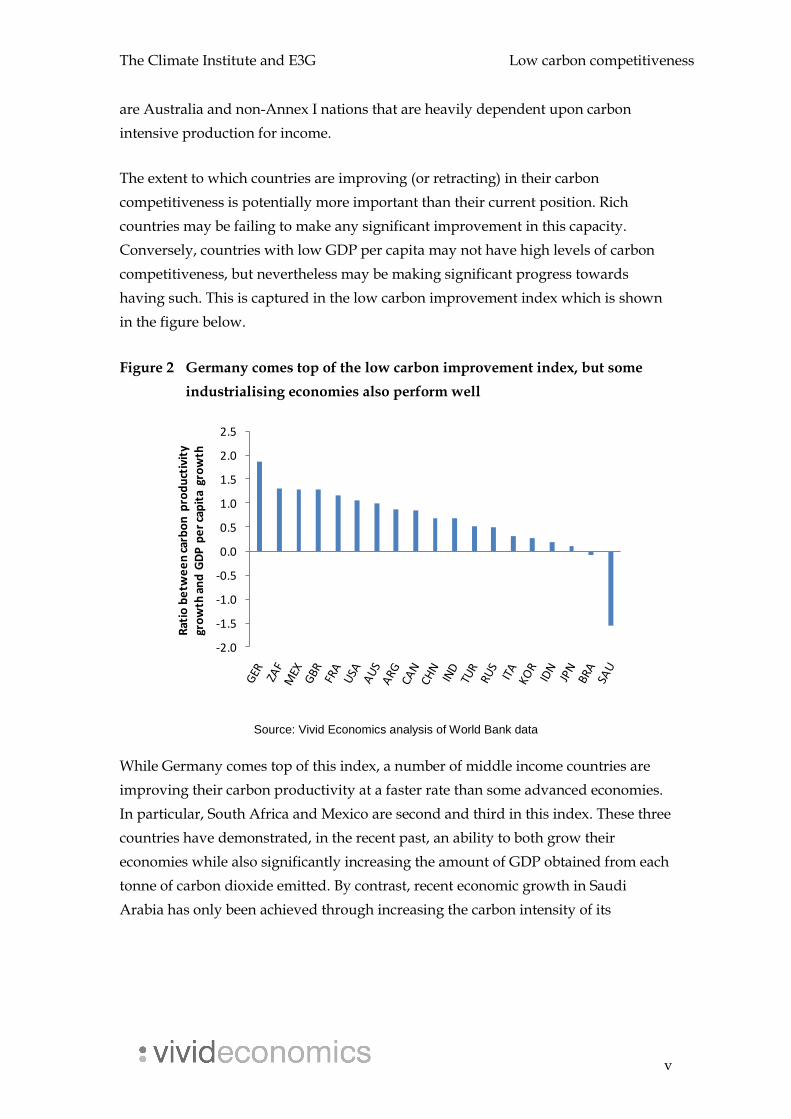
The extent to which countries are improving (or retracting) in their carbon
competitiveness is potentially more important than their current position. Rich
countries may be failing to make any significant improvement in this capacity.
Conversely, countries with low GDP per capita may not have high levels of carbon
competitiveness, but nevertheless may be making significant progress towards
having such. This is captured in the low carbon improvement index which is shown
in the figure below.
Figure 2 Germany comes top of the low carbon improvement index, but some
industrialising economies also perform well
Source: Vivid Economics analysis of World Bank data
While Germany comes top of this index, a number of middle income countries are
improving their carbon productivity at a faster rate than some advanced economies.
In particular, South Africa and Mexico are second and third in this index. These three
countries have demonstrated, in the recent past, an ability to both grow their
economies while also significantly increasing the amount of GDP obtained from each
tonne of carbon dioxide emitted. By contrast, recent economic growth in Saudi
Arabia has only been achieved through increasing the carbon intensity of its
-2.0
-1.5
-1.0
-0.5
0.0
0.5
1.0
1.5
2.0
2.5
Rat
io b
etw
ee
n c
arb
on
pro
du
ctiv
ity
gro
wth
an
d G
DP
pe
r ca
pit
a gr
ow
th
The Climate Institute and E3G Low carbon competitiveness
vi
economy. Japan, while highly placed in the low carbon productivity index, has
shown little ability to improve its carbon productivity over the period analysed.
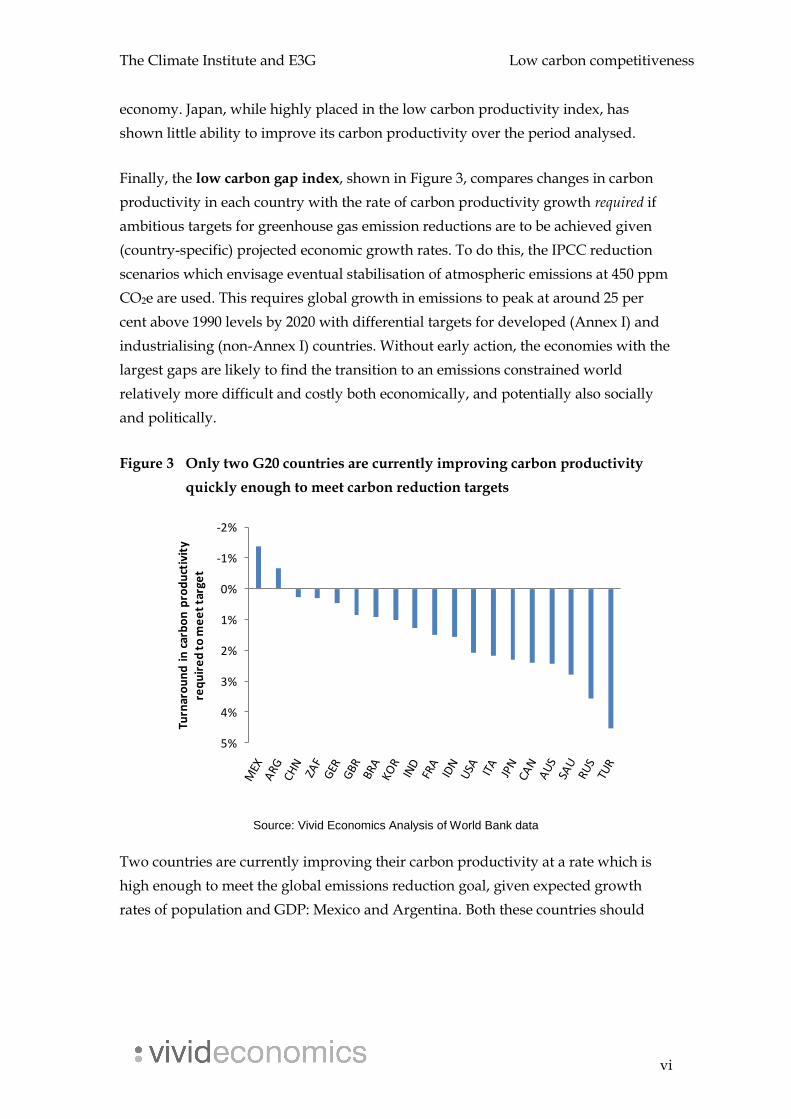
Finally, the low carbon gap index, shown in Figure 3, compares changes in carbon
productivity in each country with the rate of carbon productivity growth required if
ambitious targets for greenhouse gas emission reductions are to be achieved given
(country-specific) projected economic growth rates. To do this, the IPCC reduction
scenarios which envisage eventual stabilisation of atmospheric emissions at 450 ppm
CO2e are used. This requires global growth in emissions to peak at around 25 per
cent above 1990 levels by 2020 with differential targets for developed (Annex I) and
industrialising (non-Annex I) countries. Without early action, the economies with the
largest gaps are likely to find the transition to an emissions constrained world
relatively more difficult and costly both economically, and potentially also socially
and politically.
Figure 3 Only two G20 countries are currently improving carbon productivity
quickly enough to meet carbon reduction targets
Source: Vivid Economics Analysis of World Bank data
Two countries are currently improving their carbon productivity at a rate which is
high enough to meet the global emissions reduction goal, given expected growth
rates of population and GDP: Mexico and Argentina. Both these countries should
-2%
-1%
0%
1%
2%
3%
4%
5%
Turn
aro
un
d i
n c
arb
on
pro
du
ctiv
ity
req
uir
ed
to
me
et
targ
et
The Climate Institute and E3G Low carbon competitiveness
vii
experience continuing increases in carbon productivity, due to a combination of
carbon efficient growth and lower emission reduction targets by virtue of being non-
Annex I countries. China, South Africa and Germany are close to being on track.
Other countries need to improve their rate of carbon productivity growth. The
largest turnarounds in carbon productivity are required by Australia, Turkey, Russia
and Saudi Arabia.
The large number of rapidly industrialising nations at the top of this index shows
that some countries are growing fast and are doing so in a way consistent with the
projections for emissions underpinning these IPCC scenarios. Annex I countries
generally have more work to do than non-Annex I countries, mainly due to the
tougher presumed emissions targets. However this pattern is not universal. Some
Annex I countries, Germany and the UK, are close to making sufficient progress.
Conversely, despite less strict emissions targets, some non-Annex I countries, such as
Saudi Arabia, require major changes of direction.
This report shows that there is a wide range of performance amongst the G20
countries when it comes to low carbon competitiveness. These performances reflect
different starting points and levels of national ambition, but show that there is
potential for all countries to improve and move towards low carbon best practice.
Improvements in carbon productivity need not be at the expense of economic
growth. This is true in both developed and industrialising economies. Countries as
diverse as Germany, South Africa and Mexico have all shown an ability in the recent
past to decouple economic growth from carbon emissions. They demonstrate what is
possible for other G20 countries and provide confidence that a global deal to reduce
emissions is achievable without compromising on growth and covering developed
and industrialising nations.
However, much remains to be done. Only two G20 countries are currently on a
trajectory consistent with stabilisation of atmospheric emissions of CO2e at 450 ppm.
While a number of other countries, including China, need only reasonably modest
changes to rectify this, many other countries remain well off the pace required if
dangerous climate change is to be avoided. The longer these countries take to achieve
these turnarounds, the more costly the eventual transition will be.

The Climate Institute and E3G Low carbon competitiveness
viii
Contents
1 Introduction 1
2 Defining low carbon competitiveness 2
3 The low carbon competitiveness index 7
4 The low carbon improvement and low carbon gap indices 19
5 Conclusions 32
Appendix A: Frequently asked questions 33
Appendix B: Further details on econometric estimation 36
Appendix C: Productivity measures in a low carbon world 39
Appendix D: Calculation of carbon efficiency of growth 42
References 49
List of tables
Table 1 A total of nineteen variables were included in the index 10
Table 2 The future prosperity category has the highest weight in the index 11
Table 3 France comes top of the low carbon competitiveness index 12
Table 4 Rankings can differ substantially between the three categories 17
Table 5 The performance of countries across the low carbon competiveness and
low carbon improvements indices varies significantly 26

The Climate Institute and E3G Low carbon competitiveness
ix
Table 6 There are a range of scenarios associated with long term stabilisation of
greenhouse gas concentrations in the atmosphere at 450 ppm 28
Table 7 With specific estimates of GDP growth rates, it is possible to calculate the
required improvements in carbon productivity required if countries are
to meet ambitious 2020 emissions targets 29
Table A1 A number of variables were excluded from the index following the
econometric analysis 38
Table A2 Standard error of the estimate of current trajectory of carbon productivity
improvements, by country 44
List of figures
Figure 1 European and East Asian countries do well in the low carbon
competiveness index iv
Figure 2 Germany comes top of the low carbon improvement index, but some
industrialising economies also perform well v
Figure 3 Only two G20 countries are currently improving carbon productivity
quickly enough to meet carbon reduction targets vi
Figure 4 European and East Asian countries are ranked highly in the low carbon
competitiveness index 7
Figure 5 The low carbon competitiveness ranking is different from the World
Economic Forum competitiveness ranking 18
Figure 6 Countries with high carbon productivity also have high GDP per capita 21
Figure 7 The relationship between carbon productivity and GDP per capita varies
widely across countries 23

The Climate Institute and E3G Low carbon competitiveness
x
Figure 8 Germany comes top of the low carbon improvement index, but some
industrialising economies also perform well 25
Figure 9 Only two G20 countries are currently improving carbon productivity
quickly enough to meet carbon reduction targets 30
Figure A1 Carbon productivity and GDP per capita on a logarithmic scale 43
Figure A2 Range estimates for the low carbon improvement index 45
Figure A3 The United Kingdom is on course to have the highest rate of carbon
productivity by 2020 45
Figure A4 Range estimates for low carbon gap index 48

The Climate Institute and E3G Low carbon competitiveness
1
1 Introduction A carbon3 constrained future will alter the economic position of every country, producing
winners and losers. The differential impact of these changes will mean that, along with
changes in production costs and consumer demands, global patterns of trade will shift.
Economic modelling has suggested that those countries that are relatively less emissions
intensive, or move first to reduce emissions, will gain a relative advantage as the world
reduces its greenhouse gas emissions (Commonwealth Treasury, 2008). In sum, countries‟
competitiveness will change. Although competitiveness is a complicated concept and,
moreover, ideas of competitiveness themselves also need to adapt to a low carbon world,
countries which are prepared for these shifts are likely to be better placed to secure the well-
being of their residents.
It is important to acknowledge both the conceptual difficulties of defining competitiveness at
the national level, as well as the challenges of capturing this concept through the use of
indices. Nonetheless, this report attempts to take account of these challenges. It uses a data-
driven approach to defining competitiveness in practice, using econometrics where
appropriate, to help assist in the construction of the indices. Moreover, it seeks to expand the
conceptual boundaries of competitiveness by explicitly bringing a much-need focus on
efforts to shift to a low emission world and considering both developed and developing
countries in a comparable action framework.
The next section of this report will discuss and define the concept of competitiveness in a low
carbon future. The definition of low carbon competitiveness for a country will be taken to be
the ability of a country to generate material prosperity (proxied by economic output) to its
residents in a carbon constrained world. Climate change is a long-term problem where
actions can have impacts both now and in the future. As such, it is of interest to consider
how well countries are positioned currently, the rate at which they are changing their
position and the rate at which they need to change in order to meet stabilisation scenarios.
Section 3 considers the first of these, while Section 4 presents a measure of the growth rate of
carbon productivity and sets this in a context of what is required for an eventual stabilisation
at 450 ppm CO2e. Technical details and further detailed commentary on the methodological
approach are contained in a series of appendices.
3 Throughout the document, except where stated, references to carbon (dioxide) relate to emissions of the six
greenhouse gases identified by the IPCC, excluding those from the land use change and forestry sector,
expressed on a CO2e basis.
The Climate Institute and E3G Low carbon competitiveness
2
2 Defining low carbon competitiveness
2.1 Standard definitions of competitiveness
Before turning to the specific question of how to define „low carbon competitiveness‟, it is
necessary to first understand the different meanings that are often attached to the word
„competitiveness‟.
At a firm level, competitiveness may refer to the relative costs of production of the same
good as compared to other firms; however, this definition does not translate easily to the
level of a country. If an individual firm has lower production costs than another it will,
depending on the structure of the market, take market share off the higher cost firm. The
same is not true at a country level. This is encapsulated by the critique of Krugman (1993):
“...international trade is not about competition, it is about mutually beneficial exchange. Even
more fundamentally...imports, not exports, are the purpose of trade. That is, what a country
gains from trade is the ability to import things it wants. Exports are not an objective in and of
themselves: the need to export is a burden that a country must bear because its import
suppliers are crass enough to demand payment.”
The difference arises because of the distinction between absolute and comparative advantage
in international trade. Even if one country has a lower (absolute) cost of producing every
good, it will still gain from trade with another country, with higher costs, provided the more
costly country has different relative production costs between goods. However, while the
implications of language need to be considered, the Krugman critique does not mean that
countries all achieve the same benefits from trade, or that changes in economic conditions do
not change the absolute and relative gains that can be made.
One objective of economic policy in a country should be to provide well-being to its current
and future residents. Trade is useful to a country in that it allows its residents to have a
higher standard of living than they could enjoy if they had to rely solely on domestically
produced goods. It is for this reason that trade is so closely associated with international
competitiveness. Measuring competitiveness as being related to the standard of living is a
natural way to consider the topic at the country level. The World Economic Forum, in The
Global Competitiveness Report 2008-2009, notes that a nation‟s level of competitiveness reflects
The Climate Institute and E3G Low carbon competitiveness
3
“the extent to which it is able to provide rising prosperity to its citizens.” This is also the
meaning ascribed to competitiveness at the level of the country in this report.
2.2 Definitions of competitiveness need to be adapted for a low carbon future
Climate change has the potential to have significant impacts on living standards, not only
through climatic changes but also because of shifts in demand from high carbon intensity
goods to low carbon intensity goods. There will be significant economic opportunities and
costs that will result from such a shift, and countries will differ in their level of exposure to
these risks and their capacity to exploit these opportunities. Those nations that can produce
goods and services with a lower emissions intensity will likely generate higher profits for
their goods because, assuming that there is at least an implicit price for carbon emissions,
they will enjoy lower production costs. This is one important basis for being concerned about
competitiveness in a low carbon future.
In a more specific way, we propose to use the level of Gross Domestic Product (GDP)4 per
tonne of emissions (called „carbon productivity‟ by some, for example, McKinsey Global
Institute (2008)) as the starting point for assessing a country‟s carbon competitiveness. While
it is widely recognised that GDP is an imperfect measure of overall prosperity (Nordhaus
(2000), Neumayer (2001), Commonwealth of Australia (2008)), it is undoubtedly a major
determinant of living standards, particularly in the post-WWII era (Easterlin (2000)). While
acknowledging its imperfections, this report uses GDP as a proxy for prosperity.
Under the presumption that global emissions will be constrained in the future, those
countries which can produce more GDP from each tonne of emissions will be able, other
things being equal, to provide a greater level of well-being to their residents than those
countries that produce less GDP for each tonne of emissions. This logic holds regardless of
the distribution of any global emissions cap across countries.5 Climate science suggests that it
is the total level of emissions that needs to be limited, and so the level of prosperity that can
be delivered is limited by the relationship between prosperity and a tonne of emissions.
4 GDP is a measure of the market value of the output (goods and services) generated by an economy which is
exchanged through market transactions.
5 While the allocation of emission allowances under a global cap is an allocation of valuable property rights, and
so is effectively a distribution of wealth that will affect the level of wealth in a particular country, for any given
level of allocation, a particular country will be better placed to generate material prosperity if it can produce
more GDP for each unit of allowances it is allocated.

The Climate Institute and E3G Low carbon competitiveness
4
The baseline for the analysis is low carbon competitiveness under a universal carbon
constraint. Such a carbon constraint need not be explicit nor necessarily implemented
through taxation or emissions trading. It is, however, equivalent to an assumption that all
countries take comparable action such that there is no incentive to shift emissions from one
jurisdiction to another solely as a result of climate policy.
This is the adopted baseline because preparation for a low carbon future that is consistent
with avoiding dangerous climate change will require universal action, and in order to
abstract from any transitory effects due to different countries regulating carbon emissions
before others. This is not to suggest that such matters are not of importance to the broader
debate. Issues of trade exposure, often referred to as carbon leakage, can have large impacts
on the effectiveness of emissions reduction schemes in the short run and the incentives of
countries or regions to adopt or strengthen them. For example, see Vivid Economics (2008a)
for a discussion of these issues in relation to aviation in the EU ETS or Reinaud (2008) in the
context of heavy industry more generally.
However, in the long-run, as the world takes more ambitious action on climate change (such
as wider application of carbon pricing or emissions trading schemes), disadvantages from
being an early mover may be reduced and even reversed if, for example, there are
advantages by way of intellectual property development or the early capture of lucrative
new green markets. In short, this report is focused on positioning for long-run
competitiveness, and the analysis is therefore conducted assuming that the future into which
we are projecting carbon competitiveness is one in which there is a universal, or near
universal, carbon constraint.
2.3 Assessing low carbon competitiveness
This report constructs three measures to assess low carbon competitiveness.
The low carbon competitiveness index captures the capacity of each country to generate
material prosperity to its residents in a low carbon future, based upon each country’s
current policy settings and indicators. Variables and weightings for the index are chosen on
the basis of a statistical analysis of the relationship between various indicators and carbon
productivity. Variables are included in the index if they are found to have a sufficiently
strong statistical relationship to carbon productivity, and their weighting in the index is
proportionate to the size of their impact.
The advantage of constructing an index which considers a large number of variables and
weights them according to their association with carbon productivity is twofold.
The Climate Institute and E3G Low carbon competitiveness
5
First, while synthesising numerous pieces of information into an overall
performance measure, it also allows identification of reasons for divergent
performance.
Second, it also allows identification of where a country has developed policies, or its
economy has otherwise changed, in such a way that it will be able to provide more
prosperity for its residents in a low carbon world but which due to the lagging
nature of carbon emissions data may not be fully captured in the data.
Despite the advantages of developing an index such as this, there are also advantages of
directly considering differences in carbon productivity between countries. One of the most
important of these is that the absolute movements of countries over time can be observed
and compared against each other and against policy objectives. Both the science of climate
change (CO2 is a stock pollutant) and policy interest dictate that as much, if not more, focus
should be placed on a country‟s direction of travel. A country may currently be highly
carbon competitive, in that it is able to generate high levels of GDP per tonne of emissions,
but doing little to improve its ability to generate GDP from each tonne of emissions.
Conversely, a country may not be able to currently generate much prosperity for its residents
from each tonne of carbon but nonetheless be on a trajectory that will significantly improve
its carbon competitiveness.
In fact, arguably more important for prosperity than changes in carbon productivity per se
are changes in carbon productivity as GDP per capita increases. Although growth rates will
differ, it is likely that all countries of the G20 will experience increases in the level of GDP
per capita over the coming decades. Thus a key consideration is whether countries are able
to decouple economic growth, as defined by GDP per capita, from carbon intensity, as
defined by GDP per tonne of emissions. Countries which are increasing carbon productivity
faster than they are increasing GDP per capita will be experiencing both higher levels of
prosperity and lower levels of emissions per capita.
Consequently, the low carbon improvement index captures the rate at which countries are
shifting to a low carbon economy and, thereby, improving their ability to be competitive.
This uses statistical analysis of the recent historical relationship between carbon productivity
and GDP per capita to estimate, for each country, the rate at which it is has been able to
reduce the carbon intensity of its economy as it grows.
The final measure, the low carbon gap index, considers the turnaround or improvement
required in carbon productivity growth if ambitious global targets on emission reductions
are to be met. This measures the gap between a country‟s current rate of carbon productivity

The Climate Institute and E3G Low carbon competitiveness
6
growth and that which is needed if these targets are to be met, at the same time that the
country grows its economy as currently projected. It can be considered a measure of how far
above or below a country is from a „comparable action‟ benchmark.
The Climate Institute and E3G Low carbon competitiveness
7
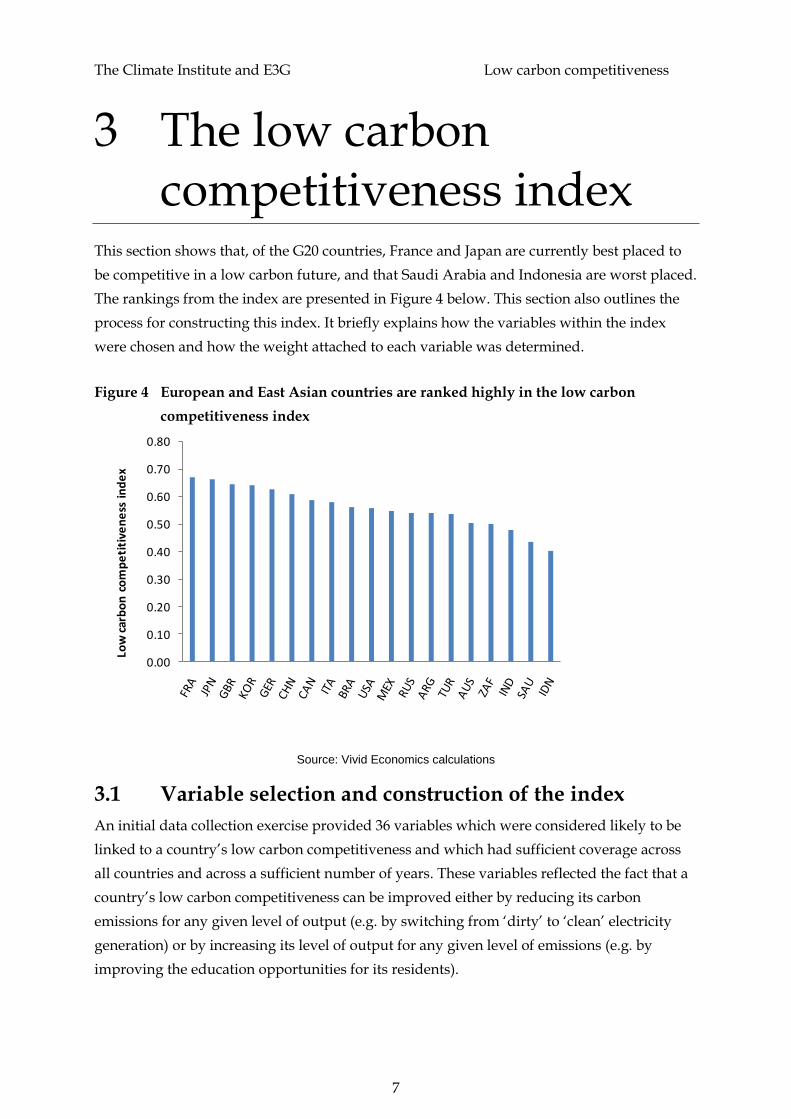
3 The low carbon competitiveness index
This section shows that, of the G20 countries, France and Japan are currently best placed to
be competitive in a low carbon future, and that Saudi Arabia and Indonesia are worst placed.
The rankings from the index are presented in Figure 4 below. This section also outlines the
process for constructing this index. It briefly explains how the variables within the index
were chosen and how the weight attached to each variable was determined.
Figure 4 European and East Asian countries are ranked highly in the low carbon
competitiveness index
Source: Vivid Economics calculations
3.1 Variable selection and construction of the index
An initial data collection exercise provided 36 variables which were considered likely to be
linked to a country‟s low carbon competitiveness and which had sufficient coverage across
all countries and across a sufficient number of years. These variables reflected the fact that a
country‟s low carbon competitiveness can be improved either by reducing its carbon
emissions for any given level of output (e.g. by switching from „dirty‟ to „clean‟ electricity
generation) or by increasing its level of output for any given level of emissions (e.g. by
improving the education opportunities for its residents).
0.00
0.10
0.20
0.30
0.40
0.50
0.60
0.70
0.80
Low
car
bo
n c
om
pe
titi
ven
ess
in
de
x
The Climate Institute and E3G Low carbon competitiveness
8
The variables were assigned to one of three categories that were chosen to represent
different, although clearly related, elements which will determine performance in a low
carbon future: sectoral composition, early preparation and future prosperity.
The sectoral composition category captures how well, or otherwise, the
composition of the economy is currently structured towards less emissions intensive
activities. It is included because the relative prices of output in different industries
will change systematically. Countries whose economies are more heavily weighted
towards sectors which will experience lower demand will be relatively worse off.
For example, the measure of the balance of emissions embodied in trade, similar to
the carbon intensity of exports, developed by Peters and Hertwich (2008) is part of
this category, as is transport sector energy consumption.
Early preparation variables include indicators reflecting the steps that countries
have already taken to move towards a low carbon economy. They are included for
two reasons. First, the cost of using and developing low carbon technologies can be
expected to fall over time as more experience is gained. This effect is also known as
learning by doing and is a well established phenomenon that has been observed in
many industries, notably in the power sector (McDonald and Schrattenholzer
(2001)). Countries which are early adopters of energy efficient or low carbon
technologies will experience higher rates of learning and so will be better placed to
generate material prosperity in the future. Second, the costs of shifting to a high
carbon economy will be higher as the period over which the shift has to occur
becomes shorter. For example, shifting to low carbon electricity is more costly over a
shorter time period because the capital in existing power stations has to be retired
early. For these two reasons, countries which take early action will have higher
standards of living in a low carbon future. The carbon intensity of electricity and
investment in sustainable energy businesses are examples of indicators in this
category.
The final category consists of variables which will determine future prosperity
through their impact on the level of production of goods and services (broadly
defined) per capita. The future level of production will be determined by the future
level of capital in the economy. Accordingly, we include measures of the rate of
change of human capital, physical capital and natural capital from the World Bank
(2006). The measure of natural capital captures the change in a country‟s stocks of
resources, such as agricultural land, minerals and forests. If countries deplete their
stock of natural capital, it reduces their capacity to produce goods and services

The Climate Institute and E3G Low carbon competitiveness
9
(such as timber or clean water) from the natural environment in the future. The level
of GDP per capita is included, as prosperity is highly persistent over time, as is
population growth, to reflect the fact that countries with higher populations will
need to divide the output from the fixed stock of emissions over a greater number of
people.
With this data, statistical techniques were used to establish which of these variables, in the
recent past, has had the strongest association with low carbon competitiveness - defined as
GDP per tonne of emissions in this report. It should be emphasized that association does not
necessarily imply causation: in many cases the variables should be considered as proxies for
the underlying, but more difficult to measure, driver of carbon productivity; the efficiency of
oil refining can be seen as a proxy for the efficiency of the industrial sector as a whole, while
the percentage of electricity distribution losses is a proxy for the overall sophistication of the
electricity grid (necessary if decentralized clean electricity generation is to be effectively
harnessed).
Those variables which were both deemed to be positively associated with a good
performance and reached a certain threshold of significance were then selected. These
variables are presented in Table 1. The variables which were omitted as a result of this
process are in Table A1 of Appendix B.
In order to translate these criteria into a single index, weights need to be assigned to each
component. This is not a straightforward task, and there is no universally accepted method
for doing this (see Morse and Fraser (2005) and Esty et al (2005) for a discussion of some of
the issues). The approach taken by this report is to use the econometric analysis to
understand the relative importance of each individual variable within the index. As each
individual variable is allocated to one of the three categories, the appropriate weight for each
category can be ascertained as the sum of the individual weights of its component indicators.
Then, within each category, all indicators have been weighted equally. The weights derived
from this exercise are presented in Table 2. Appendix B discusses the approach taken to the
weighting in more detail.
Due to the econometric approach taken to the weightings the index is cardinal; that is, the
size of the gap between countries provides information on the relative distance between
them. Because the values of the indicators were all transformed to be between zero and one,
a difference of 0.01 in the index could be interpreted as the distance a country would move if
all of its indicators moved one per cent closer to best practice.

The Climate Institute and E3G Low carbon competitiveness
10
Table 1 A total of nineteen variables were included in the index
Variable Definition Source Is higher better?
Category
Transport sector energy consumption per capita
„000 tonnes of oil equivalent (toe) per capita
International Energy Agency (IEA)
No Sectoral
Composition
Deforestation rate % of total forest cover World Development
Indicators (WDI) No
Sectoral composition
Share of high technology exports
% of total exports WDI Yes Sectoral
Composition
Size of road transport sector
Cars per 1000 people WDI No Sectoral
Composition
Balance of emissions embodied in trade
as % of total emissions from production
Peters and Hertwich (2008)
No Sectoral
Composition
Air freight Million tonne-kilometres WDI No Sectoral
Composition
Clean energy production % of total energy use IEA Yes Sectoral
Composition
Efficiency of oil refining Net energy input into oil
refineries per unit of output („000 toe)
IEA No Early
Preparation
New sustainable energy investment
$US equivalent listed on the local stock exchange
New Energy Finance Yes Early
Preparation
Electricity distribution losses
% of total electricity generated
IEA No Early
Preparation
Annual growth in greenhouse gas emissions
Change in emissions (%) World Resources Institute (WRI)
No Early
Preparation
Price of diesel fuel $US/litre GTZ Yes Early
Preparation
Carbon intensity of electricity
CO2 per kWh WRI No Early
Preparation
Human capital Education expenditure as
% of GNI WDI Yes
Future Prosperity
Physical capital Rate of fixed capital
formation as % of GNI WDI Yes
Future Prosperity
Natural capital Depreciation as a % of
GNI WDI No
Future Prosperity
Population growth % Penn World Table No Future
Prosperity
GDP per capita 2000 $US per person Penn World Table Yes Future
Prosperity
Cost of business start-up procedures
% of GNI per capita WDI No Future
Prosperity
Source: World Development Report 2005, The World Bank, © 2005; International Energy Agency; World
Resources Institute; New Energy Finance; GTZ; Penn World Table and Peters and Hertwich (2008)
The Climate Institute and E3G Low carbon competitiveness
11
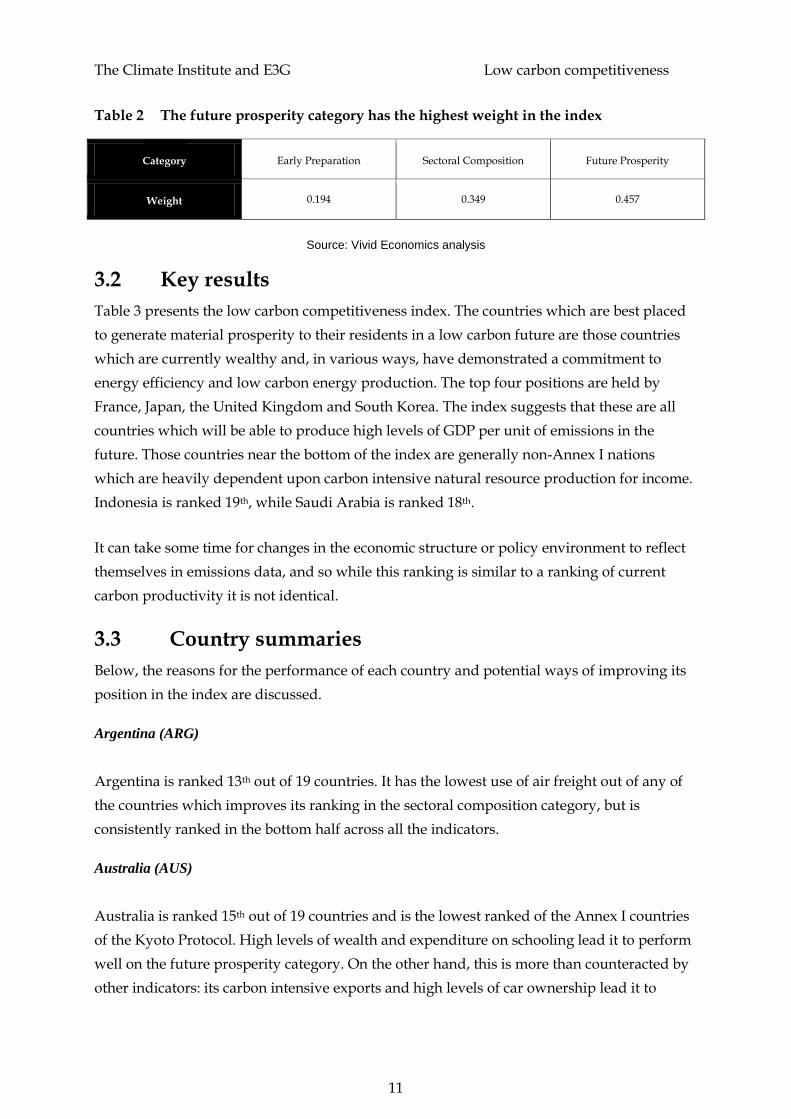
Table 2 The future prosperity category has the highest weight in the index
Category Early Preparation Sectoral Composition Future Prosperity
Weight 0.194 0.349 0.457
Source: Vivid Economics analysis
3.2 Key results
Table 3 presents the low carbon competitiveness index. The countries which are best placed
to generate material prosperity to their residents in a low carbon future are those countries
which are currently wealthy and, in various ways, have demonstrated a commitment to
energy efficiency and low carbon energy production. The top four positions are held by
France, Japan, the United Kingdom and South Korea. The index suggests that these are all
countries which will be able to produce high levels of GDP per unit of emissions in the
future. Those countries near the bottom of the index are generally non-Annex I nations
which are heavily dependent upon carbon intensive natural resource production for income.
Indonesia is ranked 19th, while Saudi Arabia is ranked 18th.
It can take some time for changes in the economic structure or policy environment to reflect
themselves in emissions data, and so while this ranking is similar to a ranking of current
carbon productivity it is not identical.
3.3 Country summaries
Below, the reasons for the performance of each country and potential ways of improving its
position in the index are discussed.
Argentina (ARG)
Argentina is ranked 13th out of 19 countries. It has the lowest use of air freight out of any of
the countries which improves its ranking in the sectoral composition category, but is
consistently ranked in the bottom half across all the indicators.
Australia (AUS)
Australia is ranked 15th out of 19 countries and is the lowest ranked of the Annex I countries
of the Kyoto Protocol. High levels of wealth and expenditure on schooling lead it to perform
well on the future prosperity category. On the other hand, this is more than counteracted by
other indicators: its carbon intensive exports and high levels of car ownership lead it to

The Climate Institute and E3G Low carbon competitiveness
12
Table 3 France comes top of the low carbon competitiveness index
Country Rank Index Value Country Rank Index Value
France 1 0.67 Mexico 11 0.55
Japan 2 0.66 Russia 12 0.54
United Kingdom 3 0.64 Argentina 13 0.54
South Korea 4 0.64 Turkey 14 0.54
Germany 5 0.63 Australia 15 0.50
China 6 0.61 South Africa 16 0.50
Canada 7 0.58 India 17 0.48
Italy 8 0.58 Saudi Arabia 18 0.43
Brazil 9 0.56 Indonesia 19 0.40
USA 10 0.56
Source: Vivid Economics analysis based on various data including New Energy Finance
perform worst in the sectoral composition category. Likewise, its carbon intensive electricity
sector and high consumption of transport fuels contribute towards a lower half ranking in
the early preparation category.
Brazil (BRA)
Brazil ranks in the middle, coming in at 9th place. Its performance is negatively affected by its
low investment in physical capital, and high deforestation and population growth rates. This
is partly offset by the fact that it has the lowest CO2 intensity of electricity production.
Canada (CAN)
Canada is ranked 7th on the basis of a strong all-round performance in the early preparation
and future prosperity categories. However, it is one of the lowest ranked countries in the
sectoral composition category. It is ranked in the top three countries for low emission
electricity, overall use of clean energy and efficiency of oil refining. It is a poor performer on
The Climate Institute and E3G Low carbon competitiveness
13
some other indicators though; in particular, Canada has a high level of transport sector
energy consumption and high levels of car ownership.
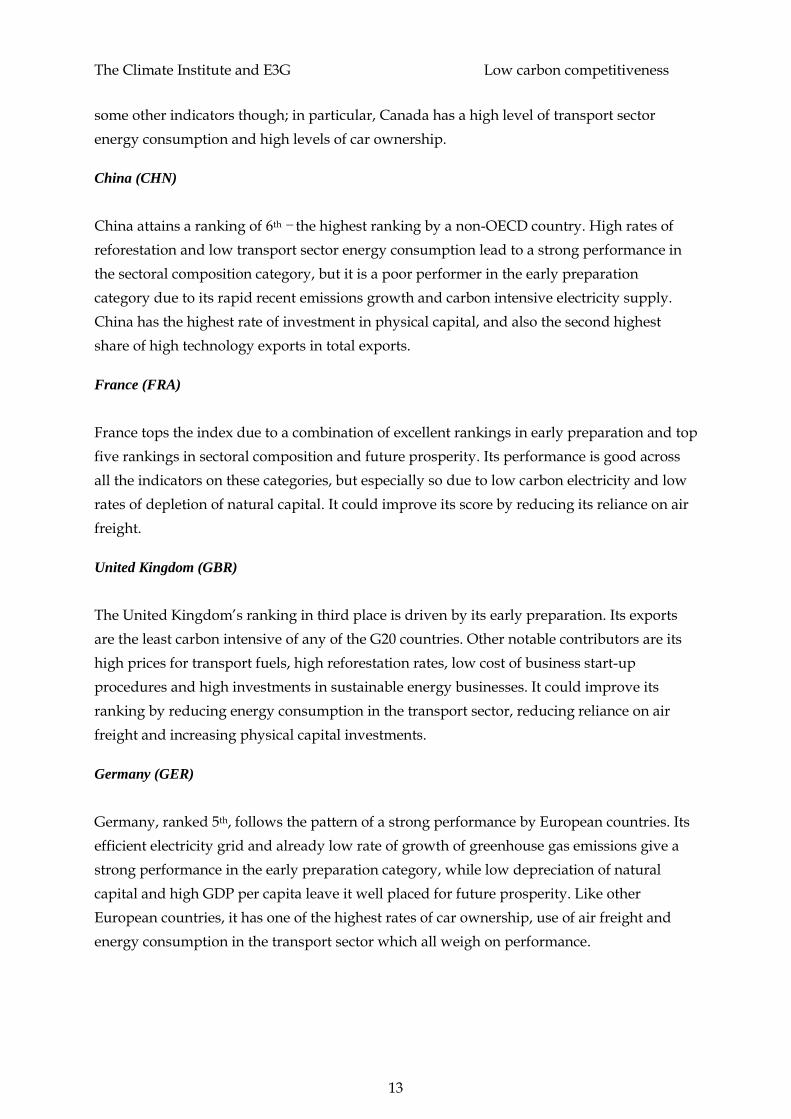
China (CHN)
China attains a ranking of 6th ― the highest ranking by a non-OECD country. High rates of
reforestation and low transport sector energy consumption lead to a strong performance in
the sectoral composition category, but it is a poor performer in the early preparation
category due to its rapid recent emissions growth and carbon intensive electricity supply.
China has the highest rate of investment in physical capital, and also the second highest
share of high technology exports in total exports.
France (FRA)
France tops the index due to a combination of excellent rankings in early preparation and top
five rankings in sectoral composition and future prosperity. Its performance is good across
all the indicators on these categories, but especially so due to low carbon electricity and low
rates of depletion of natural capital. It could improve its score by reducing its reliance on air
freight.
United Kingdom (GBR)
The United Kingdom‟s ranking in third place is driven by its early preparation. Its exports
are the least carbon intensive of any of the G20 countries. Other notable contributors are its
high prices for transport fuels, high reforestation rates, low cost of business start-up
procedures and high investments in sustainable energy businesses. It could improve its
ranking by reducing energy consumption in the transport sector, reducing reliance on air
freight and increasing physical capital investments.
Germany (GER)
Germany, ranked 5th, follows the pattern of a strong performance by European countries. Its
efficient electricity grid and already low rate of growth of greenhouse gas emissions give a
strong performance in the early preparation category, while low depreciation of natural
capital and high GDP per capita leave it well placed for future prosperity. Like other
European countries, it has one of the highest rates of car ownership, use of air freight and
energy consumption in the transport sector which all weigh on performance.
The Climate Institute and E3G Low carbon competitiveness
14
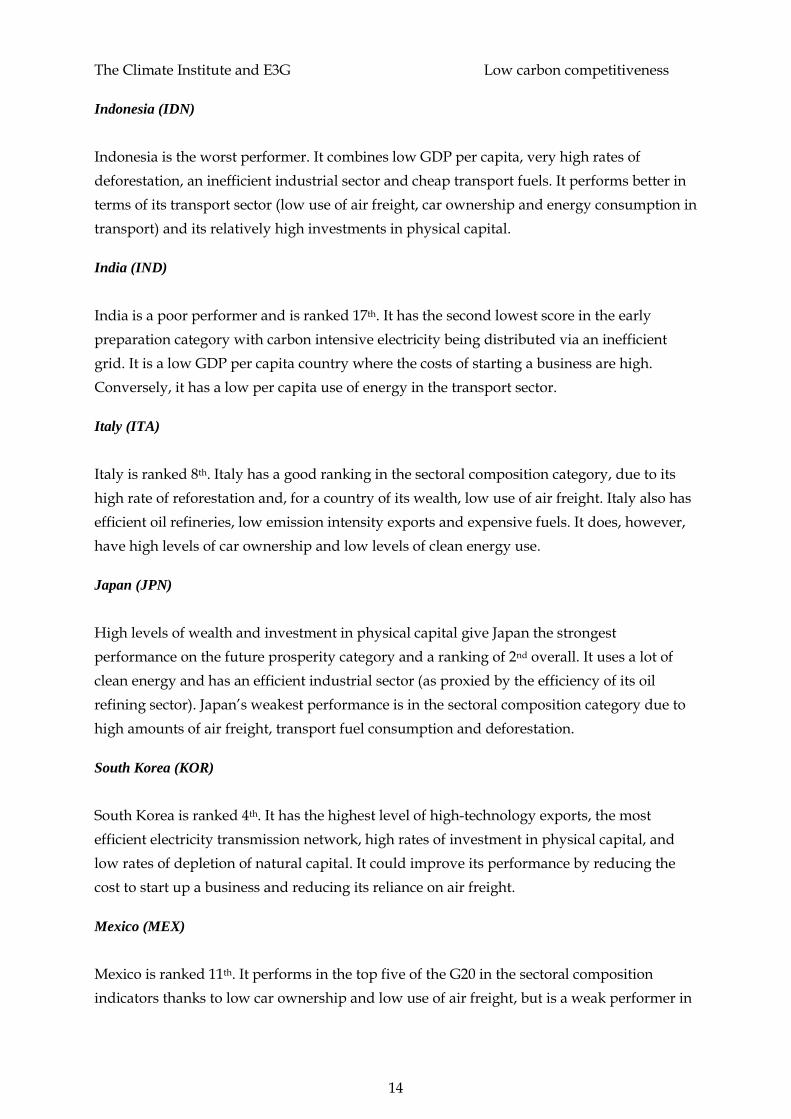
Indonesia (IDN)
Indonesia is the worst performer. It combines low GDP per capita, very high rates of
deforestation, an inefficient industrial sector and cheap transport fuels. It performs better in
terms of its transport sector (low use of air freight, car ownership and energy consumption in
transport) and its relatively high investments in physical capital.
India (IND)
India is a poor performer and is ranked 17th. It has the second lowest score in the early
preparation category with carbon intensive electricity being distributed via an inefficient
grid. It is a low GDP per capita country where the costs of starting a business are high.
Conversely, it has a low per capita use of energy in the transport sector.
Italy (ITA)
Italy is ranked 8th. Italy has a good ranking in the sectoral composition category, due to its
high rate of reforestation and, for a country of its wealth, low use of air freight. Italy also has
efficient oil refineries, low emission intensity exports and expensive fuels. It does, however,
have high levels of car ownership and low levels of clean energy use.
Japan (JPN)
High levels of wealth and investment in physical capital give Japan the strongest
performance on the future prosperity category and a ranking of 2nd overall. It uses a lot of
clean energy and has an efficient industrial sector (as proxied by the efficiency of its oil
refining sector). Japan‟s weakest performance is in the sectoral composition category due to
high amounts of air freight, transport fuel consumption and deforestation.
South Korea (KOR)
South Korea is ranked 4th. It has the highest level of high-technology exports, the most
efficient electricity transmission network, high rates of investment in physical capital, and
low rates of depletion of natural capital. It could improve its performance by reducing the
cost to start up a business and reducing its reliance on air freight.
Mexico (MEX)
Mexico is ranked 11th. It performs in the top five of the G20 in the sectoral composition
indicators thanks to low car ownership and low use of air freight, but is a weak performer in

The Climate Institute and E3G Low carbon competitiveness
15
the other two categories. Major contributors to its poor performance are high deforestation,
low prices for transport fuel and low efficiency in oil refining.
Russia (RUS)
Russia is ranked 12th in the index. Low business start-up costs and low use of air freight aid
performance, but carbon intensive exports, a high level of depletion of natural capital and
cheap transport fuels detract from its performance. It does, however, have a relatively low
carbon intensity of electricity production.
Saudi Arabia (SAU)
Saudi Arabia is ranked 18th. It has a weak performance across all categories and is the bottom
ranked country in a number of indicators including use of clean energy, price of transport
fuels, population growth, depletion of natural capital and share of high technology exports.
One exception to this is investment in human capital, the proportion of education
expenditure in GNI, for which Saudi Arabia ranks 1st.
Turkey (TUR)
Turkey is ranked 14th, just ahead of Australia. It performs well in terms of low transport
sector energy consumption, air freight and deforestation. Turkey has a poor performance in
the future prosperity category with low investment in education and high population
growth.
United States of America (USA)
The United States is ranked 10th; four places behind China and just in front of Mexico. It
achieves a top five ranking in the future prosperity category, but has the highest use of
energy in the transport sector and the highest use of air freight. It also performs poorly
because of high car ownership and relatively low levels of investment in physical capital. Its
ranking is boosted by having the highest amount of investment in sustainable energy
businesses and a high share of high technology exports, along with low business start-up
costs.
South Africa (ZAF)
South Africa comes near the bottom of the index at 16th out of 19. It has low use of air freight
and low transport sector energy consumption, but the most carbon intensive exports, high
carbon intensity electricity and the second lowest rate of investment in physical capital.
The Climate Institute and E3G Low carbon competitiveness
16
3.4 Sensitivity to category weightings
One of the most controversial aspects of constructing an index such as this is the choice of
weightings used to aggregate the individual indicators into a single index (Morse and
Fraser (2004)). The use of econometrics to guide the weightings has minimised the extent to
which they have been based upon subjective judgement; however, there are inevitably
different views that could be taken as to the weights which should be applied.
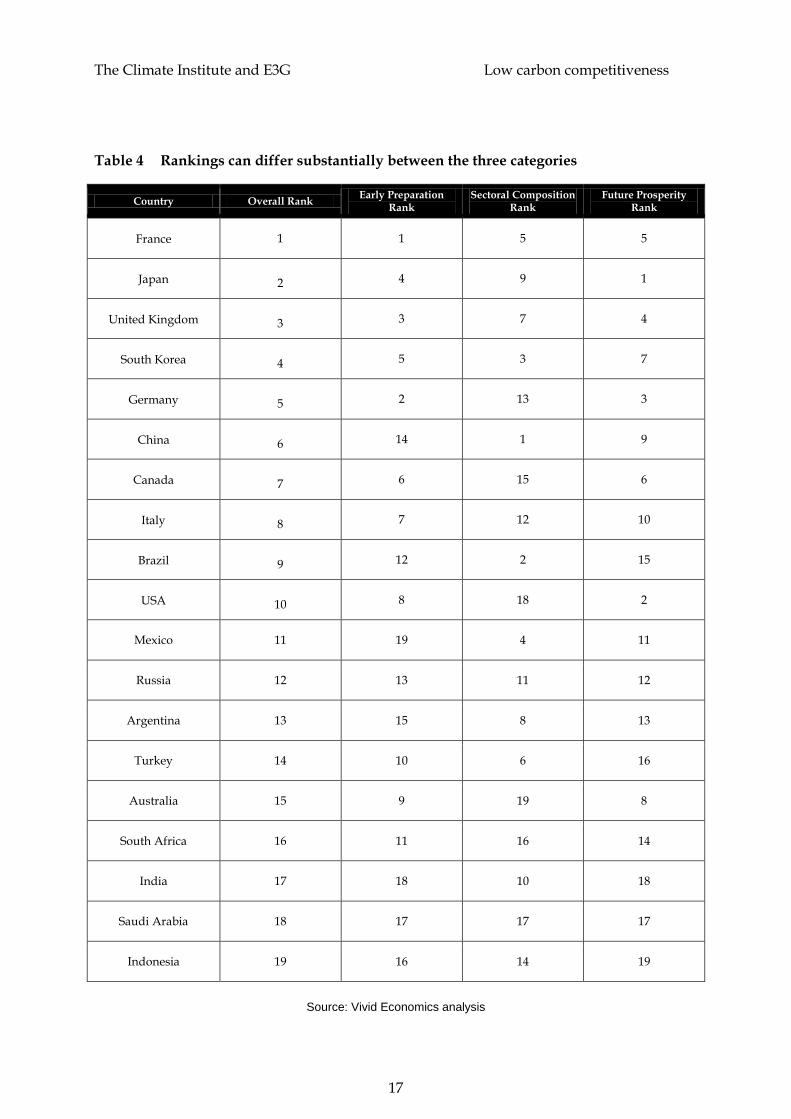
In order for the reader to be able to see the sensitivity of the results to differences in the
weightings, and also because it is of interest of itself, Table 4 presents the rankings for the
nineteen countries of the G20 separately for each of the four categories. It can be seen that
some countries perform similarly across all four categories: Saudi Arabia is an example of
this. Other countries, such as Brazil and China, perform very well in some categories and
poorly in others. The ranking of these latter countries will therefore be somewhat more
sensitive to the weightings applied.
The Climate Institute and E3G Low carbon competitiveness
17
Table 4 Rankings can differ substantially between the three categories
Country Overall Rank Early Preparation
Rank Sectoral Composition
Rank Future Prosperity
Rank
France 1 1 5 5
Japan 2 4 9 1
United Kingdom 3 3 7 4
South Korea 4 5 3 7
Germany 5 2 13 3
China 6 14 1 9
Canada 7 6 15 6
Italy 8 7 12 10
Brazil 9 12 2 15
USA 10 8 18 2
Mexico 11 19 4 11
Russia 12 13 11 12
Argentina 13 15 8 13
Turkey 14 10 6 16
Australia 15 9 19 8
South Africa 16 11 16 14
India 17 18 10 18
Saudi Arabia 18 17 17 17
Indonesia 19 16 14 19
Source: Vivid Economics analysis

The Climate Institute and E3G Low carbon competitiveness
18
3.5 Comparison with World Economic Forum competitiveness rankings
The World Economic Forum (WEF) compiles a well known index of competitiveness known
as the global competitiveness index. The WEF index does not explicitly consider climate
change as part of its analysis, although it does consider a country‟s capacity to implement
effective environmental policy. The WEF index also considers a wider range of countries.
Nonetheless, it is instructive to compare the two rankings. Figure 3 shows the rankings of
countries in the low carbon competitiveness index with the order in which the G20 countries
are ranked by the WEF. It can be seen that there is no systematic relationship between the
two, indicating that the two indices are capturing different elements of performance. The
countries that do relatively better in the low carbon competitiveness index are France, Japan,
the United Kingdom, South Korea, China, Italy, Brazil, Mexico, Russia, Argentina and
Turkey. The opposite is true for Germany, Canada, the USA, Australia, South Africa, India,
Saudi Arabia and Indonesia.
Figure 5 The low carbon competitiveness ranking is different from the World Economic
Forum competitiveness ranking
Low carbon
competitiveness
index ranking
World Economic
Forum
competitiveness
ranking
2009-2010
FRA USA
JPN GER
GBR JPN
KOR CAN
GER GBR
CHN AUS
CAN FRA
ITA KOR
BRA SAU
USA CHN
MEX ZAF
RUS ITA
ARG IND
TUR IDN
AUS BRA
ZAF MEX
IND TUR
SAU RUS
IDN ARG
Source: Vivid Economics and the World Economic Forum

The Climate Institute and E3G Low carbon competitiveness
19
4 The low carbon improvement and low carbon gap indices
The low carbon competitiveness index is designed to explain how well countries are
currently positioned to generate material prosperity to their residents in a low carbon future.
The capacity of countries to generate material prosperity in this context is not static,
however, and will be changing over time. This section considers the speed at which countries
are making these improvements and whether it is currently quick enough to meet the given
targets for emissions reductions.
The low carbon competitiveness index gives insight into what policies or other factors might
be leading a country to have a particularly strong or weak performance. In this section, the
rate of improvement in carbon productivity, and its relationship with economic growth, is
assessed directly rather than through examination of a series of indicators. This approach
gives the ability to assess a country‟s performance compared to its directly measured
outcomes and allows for an assessment of performance against policy goals.
As an intermediate step for framing the analysis on the rate of improvement, this section
begins by considering the existing relationship between carbon productivity and GDP per
capita levels (rather than their growth rates) in the G20 countries. As appendix C sets out in
more detail, while not perfect, GDP per capita is a reasonable proxy for conventional
measures of productivity.
Following this, the relationship of carbon productivity and GDP growth will be used to
construct the low carbon improvement index. In this index, countries are ranked according
to how much their carbon productivity changes as their economies grow. Germany ranks
first: a one percentage point increase in GDP per capita has historically been associated with
a nearly two percentage point increase in carbon productivity. This relationship is also
strong in Mexico and South Africa; although, these countries start from a position of lower
levels of carbon productivity. By contrast, Brazil and Saudi Arabia have only achieved
economic growth in the recent past through increasing the carbon intensity of their
economies.
The Climate Institute and E3G Low carbon competitiveness
20
The low carbon gap index considers whether countries are improving their carbon
productivity quickly enough if they are to meet their share of the required emissions
reductions for atmospheric concentrations of carbon dioxide emissions to be stabilised at
450 ppm. This takes account of the recent historical relationship between economic growth
and carbon productivity, projected future economic and population growth rates, and
differentiated responsibilities for emissions reductions between Annex 1 and Non-Annex 1
countries. The results of these calculations show that currently only Mexico and Argentina
are improving the carbon productivity of their economies sufficiently quickly as they grow.
All other countries in the G20 need to improve their carbon productivity growth rate.
4.1 The relationship between carbon productivity and GDP per capita
The relationship between carbon productivity and GDP per capita in 2005 is presented in
Figure 8. While there is a clear relationship between the two variables, the level of GDP per
capita is far from being a perfect predictor of a country‟s carbon productivity. The black line
in Figure 4 represents a line of best fit (i.e. a linear regression) relating GDP per capita to
carbon productivity. While the necessarily small sample size of 19 countries means there is a
need to be cautious with any interpretation of this line, it could be considered to represent
the performance that would be expected by an „average‟ country for any given level of GDP
per capita. The vertical distance between the line and each country‟s carbon productivity
could be thought of as indicating the effect of country-specific factors, such as climate change
policies.
Countries that had higher carbon productivity in 2005 than would be expected for their
income levels include Italy, France and Turkey. Conversely, Russia, Saudi Arabia and
Australia are among those countries which have lower levels of carbon productivity as
compared to other countries with similar levels of GDP per capita. The chart also illustrates
differences between countries with broadly similar prosperity levels. For instance, consider
two pairs of countries: Japan and the USA, and France and Australia. The two countries in
each of these pairs have broadly similar levels of GDP, yet in both cases the former countries
(Japan and France) extract about three times as much GDP for each tonne of emissions as the
latter countries (the USA and Australia). The comparison between Australia and Canada is
also instructive: although both are geographically large countries with resource intensive
economies (and hence both fall below the average line), Canada consistently achieves a
higher level of GDP per tonne of carbon for a given level of GDP per capita.

The Climate Institute and E3G Low carbon competitiveness
21
Figure 6 Countries with high carbon productivity also have high GDP per capita
Source: Vivid Economics calculations from World Bank and World Resources Institute data
It should be noted that countries which rank highly in the low carbon competitiveness index
of Section 3 are often, but not always located above the „average‟ line. This difference arises
because the current level of GDP is not the only factor which will determine future carbon
competitiveness. For example, China has a low level of GDP per capita, but very high levels
of investment in physical capital and low population growth, and so performs better in the
low carbon competitiveness index than Figure 6 would suggest if considered in isolation.
4.2 The relationship between carbon productivity growth and GDP per capita growth
While Figure 6 shows where countries were positioned at a particular historical point in
time, it is the rate at which carbon productivity changes with income which will have more
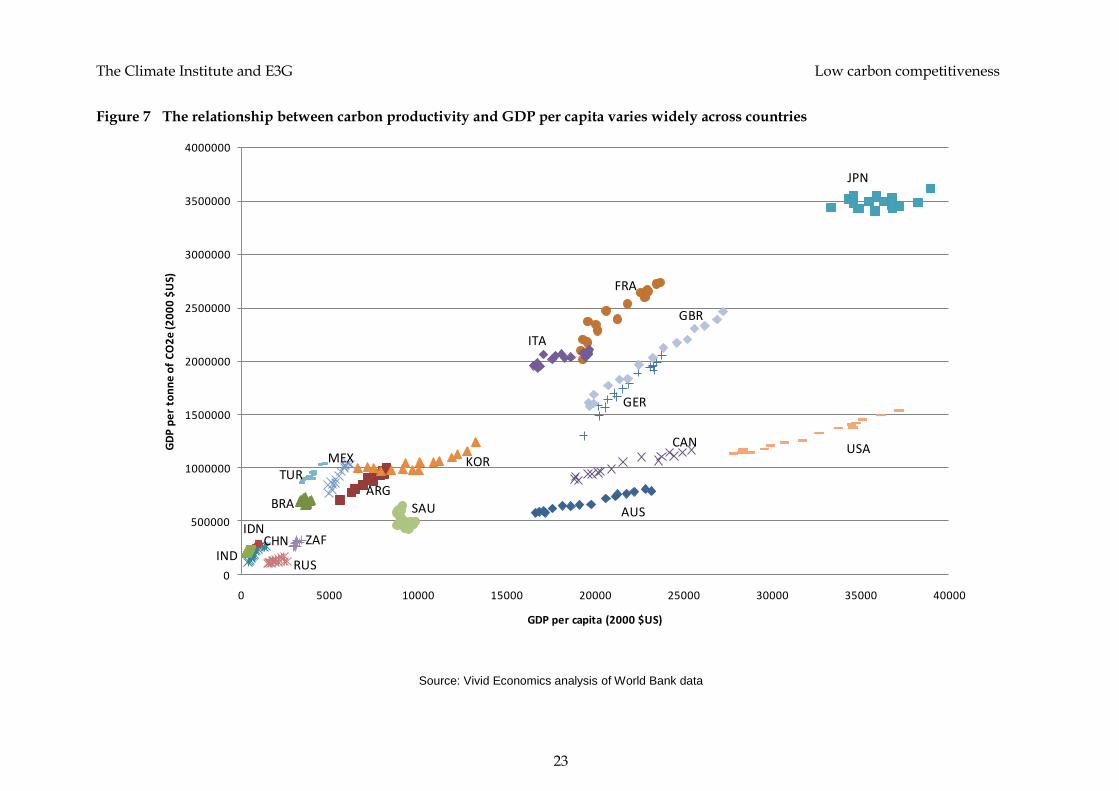
influence over the position of countries as they grow. Figure 7 captures this latter concept.
This figure presents a scatter plot with GDP per capita on the horizontal axis and GDP per
unit of emissions on the vertical axis. For every year from 1990 to 2005, each country is
represented by a labelled point. Therefore, by looking at the set of points belonging to each
ARGAUSBRA
CAN
CHN
FRAGBR
GER
IDNIND
ITA
JPN
KORMEX
RUS
SAU
TUR
USA
ZAF
0
0.5
1
1.5
2
2.5
3
3.5
4
0 5000 10000 15000 20000 25000 30000 35000 40000
GD
P p
er
ton
ne
of
CO
2e
in 2
00
5 (m
illio
n 2
00
0 $
US)
GDP per capita in 2005 (2000 $US)
The Climate Institute and E3G Low carbon competitiveness
22
country, that country‟s relationship between its economic growth and its carbon productivity
growth over that period can be ascertained.6
The figure shows, for instance, that while Japan has the highest measured carbon
productivity it has shown very little improvement in its carbon productivity over the last 15
years. Conversely, France, Germany and the UK have been able to combine GDP growth
with improvements in carbon productivity. Within non-Annex I countries, South Africa,
Mexico and China have combined economic growth with improvements in carbon
productivity while Indonesia and Turkey have been less successful. Saudi Arabia‟s recent
economic growth has been associated with an increase in carbon intensity.
Figure 7 also demonstrates that a number of countries have exhibited a relationship between
carbon productivity and GDP per capita which has been changing over time. China
experienced high rates of GDP per capita growth over the entire period, but, despite
achieving rapid carbon productivity growth between 1990 and 2000, its carbon productivity
has since stagnated. South Korea shows the opposite pattern: little carbon productivity
growth in the 1990s, but accelerating improvements since then. South Africa and Russia have
also had a period of low carbon improvement in the early 1990s and a period of faster
improvement since then. In these cases the low improvement occurred in a period when the
economy was contracting, and so reflects the fact that carbon emissions were not falling as
fast as GDP. Since both these countries resumed growth, carbon productivity has been
improving with GDP per capita. For all countries, the results discussed below relate to the
average performance over the period. For Russia and China, in particular, the calculations
will under- and over-state, respectively, their low carbon position if more recent
performance turns out to be sustained.
Garnaut et al (2008) emphasise the importance of recent changes to emissions growth
trajectories, and it is likely that at least some of the recent deteriorations in carbon
productivity, such as that of China, will be sustained unless concerted efforts are made by
national governments.
6 Figure A1, in Appendix D, presents this same graph on a logarithmic scale so that the cluster of countries at
low levels of GDP per capita can be more clearly seen.
The Climate Institute and E3G Low carbon competitiveness
23
Figure 7 The relationship between carbon productivity and GDP per capita varies widely across countries
Source: Vivid Economics analysis of World Bank data
0
500000
1000000
1500000
2000000
2500000
3000000
3500000
4000000
0 5000 10000 15000 20000 25000 30000 35000 40000
GD
P p
er
ton
ne
of
CO
2e
(20
00
$U
S)
GDP per capita (2000 $US)
JPN
USA
FRA
ITA
GBR
GER
CAN
AUSSAU
KOR
ARG
MEXTUR
BRA
ZAF
RUS
IDN
INDCHN

The Climate Institute and E3G Low carbon competitiveness
24
Using the data set out in Figure 7, it is possible to estimate the change in carbon productivity
that would be expected if GDP per capita were to increase by one per cent in each G20
country.7 The results of this calculation provide the low carbon improvement index and are
presented in Figure 6. This ranking corresponds to the rate at which countries are currently
changing their position.8 Countries with a value of one on this index are improving their
carbon productivity at the same rate at which they are experiencing increases in GDP per
capita. Those countries with an index value above one are improving carbon productivity at
a faster rate, while those below one are doing so at a slower rate. A negative value indicates
that carbon productivity is actually falling as GDP per capita is increasing.
Germany comes top of the low carbon improvement index, ahead of a group of countries
which comprises South Africa, Mexico and the United Kingdom. In Saudi Arabia and Brazil,
growth in GDP is associated with a decline in carbon productivity due to emissions intensive
nature of GDP per capita growth in those countries.
It is clear that performance under this measure is not simply a reflection of current wealth.
Some wealthy countries, such as Germany, have recently been able to achieve high rates of
carbon productivity growth as their economies have grown while others have not, such as
Japan. Likewise, Mexico has been able to achieve impressive rates of carbon productivity
growth as it has grown in a way that Brazil has failed to do.
Some countries, such as Germany, France and the UK, perform well both in the low carbon
competitiveness index and also in the low carbon improvement index. This indicates that
these countries are already in a good position, and are continuing to improve their carbon
productivity. Other countries, however, are ranked quite differently in the two indices. South
Africa and Mexico are two examples of this: both countries perform better in the low carbon
improvement index. Based upon their current performance on the indicators, neither country
is predicted to have high levels of carbon productivity in the near term. However, the fast
rate of growth in productivity, as their economies grow, suggests that these indicators are
likely to be improving over time and, if the index were to be recalculated in the future, both
7 For more details on this calculation, including standard errors, see Appendix D. As explained in more detail in
the appendix, the estimates are based on econometric estimation of the relationship throughout the period. This
significantly reduces the sensitivity of the results to the chosen (Kyoto protocol linked) start date.
8 It is important to note that this is not a measure of each country’s improvement in carbon productivity per se
but a measure of each country’s improvement in carbon productivity for a one per cent increase in GDP per
capita. In other words, it is a measure of the elasticity of carbon productivity growth with respect to economic
growth.

The Climate Institute and E3G Low carbon competitiveness
25
South Africa and Mexico would improve their rankings. Table 5 below shows the
performance of each country in both the low carbon improvement and the low carbon
competitiveness indices.
Figure 8 Germany comes top of the low carbon improvement index, but some
industrialising economies also perform well
Source: Vivid Economics analysis of World Bank data
The low carbon improvement index provides encouraging evidence that nations are able to
improve carbon productivity while still being able to grow their economies. The next sub-
section, setting out the low carbon gap index, considers whether this rate might be sufficient
to meet carbon reduction goals under some IPCC scenarios.
4.3 Further improvements in carbon productivity growth are required by most countries
The previous section analysed the rate at which the carbon productivity of the G20
economies has improved (or deteriorated) as their economies have grown (or shrunk) in the
recent past. The question that this begs is how many countries are currently improving
quickly enough to ensure that global targets for climate change are met given expectations of
future growth.
Considering the challenge that each country faces in a comparable way is a difficult topic
given the diversity of characteristics among the G20 nations. It is nonetheless important.
Those economies that need to make the greatest changes to their carbon productivity in the
low carbon transition will probably find the transition more difficult and costly than those
-2.0
-1.5
-1.0
-0.5
0.0
0.5
1.0
1.5
2.0
2.5
Rat
io b
etw
ee
n c
arb
on
pro
du
ctiv
ity
gro
wth
an
d G
DP
pe
r ca
pit
a gr
ow
th

The Climate Institute and E3G Low carbon competitiveness
26
Table 5 The performance of countries across the low carbon competiveness and low
carbon improvements indices varies significantly
Country
Rank in the low
carbon
competitiveness
index
Rank in the low
carbon
improvement
index
Country
Rank in the low
carbon
competitiveness
index
Rank in the low
carbon
improvement
index
France 1 5 Mexico 11 3
Japan 2 17 Russia 12 13
UK 3 4 Argentina 13 8
South Korea 4 15 Turkey 14 12
Germany 5 1 Australia 15 7
China 6 10 South Africa 16 2
Canada 7 9 India 17 11
Italy 8 14 Saudi Arabia 18 19
Brazil 9 18 Indonesia 19 16
USA 10 6
Source: Vivid Economics analysis
that need to make less dramatic changes. They will be disadvantaged for a number of
reasons.
Not only will their volume of emissions have to be reduced, but the rate at which
these reductions occur will need to accelerate. Achieving this over a shorter
timeframe will result in higher adjustment costs.9
This will necessitate a rapid increase in the price of carbon. This may be a rise in the
explicit price of carbon in those jurisdictions with institutions creating a carbon
9 Assuming adjustment costs are convex i.e. increasing in the magnitude of the adjustment.

The Climate Institute and E3G Low carbon competitiveness
27
price, or it may be a rise in the implicit price as regulations and pollution controls
become stricter.
An important component of these adjustment costs will be the need to retire large
parts of the country‟s capital stock early, as the carbon constraint will make it
economically unprofitable before the end of its physical life.
Consequently, the amount of resources that need to be allocated to investment will
be relatively greater than that in countries which started preparation earlier (and so
have a smaller stock of obsolete capital). A greater share of national income being
spent on investment will necessarily leave a smaller share available for private
consumption and Government expenditure.
As well as the obvious impacts from rapidly increasing carbon prices and relatively
higher adjustment costs in economies which face a bigger challenge, the uncertainty
such an environment generates may also have detrimental effects on both residents
and business in a country (Dixit and Pindyck (1994)). This could result in the
economy producing below its potential.
The challenge that all countries face will also be affected by the state of the international
carbon markets. The scope of international carbon markets will be an important determinant
of the price of abatement, particularly for those countries with higher cost domestic
abatement opportunities.
To undertake the analysis of the turnaround each country needs to make on a comparable
basis, a number of assumptions need to be made on required emissions reductions and GDP
growth rates.
In terms of emissions reductions, the scenario considered in this report is one of long-term
stabilisation of greenhouse gas concentrations in the atmosphere at 450 ppm CO2e, allowing
for a temporary overshoot. This scenario is taken from Table 5 of den Elzen and
Höhne (2008) which in turn is based upon IPCC and other published scenarios.10 Under this
pathway, global emissions levels in 2020 are 25 per cent above 1990 levels. The midpoint of
the range of emissions reduction for Annex I countries (as presented in den Elzen and
10 It should be noted that there is some recent evidence which indicates that the IPCC scenarios may be too
optimistic (Garnaut et al (2008)) and that the level of effort required will be much larger than implicitly assumed
by the IPCC scenarios.

The Climate Institute and E3G Low carbon competitiveness
28
Höhne (2008)) that corresponds to this scenario is 32.5 per cent. In turn, this implies that total
emissions growth in non-Annex I countries need to be limited to 108 per cent above 1990
levels.11 The required emissions reductions up to 2020 are assumed to take place at a
constant annual rate. All Annex I countries are assumed to have identical targets, as are all
non-Annex I countries. These scenarios are outlined in Table 6.
Table 6 There are a range of scenarios associated with long term stabilisation of
greenhouse gas concentrations in the atmosphere at 450 ppm
Scenario Global growth in emissions allowed to meet target from
1990 to 2020 (%)
Annex I countries target for emissions in 2020 relative to
1990 (%)
Implied non-Annex I target for emissions in 2020 relative to 1990 (%)
Weak +30.0 -25.0 +109.3
Midpoint +25.0 -32.5 +107.9
Tough +15.0 -40.0 +94.3
Source: den Elzen and Höhne (2008) and Vivid Economics calculations
GDP growth rates are actual rates from 1990 to 2005 and projections from the US Department
of Agriculture from then to 2020. These projections are, in turn, based upon forecasts by
Oxford Economic Forecasting, the World Bank and the IMF.
Table 7 outlines the assumptions on GDP per capita growth, and the required changes in
emissions and carbon productivity that flow from these, on a country-by-country basis. The
last column shows the required growth in carbon productivity that is required if the country
is to meet its share of the emissions target while growing its economy as anticipated.
Figure A2, in Appendix D, presents the range applicable to the calculations in this section.
This required improvement in carbon productivity can then be compared with the trajectory
that each country is currently on. As this measure takes into account different targets and
rates of growth for each country, it can be considered as providing a measure of „comparable
effort‟. This provides the low carbon gap index and is shown in Figure 9. A negative value of
this index implies that a country is already exceeding its implied target, while a positive
value shows the amount by which its rate of carbon productivity needs to increase in order
to do so. For this reason, the scale is inverted.
11 Using data from Table 4 of den Elzen and Höhne (2008). In the climate change literature, the usual reference
made in relation to targets of non-Annex I countries is ‘deviation from business as usual’. This report does not
make any assumptions about business as usual for non-Annex I countries, but directly calculates the limits on
emissions increases, on average, that will be required to meet the global cap for the given Annex I reductions.

The Climate Institute and E3G Low carbon competitiveness
29
Table 7 With specific estimates of GDP growth rates, it is possible to calculate the
required improvements in carbon productivity required if countries are to meet
ambitious 2020 emissions targets
Country
GDP growth (1990-2020 average)
(% p.a.)
Emissions growth allowed to meet target
(% p.a.)
Required growth in carbon productivity (1990-2020)
(% p.a.)
ARG 4.06 2.47 1.55
AUS 3.10 -1.30 4.46
BRA 3.31 2.47 0.82
CAN 2.57 -1.30 3.92
CHN 9.25 2.47 6.61
FRA 1.89 -1.30 3.13
GBR 2.24 -1.30 3.59
GER 1.68 -1.30 3.02
IDN 4.66 2.47 2.13
IND 6.73 2.47 4.15
ITA 1.22 -1.30 2.56
JPN 1.08 -1.30 2.41
KOR 4.77 2.47 2.25
MEX 3.03 2.47 0.54
RUS 2.03 -1.30 3.37
SAU 4.12 2.47 1.61
TUR 4.31 -1.30 5.68
USA 2.69 -1.30 4.04
ZAF 3.55 2.47 1.05
Source: Vivid Economics calculations
Mexico and Argentina are already doing more than is required to meet the given scenario.
However, this outperformance is for different reasons. In the case of Mexico, it has one of the
lowest required improvements in carbon productivity due to reasonably low anticipated
GDP growth coupled with its status as a non-Annex I country and strong carbon
productivity growth. Argentina‟s carbon productivity does not change as fast as Mexico‟s as
the economy grows, but the higher rate of GDP growth and lower rate of population growth
in Argentina means that its GDP per capita is increasing more quickly, and so more carbon
productivity growth is being observed currently.

The Climate Institute and E3G Low carbon competitiveness
30
Figure 9 Only two G20 countries are currently improving carbon productivity quickly
enough to meet carbon reduction targets
Source: Vivid Economics Analysis of World Bank data
The case of China is important. Its strong projected economic growth means that it needs to
achieve the largest improvement in carbon productivity of all of the G20 countries.
Nonetheless, it is a target that China is only just short of missing at present. If the country
was to return towards the rates of carbon productivity growth seen in the 1990s (rather than
that seen in the period between 2000 and 2005) then it would be able to meet its target.
Germany‟s performance is notable: despite being part of the Annex I grouping with a
tougher emissions target, it is very nearly on track to meet its target due to its high rates of
carbon productivity improvement.
The UK, Brazil and South Korea need to improve their rate of carbon productivity growth by
less than one per cent to meet their implied targets. If the recent acceleration in South Korea‟s
rate of carbon productivity growth is sustained, then this is likely to be achieved.
At the other end of the index, Turkey, Russia and Saudi Arabia face the biggest challenges to
meet their targets with all three countries needing to improve their growth rate of carbon
productivity by between 2.5 and 5 percentage points per annum in order to meet their
targets. Canada and Australia also require a large improvement in their carbon productivity
growth rate: around 2.4 percentage points.
A country‟s performance in the low carbon gap index reflects how its current trajectory of
GDP and carbon productivity growth (or decline) compares with that which is required for it
-2%
-1%
0%
1%
2%
3%
4%
5%
Turn
aro
un
d i
n c
arb
on
pro
du
ctiv
ity
req
uir
ed
to
me
et
targ
et

The Climate Institute and E3G Low carbon competitiveness
31
to meet the scenario set out in Table 6. A country will perform well in this index the stronger
the relationship between carbon productivity and GDP growth (as given by the low carbon
improvement index) and the less stringent is its target under the 450 ppm CO2e stabilisation
scenario. Consequently, compared to the low carbon improvement index, non-Annex I
countries typically do better under the low carbon gap index. Past and projected growth in
GDP per capita will also impact upon the turnaround in rates of carbon productivity growth
that are required, but the impact is not the same across countries.
The low carbon gap index shows that some countries are already doing enough to meet an
ambitious global climate change agreement. Indeed, most of the countries that are close to
the required improvements are industrialising countries. While this partly reflects the fact
that their emissions will be allowed to increase while those of Annex I nations have to fall, it
nonetheless suggests that the allocation of a global target to industrialising nations as
identified by the IPCC is not beyond their reach. Annex I countries generally have more
work to do than non-Annex I countries, with no Annex I country currently on track.
However, the cases of Germany and the UK offer optimism that, despite the relatively large
challenge for Annex I countries, it is a goal that is achievable. However, as well as these
positive conclusions, it also illustrates that there are a number of countries, including Turkey,
Russia, Saudi Arabia, Australia and Canada, that are currently falling well short of the
required improvement in carbon productivity and that require significant turnarounds in
their performance. The longer these countries take to achieve these turnarounds, the more
costly (economically, as well as socially and politically) the eventual transition will be.
The Climate Institute and E3G Low carbon competitiveness
32
5 Conclusions This report shows that there is a wide range of performance amongst the G20 countries when
it comes to low carbon competitiveness. These performances reflect different starting points
and different levels of national ambition, but show that there is the potential for all countries
to improve and move closer towards low carbon best practice. The low carbon
competitiveness index reveals that France is currently best placed to offer prosperity to its
residents in a low carbon world.
The low carbon improvement index reveals that improvements in carbon productivity need
not be at the expense of economic growth, in either developed or industrialising economies.
Countries as diverse as Mexico, South Africa and Germany have shown the ability to
decouple their economies from emissions growth. However, this experience has not been
matched by all countries of the G20. Indeed, Brazil and Saudi Arabia have increased the
carbon intensity of their economies as they have grown in the period between 1990 and 2005.
Despite the progress being made by some countries, significant further progress is required
if dangerous climate change is to be avoided. Only two countries of the G2O (Mexico and
Argentina) are currently improving at a fast enough rate to be consistent with the 450 ppm
CO2e IPCC scenarios used in this report. Although some of the other countries may be close,
they all have to increase the rate at which their economies are decarbonising. Generally
speaking, Annex I countries have further to go than non-Annex I countries. There are also
some countries, including Turkey, Russia, Saudi Arabia, Australia and Canada, that are
currently falling well short of the required improvement in carbon productivity and that
require significant turnarounds in their performance. The longer these countries take to
achieve these turnarounds, the more costly (both economically, as well as socially and
politically) the eventual transition will be.

The Climate Institute and E3G Low carbon competitiveness
33
Appendix A: Frequently asked questions
This appendix provides responses to some of the questions that naturally arise. Debate and
feedback on the methodology are welcomed.
Why have you assumed a global carbon price when it is a distant prospect?
We don‟t assume a global carbon price directly but, rather, assume a global emissions
constraint. We adopt this baseline because preparation for a low carbon future will require
universal action, and in order to abstract from any transitory effects due to different
countries regulating carbon emissions before others. This is not to suggest that such matters
are not of importance to the broader debate. Issues of trade exposure, often referred to as
carbon leakage, can have large impacts on the effectiveness of emissions reduction schemes
and the incentives of countries or regions to adopt or strengthen them.
Why does the index focus on the carbon intensity of a nation’s production rather than the carbon
intensity of its consumption?
This reflects the focus of the index in understanding how the presence of global constraints
on carbon emissions will affect the productive capacity and terms of trade faced by each
country.
Why does the index not focus on emissions per capita?
We have not used emissions per capita as an indicator of likely prosperity or carbon
competitiveness. Emissions per capita is a good measure of the contribution of an average
citizen to climate change, but is not an appropriate measure of the average prosperity that a
citizen will receive in an emissions constrained world, except to the extent that GDP is
limited by emissions, and this is already captured in the framework of this report.
The indices take a neutral stance towards a number of further issues. They are neither
intended to highlight the extent to which individual countries have contributed to the stock
of greenhouse gases in the atmosphere, nor are they setting out to comment on appropriate
targets on a country-by-country basis.

The Climate Institute and E3G Low carbon competitiveness
34
Some countries are going to suffer more from climatic change than others, but this does not seem to
be a factor in the index?
Impacts on the economy caused by the changing climate itself are also not considered in this
report, primarily for the reason that it remains difficult to accurately predict climatic changes
at a sufficiently localised level and then to map those climatic changes into projected
economic impacts (after sensible adaptation has occurred). This report aims to measure the
progress countries are making on preparing themselves for the low carbon economy, rather
than a hotter and changed climate, and to highlight the extent to which comparable action is
being taken across countries.
Aren’t you giving too much weight to rich countries? It seems there is no way a country with low
GDP per capita can do well in the low carbon competitiveness index.
It is important to recall that the low carbon competitiveness index is not aiming to capture a
country‟s contribution to climate change, but, rather, how well it is placed to provide future
prosperity to its residents. A country‟s current level of wealth will be a strong determinant of
its wealth in the future, and so it is to be expected that this is an important variable. The low
carbon improvement index shows little systematic pattern in favour of wealthier countries
and has a number of non-OECD countries near the top.
I don’t understand the econometric methods you have used to arrive at the weightings, so how can I
assess whether these weightings are suitable or not?
The econometrics cannot unambiguously lead to a set of uncontroversial weights. These
methods have been used as a guide to minimise (but not eliminate) the subjectivity in
variable selection and the relative weights given in the index. The basic idea is that the
statistical techniques allow us to determine how closely a variable is related to carbon
productivity, and a weighting is placed on the variable accordingly. Too literal an
interpretation of the weights on each indicator should be avoided. The rankings of the
countries by category are presented to allow readers to see for themselves how the index
might change with different sets of weightings. While we believe our weighting selection to
be reasonable, we also recognise that readers may have their own particular views on which
variables are important, and we are open to conducting analyses of the data based on a
different set of weightings.

The Climate Institute and E3G Low carbon competitiveness
35
I don’t understand why or how you have grouped the variables into categories, which in any case
seem arbitrary?
The category groupings do not significantly affect the methodology or results. The categories
are used as a way to help explain the drivers of each country‟s ranking in the final index. We
allow a statistical analysis to guide the weightings that should be given to each category.
How confident are you in the quality of the data you have used?
It is difficult to assemble data on a large range of relevant variables across such a diverse set
of countries. Only sources where data for a particular variable is presented for all countries
are used in order to minimise any error. Moreover, only data obtained from well-respected
organisations have been used. Nonetheless, it is impossible to eliminate measurement error.
However, unless it is systematically linked across the variables chosen, it will not affect a
country‟s ranking.
Don’t we already have enough indices ranking countries’ environmental performance?
The need for an index dealing specifically with climate change preparedness has already
been raised in the field of international comparisons of environmental performance. The
Environmental Sustainability Index (ESI) of the Yale Center for Environmental Law and
Policy (Esty et al (2005)) has been criticised for, among other issues, not addressing the issue
of climate change sufficiently (Morse and Fraser (2005)). Furthermore, the authors of that
index have noted that there is an important role for an alternative index dealing specifically
with this aspect of sustainability. The indices presented in this report fill this gap with a
particular focus on combining climate change preparedness with economic prosperity. In
any case, this report is not solely focused on the presentation of indices – a major motivation
is a desire to expand the boundaries of debate and provide new conceptual frameworks for
thinking about climate change action.
The Climate Institute and E3G Low carbon competitiveness
36
Appendix B: Further details on econometric estimation
This appendix provides more detail on the econometric estimation underpinning the low
carbon competitiveness index.
Data preparation
While every effort was made to keep imputation of data points to a minimum, it was not
possible to construct a complete data set for all variables across all countries and years. The
assumptions that were made in the construction of the data are presented in this section.
Decisions made about missing data are not presented for variables which were not included
in the index.
Data for greenhouse gas emissions for the six gases identified in the Kyoto protocol were
obtained from the CAIT database of the World Resources Institute. Data for CO2 emissions
are available on an annual basis for all countries from 1990, while those for methane, nitrous
oxide and fluorinated gases are only estimated every five years. In order to incorporate these
latter sources of emissions, it was assumed that each country‟s emissions changed at a
constant rate between the years for which data was available. Land use change and forestry
sector emissions were not included for the practical and methodological reasons that result
in them, for example, not being included in many IPCC scenarios and studies in the climate
change literature (den Elzen and Höhne (2008)).
New Energy Finance data on private sector investment in sustainable energy was only
available for the period 2005 to 2007. It was assumed that the level of investment in that
period was a reflection of investment over the entire period. This approach was taken for
other variables for which a time series was not available. The estimates of the balance of
emissions embodied in trade were only available for a single year, for example.
Each indicator was transformed so that it had a minimum of zero and a maximum of one
and that higher levels of the indicator would be expected to have a positive impact upon
carbon productivity.
The calculation of the low carbon competitiveness index following this process was done
using data from 2005 - the most recent year for which comprehensive data was available.
The Climate Institute and E3G Low carbon competitiveness
37
Selection of variables and weights for the low carbon competitiveness index
A backwards stepwise ordinary least squares regression with each indicator included was
used to ascertain which of these variables had the strongest links to the dependent variable;
that is, carbon productivity as measured by GDP per tonne of carbon. A variable was
excluded from the analysis at an exclusion threshold of p=0.2.
Selecting variables for an econometric analysis is not straightforward, and many economists
have noted the difficulties involved and proposed various solutions (Leamer (1983), Sala-i-
Martin (1997), Hendry and Krolzig (2004)). A relatively simple approach was adopted in this
report for two reasons. First, data on many variables pertinent to climate change have only
begun to be measured relatively recently, particularly for developing countries, and so this
limits the number of observations and, therefore, the reliability of more sophisticated
techniques. Second, the variables in the index are selected on the basis that they provide a
proxy for the level of GDP per tonne of carbon. This eliminates the need to be concerned
about causation, which is the focus of some of the critiques of stepwise regression as used in
this report (e.g. Hendry and Krolzig (2004)).
The coefficients on each indicator from the econometric estimation give an indication of the
relative importance of each variable. Rather than using these weights directly, these were
used to ascribe weights to each category. Indicators were then weighted equally within their
category.
An alternative approach would be to dispense with the categories and weight each indicator
according to this estimated weight. This approach was not pursued as it would be unwise to
prescribe excessive accuracy to these individual numbers: many of the variables will be
correlated with each other which will reduce the accuracy with which the coefficients are
measured. Again, because causation is not critical for the purposes of this index, this is less
of a concern in this application than in other contexts.
Table A1 provides a list of the indicators that were excluded from the low carbon
competitiveness index as a result of this process.

The Climate Institute and E3G Low carbon competitiveness
38
Table A1 A number of variables were excluded from the index following the econometric
analysis
Variable Definition Source Category
Road sector fuel consumption Litres per capita WDI Adjustment Costs
Researchers in R&D Per million head of population WDI Adjustment Costs
Requirement for air conditioning Number of cooling degree days World Resources Institute Adjustment Costs
R&D expenditure % of GDP WDI Adjustment Costs
Air passengers carried Number WDI Adjustment Costs
Rigidity of employment index Scale of 0 to 100 where 0 is less rigid
WDI Adjustment Costs
Institution rankings Scale of 0 to 10 where 10 is most effective institutions
World Economic Forum Adjustment Costs
Motivation of residents for action Percentage of the population
saying climate change is a very serious problem
Pew Global Centre Adjustment Costs
Motivation of Government for action
% of recent stimulus packages spent on green measures
Edenhofer and Stern (2009) Adjustment Costs
Price of unleaded fuel $US/litre GTZ Early Preparation
New sustainable energy investment
$US equivalent by company nationality
New Energy Finance Early Preparation
Efficiency of coal fired electricity generation
Ratio of output to input in „000 toe IEA Early Preparation
Carbon productivity growth See section 2 Vivid Economics calculations Early Preparation
Stock of forests Square kilometres WDI Sectoral Composition
Use of rail Ratio of rail to road network length
WDI Sectoral Composition
Fossil fuel exports Share of fuels in total exports WDI Sectoral Composition
Renewable energy exports „000 toe per capita IEA Sectoral Composition
Source: Vivid Economics

The Climate Institute and E3G Low carbon competitiveness
39
Appendix C: Productivity measures in a low carbon world
This appendix provides a conceptual background on productivity measurement and the
relationship between standard measures of productivity and carbon productivity.
Productivity is a term which is used relatively frequently in public policy debates, however,
its precise meaning is seldom defined. At a very general level productivity can be thought of
as the ratio of output to inputs in production, where inputs consist of such things as labour,
capital and natural resources. If a country is able to produce more output without increasing
the amount of inputs used, then it will have experienced a productivity gain. In this section,
traditional measures of productivity are discussed in the context of emissions reductions and
a transition to a low carbon economy.
Productivity measurement
In economics, the economy at the country level is often modelled by an aggregate production
function. A production function is a mathematical relationship which relates output to
inputs. There are two different, but related, measures of output in economics. The first is
known as gross output, and is the total value of things which are produced in the economy.
The second measure, and that which is used to calculate GDP, is known as value added and
is calculated by subtracting the total purchases of intermediate inputs, such as raw materials,
from the value of gross output. Value added represents the amount of wealth available for
distribution to workers and the owners of firms.
While there is some debate about which measures are more appropriate for use both at the
level of an individual firm, it is most common to use value added measures at the level of a
country (Baptist (2009)). This is to avoid double counting of intermediate goods; that is,
goods which are not consumed directly but are used as inputs in the production of further
products.
The Climate Institute and E3G Low carbon competitiveness
40
The value added production function for a particular country can be written as
𝑌 −𝑀 = 𝐴𝐾𝛼𝐿1−𝛼 (Equation 1)
where Y represents the value of gross output, M the value of raw materials and intermediate
inputs, K the value of the capital stock and L the number of hours worked by employees. The
parameter α can be said to represent the technology used and is often assumed to be equal to
one-third (Hall and Jones (1999)). The parameter A determines how much output can be
achieved for a given amount of capital and labour. It is known as total factor productivity,
and is the way in which the conceptual definition of productivity as the ratio of inputs to
outputs can be quantitatively expressed.
As can be seen from Equation 1, productivity is not synonymous with gross output or value
added. For example, if two countries were producing the same level of value added but one
had a higher capital stock than another, then the country with more capital would have a
lower level of measured productivity, as it required more inputs to produce the same level of
output.
Emissions reductions are often associated with improved productivity
Purchases of fossil fuels, either for direct use or in the production of electricity, and of
carbonates, which result in industrial process emissions, will typically be considered as
intermediate inputs and so subtracted off the value of gross output to calculate value added.
Improvements in the efficiency with which these inputs are used will therefore result in a
productivity gain. This can be seen quantitatively by considering Equation 1. If a country is
able to produce the same quantity of gross output with fewer intermediate inputs, then the
measure of value added will increase. If the quantity of capital and labour is held constant,
this in turn will result in productivity, as measured by total factor productivity, increasing.
Some low cost greenhouse gas abatement options will have this effect, such as energy
efficiency measures, but the calculation is not always so straightforward. To the extent that
an abatement option involves some increased use of capital and labour, the increase in the
measure of productivity as calculated by Equation 1 will be mitigated.
Countries with high carbon productivity are often those with high levels of GDP per capita
The amount of GDP per capita is often used as a proxy for productivity because it can be
interpreted easily by those who are not familiar with the framework set out above and
because it is consistent with data collected by national statistics offices. GDP per capita is
analogous to the amount of value added per worker, with the difference that the latter
The Climate Institute and E3G Low carbon competitiveness
41
measure only includes workers rather than the whole population. GDP per capita will
therefore only be an accurate measure of total factor productivity to the extent that the
amount of capital per worker is the same across all countries. However, it is a proxy which
has a firm theoretical relationship with productivity. The discussion in Section 2 regarding
the potential inaccuracies in using GDP per capita as a proxy for overall prosperity or
welfare should also be considered in this context.
As shown in Figure 5 of the main report there is a strong relationship between productivity,
as represented by GDP per capita, and GDP per unit of emissions. This empirical evidence
supports the theoretical argument above that an emissions-efficient economy can also be one
which is highly successful using standard measures of wealth and productivity.
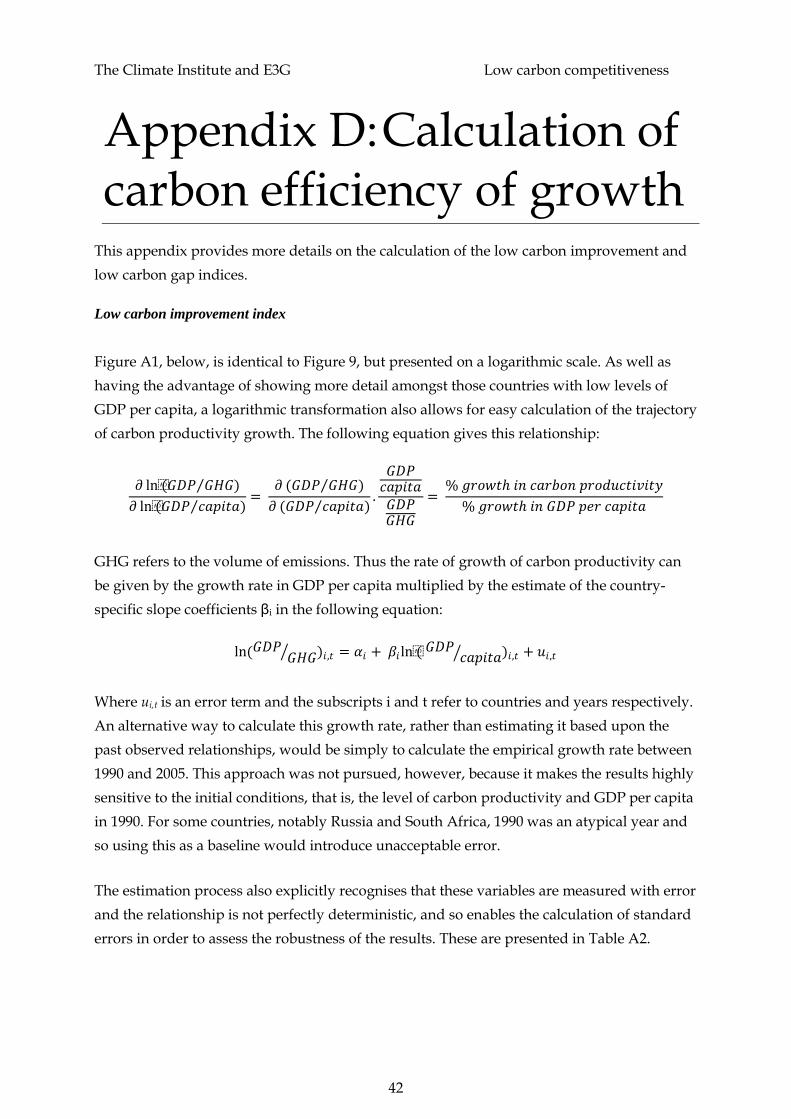
The Climate Institute and E3G Low carbon competitiveness
42
Appendix D: Calculation of carbon efficiency of growth
This appendix provides more details on the calculation of the low carbon improvement and
low carbon gap indices.
Low carbon improvement index
Figure A1, below, is identical to Figure 9, but presented on a logarithmic scale. As well as
having the advantage of showing more detail amongst those countries with low levels of
GDP per capita, a logarithmic transformation also allows for easy calculation of the trajectory
of carbon productivity growth. The following equation gives this relationship:
𝜕 ln(𝐺𝐷𝑃 𝐺𝐻𝐺)
𝜕 ln(𝐺𝐷𝑃 𝑐𝑎𝑝𝑖𝑡𝑎) =
𝜕 (𝐺𝐷𝑃 𝐺𝐻𝐺)
𝜕 (𝐺𝐷𝑃 𝑐𝑎𝑝𝑖𝑡𝑎) .
𝐺𝐷𝑃𝑐𝑎𝑝𝑖𝑡𝑎𝐺𝐷𝑃𝐺𝐻𝐺
= % 𝑔𝑟𝑜𝑤𝑡ℎ 𝑖𝑛 𝑐𝑎𝑟𝑏𝑜𝑛 𝑝𝑟𝑜𝑑𝑢𝑐𝑡𝑖𝑣𝑖𝑡𝑦
% 𝑔𝑟𝑜𝑤𝑡ℎ 𝑖𝑛 𝐺𝐷𝑃 𝑝𝑒𝑟 𝑐𝑎𝑝𝑖𝑡𝑎
GHG refers to the volume of emissions. Thus the rate of growth of carbon productivity can
be given by the growth rate in GDP per capita multiplied by the estimate of the country-
specific slope coefficients βi in the following equation:
ln(𝐺𝐷𝑃 𝐺𝐻𝐺 )𝑖,𝑡 = 𝛼𝑖 + 𝛽𝑖 ln( 𝐺𝐷𝑃
𝑐𝑎𝑝𝑖𝑡𝑎 )𝑖,𝑡 + 𝑢𝑖,𝑡
Where ui,t is an error term and the subscripts i and t refer to countries and years respectively.
An alternative way to calculate this growth rate, rather than estimating it based upon the
past observed relationships, would be simply to calculate the empirical growth rate between
1990 and 2005. This approach was not pursued, however, because it makes the results highly
sensitive to the initial conditions, that is, the level of carbon productivity and GDP per capita
in 1990. For some countries, notably Russia and South Africa, 1990 was an atypical year and
so using this as a baseline would introduce unacceptable error.
The estimation process also explicitly recognises that these variables are measured with error
and the relationship is not perfectly deterministic, and so enables the calculation of standard
errors in order to assess the robustness of the results. These are presented in Table A2.

The Climate Institute and E3G Low carbon competitiveness
43
Figure A1 Carbon productivity and GDP per capita on a logarithmic scale
Source: Vivid Economics calculations from World Bank data
100000
1000000
10000000
100 1000 10000 100000
GD
P p
er
ton
ne
of
CO
2e
(20
00
$U
S)
GDP per capita (2000 $US)
JPN
USA
FRA
ITA
GBR
GER
CAN
AUSSAU
KOR
ARG
MEXTUR
BRA
ZAF
RUS
IDN
IND
CHN
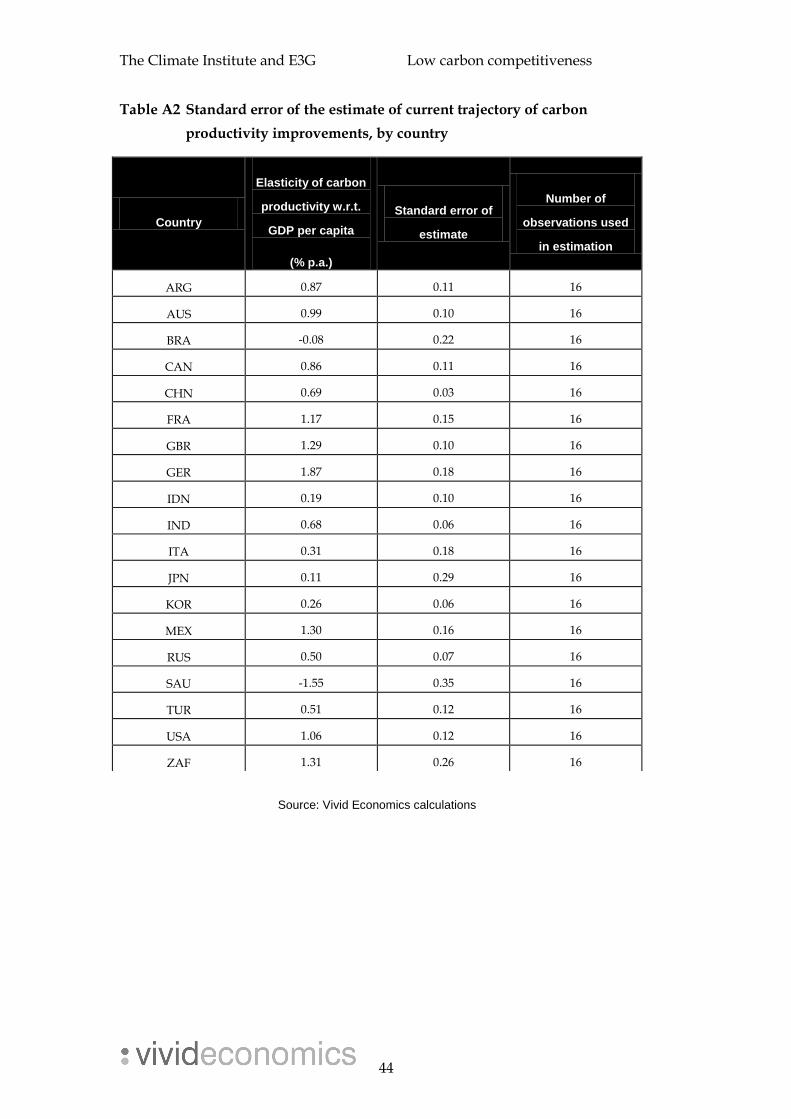
The Climate Institute and E3G Low carbon competitiveness
44
Table A2 Standard error of the estimate of current trajectory of carbon
productivity improvements, by country
Source: Vivid Economics calculations
Country
Elasticity of carbon
productivity w.r.t.
GDP per capita
(% p.a.)
Standard error of
estimate
Number of
observations used
in estimation
ARG 0.87 0.11 16
AUS 0.99 0.10 16
BRA -0.08 0.22 16
CAN 0.86 0.11 16
CHN 0.69 0.03 16
FRA 1.17 0.15 16
GBR 1.29 0.10 16
GER 1.87 0.18 16
IDN 0.19 0.10 16
IND 0.68 0.06 16
ITA 0.31 0.18 16
JPN 0.11 0.29 16
KOR 0.26 0.06 16
MEX 1.30 0.16 16
RUS 0.50 0.07 16
SAU -1.55 0.35 16
TUR 0.51 0.12 16
USA 1.06 0.12 16
ZAF 1.31 0.26 16

The Climate Institute and E3G Low carbon competitiveness
45
Figure A2 Range estimates for the low carbon improvement index
Source: Vivid Economics calculations
Figure A3 The United Kingdom is on course to have the highest rate of
carbon productivity by 2020
Source: Vivid Economics
-2.5
-2.0
-1.5
-1.0
-0.5
0.0
0.5
1.0
1.5
2.0
2.5R
atio
be
twe
en
car
bo
n p
rod
uct
ivit
y gr
ow
th a
nd
GD
P p
er
cap
ita
gro
wth
wit
h
err
or
bar
s
0
0.5
1
1.5
2
2.5
3
3.5
4
Pre
dic
ted
GD
P p
er
ton
ne
of
CO
2e
in
20
20
(mill
ion
$)

The Climate Institute and E3G Low carbon competitiveness
46
The percentage change in carbon productivity expected if GDP per capita
increased by one per cent, the elasticity of carbon productivity growth with
respect to GDP per capita, is calculated by estimating the country-specific slope
coefficient in the above equation. The estimates and standard errors from these
calculations are presented in Figure A2. The standard errors indicate, for
example, that there is more uncertainty surrounding South Africa‟s true
elasticity than India‟s. In South Africa‟s case, the higher uncertainty is due to a
much narrower range of GDP per capita being observed over the period along
with high volatility in carbon productivity
Assuming that (the best estimates of) countries‟ recent changes in carbon
productivity persist in the future and coupling this information with expected
GDP growth rates allows an alternative way to consider how well countries
will be placed to generate material prosperity in a carbon constrained future, as
measured by their level of GDP per tonne of CO2e. This analysis is presented in
Figure A3, where 2005 emissions are projected forward to 2020 using the
results of the low carbon improvement calculations. The United Kingdom will,
if these growth rates are maintained, have overtaken Japan in terms of how
much GDP it can produce per tonne of CO2e, while France and Germany will
not be far behind. These are the same three European countries that also
performed well in the low carbon competitiveness index.
Low carbon gap index
The calculations of the turnaround required are based upon a comparison
between the rates of improvement in carbon productivity being observed now
with those that would be required to meet a particular IPCC scenario and a set
of forecasts of GDP growth. The IPCC scenario chosen, stabilisation at 450 ppm
CO2e with a temporary overshoot, encompasses ranges of uncertainty. IPCC
Box 13.7 gives Annex I countries a target of between -25 and -40 per cent, while
den Elzen and Höhne (2008) conclude that global emissions growth from 1990
to 2020 must be limited to between +15 and +30 per cent to meet this same
target. The main calculations took targets of -32.5 and +25 per cent,
respectively, but there is some uncertainty surrounding these. In order to
The Climate Institute and E3G Low carbon competitiveness
47
account for this, a similar calculation was made under both a weak and a tough
scenario. Under the weak scenario, total global emissions growth is allowed to
be 30 per cent and Annex I countries are set a target of -25 per cent; under the
tough scenario the targets are +15 and -40 per cent respectively. Required
turnarounds are higher in the tough scenario and lower in the weak scenario.
Note that the midpoint of required global emissions in 2020 is not the
arithmetic mean of 15 and 30, rather it is the average estimate from the relevant
studies.
Figure A4 plots the turnaround required under the scenario chosen in the text,
and the bars either side of this represent the range of turnaround that would be
required under both the weak and the tough scenario. The range of turnaround
required is much greater for Annex I countries than it is for non-Annex I
countries. This is because the range for the Annex I targets given in den Elzen
and Höhne (2008) is almost sufficient to account for the change in total global
emissions that are required between the tough, midpoint and weak scenarios.
The ranking of countries remains fairly stable between the three scenarios.
Compared to the midpoint scenario, the only changes in the weak scenario are
that Germany and France each overtake the country that is immediately ahead
of them in the midpoint scenario (South Africa and India respectively).
Conversely, in the tough scenario the changes are that the UK falls behind the
two countries that are immediately below it in the midpoint scenario (Brazil
and South Korea), while France falls behind Indonesia.
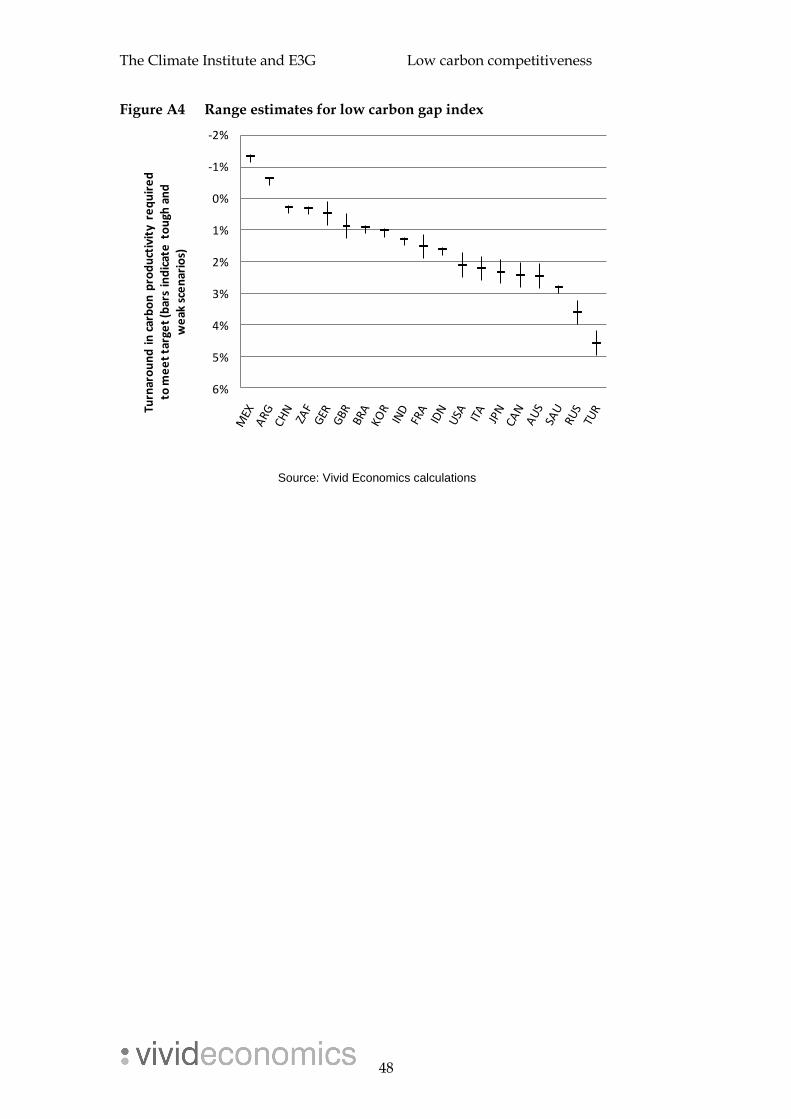
The Climate Institute and E3G Low carbon competitiveness
48
Figure A4 Range estimates for low carbon gap index
Source: Vivid Economics calculations
-2%
-1%
0%
1%
2%
3%
4%
5%
6%
Turn
aro
un
d i
n c
arb
on
pro
du
ctiv
ity
req
uir
ed
to
me
et
targ
et
(bar
s in
dic
ate
to
ugh
an
d
we
ak s
cen
ario
s)

The Climate Institute and E3G Low carbon competitiveness
49
References Baptist, S. (2009), Technology, Human Capital and Efficiency in Manufacturing
Firms, Ph.D. Thesis, Department of Economics, University of Oxford.
Baptist, S. and F. Teal (2008), Why do South Korean firms produce so much more
output per worker than Ghanaian ones?, Centre for the Study of African
Economies Working Paper 2008-10, University of Oxford.
Bode, S. (2003), Equal emissions per capita over time – A proposal to combine
responsibility and equity of rights, Hamburg Institute of International Economics
Working Paper No. 253.
Commonwealth Treasury (2008), Australia’s Low Pollution Future: The economics
of climate change mitigation, Commonwealth of Australia.
den Elzen, M. and N. Höhne (2008), Reductions of greenhouse gas emission in
Annex I and non-Annex I countries for meeting concentration stabilisation targets,
Climatic Change, open access at springerlink.com.
Dixit, A.K. and R.S. Pindyck (1994), Investment under uncertainty, Princeton
University Press.
Department for Environment Food and Rural Affairs (Defra, 2008), Building a
low carbon economy: unlocking innovation and skills, UK Commission on
Environmental Markets and Economic Performance.
Easterlin, R.A. (2000), The worldwide standard of living since 1800, Journal of
Economic Perspectives, Vol. 14(1), pp.7-26.
Edenhofer, O. and N. Stern (2009), Towards a global green recovery:
Recommendations for immediate G20 action, Report submitted to the G20 London
Summit, 2 April 2009.
The Climate Institute and E3G Low carbon competitiveness
50
Esty, D.C., M. Levy, T. Srebotnjak, and A. de Sherbinin (2005). 2005 Environmental
Sustainability Index: Benchmarking National Environmental Stewardship, Yale
Center for Environmental Law and Policy.
Garnaut, R. (2008), The Garnaut Climate Change Review Final Report,
Commonwealth of Australia.
Garnaut, R., S. Howes, F. Jotzo and P. Sheehan (2008), Emissions in the Platinum
Age: the implications of rapid development for climate-change mitigation, Oxford
Review of Economic Policy, Vol. 24(2), pp.377-401.
GTZ (Deutsche Gesellschaft für Technische Zusammenarbeit GmbH) (2007),
GTZ International Fuel Prices th Edition.
Hall R.E. and C.I. Jones (1999), Why do some countries produce so much more
output per worker than others?, Quarterly Journal of Economics, Vol. 114(1),
pp.83-116.
Hendry, D.F. and H.M. Krolzig (2004), We ran one regression, Oxford Bulletin of
Economics and Statistics, Vol. 66(5), pp.799-810.
Heston, A., R. Summers and B. Aten, Penn World Table Version 6.3, Center for
International Comparisons of Production, Income and Prices at the University
of Pennsylvania, August 2009.
International Energy Agency (IEA) (2008), Energy Balances of non-OECD
Countries.
International Energy Agency (IEA) (2008), Energy Balances of OECD Countries.
Krugman, P (1993), What do undergrads need to know about trade?, The American
Economic Review, Vol. 83(2), Papers and proceedings of the hundred and fifth
annual meeting of the American Economic Association, pp. 32-36.
Leamer, E. (1983), Let’s take the con out of econometrics, The American Economic
The Climate Institute and E3G Low carbon competitiveness
51
Review, Vol. 73(1).
McDonald A. and Schrattenholzer L. (2001)‚ Learning rates for energy
technologies, Energy Policy, Vol. 29, pp.255-261.
McKinsey and Company (2009), Pathways to a low carbon economy: Version 2 of
the global greenhouse gas abatement cost curve.
McKinsey Global Institute (2008), The carbon productivity challenge: Curbing
climate change and sustaining economic growth.
Morse, S. and E.D.G. Fraser (2005), Making ’dirty’ nations look clean? The nation
state and the problem of selecting and weighting indices as tools for measuring progress
towards sustainability, Geoforum, Vol. 36(5), pp.625-640.
Neumayer, E. (2001), The human development index and sustainability – a
constructive proposal, Ecological Economics, Vol. 39, pp.101-114.
Nordhaus, W.D. (2000), New Directions in National Economic Accounting,
American Economic Association Papers and Proceedings, Vol. 90(2), pp.259-
263.
Peters, G.P. and E.G. Hertwich (2008), CO2 embodies in international trade with
implications for global climate policy, Environmental Science and Technology, Vol
42(5), pp. 1401-1407.
Pew Research Center, Global Attitudes Project, Various reports.
Porter, M.E. and K. Schwab (2008), The Global Competitiveness Report 2008-2009,
World Economic Forum.
Reinaud, J. (2008), Issues Behind Competitiveness and Carbon Leakage, IEA
Information Paper, International Energy Agency.
Sala-i-Martin, X.X. (1997), I just ran two million regressions, The American
The Climate Institute and E3G Low carbon competitiveness
52
Economic Review, Vol. 87(2), pp.178-183.
Schwab, K. (2009), The Global Competitiveness Report 2009-2010, World Economic
Forum.
United States Department of Agriculture (2009), International Macroeconomic
Data Set, www.ers.usda.gov/Data/Macroeconomics.
Vivid Economics (2007), Ticket price changes for aviation in the EU ETS.
Vivid Economics (2008a), Impacts of emissions trading on profits in aviation.
Vivid Economics (2008b), Race to capture the carbon pound, Shell Springboard
Report.
Vyas, S. and L. Kumaranayake (2006), Constructing socio-economic status indices:
how to use principal components analysis, Health Policy and Planning, Vol. 21(6),
pp459-468.
World Bank (2006), Where is the wealth of nations? Measuring capital for the 21st
Century.
World Bank (2005), 2005 World Development Indicators,
www.worldbank.org/data.
World Resources Institute (2008), Climate Indicators Analysis Tool Version 6.0,
http://cait.wri.org.