
FY2017 Q2 Financial Results...2017/11/02 · •Economic trends in the U.S., Europe, Japan and...
18
FY2017 Q2 Financial Results Director, Corporate Executive Vice President, and General Manager of the Finance & Procurement Hiroyuki Ogiwara November 2, 2017 FURUKAWA ELECTRIC CO., LTD
Transcript of FY2017 Q2 Financial Results...2017/11/02 · •Economic trends in the U.S., Europe, Japan and...

FY2017 Q2 Financial Results
Director, Corporate Executive Vice President, and
General Manager of the Finance & Procurement
Hiroyuki Ogiwara
November 2, 2017
FURUKAWA ELECTRIC CO., LTD

All Rights Reserved, Copyright © FURUKAWA ELECTRIC CO., LTD. 2017
Forward-Looking StatementsProjections of future sales and earnings in these materials are “forward-looking statements.”
Management offers these projections in good faith and on the basis of information presently available.
Information in these statements reflects assumptions about such variables as economic trends and currency
exchange rates.
Forward-looking statements incorporate known and unknown risks as well as other uncertainties that include, but
are not limited to, the following items.
• Economic trends in the U.S., Europe, Japan and elsewhere in Asia, particularly with regard to consumer
spending and corporate expenditures.
• Changes in exchange rates of the U.S. dollar, euro, and Asian currencies.
• Furukawa Electric Group’s ability to respond to rapid advances in technology.
• Changes in assumptions involving financial and managerial maters and the operating environment.
• Current and future trade restrictions and related matters in foreign countries.
• Changes in the market value of securities held by the Furukawa Electric Group.
Due to the above factors, actual sales, earnings, and other operating results may differ significantly from Looking
Statements in these materials. In addition, following the release of these materials, Furukawa Electric Group
assumes no obligation to announce any revisions to forward-looking statement in these materials
CopyrightsFurukawa Electric Co.Ltd. retains copyrights and other rights involving these materials. Copyright and otherwise
reusing these materials in any way without prior consent is prohibited.
2
All Rights Reserved, Copyright © FURUKAWA ELECTRIC CO., LTD. 2017
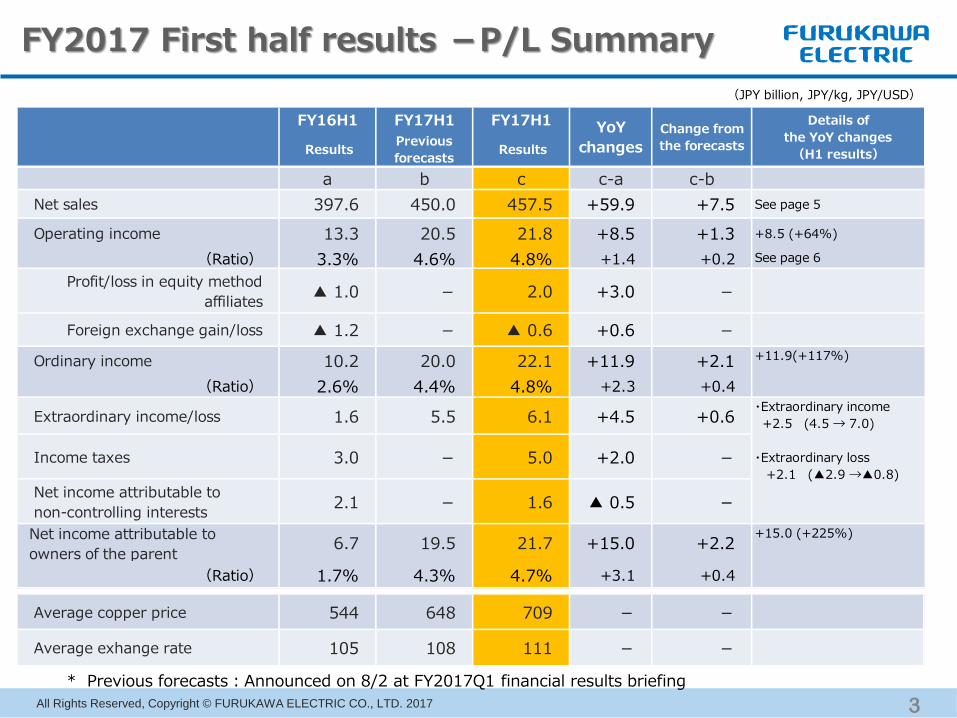
* Previous forecasts:Announced on 8/2 at FY2017Q1 financial results briefing
*
3
FY2017 First half results -P/L Summary
(JPY billion, JPY/kg, JPY/USD)
FY16H1 FY17H1 FY17H1
ResultsPrevious
forecasts Results
a b c c-a c-b
Net sales 397.6 450.0 457.5 +59.9 +7.5 See page 5
Operating income 13.3 20.5 21.8 +8.5 +1.3 +8.5 (+64%)
(Ratio) 3.3% 4.6% 4.8% +1.4 +0.2 See page 6
Profit/loss in equity method
affiliates▲ 1.0 - 2.0 +3.0 -
Foreign exchange gain/loss ▲ 1.2 - ▲ 0.6 +0.6 -
Ordinary income 10.2 20.0 22.1 +11.9 +2.1 +11.9(+117%)
(Ratio) 2.6% 4.4% 4.8% +2.3 +0.4
Extraordinary income/loss 1.6 5.5 6.1 +4.5 +0.6
Income taxes 3.0 - 5.0 +2.0 -
Net income attributable to
non-controlling interests2.1 - 1.6 ▲ 0.5 -
Net income attributable to
owners of the parent6.7 19.5 21.7 +15.0 +2.2
+15.0 (+225%)
(Ratio) 1.7% 4.3% 4.7% +3.1 +0.4
Average copper price 544 648 709 - -
Average exhange rate 105 108 111 - -
・Extraordinary income
+2.5 (4.5 → 7.0)
・Extraordinary loss
+2.1 (▲2.9 →▲0.8)
YoY
changes
Change from
the forecasts
Details of
the YoY changes
(H1 results)

All Rights Reserved, Copyright © FURUKAWA ELECTRIC CO., LTD. 2017
Intentionally Blank
4

All Rights Reserved, Copyright © FURUKAWA ELECTRIC CO., LTD. 2017 5
Analysis of Changes in Net Sales(YOY)
0
(JPY billion)
+59.9

All Rights Reserved, Copyright © FURUKAWA ELECTRIC CO., LTD. 2017 6
Analysis of Changes in Operating income(YOY)
0
(JPY billion)
+8.5
All Rights Reserved, Copyright © FURUKAWA ELECTRIC CO., LTD. 2017 7
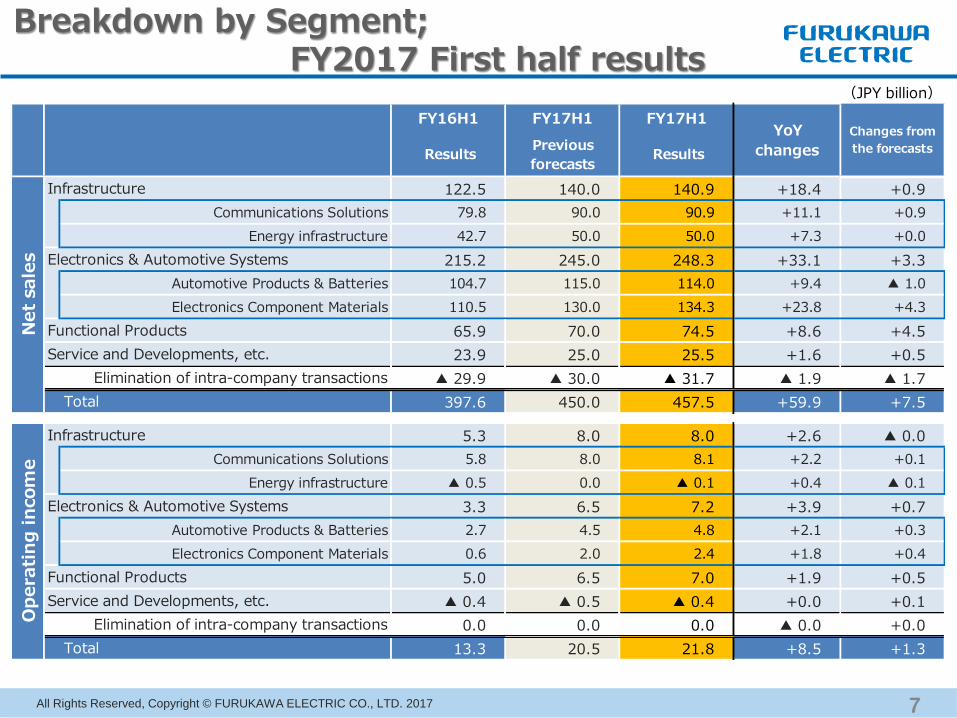
Breakdown by Segment;FY2017 First half results
(JPY billion)
FY16H1 FY17H1 FY17H1
ResultsPrevious
forecasts Results
122.5 140.0 140.9 +18.4 +0.9
Communications Solutions 79.8 90.0 90.9 +11.1 +0.9
Energy infrastructure 42.7 50.0 50.0 +7.3 +0.0
215.2 245.0 248.3 +33.1 +3.3
Automotive Products & Batteries 104.7 115.0 114.0 +9.4 ▲ 1.0
Electronics Component Materials 110.5 130.0 134.3 +23.8 +4.3
65.9 70.0 74.5 +8.6 +4.5
23.9 25.0 25.5 +1.6 +0.5
▲ 29.9 ▲ 30.0 ▲ 31.7 ▲ 1.9 ▲ 1.7
397.6 450.0 457.5 +59.9 +7.5
5.3 8.0 8.0 +2.6 ▲ 0.0
Communications Solutions 5.8 8.0 8.1 +2.2 +0.1
Energy infrastructure ▲ 0.5 0.0 ▲ 0.1 +0.4 ▲ 0.1
3.3 6.5 7.2 +3.9 +0.7
Automotive Products & Batteries 2.7 4.5 4.8 +2.1 +0.3
Electronics Component Materials 0.6 2.0 2.4 +1.8 +0.4
5.0 6.5 7.0 +1.9 +0.5
▲ 0.4 ▲ 0.5 ▲ 0.4 +0.0 +0.1
0.0 0.0 0.0 ▲ 0.0 +0.0
13.3 20.5 21.8 +8.5 +1.3
Elimination of intra-company transactions
Infrastructure
Electronics & Automotive Systems
Elimination of intra-company transactions
Total
Service and Developments, etc.
Total
Functional Products
Service and Developments, etc.
Op
era
tin
g in
com
e
Infrastructure
Electronics & Automotive Systems
YoY
changes
Changes from
the forecasts
Net
sale
s
Functional Products

All Rights Reserved, Copyright © FURUKAWA ELECTRIC CO., LTD. 2017 8
FY2017 First half results-B/S Summary
◇Total Assets: increased from end of FY2016 due to an increase in sales and rising copper prices◇Interest-bearing liabilities: free cash flow is in deteriorating trend due to an increase in working capital
(JPY billion)
End of FY16Q4 End of FY17Q2 Changes Details of the changes
a b b-a
Current assets 382.4 413.4 +31.0 Inventories +13.8
Cash and bank deposits 47.2 53.1 +5.9
Notes and accounts receivable trade 198.9 210.0 +11.1
Non-current assets 367.7 378.5 +10.7 Increased by sales increase
Tangible fixed assets 205.5 213.8 +8.3
Intangible fixed assets 9.7 9.7 ▲ 0.1
Investments and other assets 152.5 155.0 +2.5
Total Assets 750.1 791.8 +41.7 Impact of new consolidation +5.6
Current liabilities 293.4 307.8 +14.4 Increased by sales increase
Non-current liabilities 219.7 221.9 +2.1
Total Liabilities 513.1 529.7 +16.6
Shareholders' equity 194.3 211.6 +17.4
Accumulated other comprehensive income 12.4 16.2 +3.8
Net income attributable to non-controlling
interests30.3 34.3 +4.0
Total Net assets 237.1 262.2 +25.1
Total Lianbilities and Net assets 750.1 791.8 +41.7
Interest-bearing liabilities 252.5 269.2 +16.6 Impact of new consolidation +3.5
Capital ratio 27.6% 28.8% +1.2
NET D/E ratio 0.99 0.95 ▲ 0.04

All Rights Reserved, Copyright © FURUKAWA ELECTRIC CO., LTD. 2017 9
Revision of FY2017 Full year forecasts-P/L Summary
(JPY billion, JPY/kg, JPY/USD)
FY16 FY17 FY17
ResultsPrevious
forecastsNew forecasts
a b c c-a c-b
Net sales 843.3 915.0 925.0 +81.7 +10.0
Operating income 38.6 43.0 43.0 +4.4 -
(Ratio) 4.6% 4.7% 4.6% +0.1 ▲ 0.1
Profit/loss in equity method affiliates 0.1 - - - -
Foreign exchange gain/loss ▲ 1.2 - - - -
Ordinary income 36.0 43.5 43.5 +7.5 -
(Ratio) 4.3% 4.8% 4.7% +0.4 ▲ 0.1
Extraordinary gain/loss ▲ 8.1 ▲ 6.5 ▲ 6.5 +1.6 -
Income taxes5.5 - - - -
Net income attributable to
non-controlling interests4.9 - - - -
Net income attributable to
owners of the parent17.6 25.5 25.5 +7.9 -
(Ratio) 2.1% 2.8% 2.8% +0.7 ▲ 0.0
Average copper price 604 637 717
Average exhange rate 108 107 108
YoY
changes
Changes from
previous forecast
( H1:709 / H2 Assumptions:725)
( H1:111 / H2 Assumptions:105)
*
* Revised FY2017forecast of net sales

All Rights Reserved, Copyright © FURUKAWA ELECTRIC CO., LTD. 2017 10
Breakdown by Segment;Revision of FY2017 Full year forecasts
(JPY billion)
FY16 FY17 FY17
Results Previous forecasts New forecasts
263.8 295.0 285.0 +21.2 ▲ 10.0
Communications Solutions 168.5 185.0 175.0 +6.5 ▲ 10.0
Energy infrastructure 95.3 110.0 110.0 +14.7 0.0
455.5 490.0 515.0 +59.5 +25.0
Automotive Products & Batteries 223.4 235.0 240.0 +16.6 +5.0
Electronics Component Materials 232.1 255.0 275.0 +42.9 +20.0
131.5 140.0 145.0 +13.5 +5.0
49.7 50.0 50.0 +0.3 0.0
▲ 57.0 ▲ 60.0 ▲ 70.0 ▲ 13.0 ▲ 10.0
843.3 915.0 925.0 +81.7 +10.0
14.3 16.3 13.3 ▲ 1.0 ▲ 3.0
Communications Solutions 14.2 16.8 14.1 ▲ 0.1 ▲ 2.7
Energy infrastructure 0.1 ▲ 0.5 ▲ 0.8 ▲ 0.9 ▲ 0.3
12.8 15.0 17.5 +4.7 +2.5
Automotive Products & Batteries 10.1 10.5 12.8 +2.7 +2.3
Electronics Component Materials 2.7 4.5 4.7 +2.0 +0.2
11.7 12.5 13.0 +1.3 +0.5
▲ 0.1 ▲ 0.8 ▲ 0.8 ▲ 0.7 0.0
▲ 0.0 0.0 0.0 +0.0 0.0
38.6 43.0 43.0 +4.4 0.0
Elimination of intra-company transactions
Infrastructure
Electronics & Automotive Systems
Elimination of intra-company transactions
Functional Products
Service and Developments, etc.
Total
Functional Products
Service and Developments, etc.
Op
era
tin
g in
com
e
YoY
changes
Changes from
previous
forecasts
Infrastructure
Electronics & Automotive Systems
Net
sale
s
Total

All Rights Reserved, Copyright © FURUKAWA ELECTRIC CO., LTD. 2017 11
Net Sales and Operating Income by Segment
1-(1) Infrastructure (Communications Solutions)
Net sales
Operating income / operating margin
□: Positive growth factors ■: Negative growth factors
(JPY billion)
(JPY billion)
< Details of Operating Income difference>
H1 result: YoY +2.2 billion yen
□ Strong demand for optical fiber and cable products has continued
□ Backed by increased adoption of optical transmission, growing demand for network systems in Japan contributed to the result
■ Digital coherent products were affected byprolonged inventory adjustments in the Chinesemarket, resulting in declines in net sales and operating income
H2 forecast: ▲2.0 billion yen vs. H1 actual
・ Optical fiber and cable: shipments to some clients in North America will temporarily decrease
・ Digital coherent products: despite increasing impact of inventory adjustments, recovery is expected to start in Q4
□: Positive growth factors ■: Negative growth factors

All Rights Reserved, Copyright © FURUKAWA ELECTRIC CO., LTD. 2017 12
Net Sales and Operating Income by Segment
1-(2) Infrastructure (Energy Infrastructure)
Net sales
(JPY billion)
H1 result: YoY +0.4 billion yen
□ Domestic electrical construction contributed to the result
Demand for power transmission/distribution products for Japanese electric power companies has declined
*Acquisition of VISCAS business (domestic underground and undersea cable business ) from FY2016 Q3.
< Details of Operating Income difference>
Operating income / operating margin
(JPY billion)
H2 forecast: ▲0.6 billion yen vs. H1 actual
・ The product mix will deteriorate due to exports of underground cables
・ Sales from power transmission/distribution products will increase due to seasonal factors
□: Positive growth factors ■: Negative growth factors

All Rights Reserved, Copyright © FURUKAWA ELECTRIC CO., LTD. 2017 13
Net Sales and Operating Income by Segment
2-(1) Electronics & Automotive systems(Automotive Products & Batteries)
< Details of Operating Income difference>
Net sales
Operating income / operating margin
H1 result: YoY +2.1 billion yen
□ Demand for automotive parts in Japan recovered mainly due to the impact of the Kumamoto earthquake in April 2016
□ Newly adopted our wire harnesses to new car models by car makers
□ Efforts for improving cost of sales by increasing production efficiency and reducing logistics costs continued to the result
□: Positive growth factors ■: Negative growth factors
(JPY billion)
(JPY billion)
H2 forecast: +3.2 billion yen vs. H1 actual
・ Income from batteries will increase due to seasonal factors
・ The impact of the adoption of wire harnesses for new car models will further increase

All Rights Reserved, Copyright © FURUKAWA ELECTRIC CO., LTD. 2017
*Main factor of the sales increase is raise of copper price
14
Net Sales and Operating Income by Segment
2-(2) Electronics & Automotive systems(Electronics Component Material)
Net sales
Operating income / operating margin
* *(JPY billion)
(JPY billion)
□: Positive growth factors ■: Negative growth factors
< Details of Operating Income difference>
H1 result: YoY + 1.8 billion yen
□ As for Copper & High Performance Material Products division, demand increased, and a temporary increase in costs associated with development projects last year has been corrected
□ Magnet wires for vehicles and smartphones delivered a strong result
H2 forecast: ▲0.02 billion yen vs. H1 actual
・ In Wrought copper products business, income will maintain same level from H1 since demand for some products will increase while there will be negative impact in some other products by seasonal factors
□: Positive growth factors ■: Negative growth factors

All Rights Reserved, Copyright © FURUKAWA ELECTRIC CO., LTD. 2017 15
Net Sales and Operating Income by Segment
3 Functional Products
Net sales
Operating income / operating margin
□: Positive growth factors ■: Negative growth factors
(JPY billion)
(JPY billion)
< Details of Operating Income difference>
H1 result: YoY +1.9 billion yen
□ Copper foils delivered strong results, due to steady demand, increased productivity, and improvement of product mix
□ As for Thermal Management Solution & Products division, demand for products for data centers increased
H2 forecast: ▲0.9 billion yen vs. H1 actual
・ As for Thermal Management Solution & Products division, after the strong demand for products for data centers in H1, demand will decrease due to temporary customer inventory adjustments
・ Sales of tapes for semiconductor manufacturing will be further affected by intensification of competitive environment
□: Positive growth factors ■: Negative growth factors

All Rights Reserved, Copyright © FURUKAWA ELECTRIC CO., LTD. 2017 16
CAPEX, Depreciation & amortization and R&D -FY2017 first half results and revised forecasts for the year
*Released on September 13; including additional investments for increases in production of optical fibers and cables
(JPY billion)
FY16H1 FY17H1 FY16 FY17 FY17
Results Results ResultsPrevious
forecasts
New
forecasts
a b b-a c d e e-c e-d
CAPEX 11.6 15.9 +4.3 31.6 38.0 42.0 +10.4 +4.0
Depreciation and
amortization11.5 12.3 +0.8 23.4 26.5 26.5 +3.1 ー
R&D expenses 8.4 9.4 +1.1 17.5 19.4 19.4 +1.9 ー
YtoY
changes
YoY
changes
Changes
from previous
forecasts

All Rights Reserved, Copyright © FURUKAWA ELECTRIC CO., LTD. 2017
(Appendix) Segments and Business Divisions
17
Segment Sub-segment Business Division
Infrastructure
Communications
Solutions
Optical Fiber and Cable Products
FITEL Products
Broadband Solutions Business
Energy InfrastructurePower Cable
Industrial Cable & Power Cable Accessories
Electronics & Automotive
Systems
Automotive Products
& Batteries
Automotive Products
Batteries
Electronics Component
Material
Electric Conductor
Magnet Wire
Copper & High Performance Material Products
Copper Tube
Functional Products
AT & Functional Plastics
Thermal Management Solution & Products
Memory Disk
Copper Foil
Service and Developments, etc.

All Rights Reserved, Copyright © FURUKAWA ELECTRIC CO., LTD. 2017
Thank you very much
for your attention.
18