FY2017 Consolidated Financial Results - Aisin · PDF file200 400 600 800 1,200 1,400 fy2016...
24
FY2017 Consolidated Financial Results April 28 th , 2017 AISIN SEIKI Co., Ltd.
Transcript of FY2017 Consolidated Financial Results - Aisin · PDF file200 400 600 800 1,200 1,400 fy2016...

FY2017 Consolidated Financial Results
April 28th, 2017
AISIN SEIKI Co., Ltd.
1.Consolidated Operating Results (FY2017) P.2-8
2.Consolidated Operating Forecast (FY2018) P.9-13
3.Reference information P.14-23
Contents
1

1.Consolidated Operating Results (FY2017)
2

FY2017 Overview of Financial Results
1. Revenue for FY2017 reached 3,562.6 billion yen, which is the highest ever before, due to favorable AT and Body parts sales, and the contribution of newly consolidated SHIROKI group.
2. Operating profit for FY2017 was highest-ever 228.6 billion yen, due to sales increase and gain from stock swap with SHIROKI Corporation, in spite of the unfavorable factors such as Kumamoto earthquakes and foreign exchange loss.
3. Regarding FY2018 forecast, revenue and profit is predicted to increase compared to FY2017, due to the increase of AT sales, in spite of the unfavorable factors such as up-trend of material cost, depreciation increasing and strong yen trend.
3

(billion yen)
FY2016 FY2017 Change
Results Rate to sales %
Results Rate to sales %
Amount %
Revenue 3,245.9 - 3,562.6 - +316.7 +9.8
Operating 192.7 5.9 228.6 6.4 +35.9 +18.7
Profit before income taxes
194.0 6.0 237.3 6.7 +43.3 +22.3
Profit for the period *
100.3 3.1 126.6 3.6 +26.3 +26.2
EPS 354.53
yen -
444.46 yen
- 89.93
yen +25.4
FX Rate
USD 120 yen USD 109 yen -11 yen -9.2
CNY 18.8 yen CNY 16.1 yen -2.7yen -14.4
Toyota production (10,000 Unit)
887 909 +22 +2.5
AT sales (10,000 Unit)
737 869 +132 +17.9
4
FY2017
Forecast
in Feb Rate to
sales %
3,530.0 -
205.0 5.8
209.0 5.9
107.0 3.0
374.87
yen -
Based on IFRS (Both FY2016&17)
Consolidated Operating Results (FY2017)
USD 108 yen
CNY 16.0 yen
908
870
* Profit for the period attributable to Owners of the parent
Pre
-conditio
ns

265.4 279.1
95.9 148.1
71.3
94.1 83.6
93.9 73.5
80.1 52.1
79.1 55.4
75.2
50.0
71.0
69.5
69.2
48.3
51.3 256.0
258.9
0
200
400
600
800
1,000
1,200
1,400
FY2016 FY2017
VW&Audi
Chinese
OEMs Total
PSA
BMW
GM
NISSAN
MITSUBISHI
SUZUKI
HONDA
A/M & Others +2.9
Sales by Customer (FY2017)
FY2016 Revenue
FY2017 Revenue (+ 316.7)
2,020.1 (62.2%) 1,121.0
(34.6%)
104.7 (3.2%)
Toyota Group Other
Manufacturers
Life & others
Other Manufacturers sales
breakdown
1,121.0
(Billion yen)
5
+13.7
+52.2
+10.3
+6.6
+27.0
+19.8
+3.0
-0.3
+21.0
+22.8
VOLVO
3,245.9
3,562.6
(Billion yen)
(Billion yen)
Life & others
121.3 (3.4%)
Other Manufacturers
1,300.0 (36.5%)
Toyota Group
2,141.2 (60.1%)
1,300.0 +179.0

Segment Information(FY2017)
1,827.0
564.4
281.4
330.9
242.1
2,073.1
568.0
309.9 360.7
250.6
0
200
400
600
800
1,000
1,200
1,400
1,600
1,800
2,000
2,200
Japan North AmericaEurope China Asia & Others
FY2016 FY2017
Revenue (+ 316.7)
123.0
18.4
2.6
43.1
6.2
138.8
22.5
4.5
56.4
7.8
0
30
60
90
120
150
Japan North AmericaEurope China Asia & Others
FY2016 FY2017
FX
Impact
Other
factors
Japan - +246.1
North America
-59.6 +63.2
Europe -8.6 +37.1
China -60.0 +89.8
Asia & Others
-24.5 +33.0
Total -152.7 +469.4
FX Impact Other factors
Japan -27.6 +43.4
North America -2.4 +6.5
Europe -0.5 +2.4
China -9.6 +22.9
Asia & Others -1.8 +3.4
Elimination - -0.8
Total -41.9 +77.8
+246.1
+3.6
+28.5
+29.8
+8.5
+15.8
+4.1
+1.9
+13.3
+1.6
6
(Billion yen)
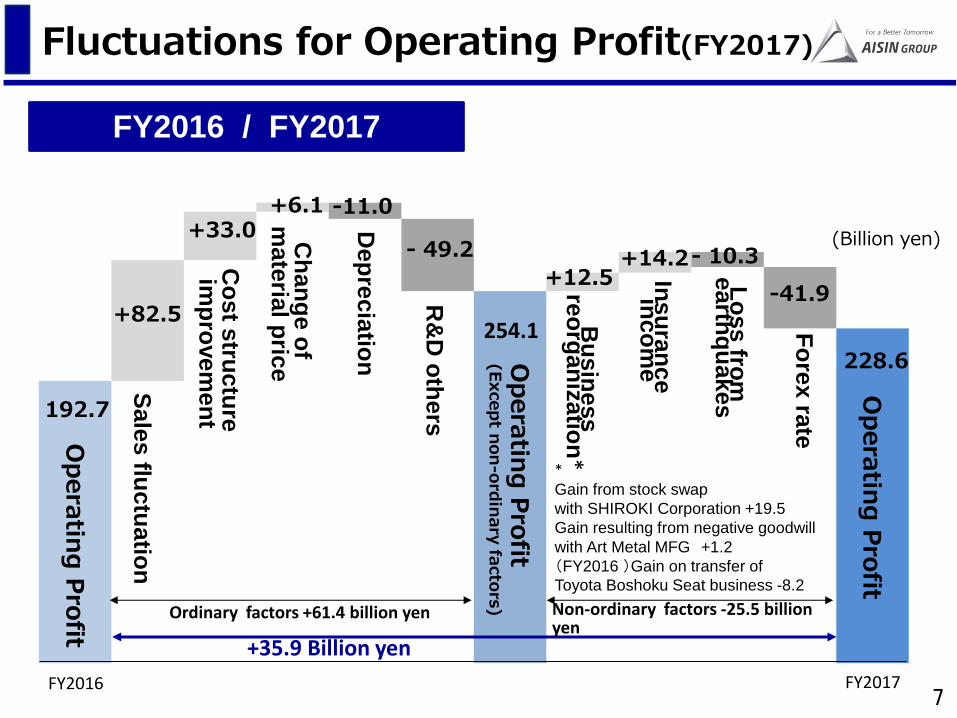
Operating Profit (+ 35.9)
(Billion yen)
Op
era
ting
Pro
fit
Sale
s flu
ctu
atio
n
192.7
+82.5
+33.0 +6.1
+12.5 +14.2
-41.9
-11.0
- 49.2 - 10.3 Co
st s
tructu
re
imp
rove
me
nt
Ch
an
ge o
f m
ate
rial p
rice
Bu
sin
ess
reo
rgan
izatio
n*
Insu
ran
ce
inco
me
Fo
rex ra
te
Dep
recia
tion
R&
D o
thers
Lo
ss fro
m
earth
qu
akes
FY2016 FY2017
FY2016 / FY2017
228.6
+35.9 Billion yen
254.1
Non-ordinary factors -25.5 billion yen
* Gain from stock swap
with SHIROKI Corporation +19.5
Gain resulting from negative goodwill
with Art Metal MFG +1.2
(FY2016 )Gain on transfer of
Toyota Boshoku Seat business -8.2
7
Fluctuations for Operating Profit(FY2017)
Op
era
ting
Pro
fit (E
xcep
t non
-ord
inary
facto
rs)
Op
era
ting
Pro
fit
(Billion yen)
Ordinary factors +61.4 billion yen

FY2017 (Forecast in Feb)
FY2017(Feb 2nd Forecast) / FY2017(Result)
228.6
8
Sale
s flu
ctu
atio
n
etc
Ch
an
ge o
f m
ate
rial p
rice
R&
D o
thers
Dep
recia
tion
Lo
ss fro
m
earth
qu
akes
+0.5 Fo
rex ra
te
+3.2
224.0 Bu
sin
ess
Reo
rgan
izatio
n*
+1.2
Insu
ran
ce
inco
me
-0.3
*Gain resulting from negative goodwill with Art Metal MFG +1.2
Fluctuations for Operating Profit(FY2017)
+23.6 Billion yen
FY2017 (Result)
Op
era
ting
Pro
fit (Resu
lt)
Op
era
ting
Pro
fit (F
ore
cast in
Feb
)
205.0
+15.5
+0.1 +2.9 +0.5
(Billion yen)
Op
era
ting
Pro
fit (E
xcep
t Non
-ord
inary
facto
rs)
Ordinary factors +19.0 billion yen Non-ordinary factors +4.6 billion yen

2.Consolidated Operating Forecast (FY2018)
9

FY2017 FY2018 change
Results Rate to sales %
Forecast Rate to sales % Amount %
Revenue 3,562.6 - 3,670.0 - +107.4 +3.0
Operating Profit 228.6 6.4 230.0 6.3 +1.4 +0.6
Profit before income taxes
237.3 6.7 244.0 6.6 +6.7 +2.8
Profit for the period *
126.6 3.6 116.0 3.2 -10.6 -8.4
EPS 444.46
yen - 415.27
yen - -29.19
yen -6.6
FX Rate USD 109 yen USD 105 yen -4 yen -3.7
CNY 16.1 yen CNY 16.0 yen -0.1 yen -0.6
Toyota production (10,000 Unit)
909 889 -20 -2.2
AT sales (10,000 Unit)
869 980 +111 +12.7
10
Consolidated Operating Forecast (FY2018)
(Billion yen)
Pre
-conditio
ns
* Profit for the period attributable to Owners of the parent

279.1 274.3
148.1 206.2
93.9 120.6 80.1
95.4 94.1
93.0 79.1
88.3 71.0
86.8 75.2
72.2 69.2
68.3 51.3
49.9 258.9
273.0
0
200
400
600
800
1,000
1,200
1,400
1,600
FY2017 FY2018
VW&Audi
MITSUBISHI
PSA
BMW
VOLVO
NISSAN
GM
SUZUKI
A/M & Others +14.1
FY2017 Revenue
FY2018 Revenue (+ 107.4)
Other Manufacturers sales
breakdown
1,300.0
1,428.0
-4.8
+58.1
+26.7
+15.3
-1.1
+9.2
+15.8
-0.9
-1.4
-3.0
HONDA
+128.0
11
Forecast of Sales by Customer(FY2018)
3,562.6
3,670.0
Life & others
121.3 (3.4%)
Other Manufacturers
1,300.0 (36.5%)
Toyota Group
2,141.2 (60.1%)
Other Manufacturers 1,428.0 (38.9%)
Life & others
132.0 (3.6%)
Toyota Group
2,110.0 (57.5%)
(Billion yen)
(Billion yen)
(Billion yen)
Chinese
OEMs Total
2,073.1
568.0
309.9 360.7
250.6
2,202.0
538.0
295.0
368.0
267.0
0
200
400
600
800
1,000
1,200
1,400
1,600
1,800
2,000
2,200
2,400
JAPAN North America Europe China Asia & Others
FY2017 FY2018
138.8
22.5
4.5
56.4
7.8
139.2
11.3
3.5
57.8
18.2
0
30
60
90
120
150
Japan North America Europe China Asia & Others
FY2017 FY2018
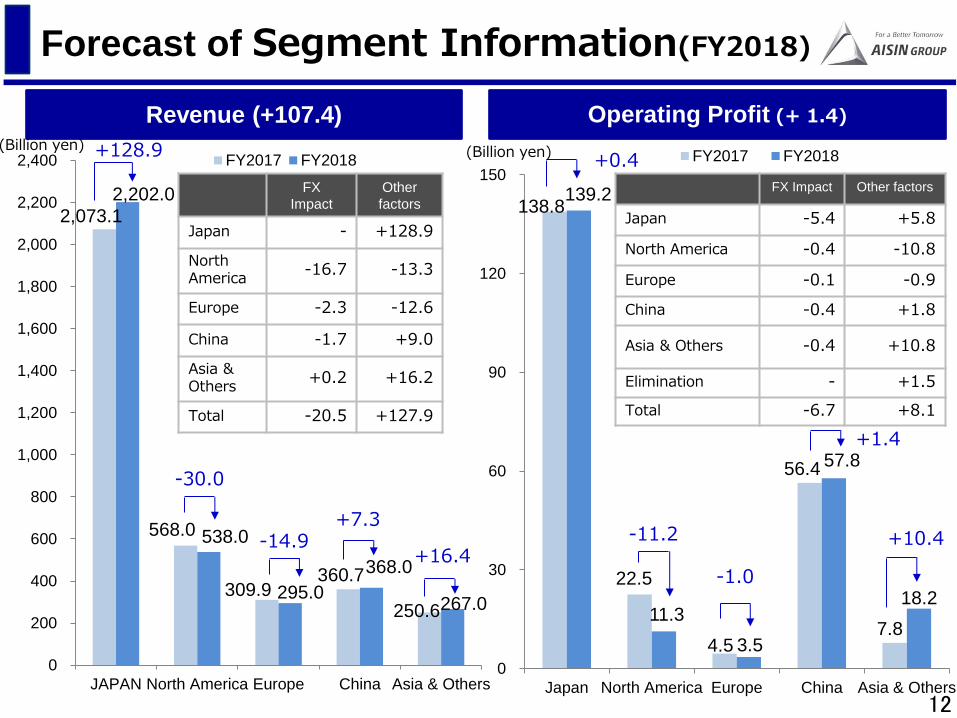
Revenue (+107.4) Operating Profit (+ 1.4)
+128.9
-30.0
+7.3
+16.4
+0.4
-11.2
-1.0
+1.4
+10.4 -14.9
12
Forecast of Segment Information(FY2018)
FX
Impact
Other
factors
Japan - +128.9
North America
-16.7 -13.3
Europe -2.3 -12.6
China -1.7 +9.0
Asia & Others
+0.2 +16.2
Total -20.5 +127.9
FX Impact Other factors
Japan -5.4 +5.8
North America -0.4 -10.8
Europe -0.1 -0.9
China -0.4 +1.8
Asia & Others -0.4 +10.8
Elimination - +1.5
Total -6.7 +8.1
(Billion yen) (Billion yen)

Sale
s flu
ctu
atio
n
Op
era
ting
Pro
fit
Co
st s
tructu
re
imp
rovem
en
t
Ch
an
ge o
f m
ate
rial p
rice
Bu
sin
ess
reo
rgan
izatio
n*
Insu
ran
ce
inco
me
Fo
rex ra
te
Dep
recia
tion
R&
D o
the
rs
Lo
ss fro
m
earth
qu
akes
FY2017
FY2017 / FY2018
230.0
Non- ordinary factors -31.3 billion yen
228.6
+23.0
+33.0 -25.0
-22.9 +24.6 -20.7 -14.2 +10.3 -6.7
FY2018 (forecast)
261.3
13
Forecast of Fluctuations for Operating Profit(FY2018)
Op
era
ting
Pro
fit (F
ore
cast)
Op
era
ting
Pro
fit (E
xcep
t Non
- ord
inary
facto
rs)
* (Fy2017)Gain from stock swap with SHIROKI Corporation -19.5 (FY2017)Gain resulting from negative goodwill with Art Metal MFG -1.2
+1.4Billion yen
(Billion yen)
Ordinary factors +32.7 billion yen

3.Reference information
14

Capital Expenditure/Depreciation/ R&D Expenditure
107.2 105.5 102.8
135.5
78.8
123.2
72.3
81.0
25.8
23.7
39.7
22.0
FY2015 FY2016 FY2017 FY2018
69.0 81.1 82.2 90.1
55.0 60.9 68.5
78.0 8.8
12.1 15.3
18.1
FY2015 FY2016 FY2017 FY2018
67.0 68.9 72.0 74.0
55.4 65.8 69.2
78.0
19.0 19.3 18.0
20.0
FY2015 FY2016 FY2017 FY2018
Others
ADS-G
AISIN AW-G
AISIN SEIKI-G
167.7
(5.0%)
237.4
294.1
247.8
197.1 186.1
161.0 162.6 149.1
Capital Expenditure Depreciation R&D Expenditure
(5.0%)
(): Rate to sales
15
260.0
220.0
180.0
(Billion yen)
(Forecast) (Forecast) (Forecast)
(4.7%) (4.9%)

Toyota car production
76 74 73 74
80 80 83 78
75 80 76 79
82 80 81 83
FY2015 FY2016 FY2017 FY2018
4Q
3Q
2Q
1Q
Toyota Domestic production
313 314 313
147 146 153 143
151 152 148 145
148 140 151 149
140 135 144 138
FY2015 FY2016 FY2017 FY2018
223 220 226 217
231 232 231 223
223 220 227 228
222 215 225 221
FY2015 FY2016 FY2017 FY2018
596 573 586
899 887 909
(10,000 Unit)
16
314
575
889
Toyota Oversea production
Toyota global production
(Forecast) (Forecast) (Forecast)

Sales number
30 31 44 29 29
45 31 38
43 34 46
46
0
50
100
150
200
FY2015 FY2016 FY2017 FY2018
AT sales
168 180 204
172 172 207 176 194
224 171 191
234
0
200
400
600
800
1,000
FY2015 FY2016 FY2017 FY2018
Navigation System sales
MT sales
36 37 42
35 41 39
36 43 45 37
39 39
0
50
100
150
200
FY2015 FY2016 FY2017 FY2018
Navigation Soft sales
869 737
687
165 160 144
178
144 124
15 15 16
15 19 14
15 13 12
15 14 13
0
20
40
60
80
FY2015 FY2016 FY2017 FY2018
55 61 60 55
17
980
165
(10,000 Unit)
(10,000 Unit)
(10,000 Unit)
(10,000 Unit)
Yearly
(Forecast)
160
(Forecast)
(Forecast)
(Forecast)

Foreign Currency Exchange Rate
138 132
119 115
110 120
109 105
70
95
120
145
EUR
USD
Foreign Exchange Rate
18.0 18.8 16.1 16.0
3.4 3.4 3.1 3.1
0.05.0
10.015.020.025.0
FY2015 FY2016 FY2017 FY2018
CNY
THB
Impacts on
Operating Profit
FY2015 FY2016 FY2017 FY2018(Forecast)
USD 1.46 1.27 1.34 1.19
EUR 0.14 0.13 0.17 0.16
THB * 0.74 0.80 0.81 1.09
CNY * 0.26 0.54 0.79 0.83
(yen)
18
(Forecast)
* Impacts of THB and CNY are per 0.1yen.
Forex Impact on Operating
profit per 1(or 0.1) yen (Billion yen)

0
30
60
90
120
150
180
0
30
60
90
120
150
3.4%
4.7% 4.9%
3.9%
0
500
1,000
1,500
2,000
Revenue Operating Profit Operating Profit Rate
8.0% 7.9% 8.6% 8.8%
0
600
1,200
1,800
Revenue Operating Profit Operating Profit Rate
AISIN SEIKI Group
AISIN AW Group
1,402.5 1,503.0
1,641.9
48.1 70.8 80.5
1,127.2 1,276.6
89.7 101.0 122.9
FY2015 FY2016 FY2017 FY2018(Forecast)
1,657.0
64.5
1,431.1 1,550.0
137.0
19
Financial Results of the Main Consolidated Companies Ⅰ * The results of FY2015 are based on JGAAP and the result of
FY2016 and the forecast FY2017 are based on IFRS.
(Billion yen)
(Billion yen)
FY2015 FY2016 FY2017 FY2018(Forecast)

0
3
5
8
10
2.1%
0.0%
1.0%
3.5%
0
50
100
150
200
Revenue Operating Profit Operating Profit Rate
0
10
20
304.3%
3.2%
4.5% 4.3%
0
100
200
300
400
Revenue Operating Profit Operating Profit RateAISIN Takaoka Group
AISIN AI Group
11.2 8.8 11.6
126.4 133.9
137.8
4.8
2.6 0 1.3
263.8 275.9 273.0
20
12.3
273.7
136.3
Financial Results of the Main Consolidated Companies Ⅱ
* The results of FY2015 are based on JGAAP and the result of
FY2016 and the forecast FY2017 are based on IFRS.
FY2015 FY2016 FY2017 FY2018(Forecast)
(Billion yen) (Billion yen)
FY2015 FY2016 FY2017 FY2018(Forecast)
(Billion yen) (Billion yen)
0
10
20
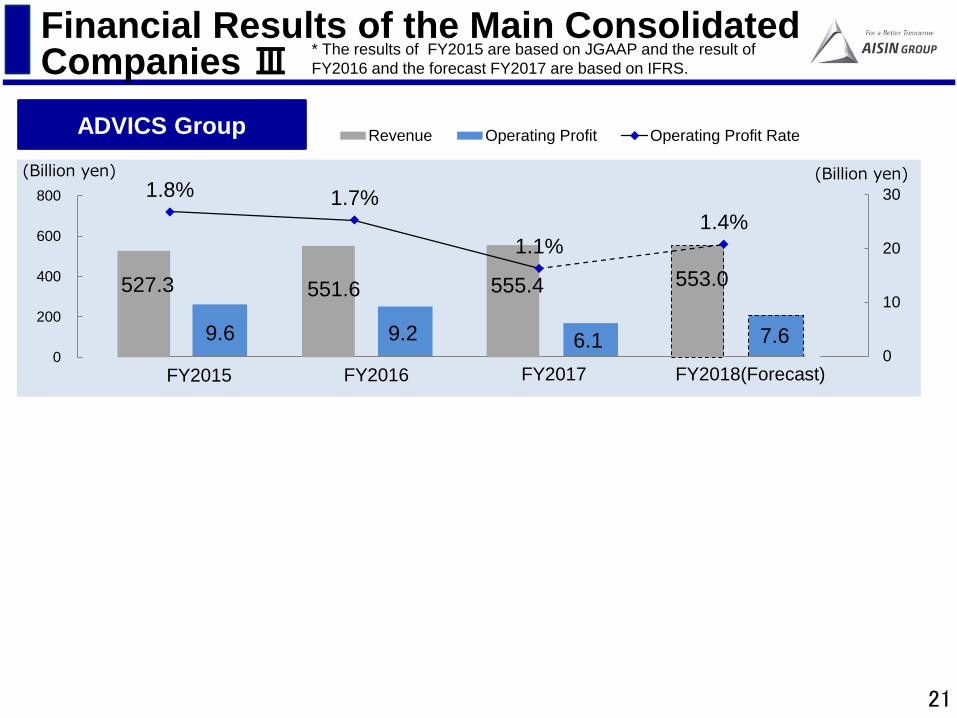
301.8% 1.7%
1.1% 1.4%
0
200
400
600
800
Revenue Operating Profit Operating Profit RateADVICS Group
21
527.3
9.6
551.6 555.4
9.2 6.1
553.0
7.6
Financial Results of the Main Consolidated Companies Ⅲ
* The results of FY2015 are based on JGAAP and the result of
FY2016 and the forecast FY2017 are based on IFRS.
(Billion yen) (Billion yen)
FY2015 FY2016 FY2017 FY2018(Forecast)

Quarterly Performance
699.5 687.4 714.8 720.3 707.0 727.8 756.4 773.2 771.2 792.2 843.5 838.9 838.6 858.8 907.5 957.5
224 224 226 227 223 231 223 222 220 232 220 215 226 231 227 225
0
50
100
150
200
250
0
200
400
600
800
1,000
1,200
1Q 2Q 3Q 4Q 1Q 2Q 3Q 4Q 1Q 2Q 3Q 4Q 1Q 2Q 3Q 4Q
Revenue Toyota global productionRevenue
Operating Profit
44.3 41.9 43.4 41.4 38.4 32.0
44.9 50.5
33.1 43.7
62.0 53.7 59.0
35.7
67.3 66.4
6.3% 6.1% 6.1% 5.8% 5.4%
4.4%
5.9% 6.5%
4.3%
5.5%
7.4%
6.4% 7.0%
4.2%
7.4% 6.9%
0.0%
2.0%
4.0%
6.0%
8.0%
0
30
60
90
120
1Q 2Q 3Q 4Q 1Q 2Q 3Q 4Q 1Q 2Q 3Q 4Q 1Q 2Q 3Q 4Q
Operating Profit Operating Profit Rate
22
* The results of before FY2015 are based on JGAAP and the result of FY2016 and the forecast FY2017 are based on IFRS.
(Billion yen)
FY2015 FY2016 FY2017 FY2014
FY2015 FY2016 FY2017 FY2014
(Billion yen)
(10,000 Unit)

25 35 45 50 50
50 60 50 50
75
125
27.3% 29.7%
34.6% 28.2% 28.1% 30.1%
0%
5%
10%
15%
20%
25%
30%
35%
0
50
100
150
200
FY2013 FY2014 FY2015 FY2016 FY2017 FY2018
Total
Year-end
Interim
Dividend payout ratio
(yen)
FY2013 FY2014 FY2015 FY2016 FY2017 FY2018
(Forecast)
Interim 25 35 45 50 50 -
Year-end 50 60 50 50 75 -
Total 75 95 95 100 125 125
Dividend Payout Ratio 27.3% 29.7% 34.6% 28.2% 28.1% 30.1%
Repurchase of Treasury
Stock (billion yen) 0 0 0 0 49.0 -
Total return Ratio* 27.3% 29.7% 34.6% 28.2% 66.5% -
75 95 95
100
125 125
23
Dividend per Share * The results of before FY2015 are based on JGAAP and the result of FY2016 and the forecast FY2017 are based on IFRS.
Div
ide
nd
(ye
n)
* Total return Ratio= (Cash dividend paid + repurchase of treasury Stock) / Profit for the period
(Forecast)